
Filtration Performance of Nonwoven Geotextile Filtering Fine-Grained Soil under Normal Compressive Stresses


Abstract
1. Introduction
2. Test Materials
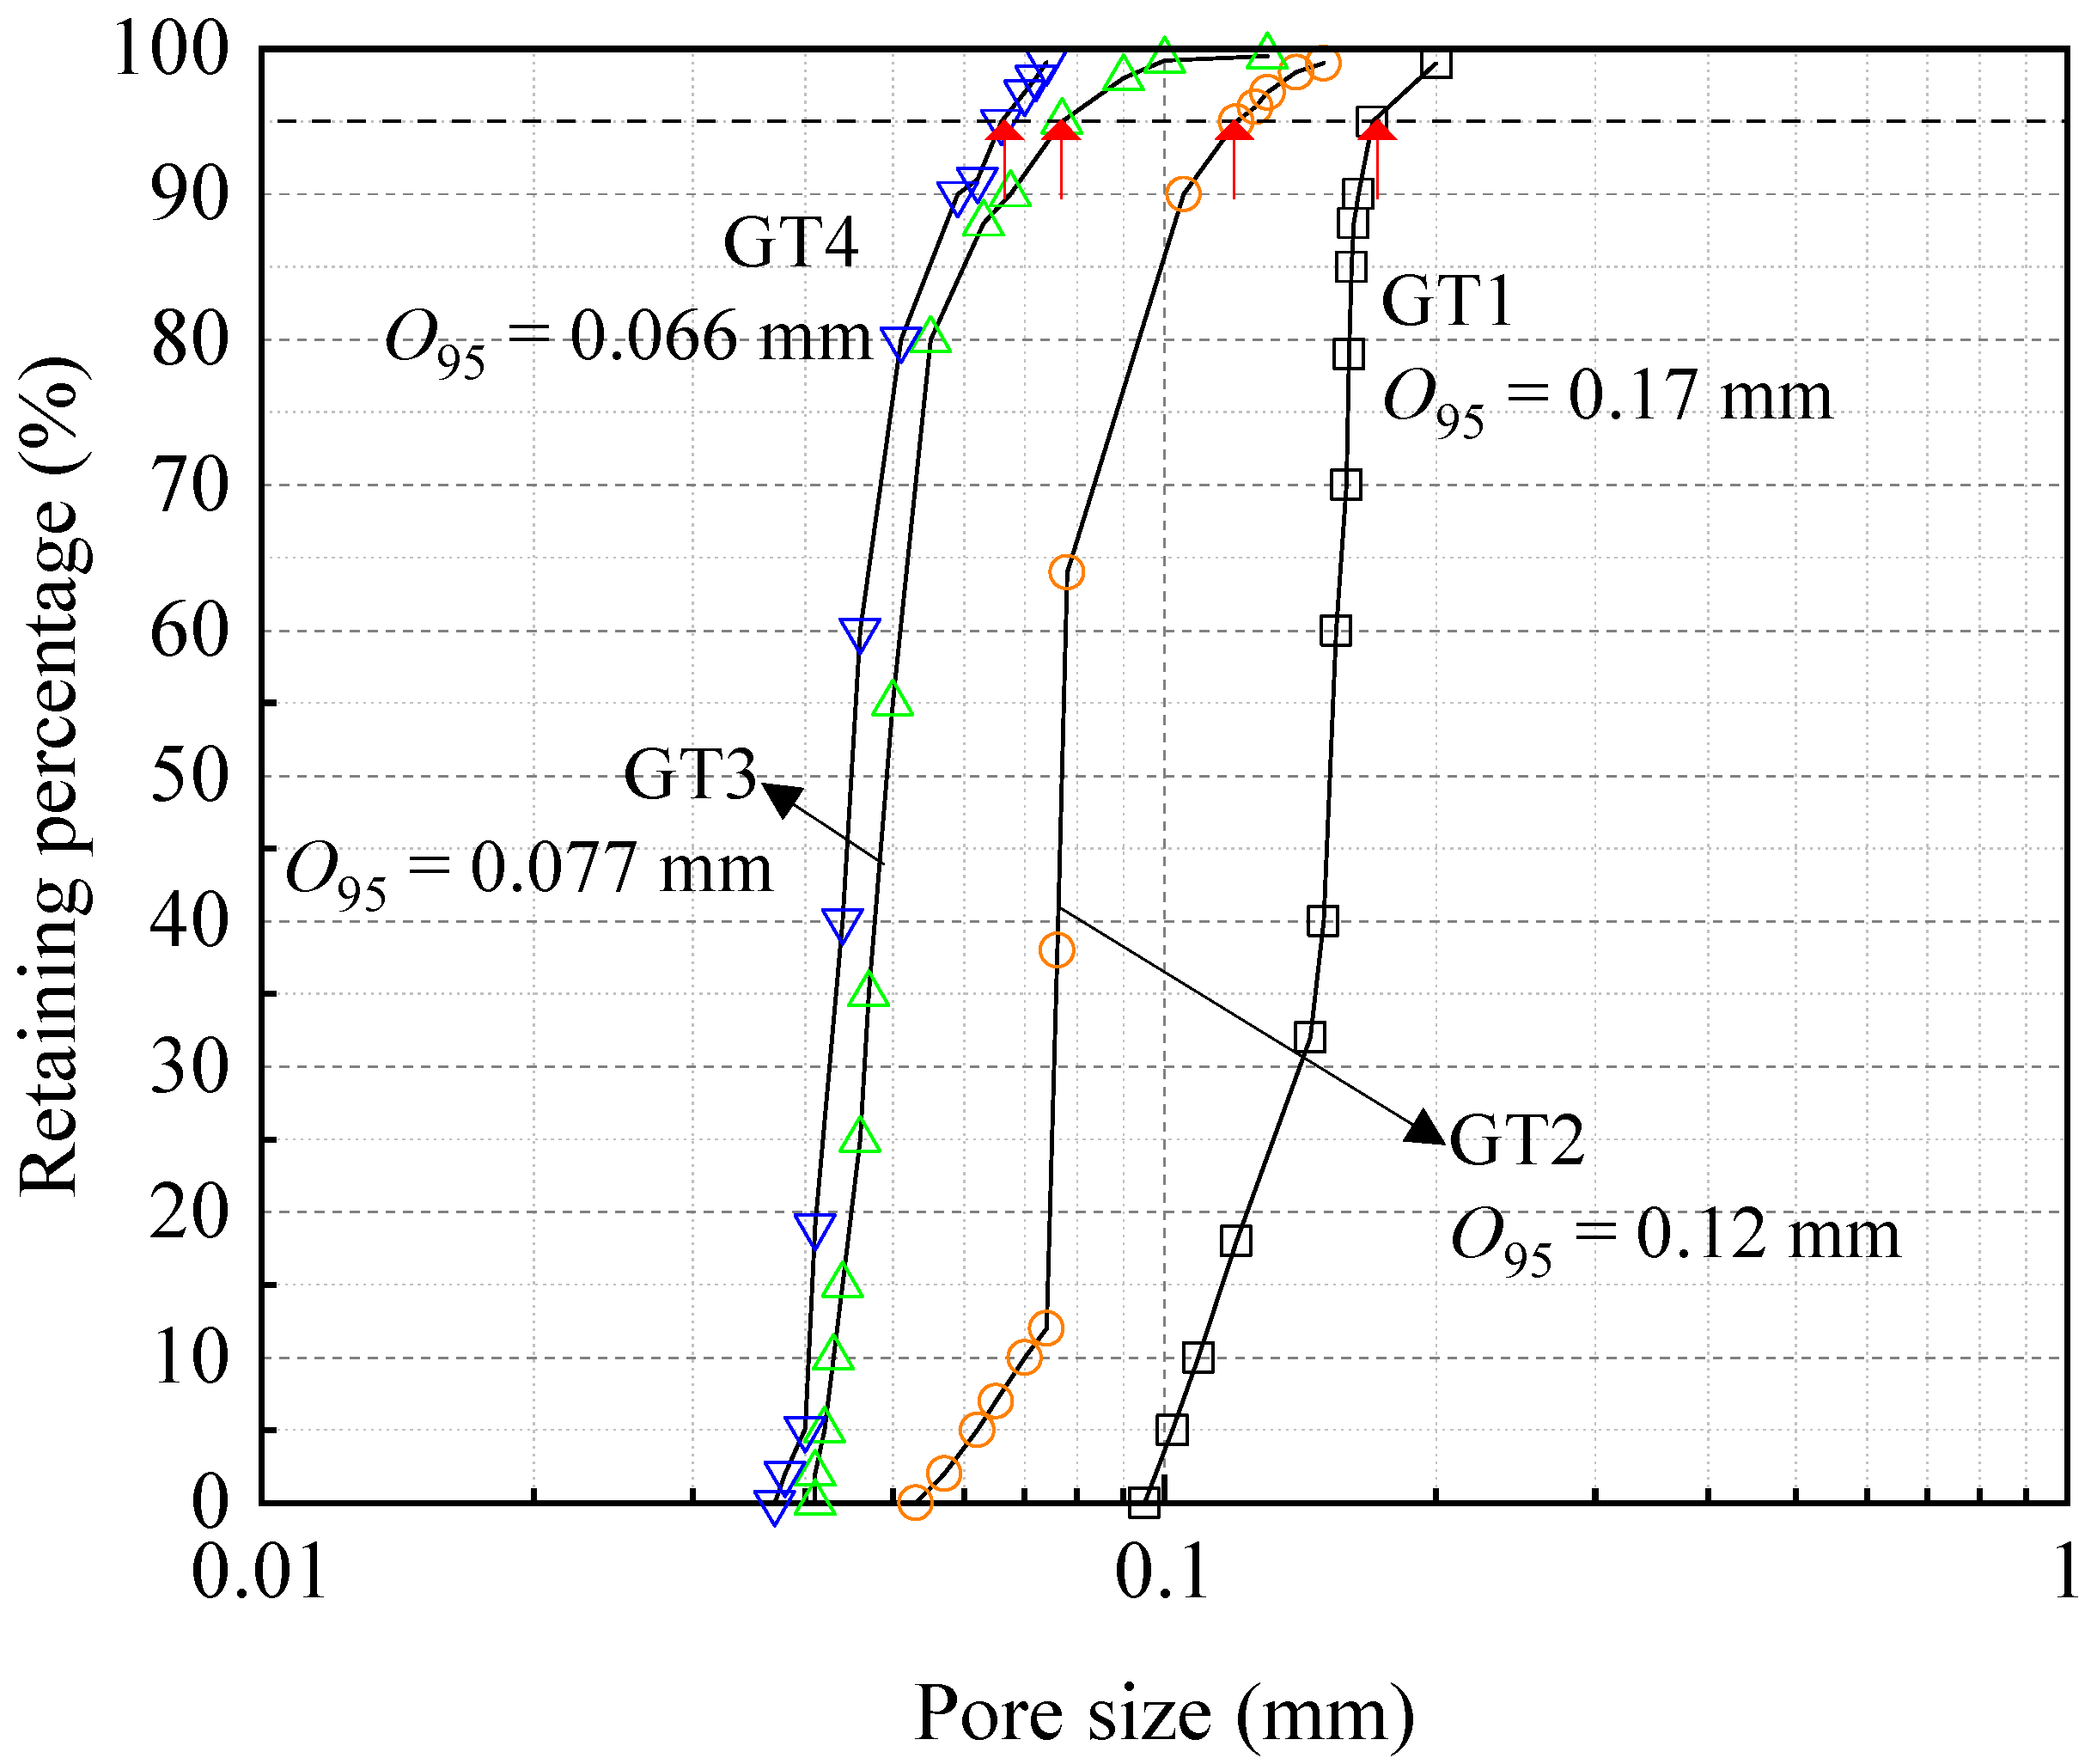
2.1. Geotextiles
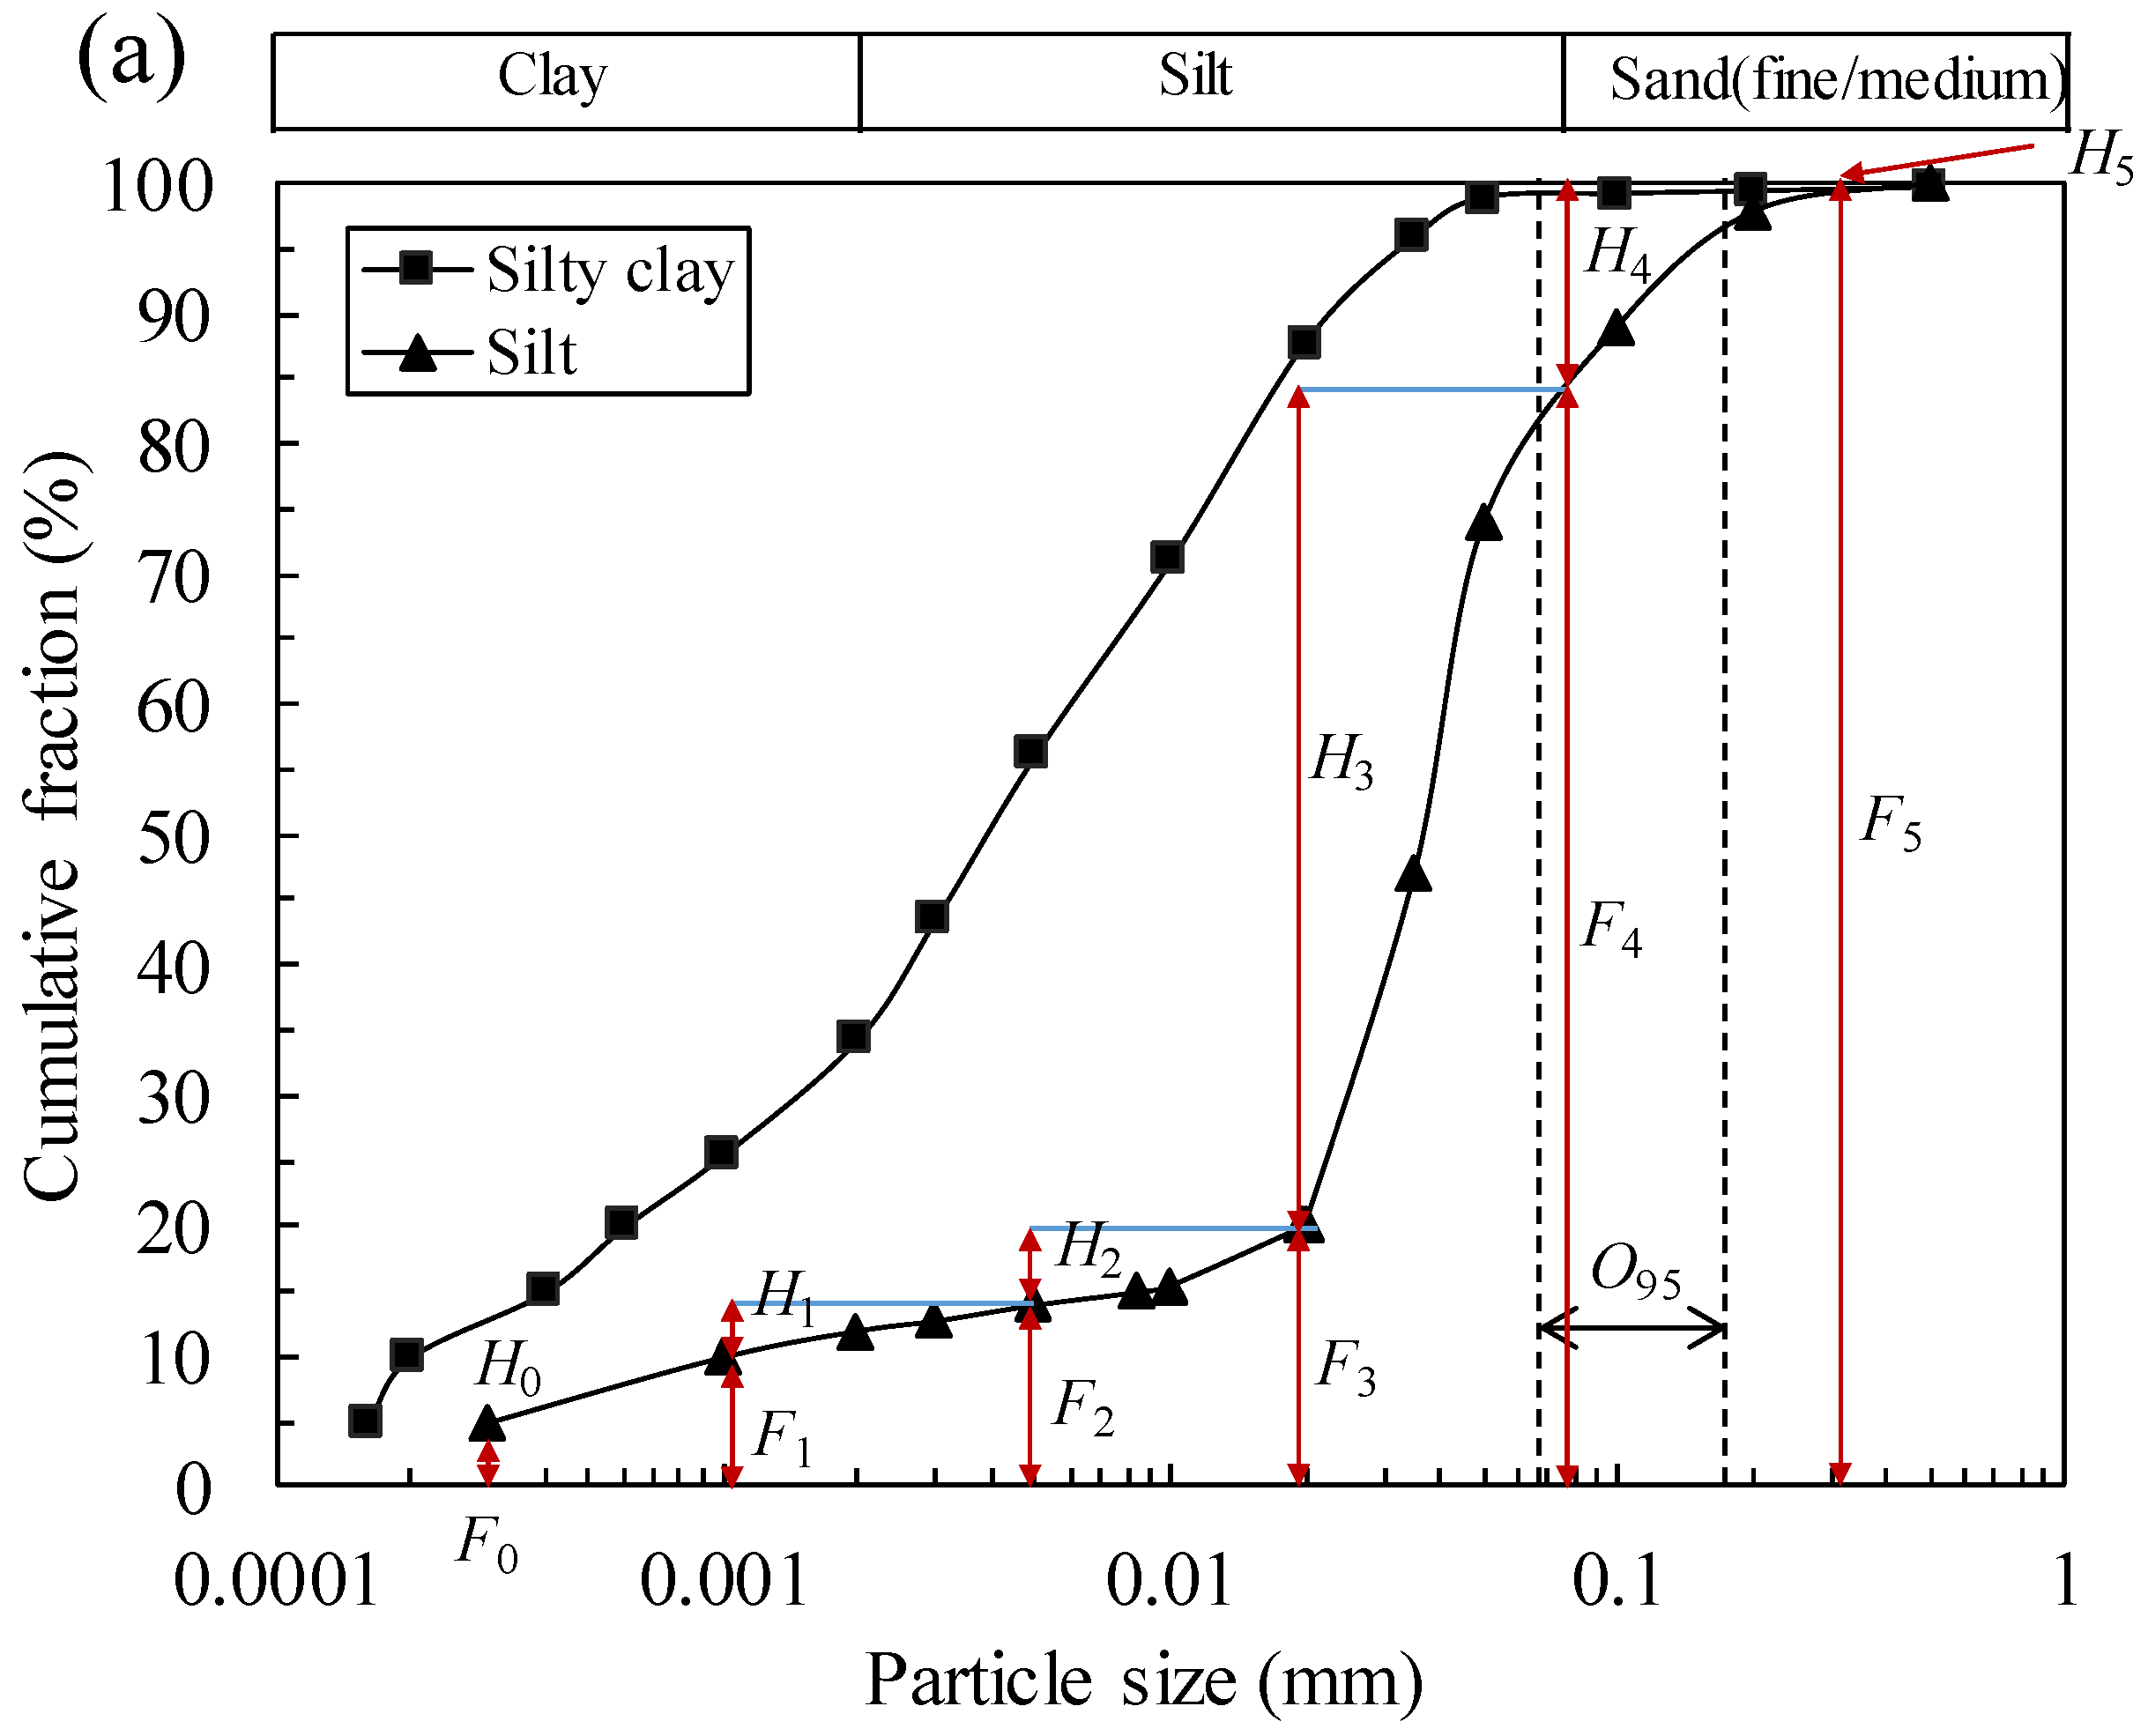
2.2. Soils
3. Test Preparation
3.1. Specimen Preparation
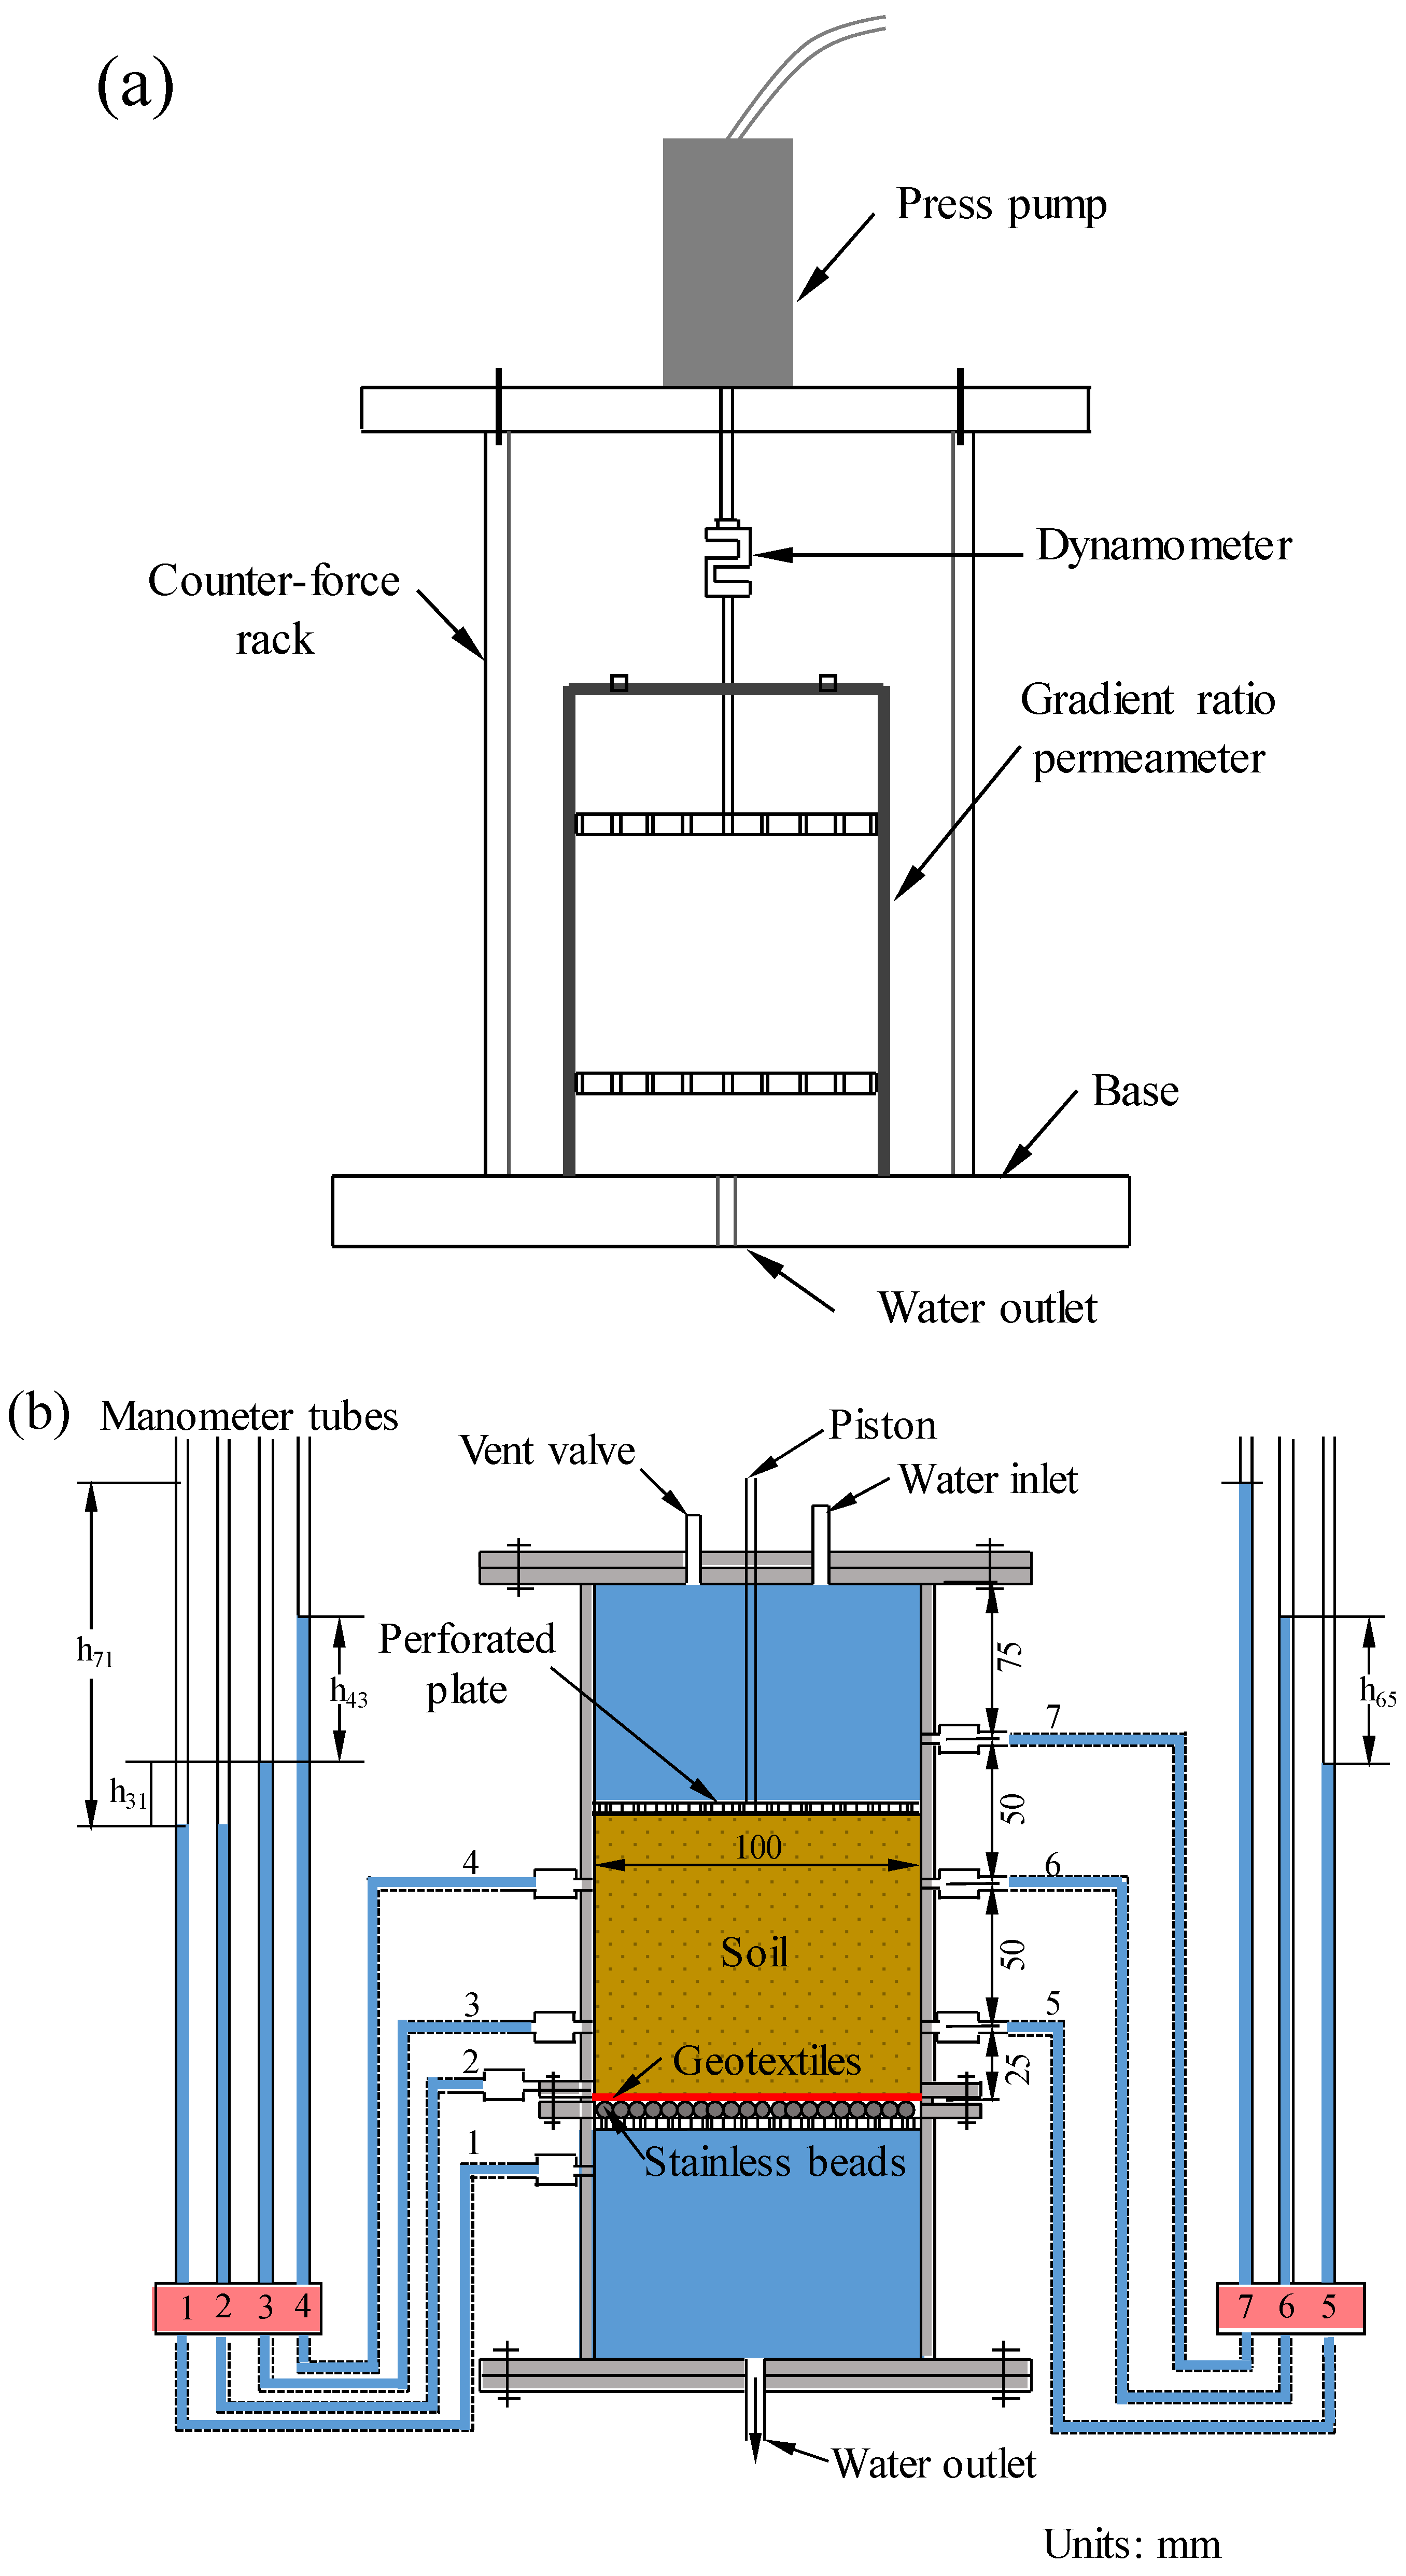
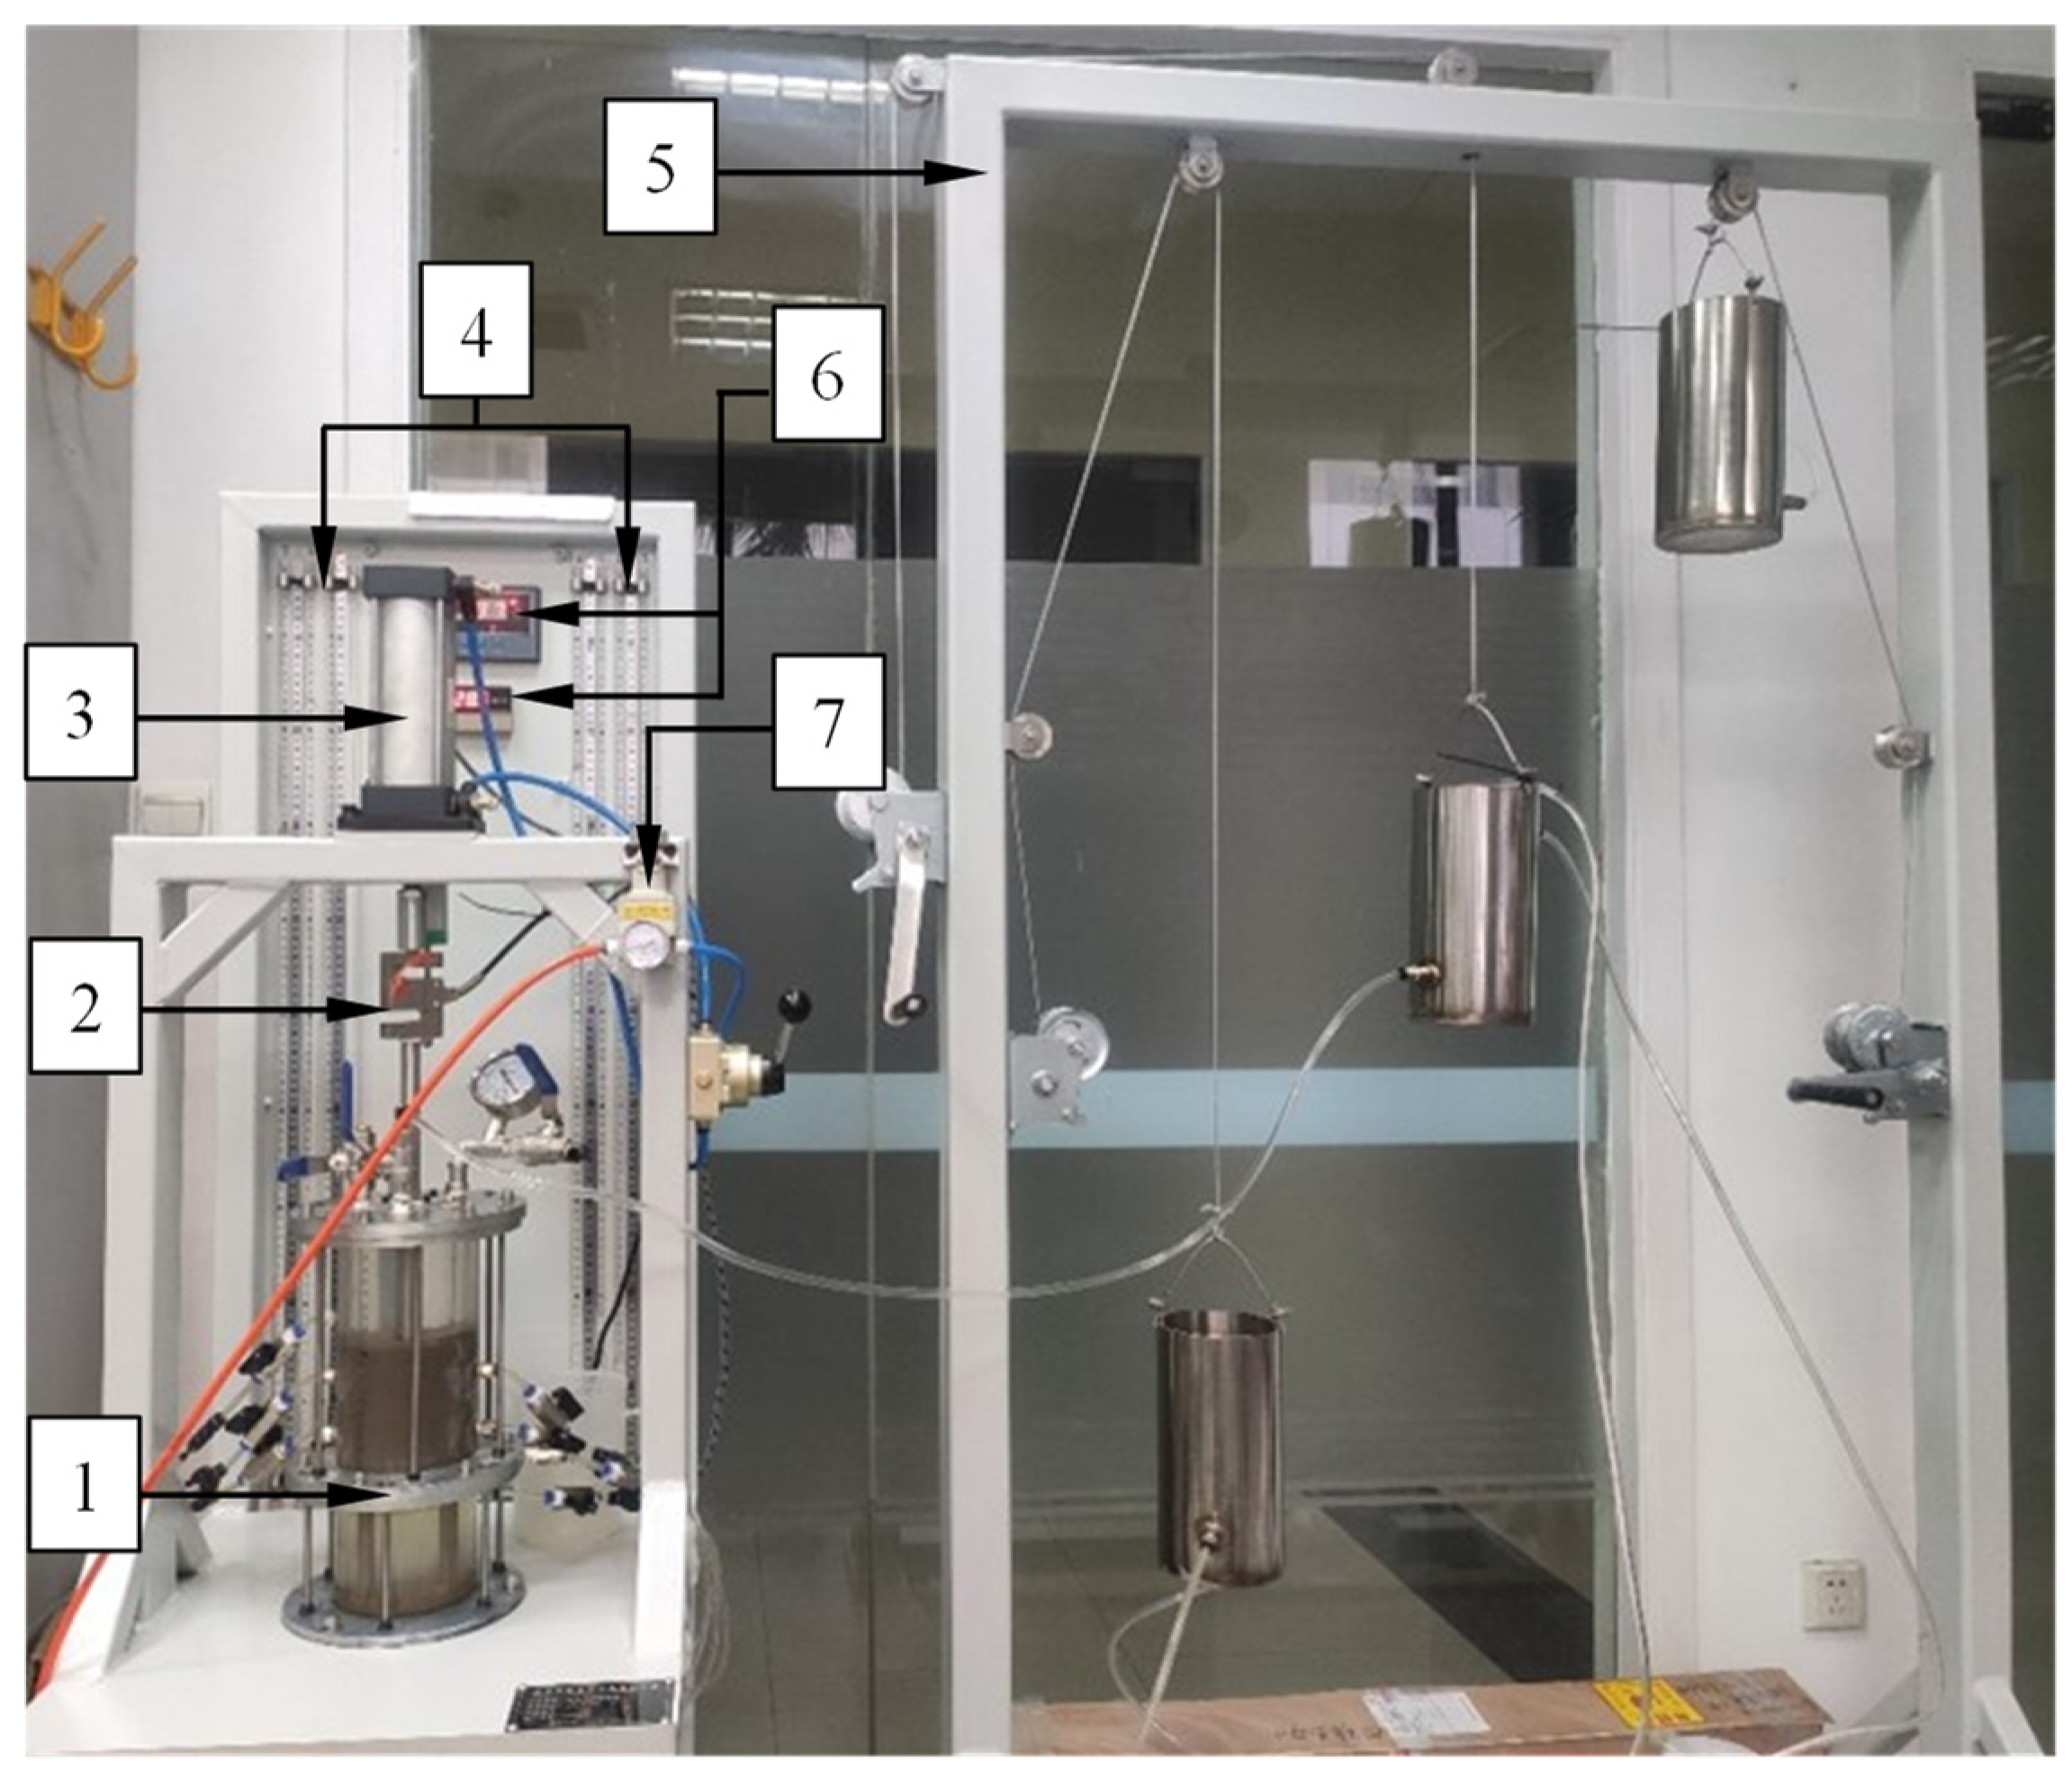
3.2. Apparatus
4. Test Program
4.1. Test Procedures
4.2. Test Parameters
4.3. Repeatability of the Tests
5. Test Results
5.1. Filtration Behavior of Silty Clay
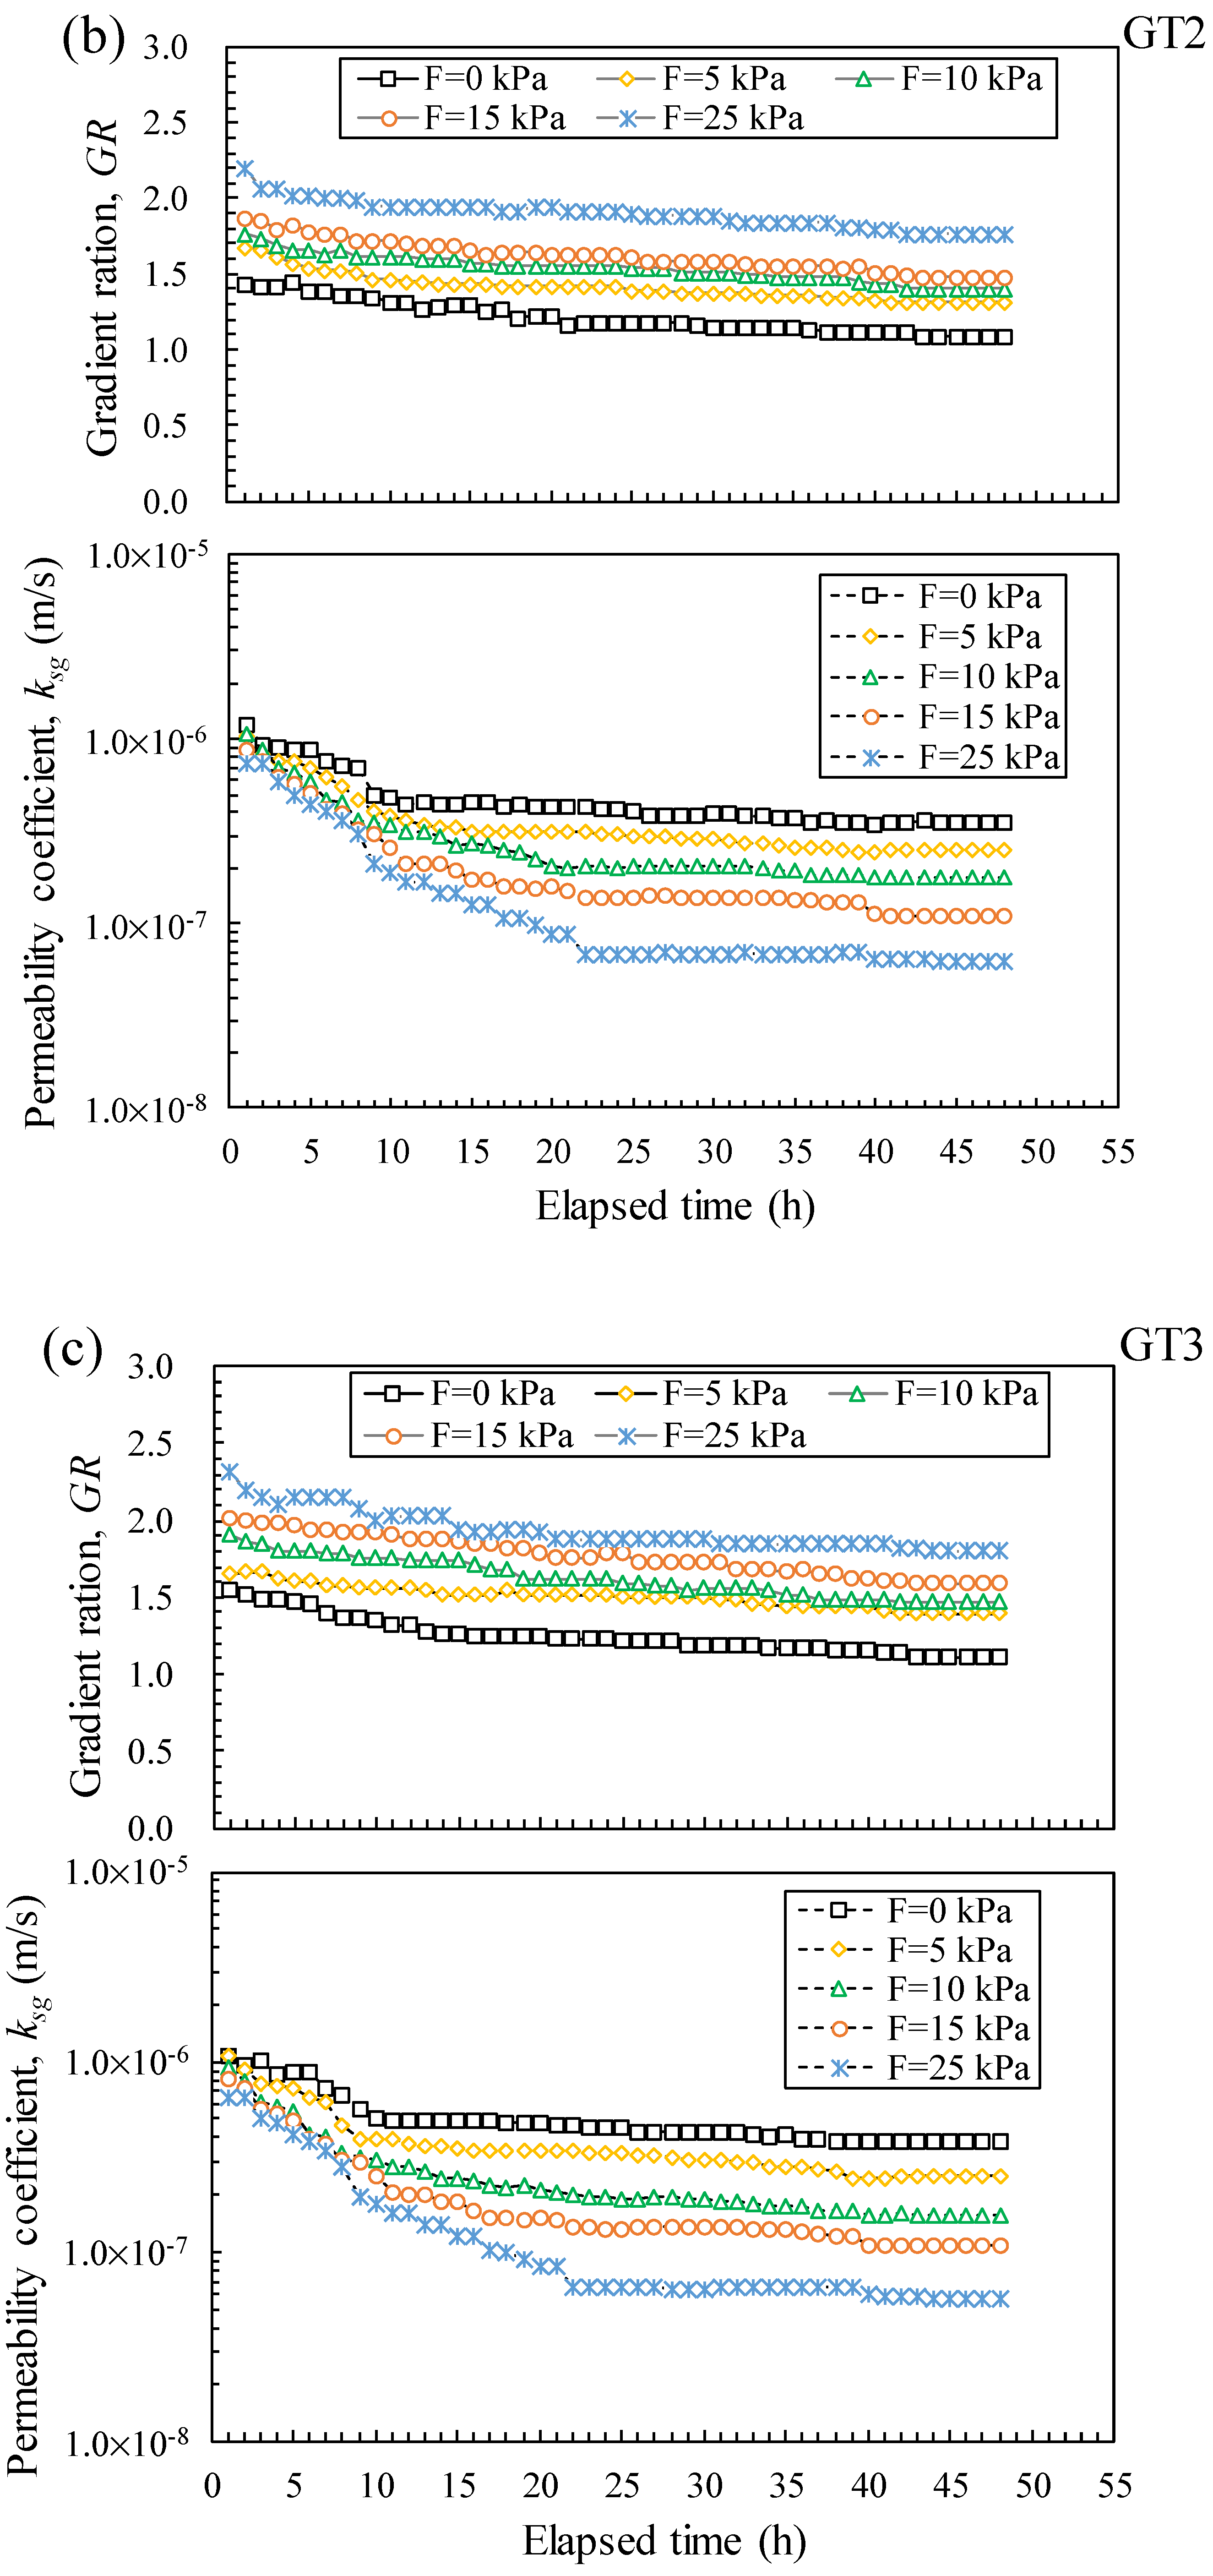
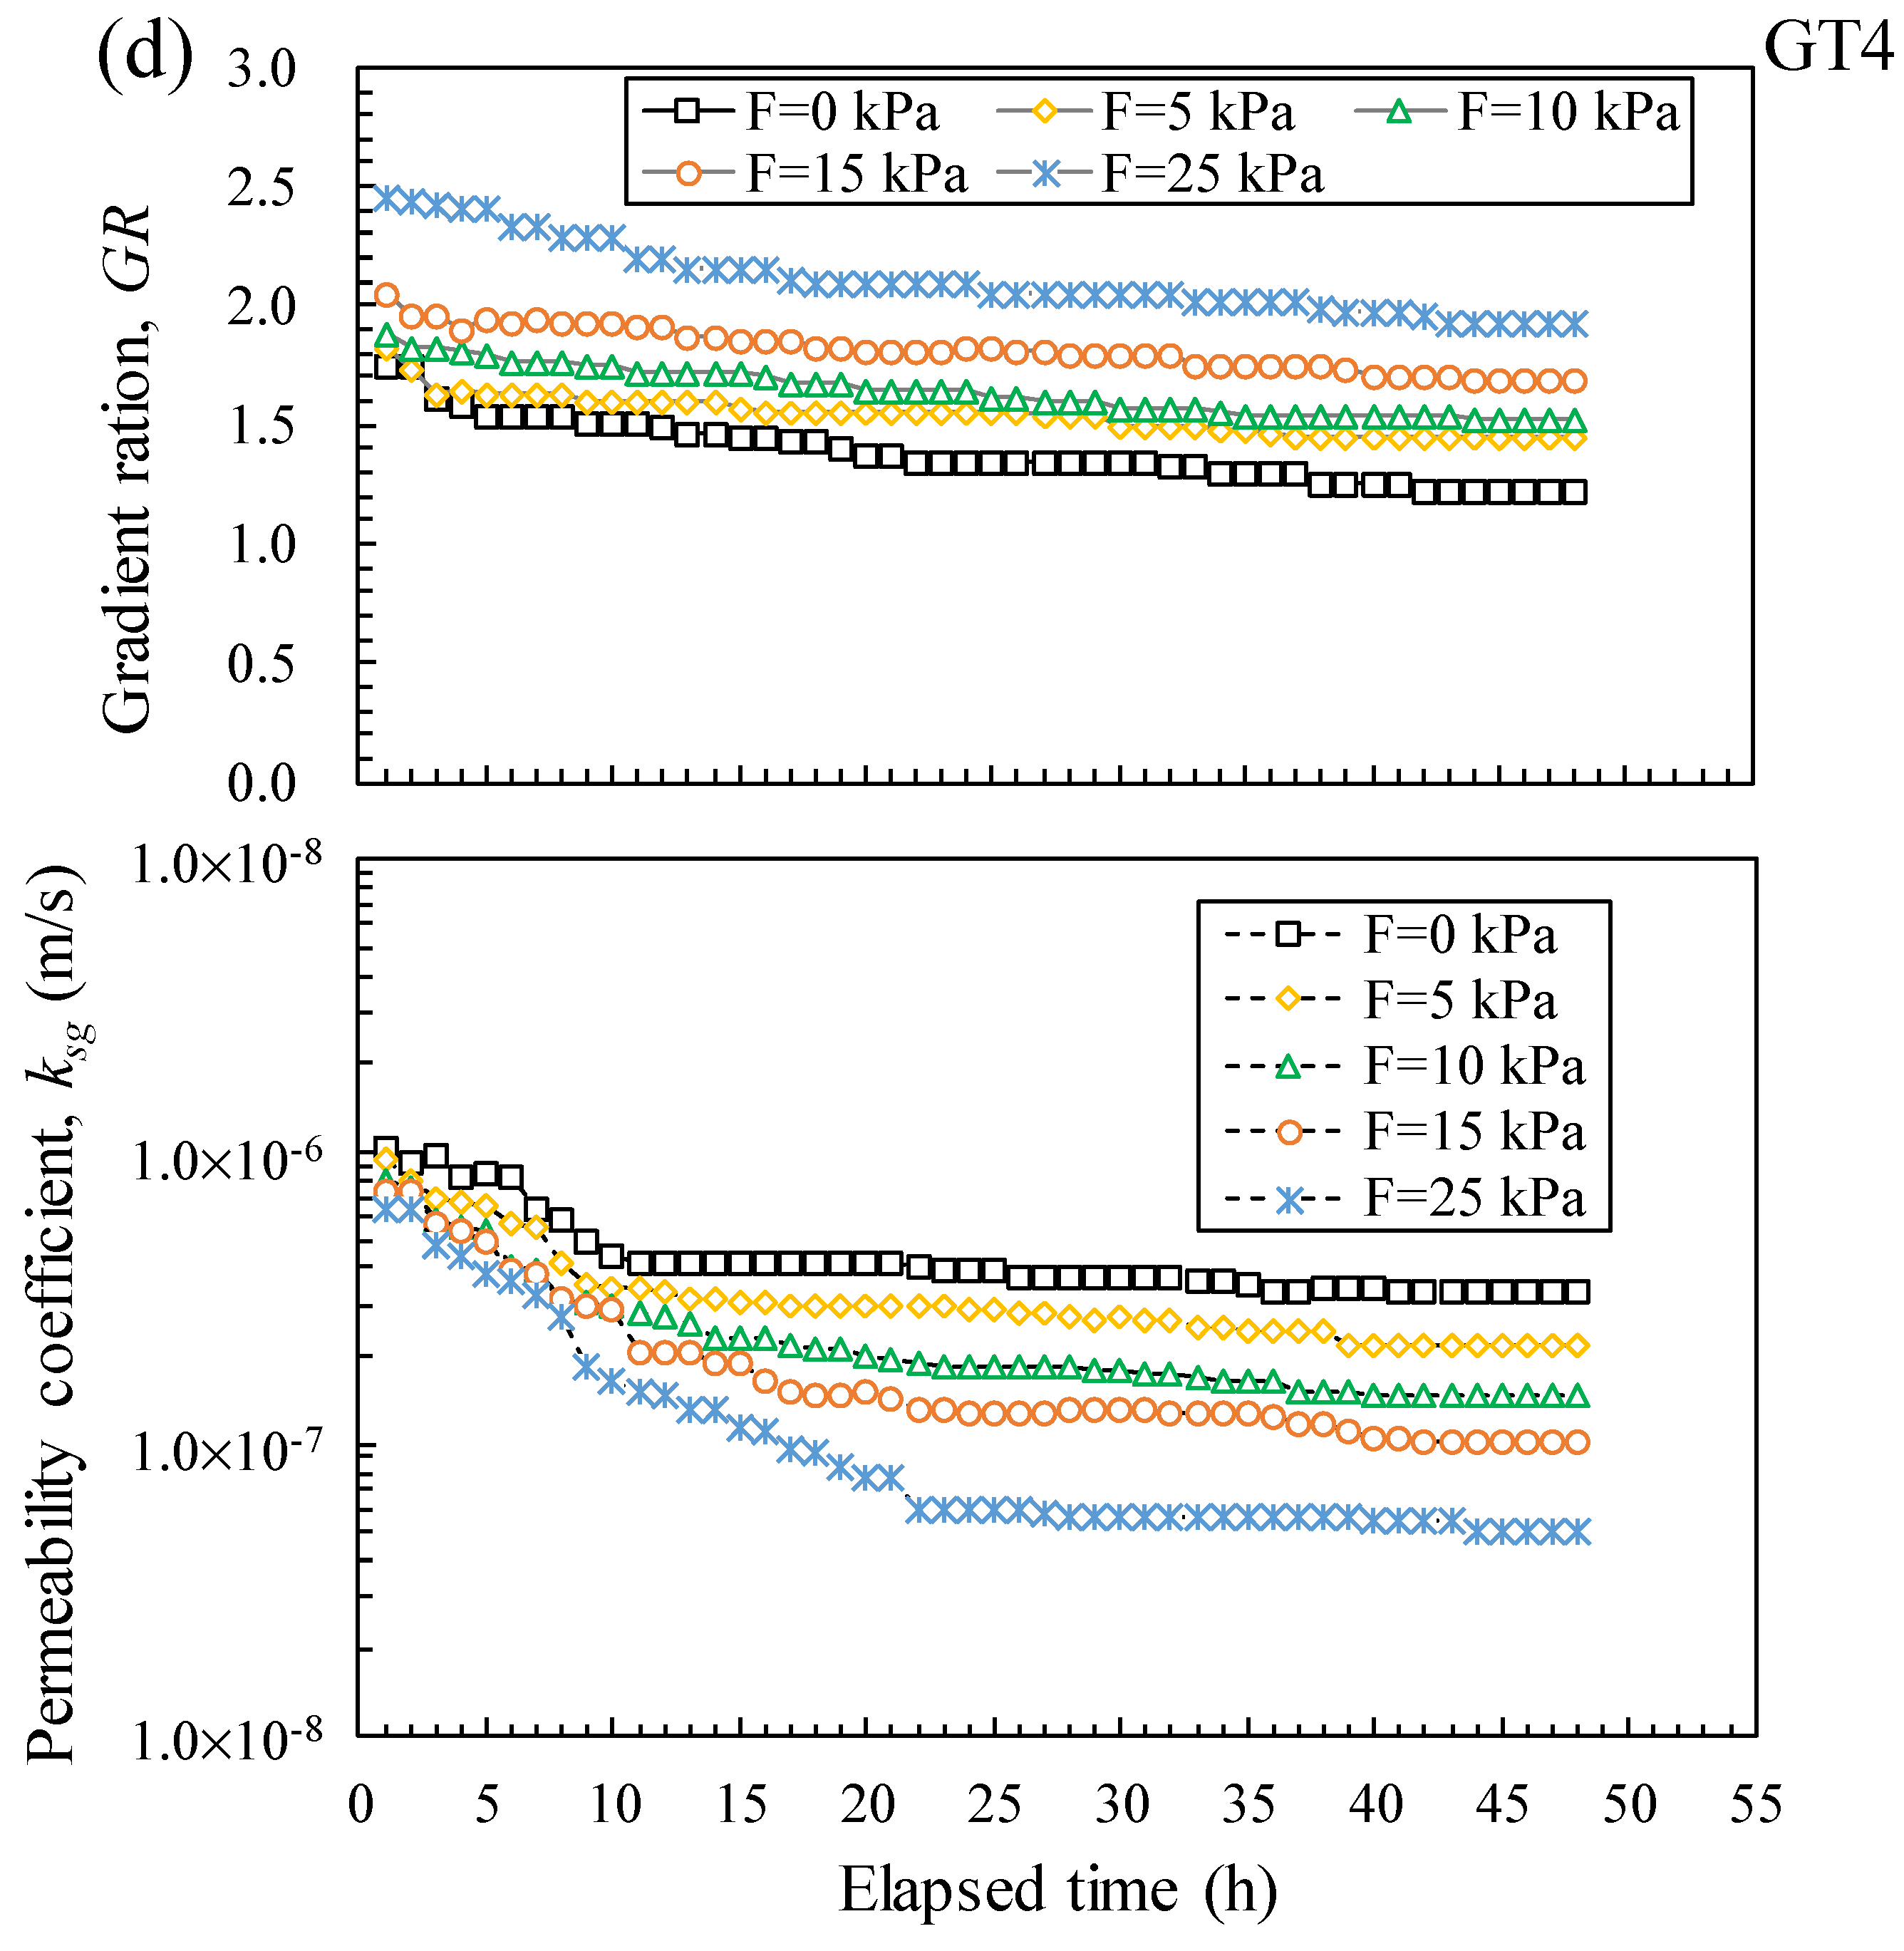
5.2. Filtration Behavior of Silt
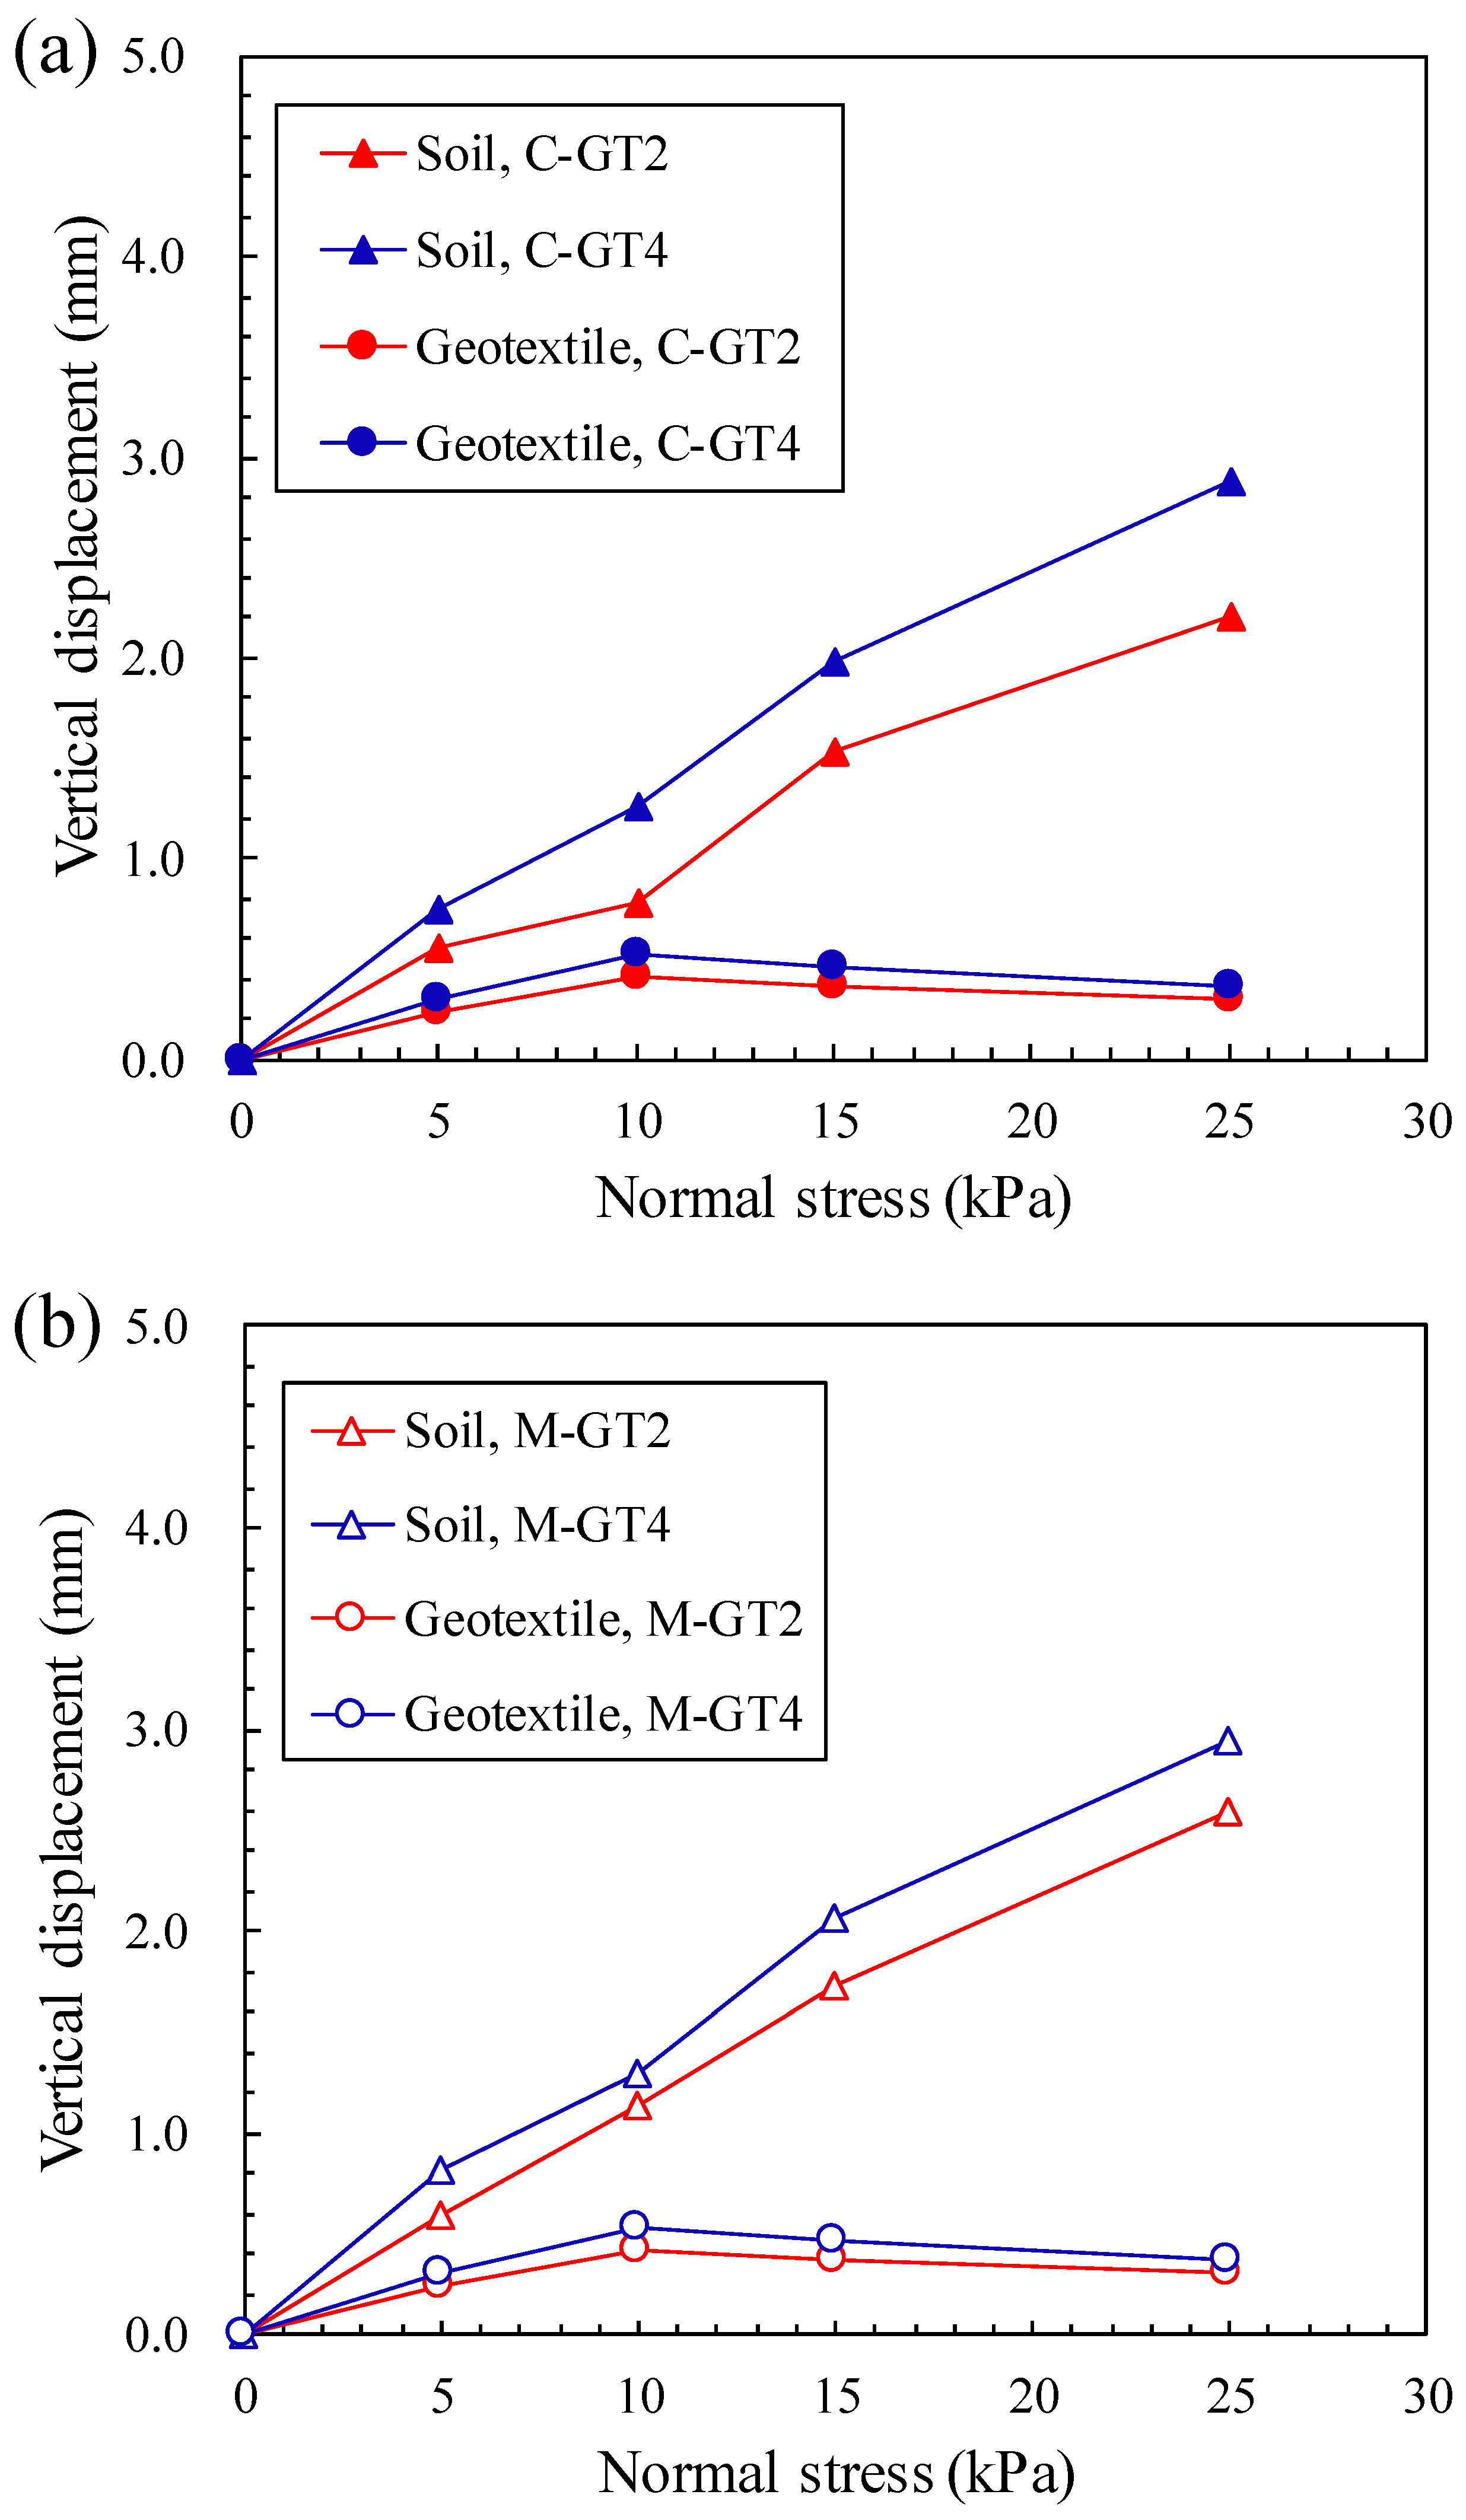
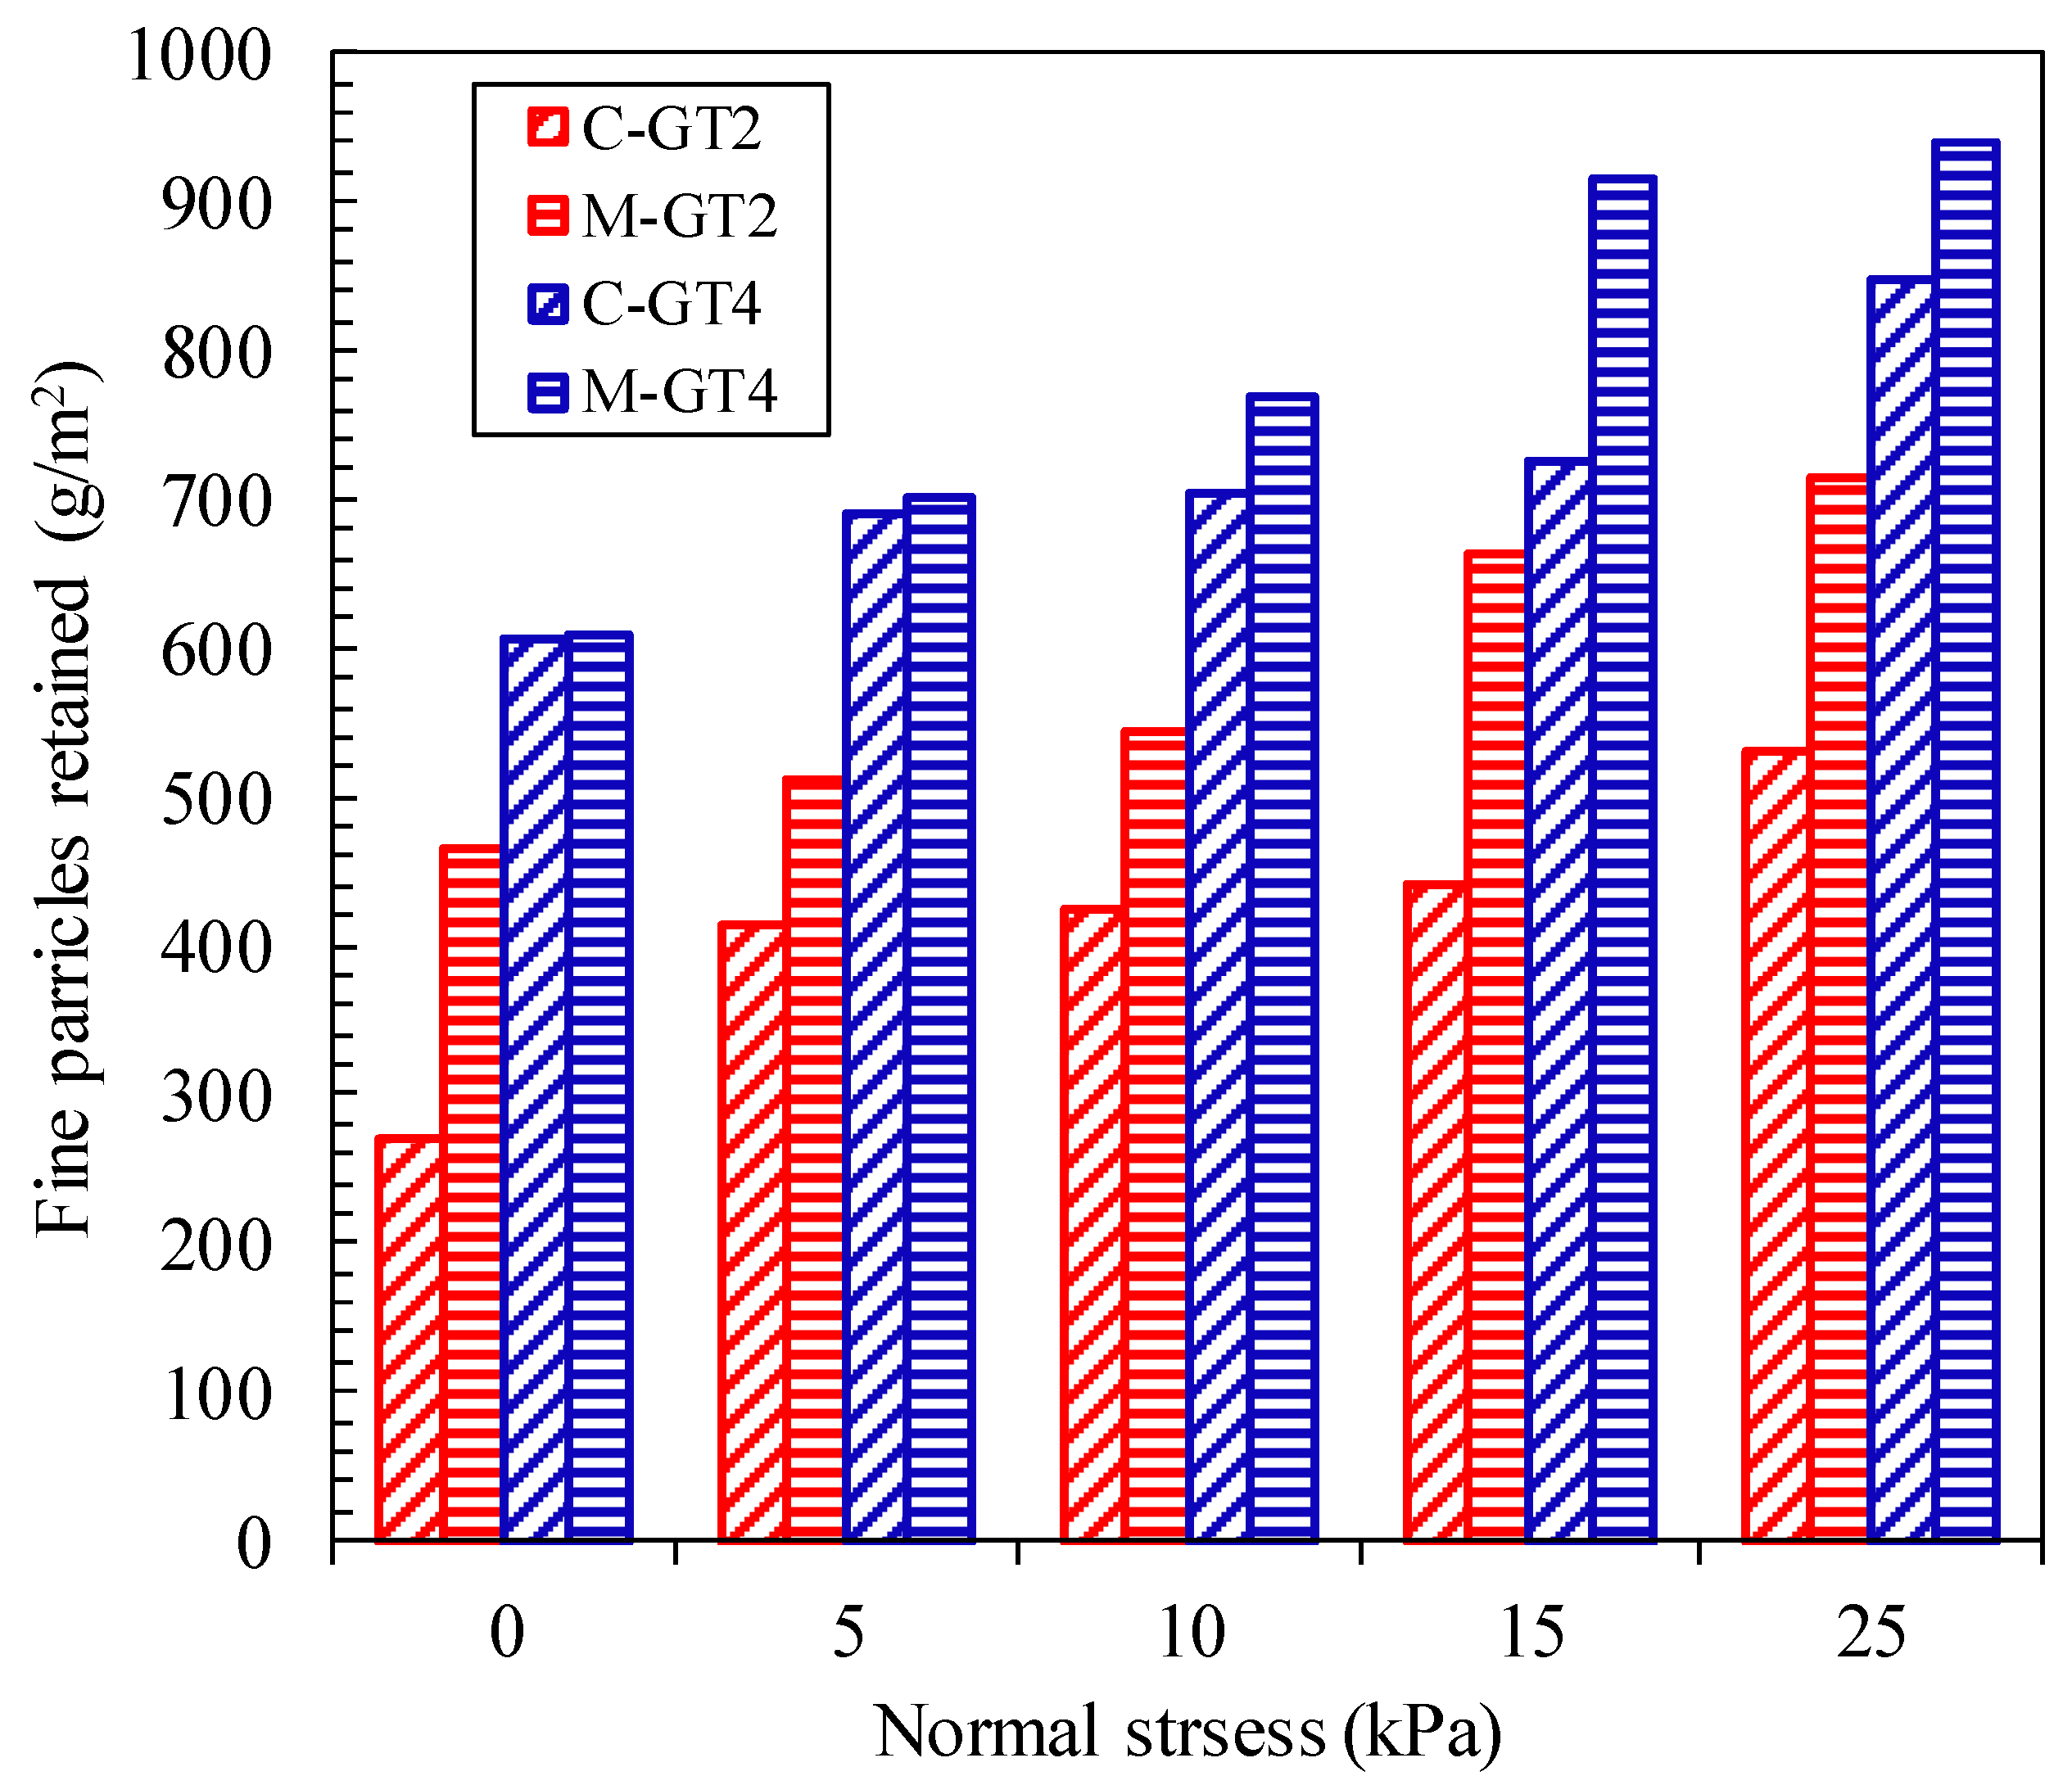
5.3. Displacement and Soil Retention
6. Discussion
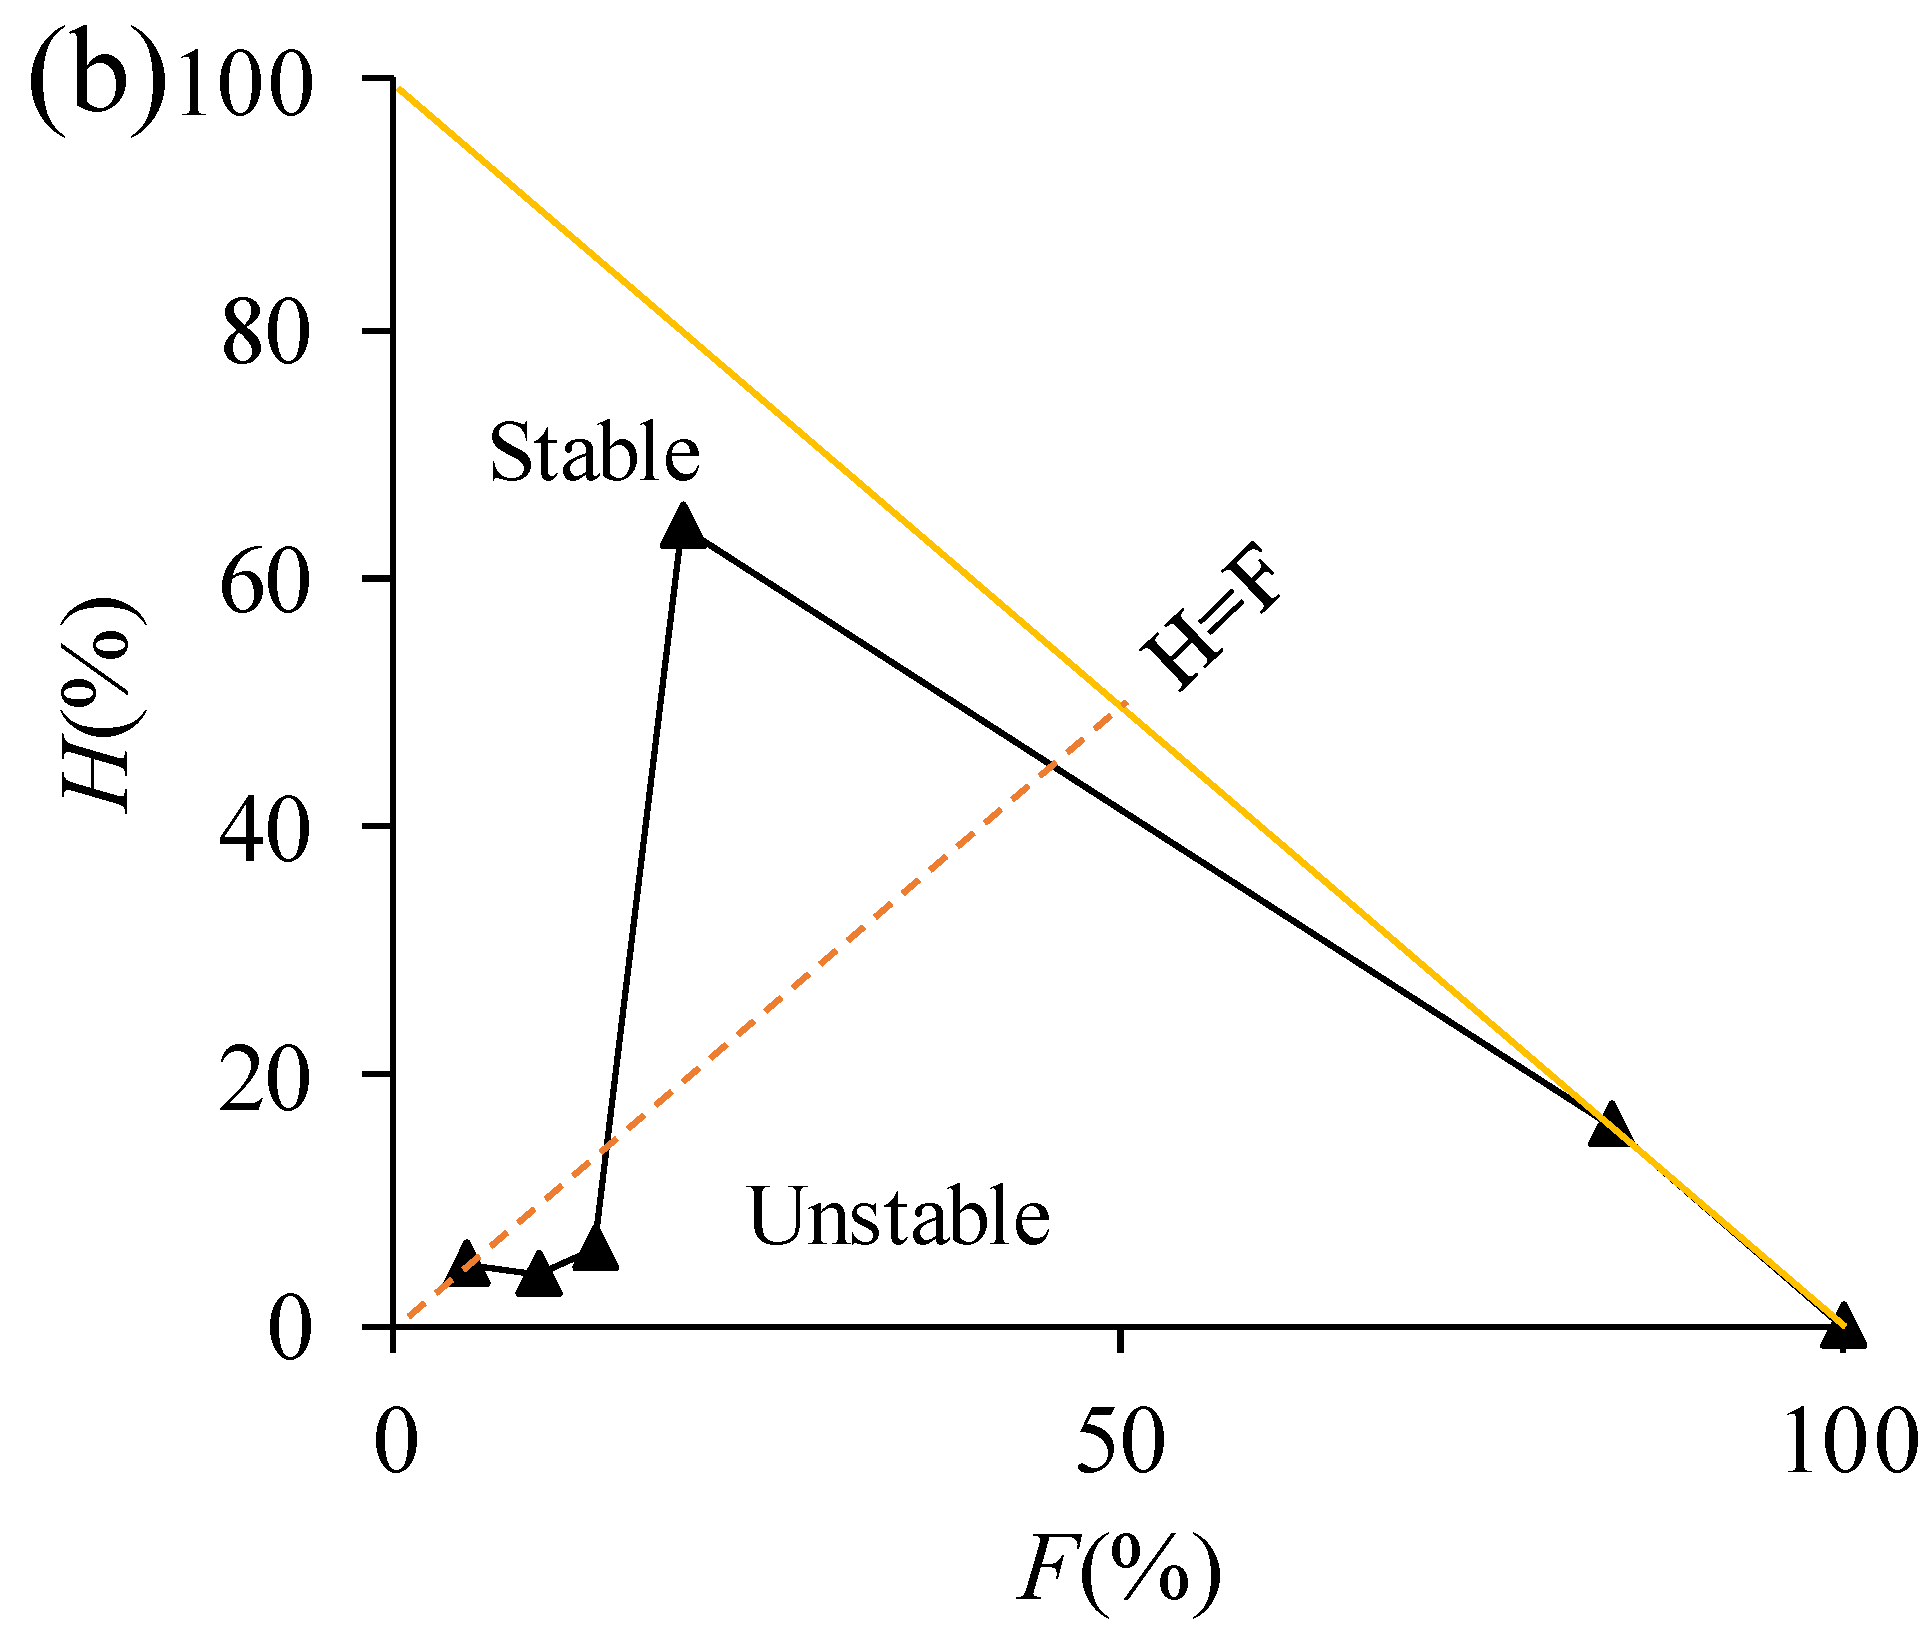
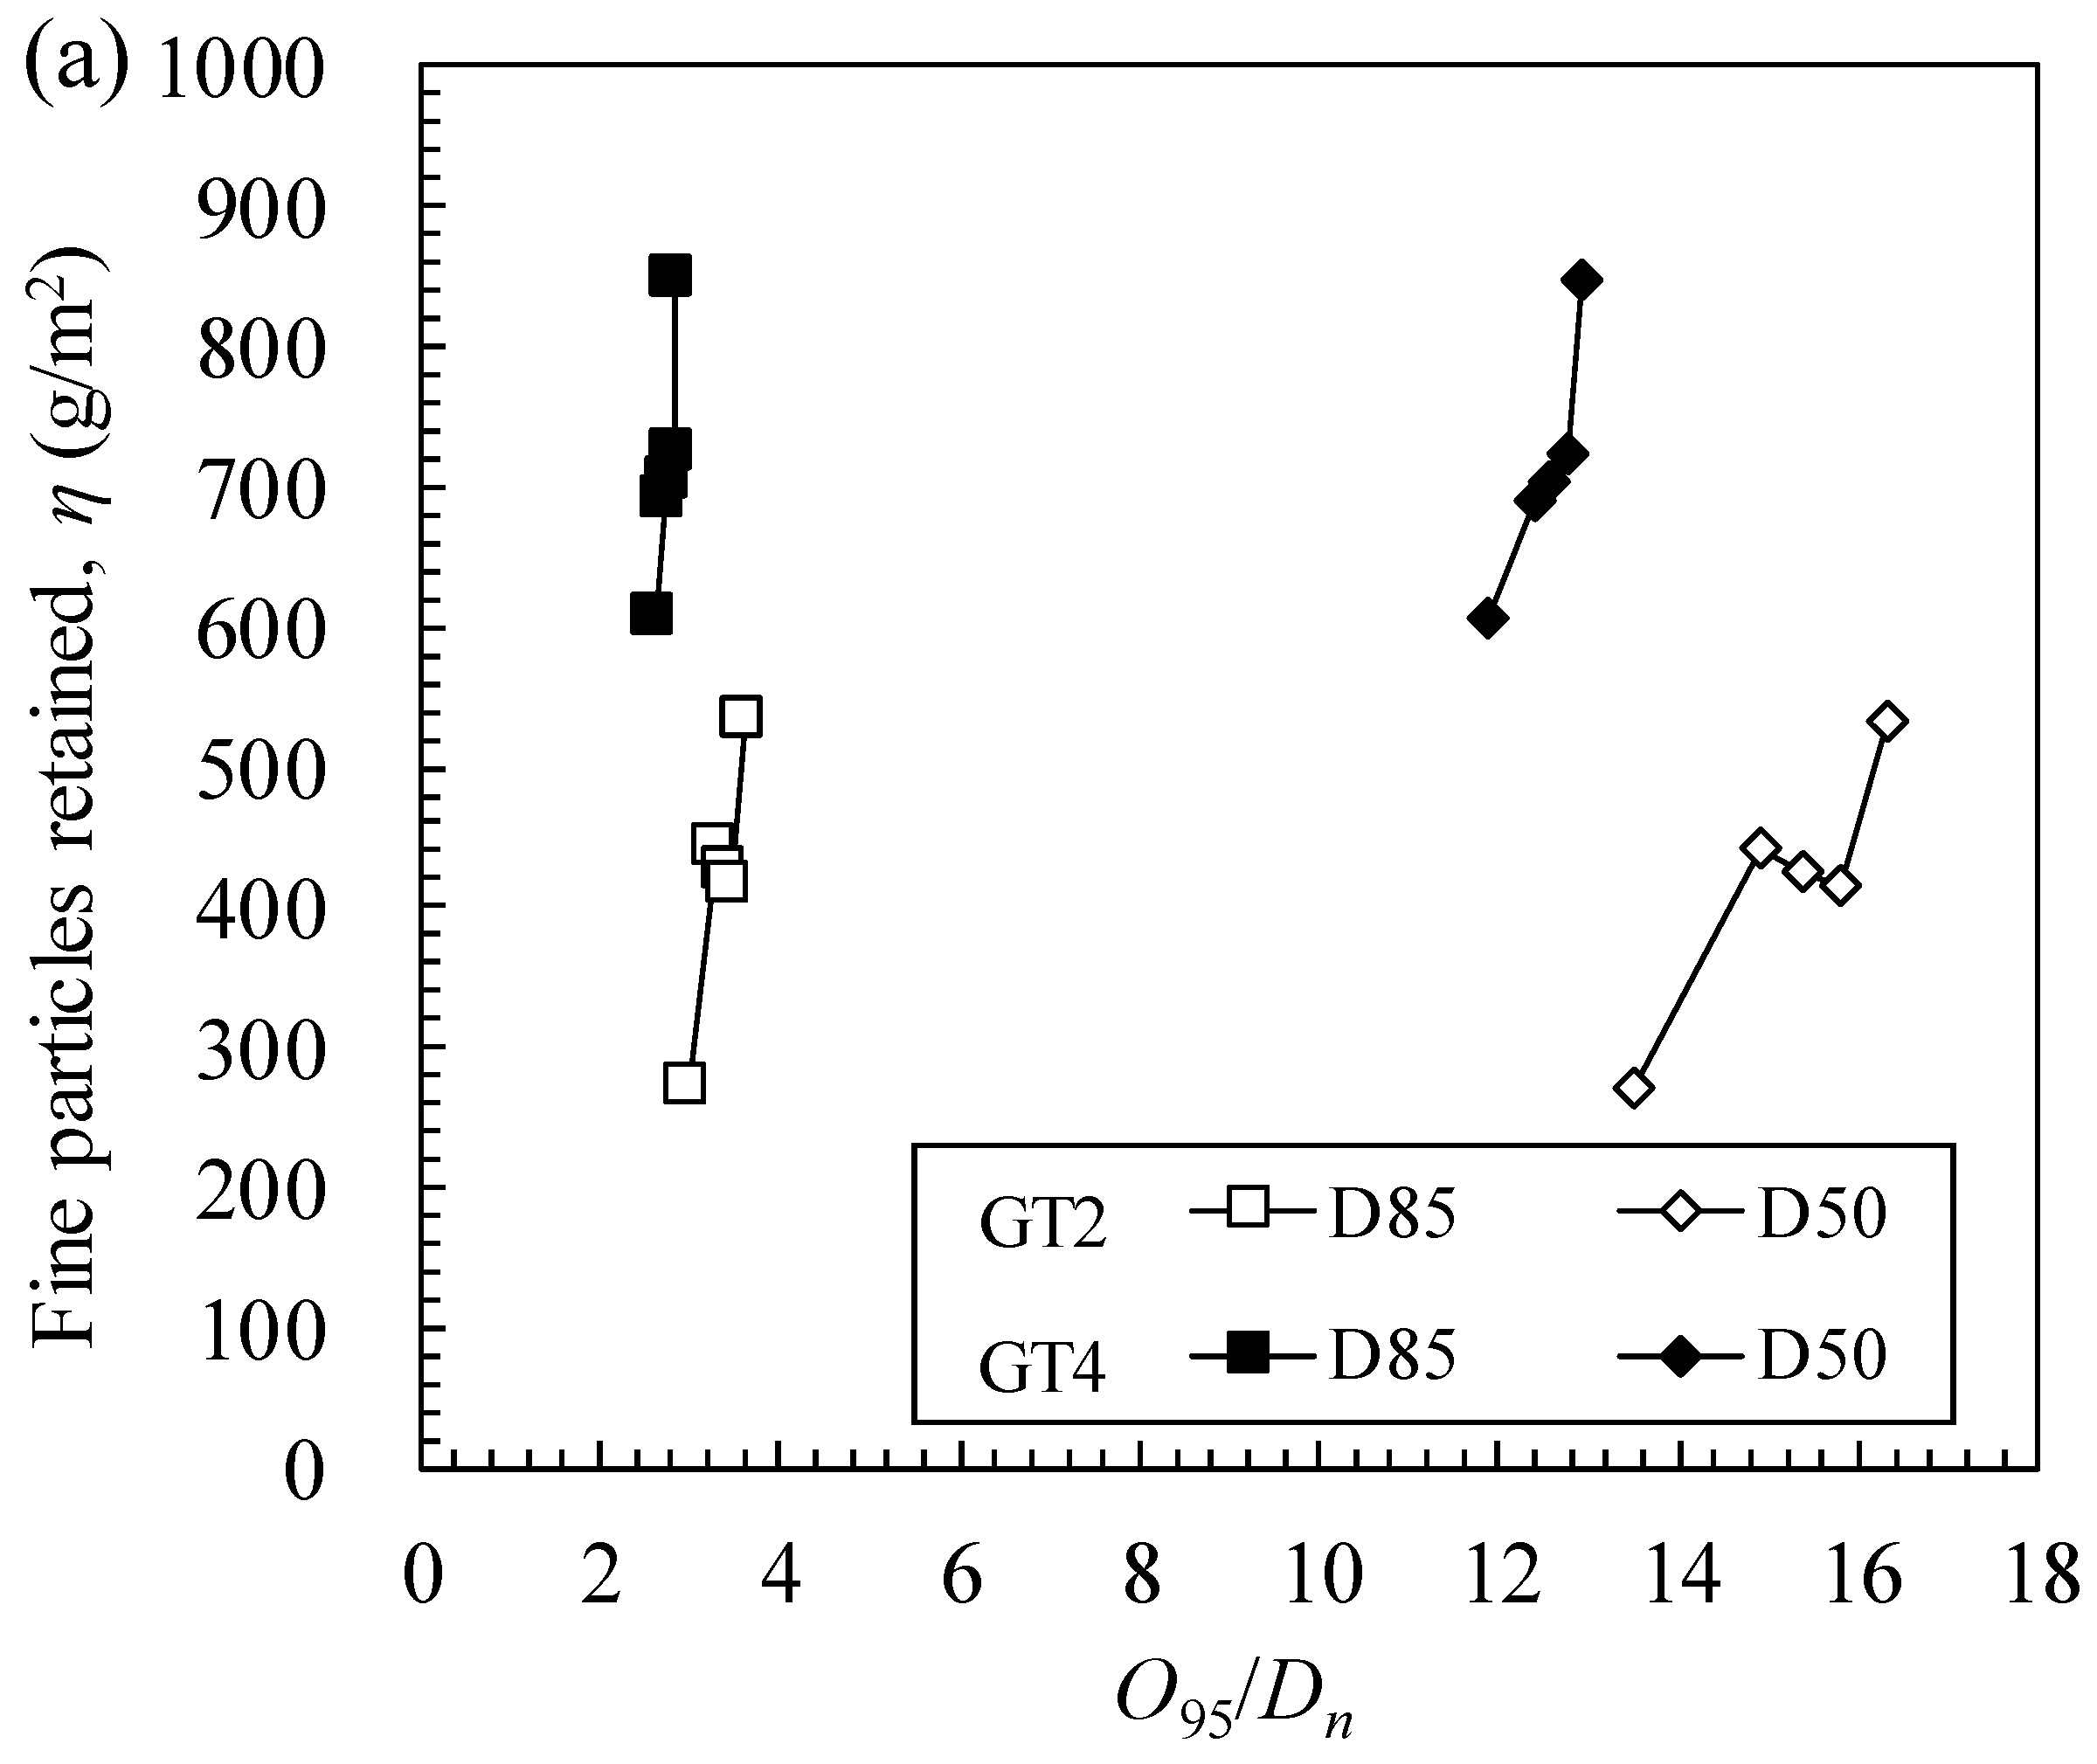
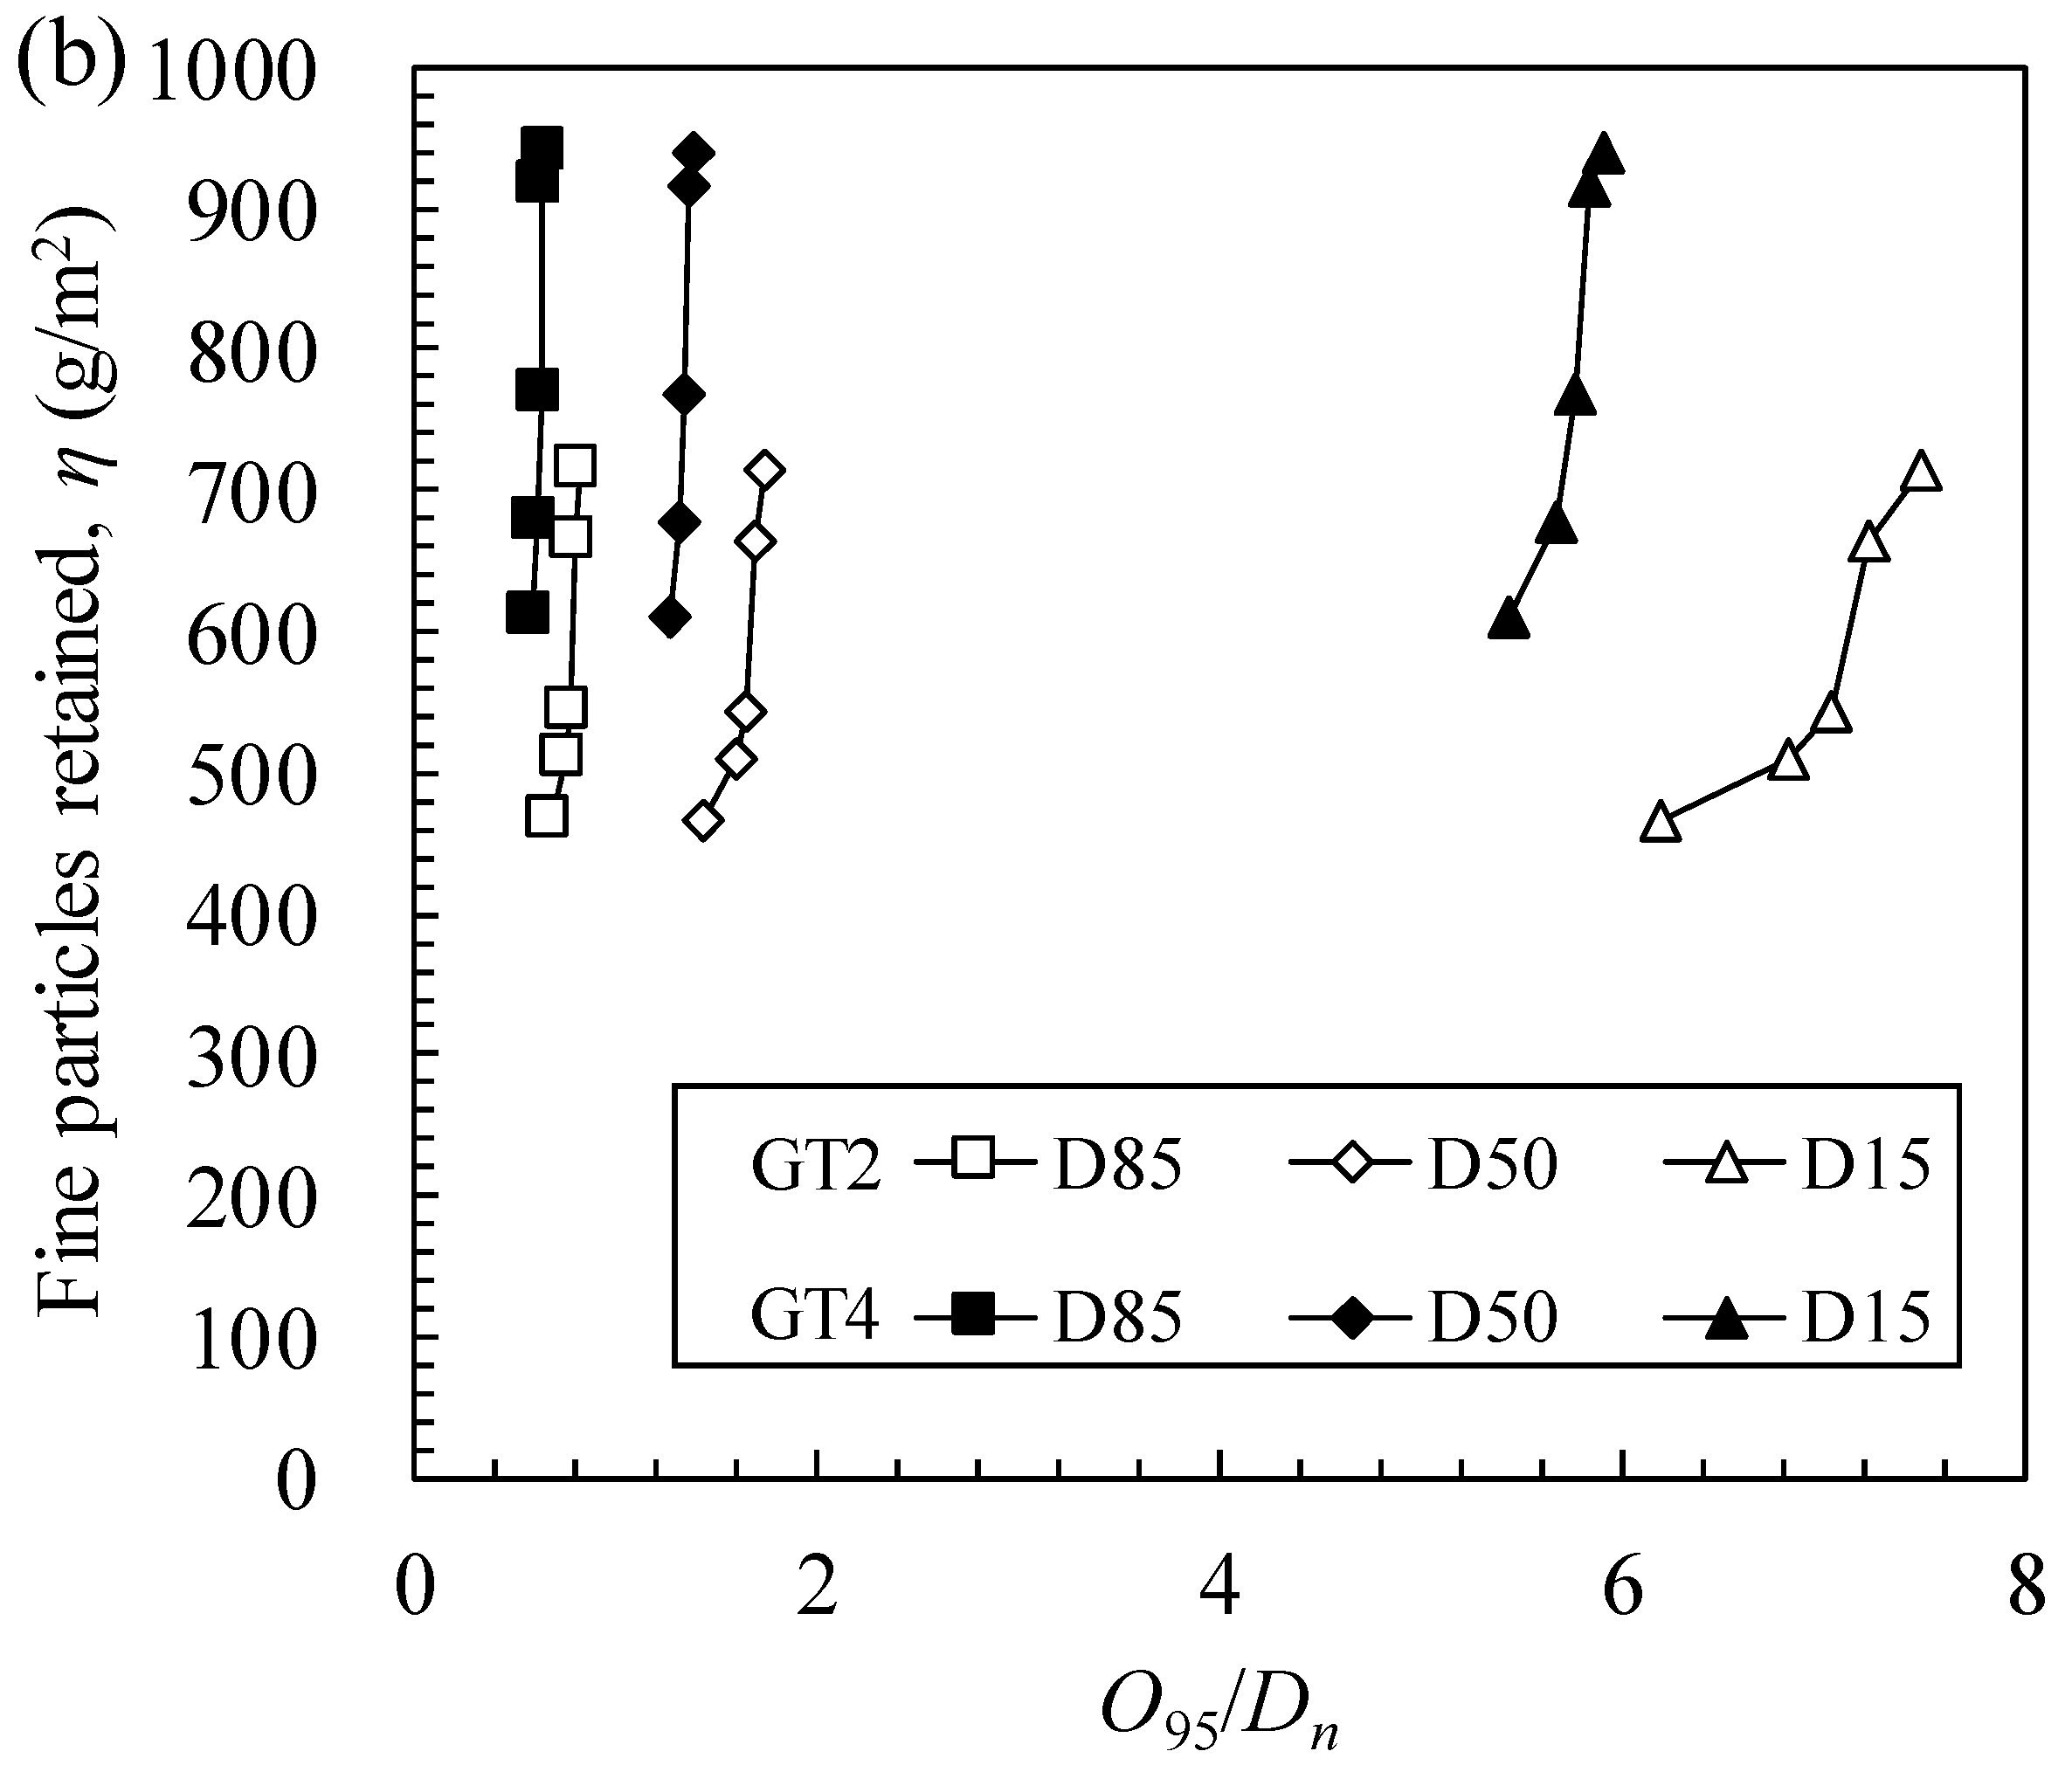
6.1. Influence of the Natural Soils Internal Stability on Retention Capability
6.2. Influence of the Normal Compressive Stresses on Filtration Performance
6.2.1. Normalized Parameters
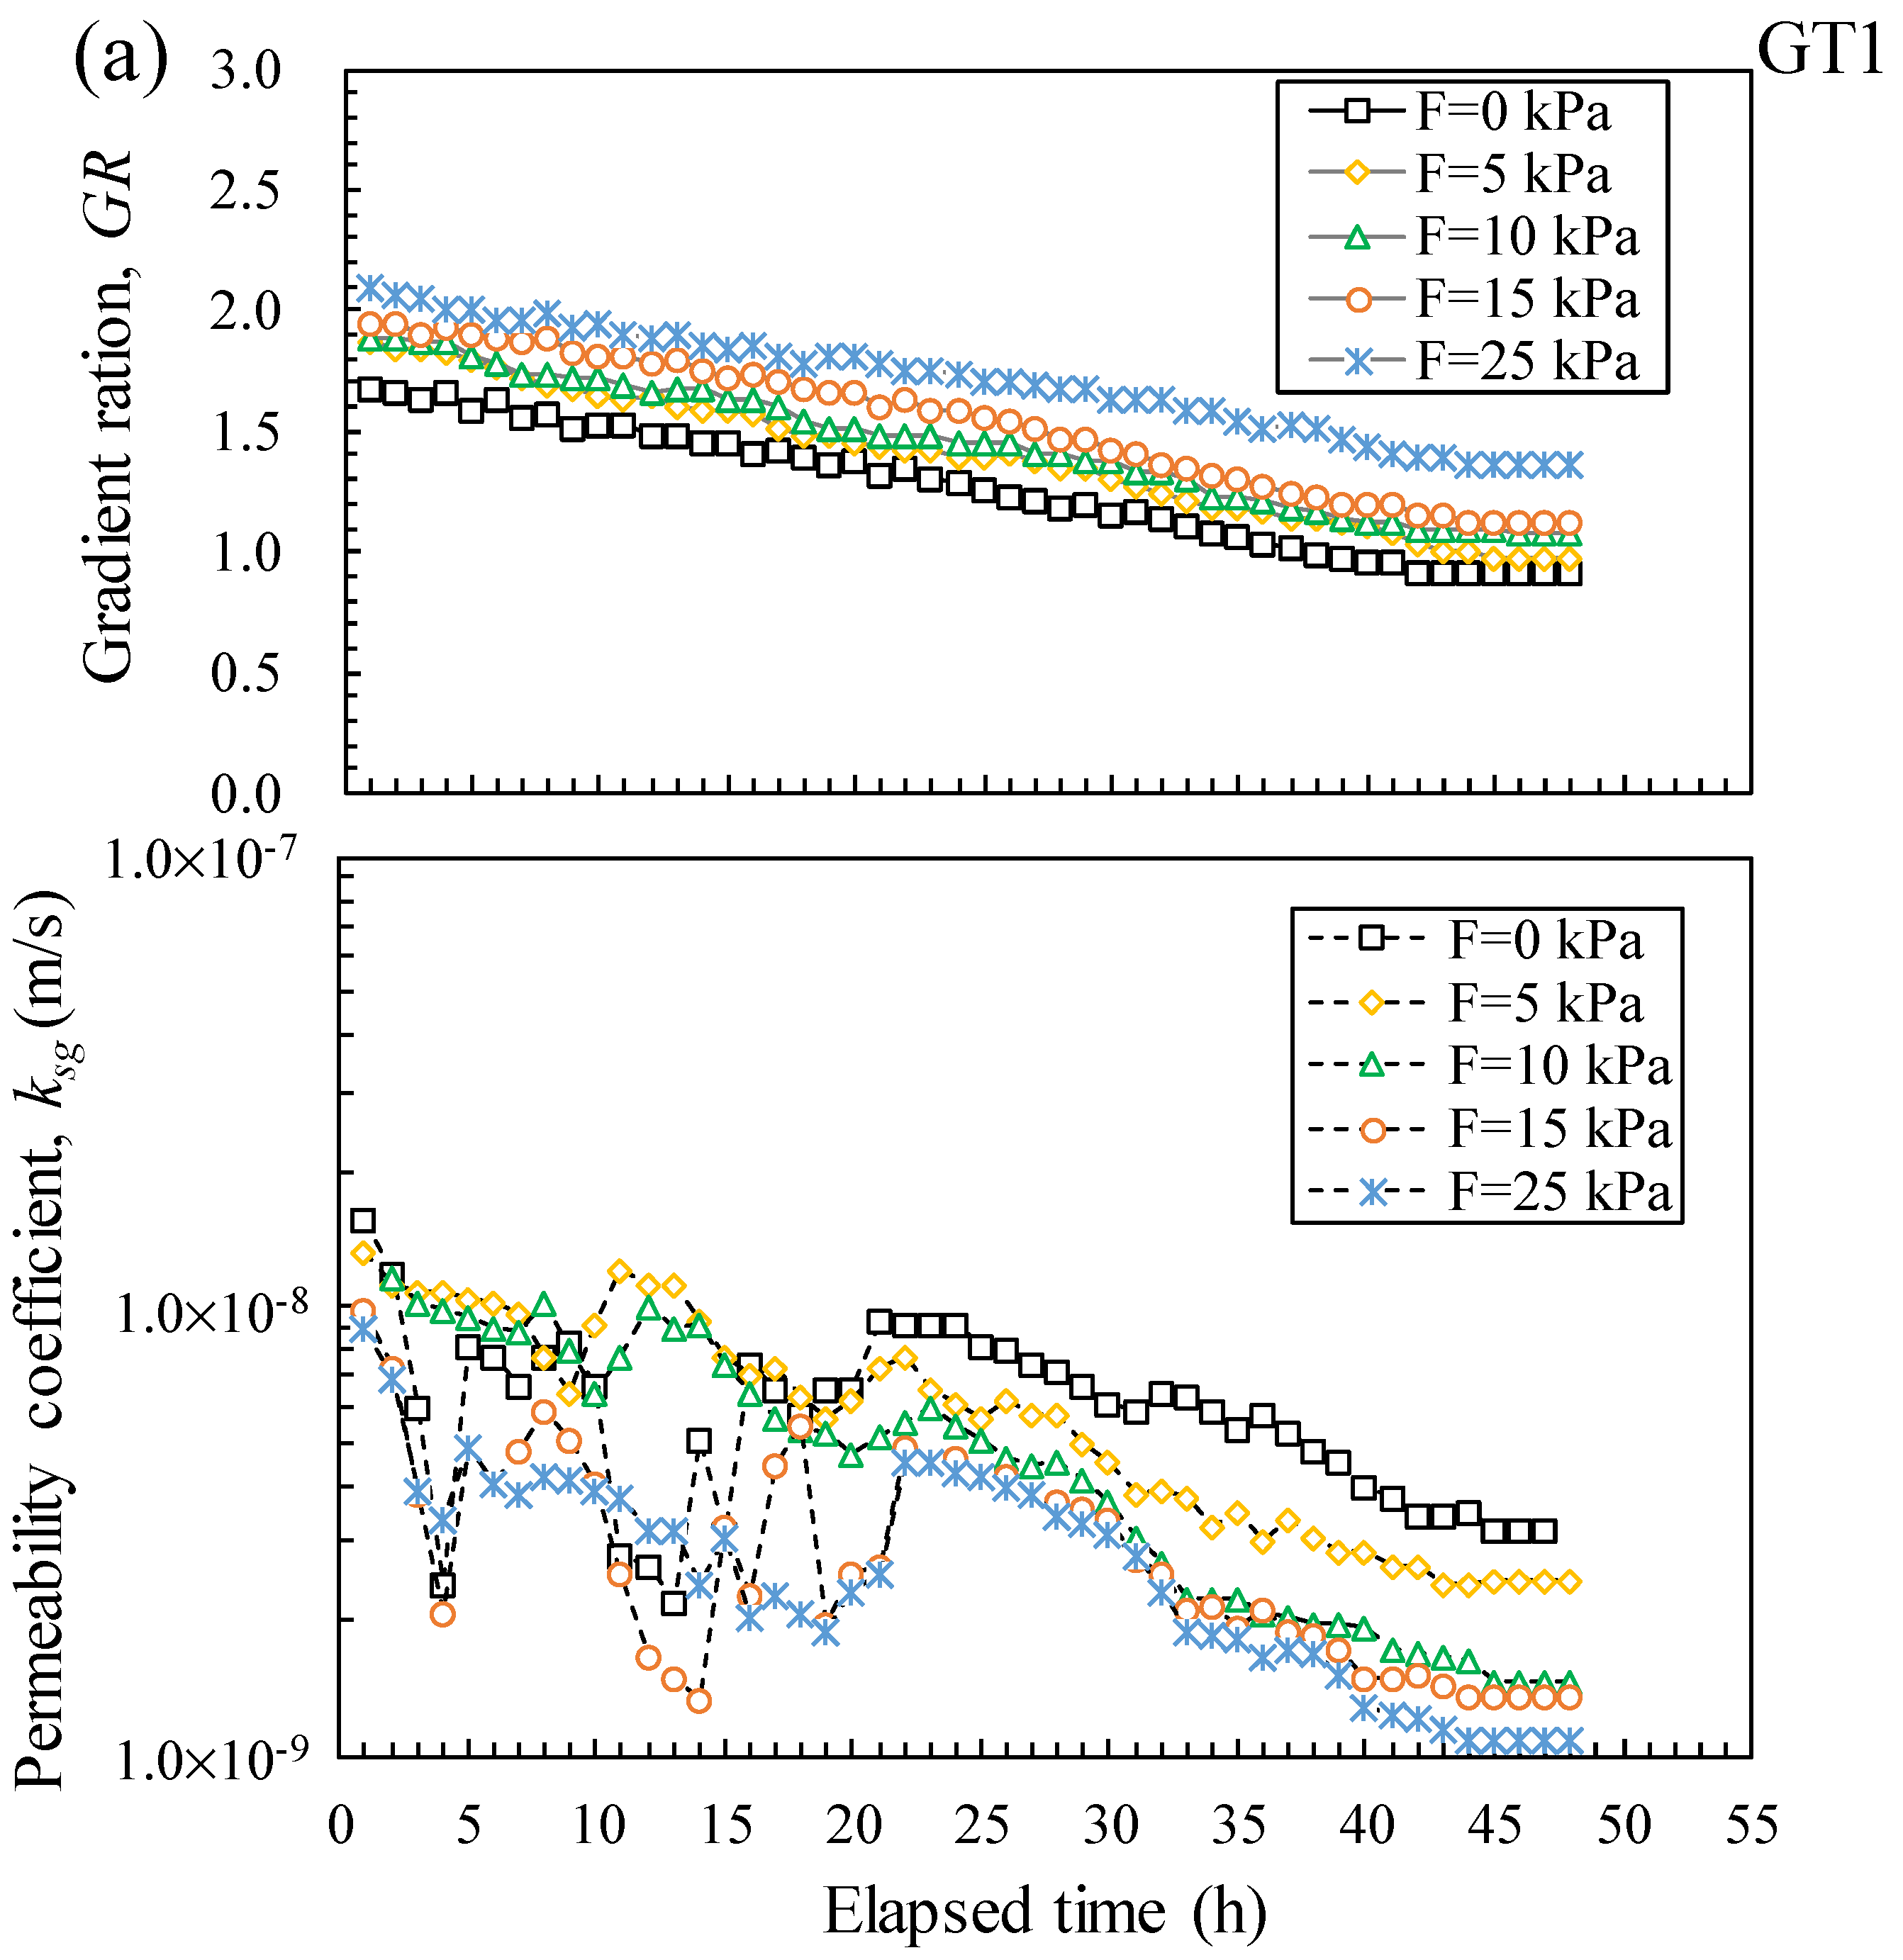
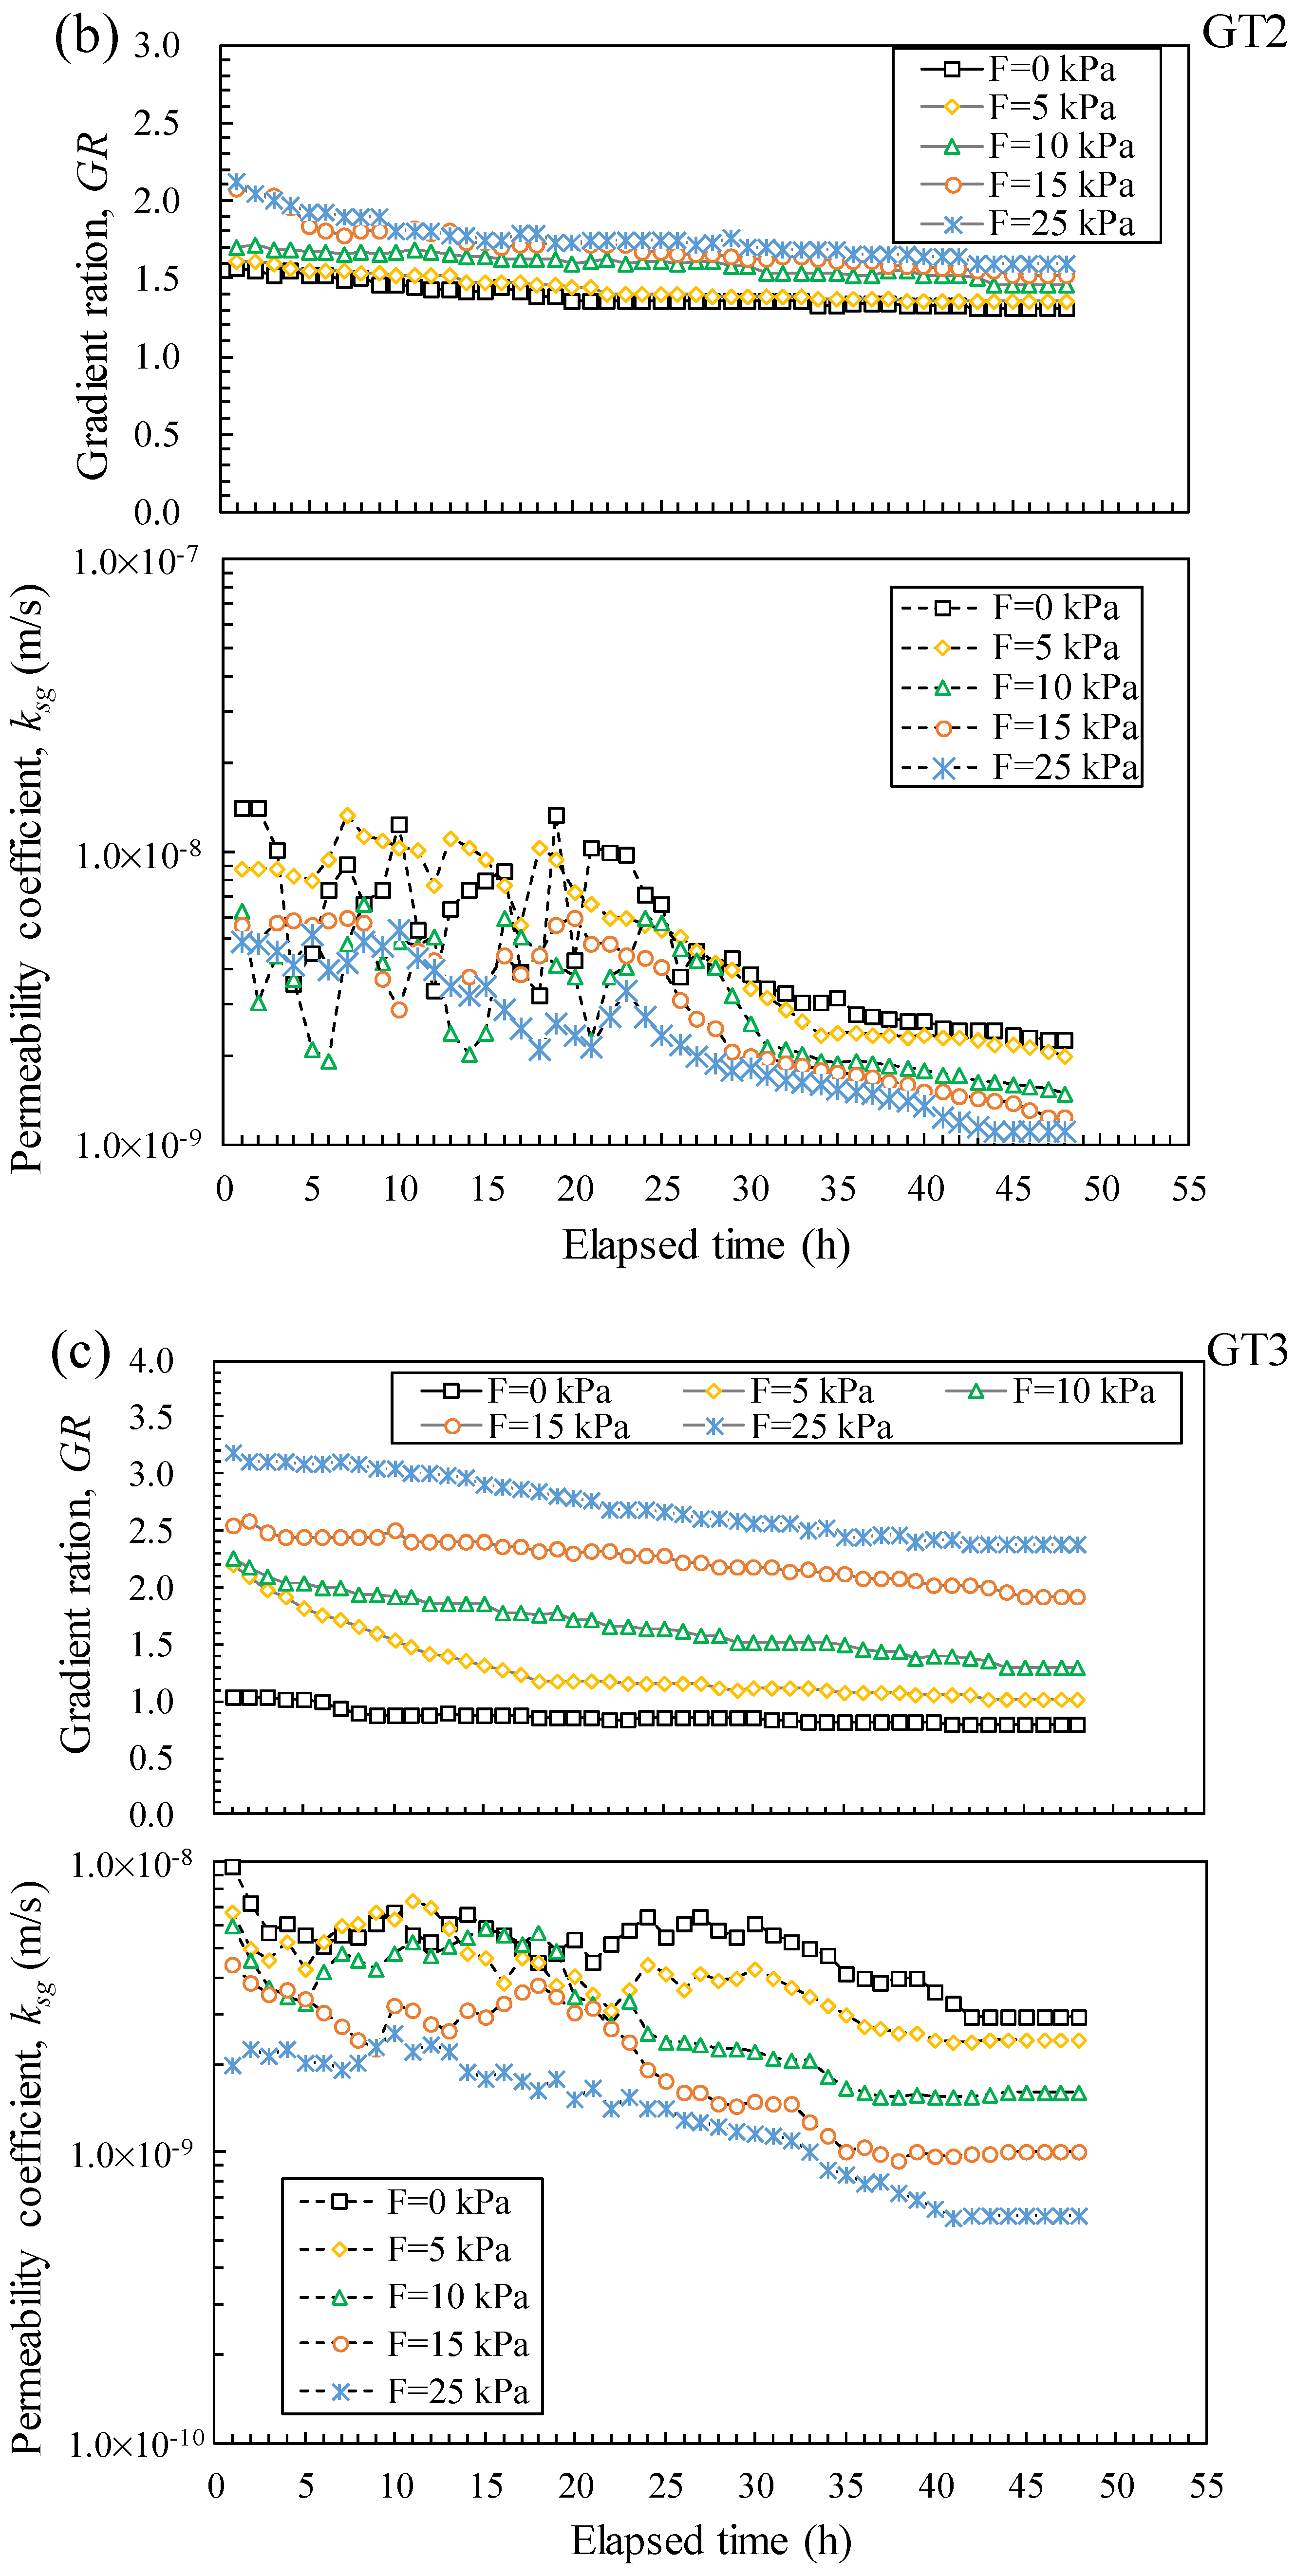
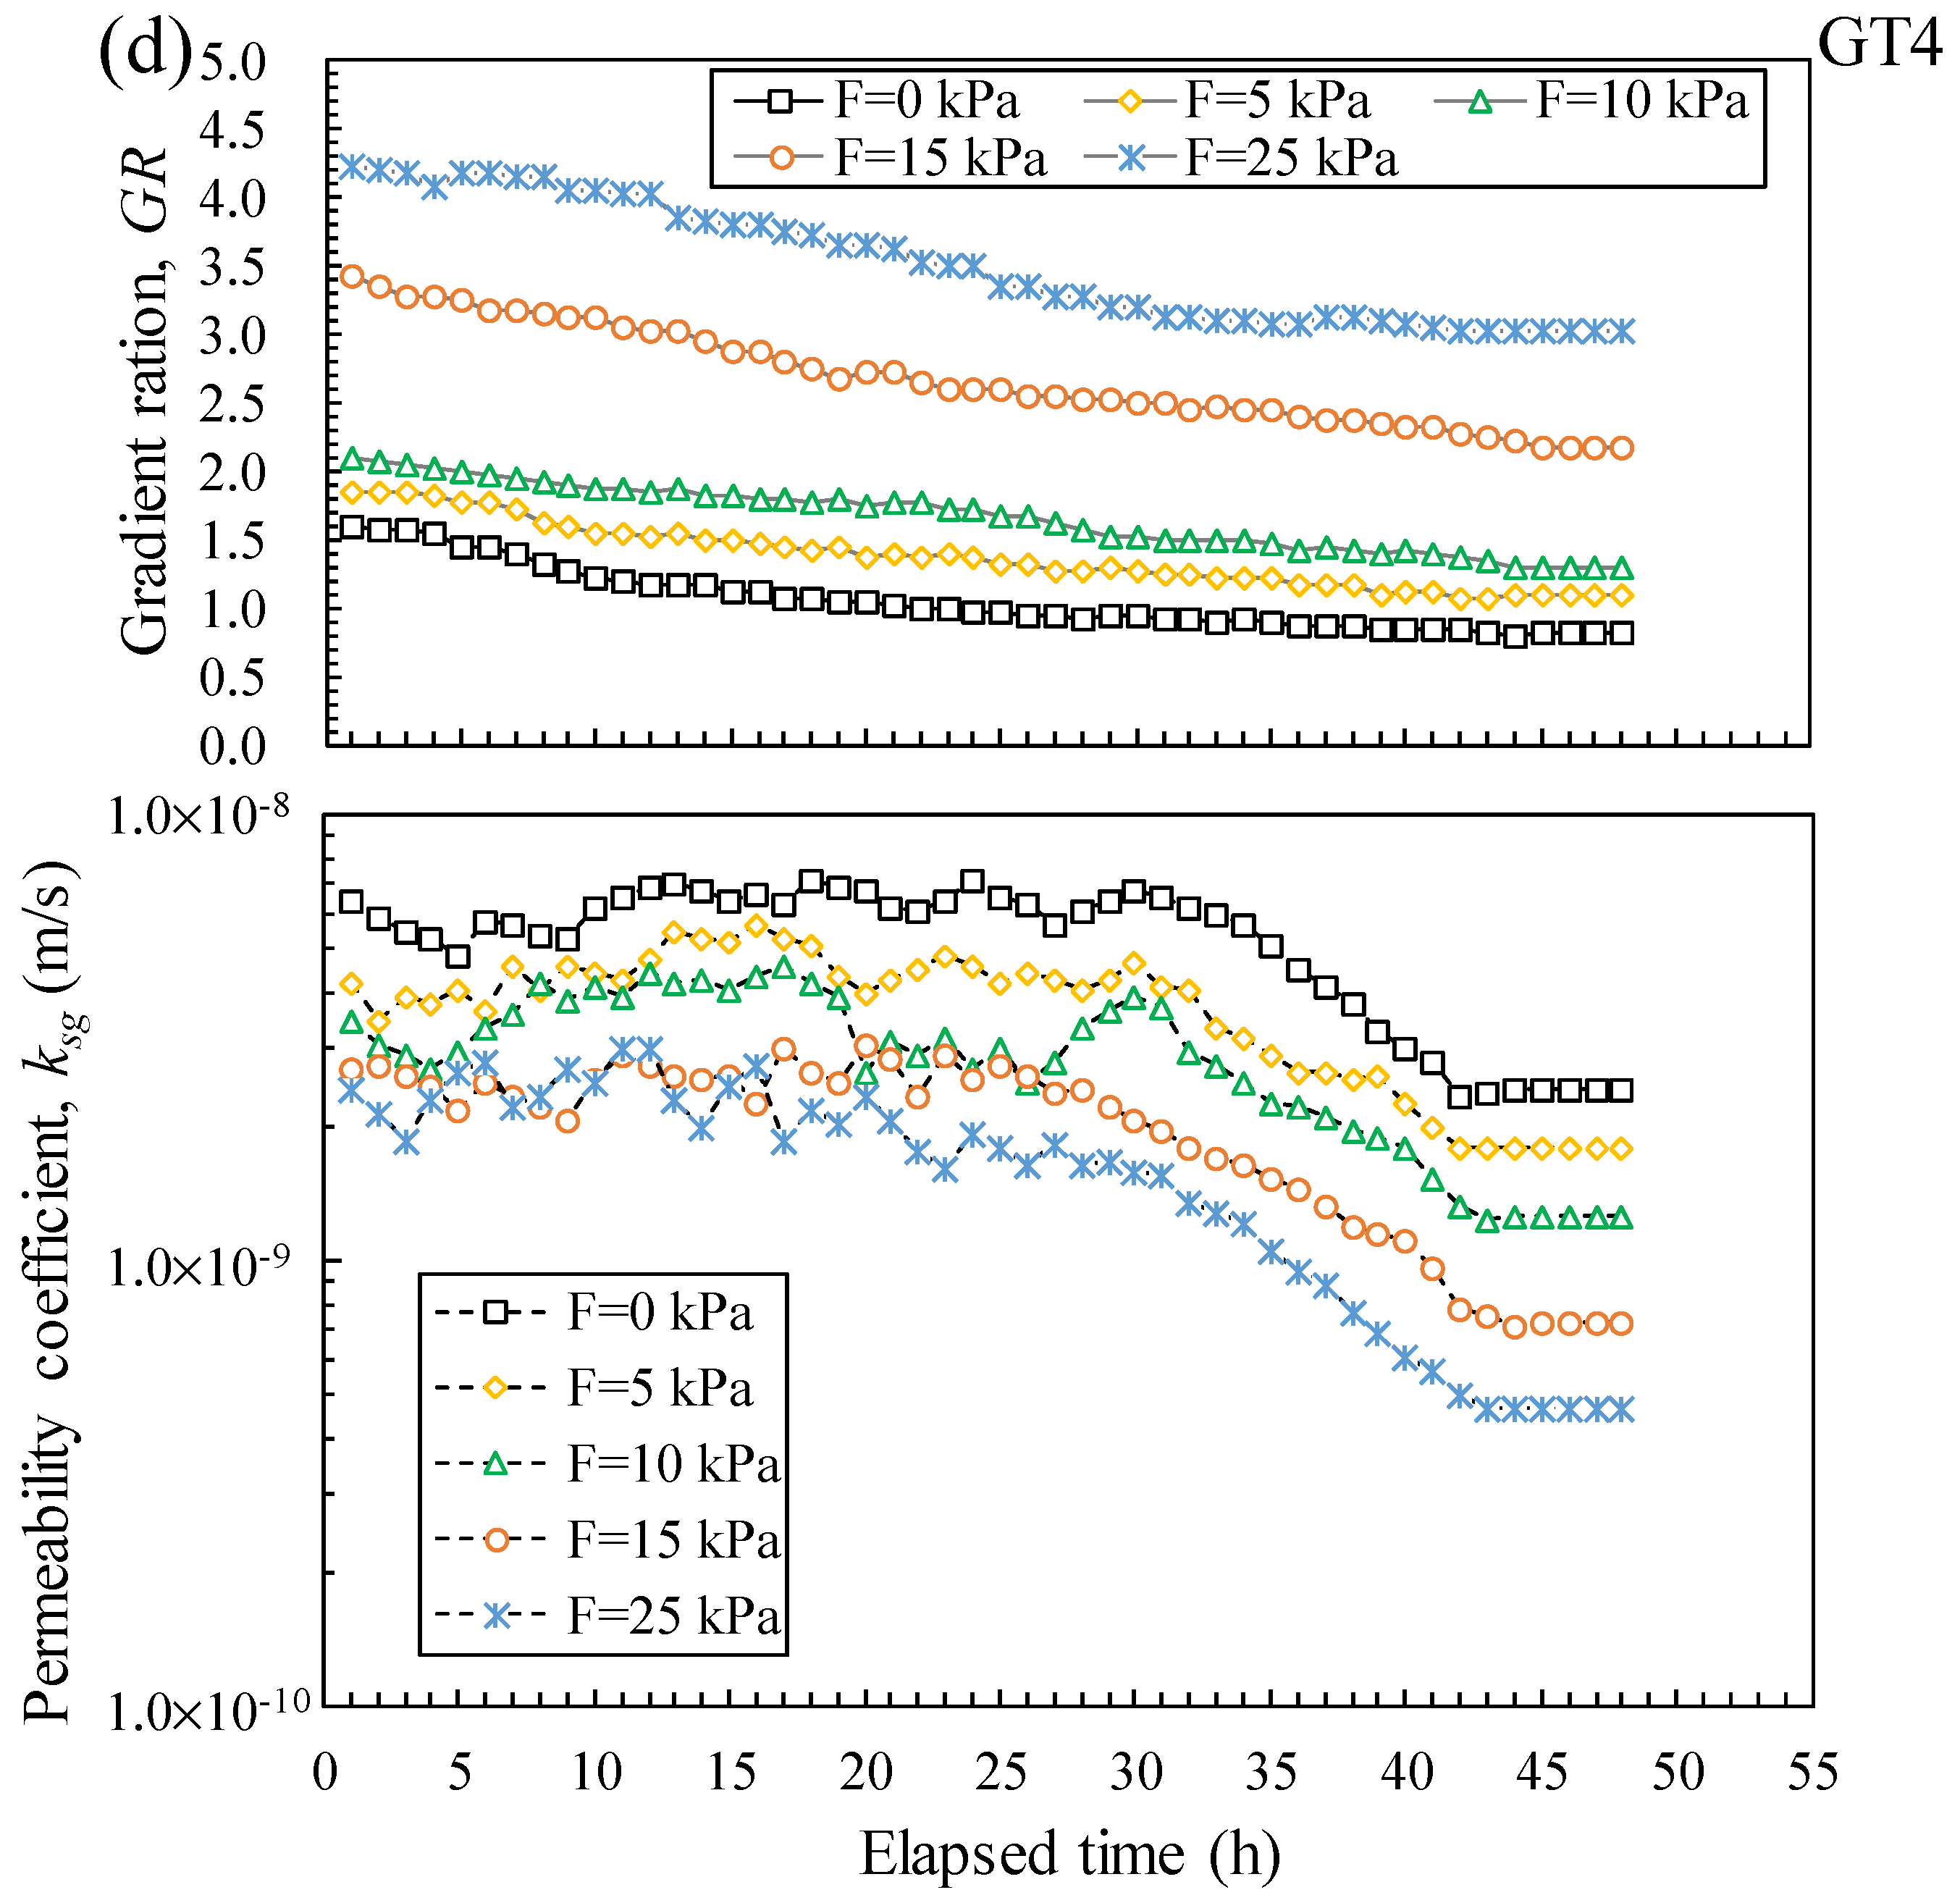
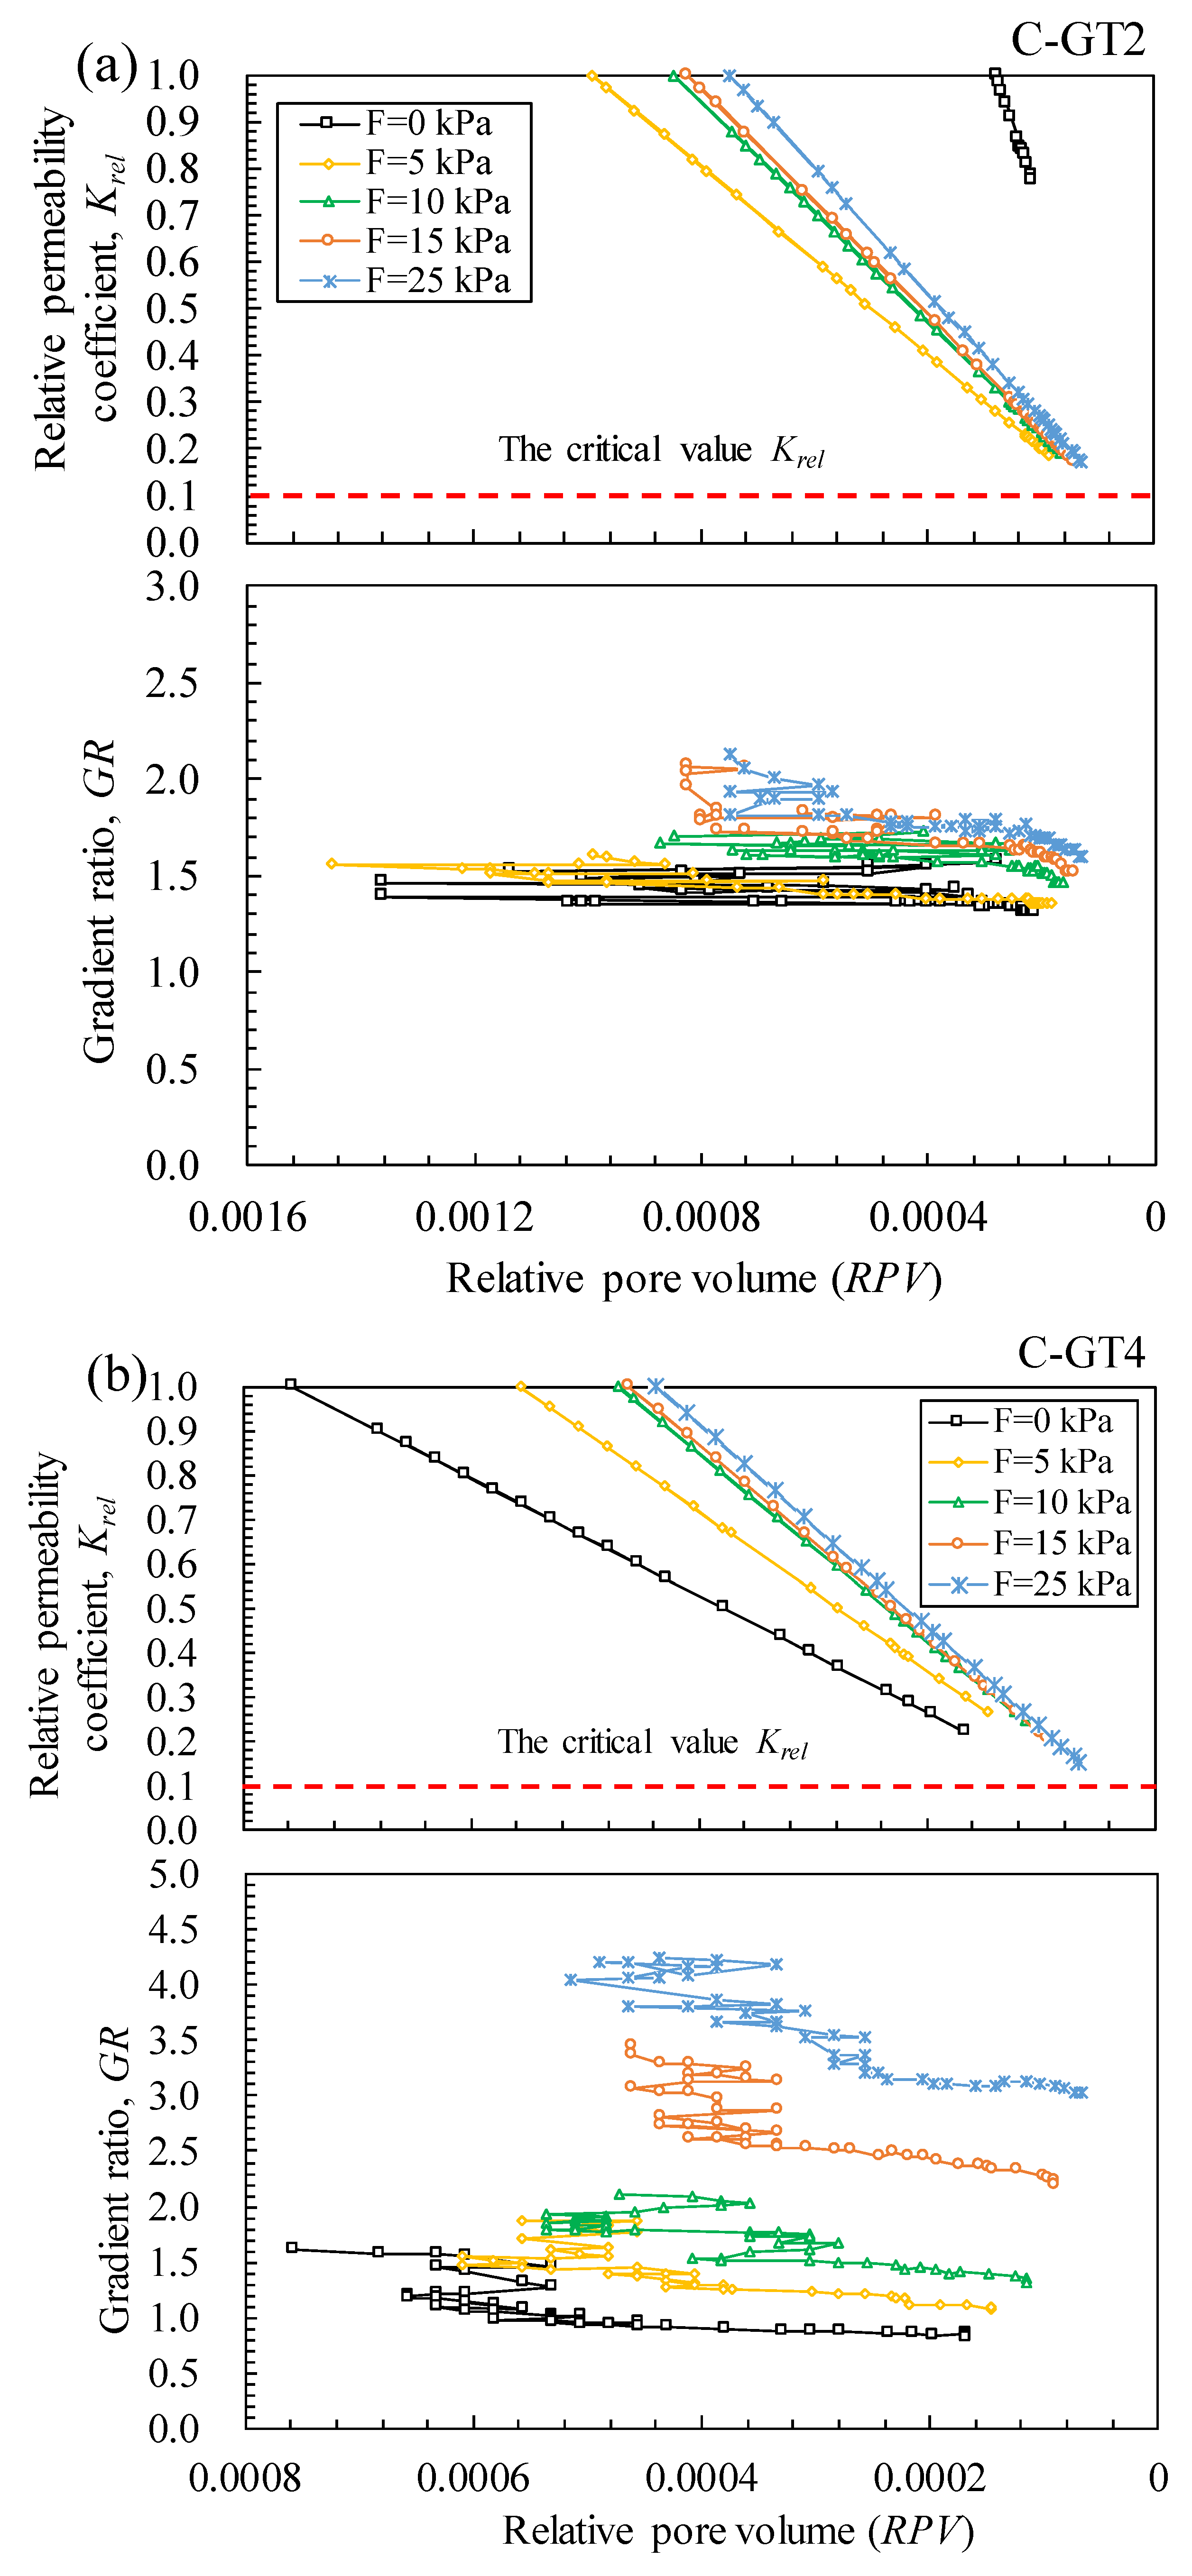
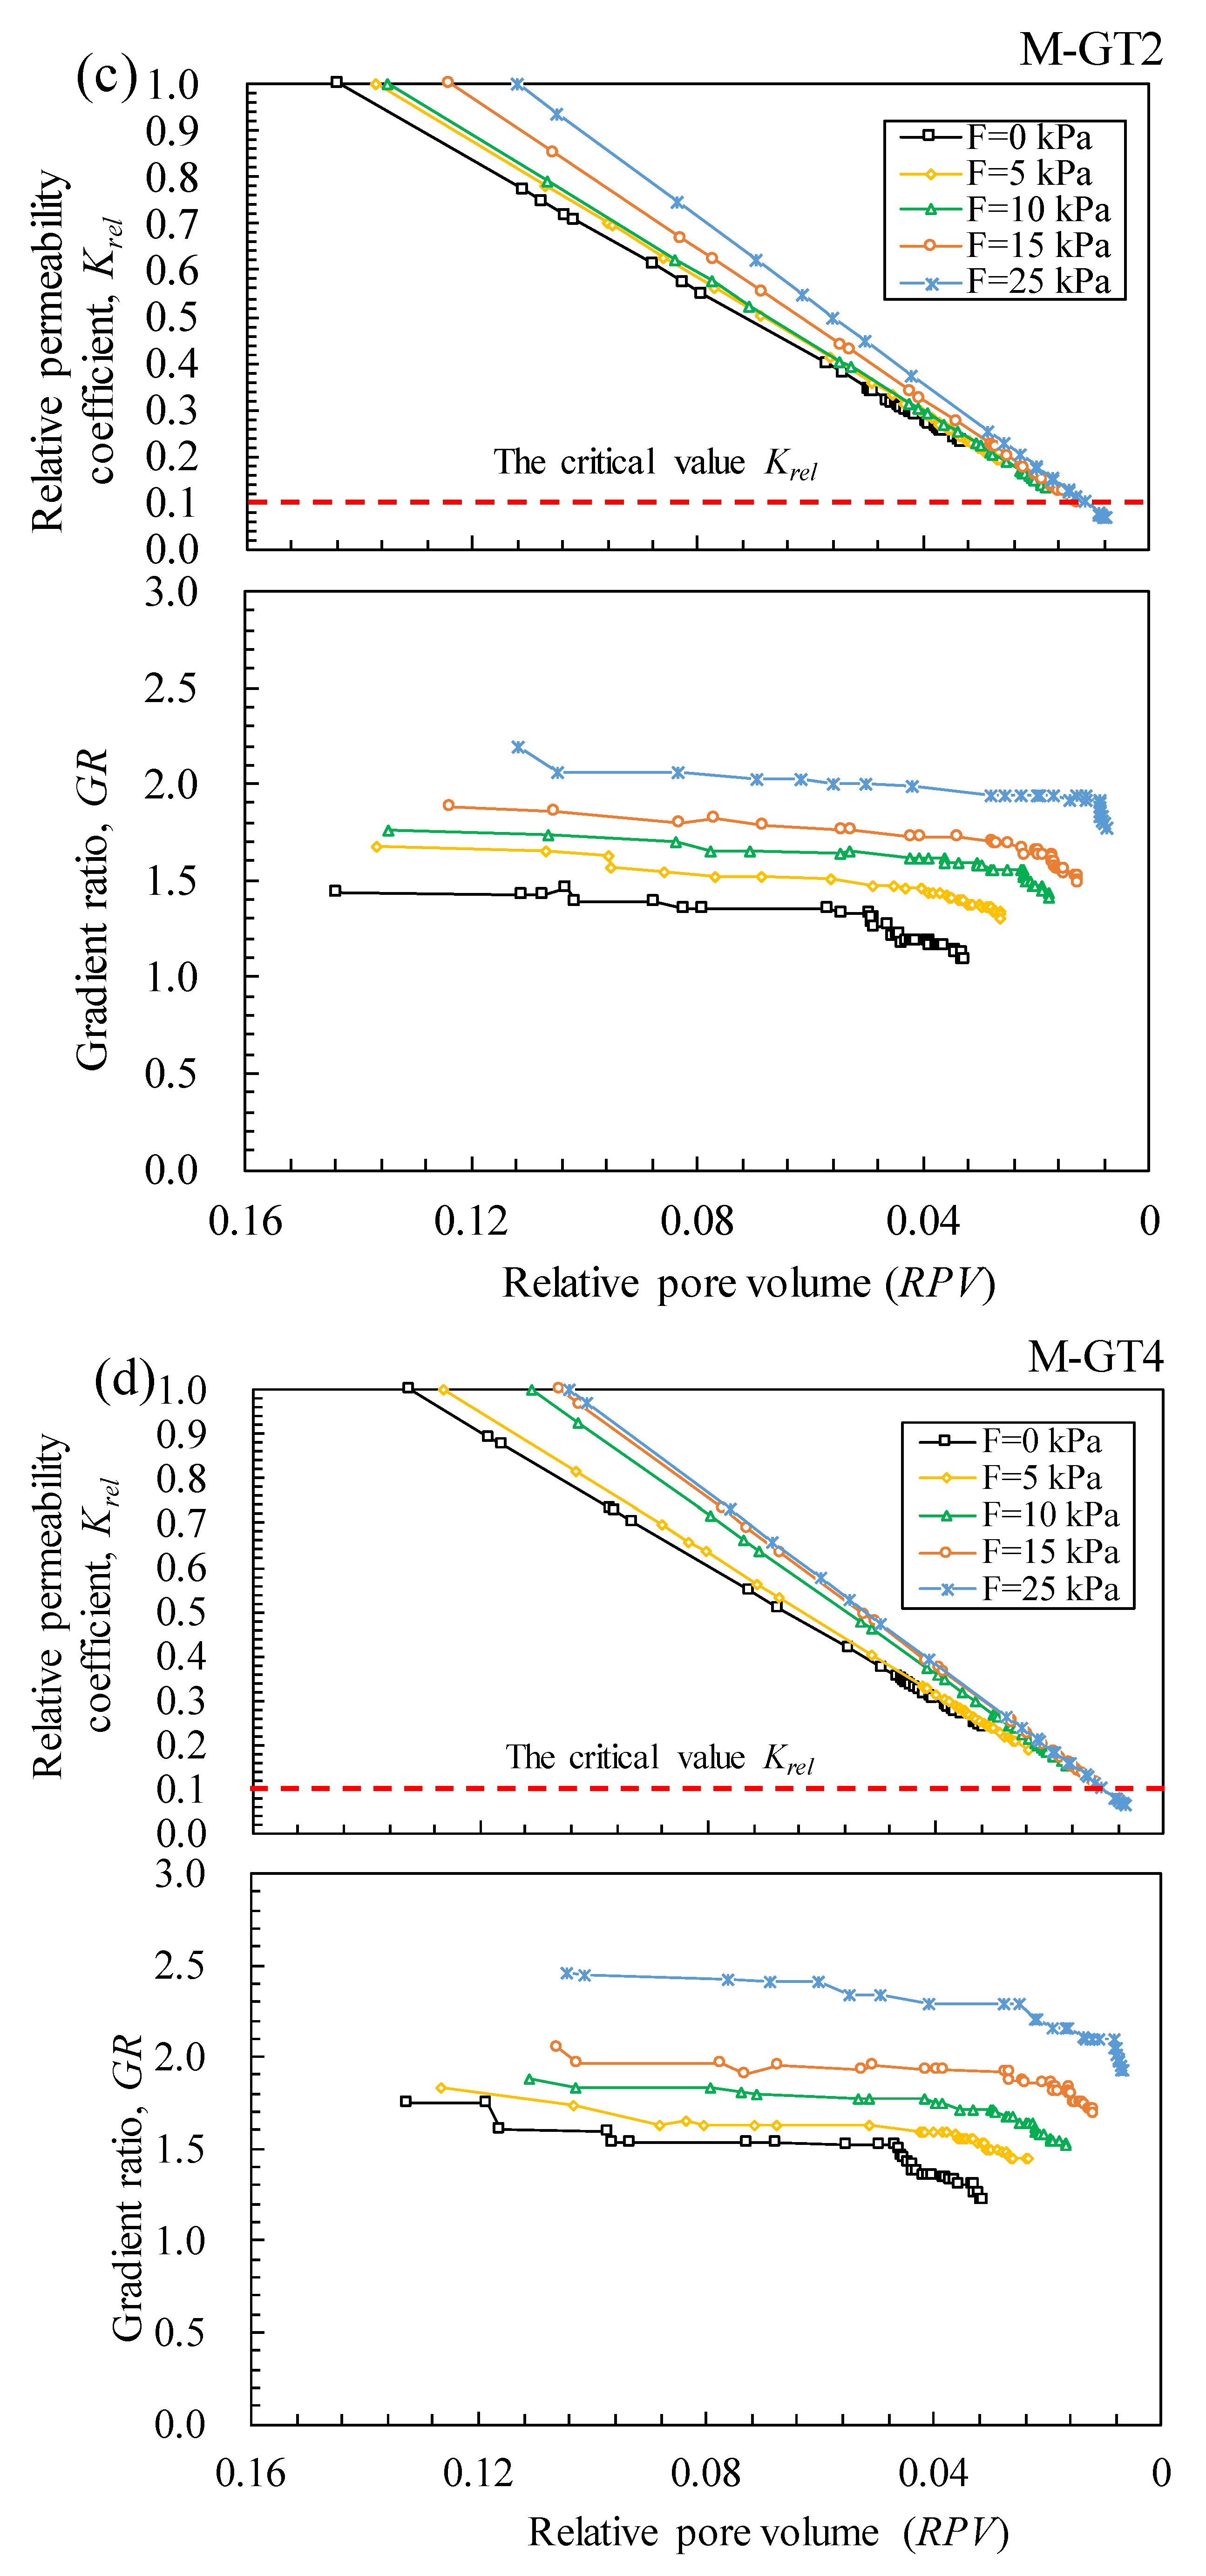
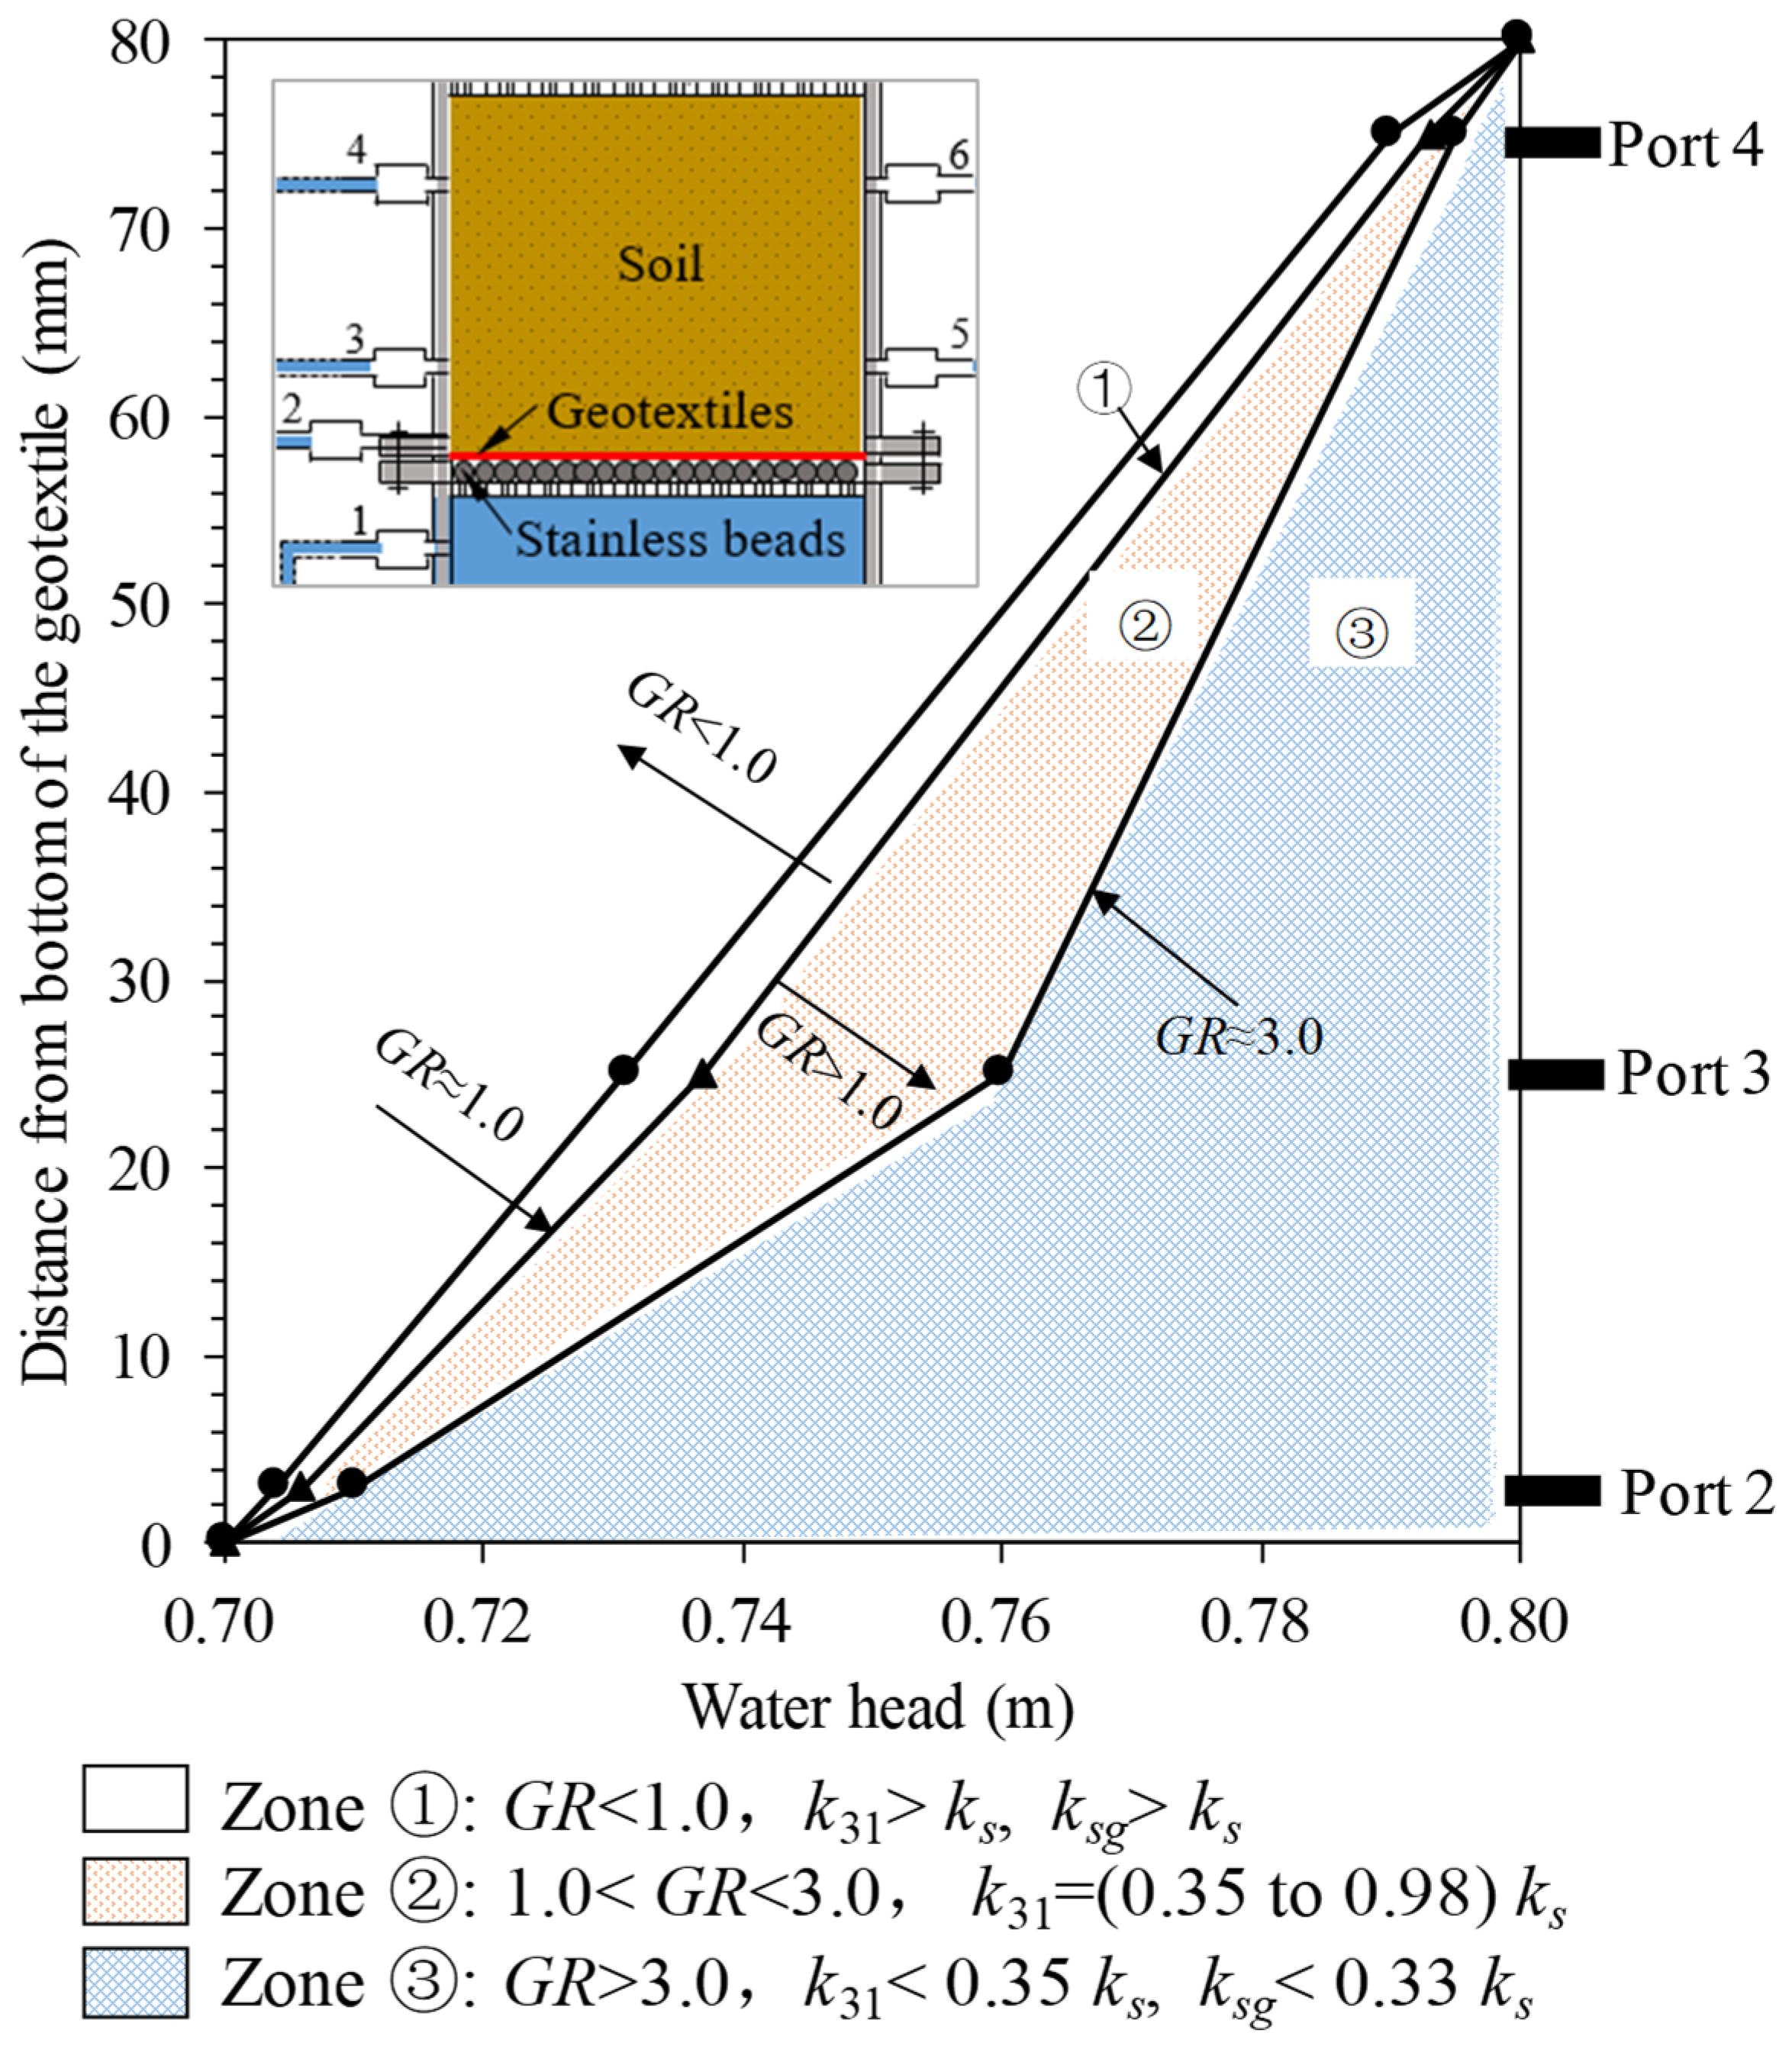
6.2.2. Gradient Ratio and Relative Permeability Coefficient
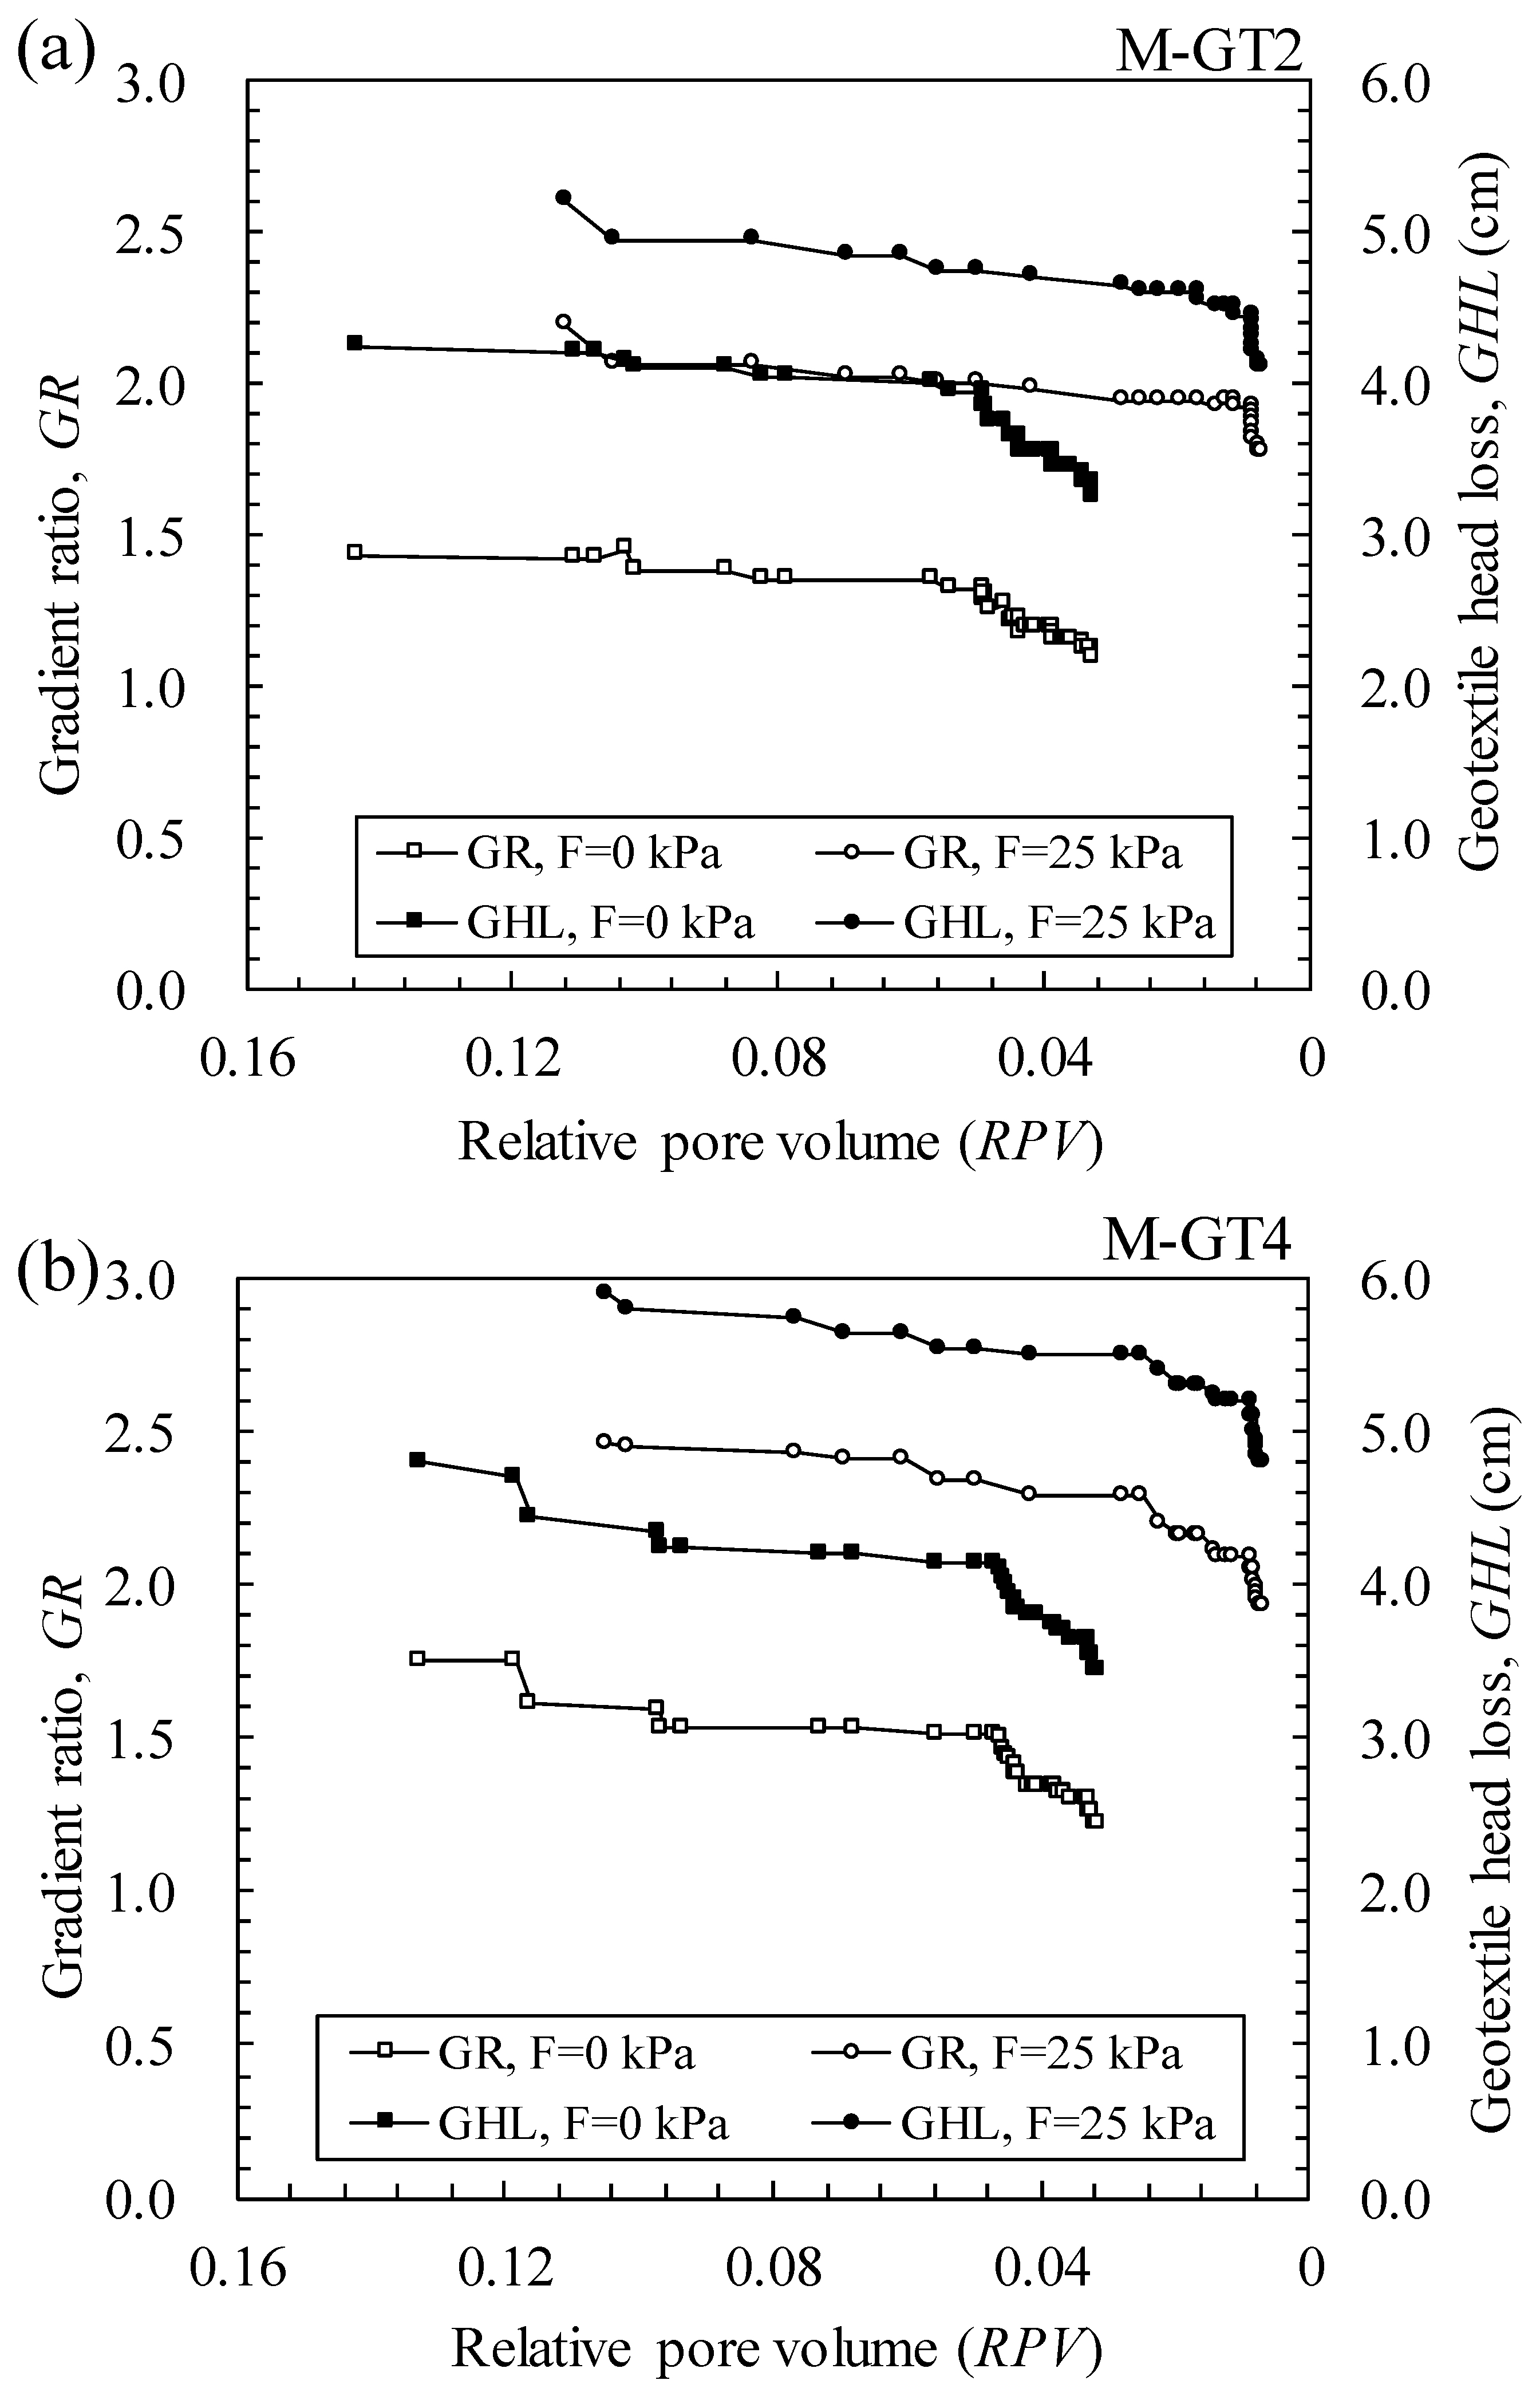
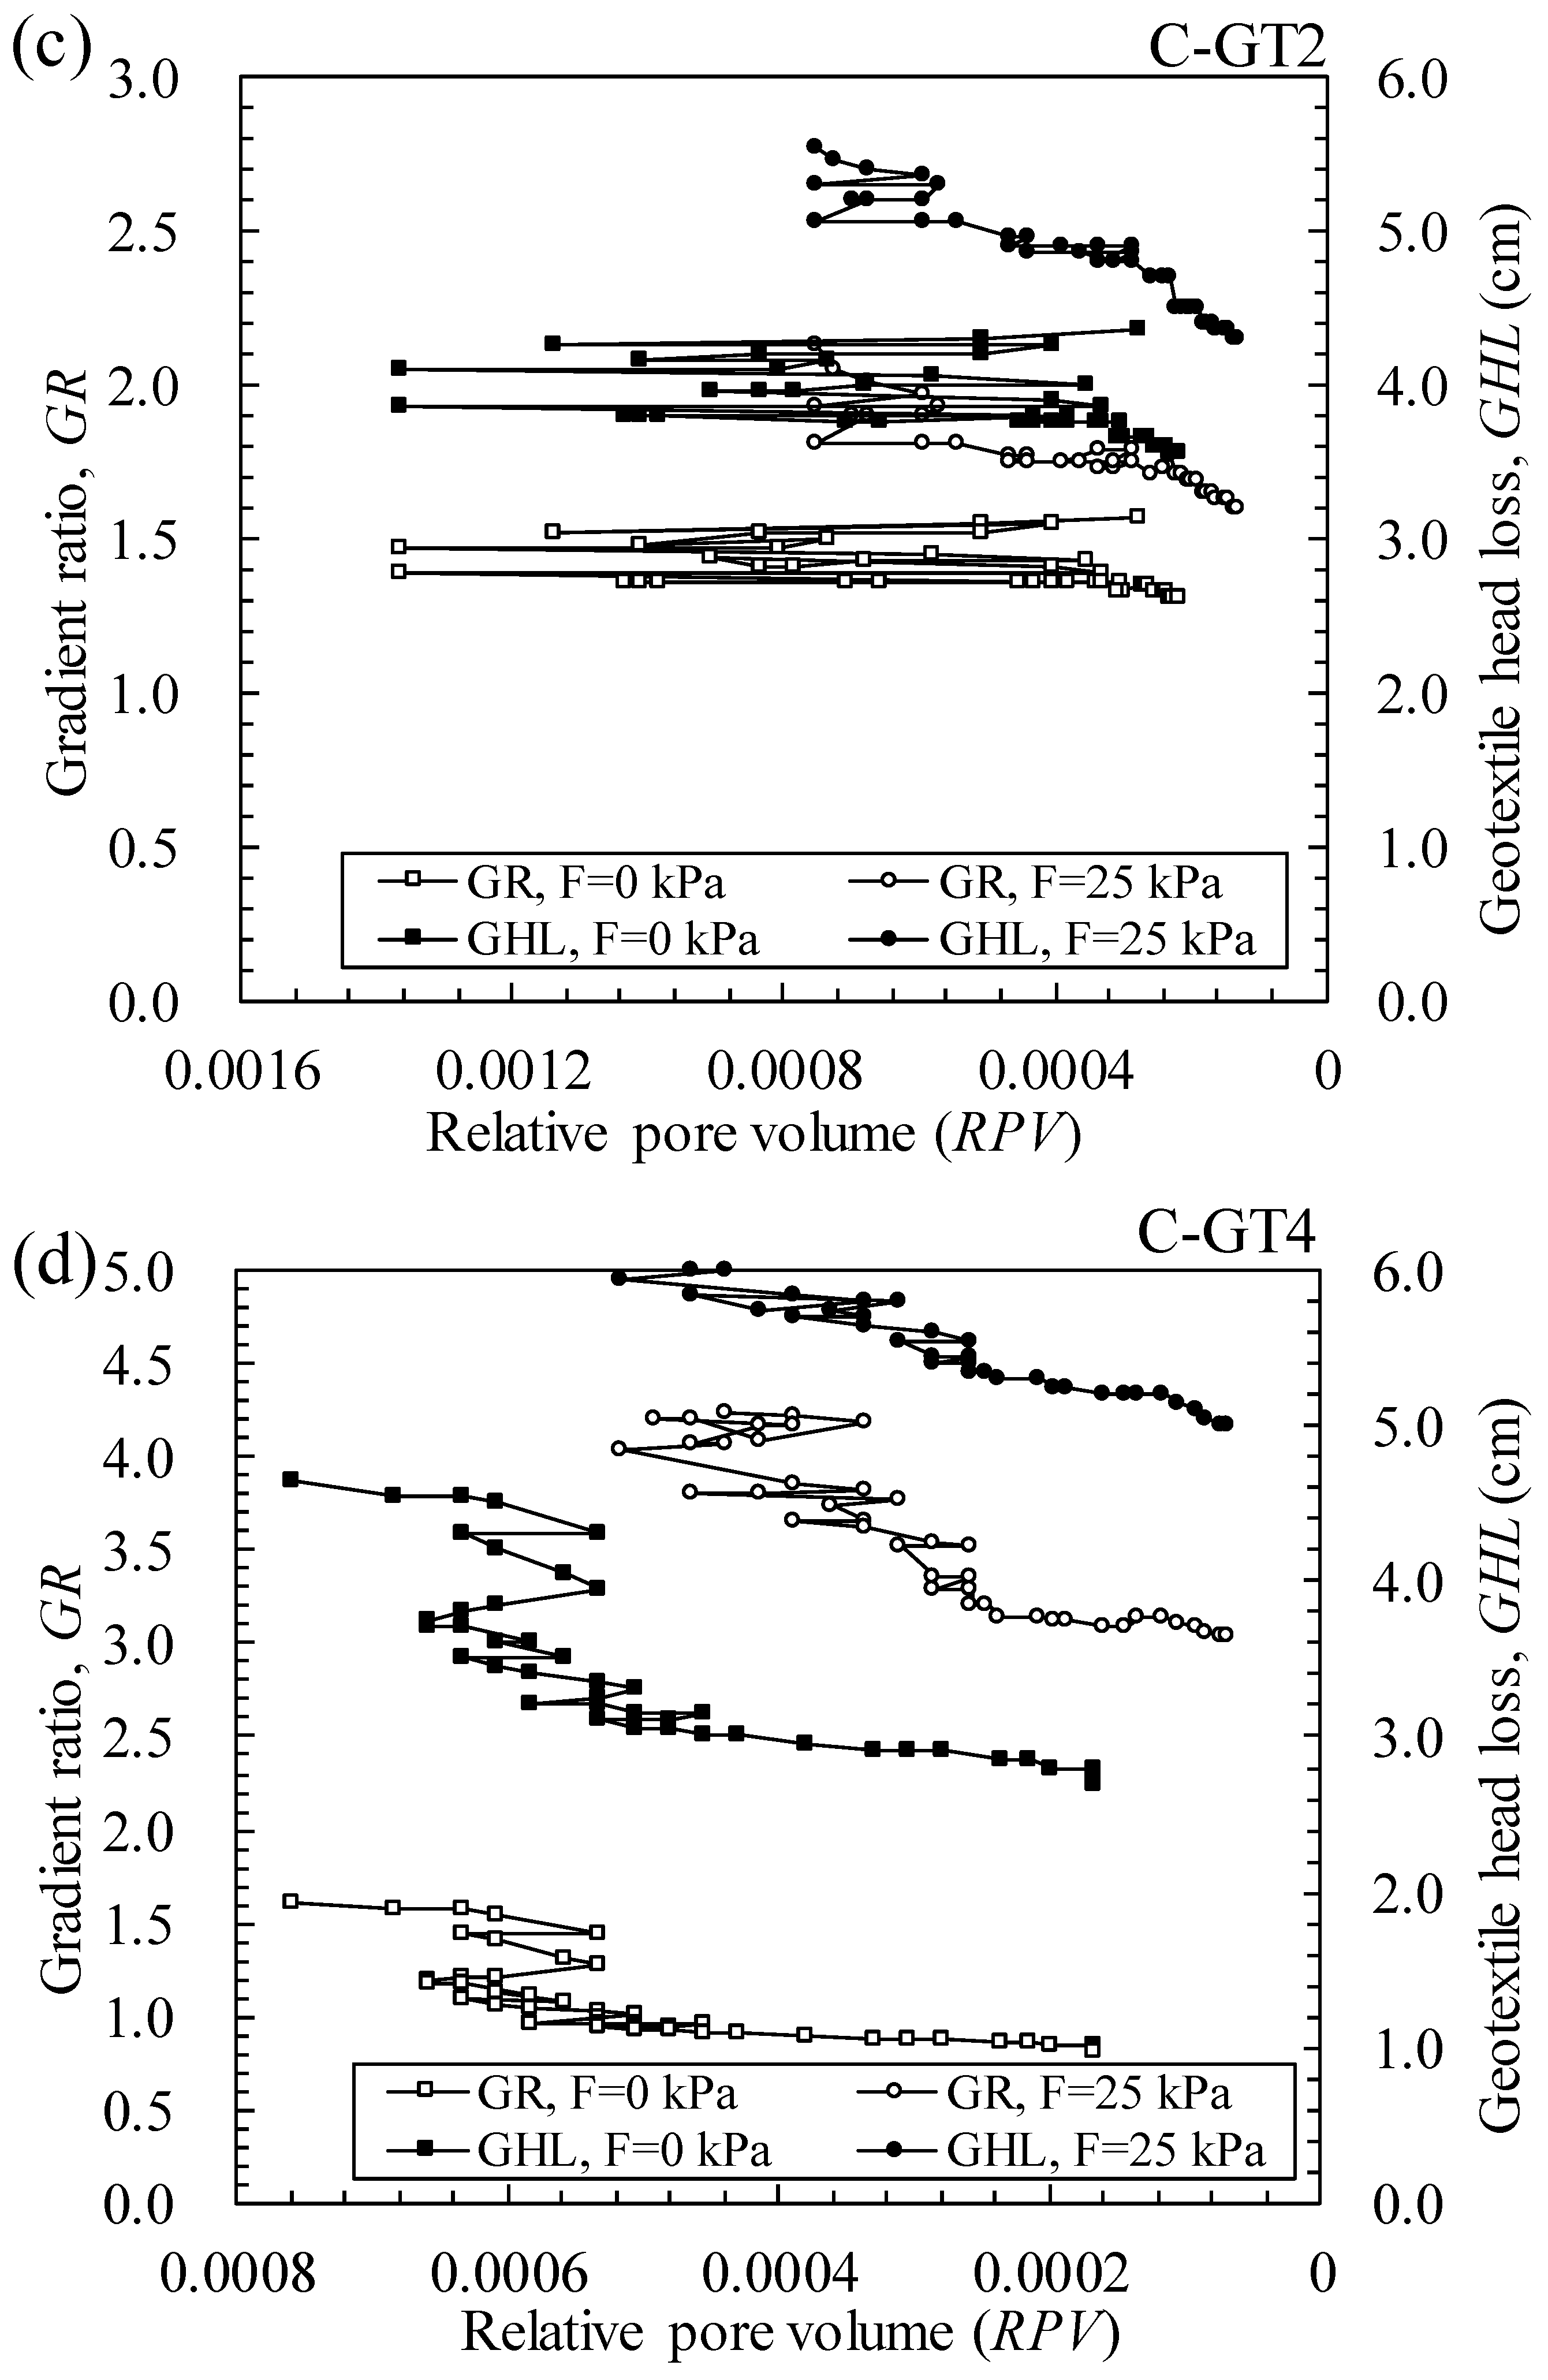
6.2.3. Gradient Ratio and Geotextile Head Loss
6.3. Implications for Design Practice
7. Conclusions
- Nonwoven geotextile filters with different filtration opening sizes, porosities, and thicknesses showed different compatibilities with fine-grained soil samples. Thick needle-punched nonwoven geotextile had a relatively smaller filtration opening size, and the permeability of the soil–geotextile system decreased by 1~2 orders of magnitude after 48 h of filtration, resulting in poor filtration performance.
- The filtration performance of geotextile filters responded significantly to applied normal compressive stresses. As normal compressive stress increased, GR values also increased but the permeability decreased in soil–geotextile combinations.
- Filtering fine-grained soils by needle-punched nonwoven geotextiles was primarily manifested as clogging, in which most of the fine particles were entrapped inside geotextile pores and retained on the fibers. The mass of fine particles per unit area was found to be significantly related to normal stress magnitude, soil characteristics, and nonwoven geotextile thickness, i.e., fine particle retention was greater when a thicker geotextile filters the internally unstable soil under higher normal compressive stress.
- Although the nonwoven geotextile clogged in fine-grained soil filtration, the soil–geotextile composite layer was relatively thin, and the head loss occurring across the composite layer would have little effect on the overall system’s seepage flow. Therefore, the lower permeability of soil–geotextile composites than protected soil was acceptable. Furthermore, the anticlogging of geotextile filters should be built into the permeability requirements. The current clogging criterion for nonwoven geotextiles filtering fine-grained soils is relatively conservative.
Author Contributions
Funding
Institutional Review Board Statement
Informed Consent Statement
Data Availability Statement
Acknowledgments
Conflicts of Interest
References
- Artières, O.; Tcherniavsky, J.G. Geotextile filtration systems for dams—30 years of improvement. In Proceedings of the 7th International Conference on Geosynthetics (ICG), Lisse, The Netherlands, 1 January 2002; Delmas, G., Girard, H., Eds.; Swets & Zeitlinger: Leiden, The Netherlands; pp. 969–974. [Google Scholar]
- Koerner, R.M. Early background and history of geotextiles. In Geotextiles; Elsevier: Amsterdam, The Netherlands, 2016; pp. 3–15. [Google Scholar]
- Sabiri, N.E.; Caylet, A.; Montillet, A.; Le Coq, L.; Durkheim, Y. Performance of nonwoven geotextiles on soil drainage and filtration. Eur. J. Environ. Civ. Eng. 2020, 24, 670–688. [Google Scholar] [CrossRef]
- Kim, K.H.; Park, N.H.; Kim, H.J.; Shin, J.H. Modelling of hydraulic deterioration of geotextile filter in tunnel drainage system. Geotext. Geomembr. 2020, 48, 210–219. [Google Scholar] [CrossRef]
- Guo, C.Y.; Wu, J.W.; Zhu, Y.; Lin, Z.B.; He, S.; Qian, Y.Z.; Yang, H.; Li, H.; Mao, W. Influence of clogging substances on pore characteristics and permeability of geotextile envelopes of subsurface drainage pipes in arid areas. Geotext. Geomembr. 2020, 48, 735–746. [Google Scholar] [CrossRef]
- Veylon, G.; Stoltz, G.; Meriaux, P.; Faure, Y.H.; Touze-Foltz, N. Performance of geotextile filters after 18 years’ service in drainage trenches. Geotext. Geomembr. 2016, 44, 515–533. [Google Scholar] [CrossRef]
- Koerner, R.M.; Koerner, G.R. Lessons learned from geotextile filter failures under challenging field conditions. Geotext. Geomembr. 2015, 43, 272–281. [Google Scholar] [CrossRef]
- Li, F.Q.; Wang, Z.; Chen, L.; Hu, Y. Research on hydraulic characteristics of partially clogged nonwoven geotextiles under pressure. Rock Soil Mech. 2008, 29, 3128–3132. (In Chinese) [Google Scholar]
- Palmeria, E.M.; Gardoni, M.G.; da Luz, D.W.B. Soil-geotextile filter interaction under high stress levels in the gradient ratio test. Geosynth. Int. 2005, 12, 162–175. [Google Scholar] [CrossRef]
- Wu, C.S.; Hong, Y.S.; Yan, Y.W.; Chang, B.S. Soil-nonwoven geotextile filtration behavior under contact with drainage materials. Geotext. Geomembr. 2006, 24, 1–10. [Google Scholar] [CrossRef]
- Kamruzzaman, A.H.M.; Haque, A.; Bouazza, A. Filtration behavior of granular soils under cyclic load. Geotechnique 2008, 58, 517–522. [Google Scholar] [CrossRef]
- Lafleur, J.; Mlynarek, J.; Rollin, A.L. Filtration of broadly graded cohesionless soils. J. Geotech. Eng. 1989, 115, 1747–1768. [Google Scholar] [CrossRef]
- Gourc, J.P. Training Course: Geosynthetics in Drainage and Filtration. In Proceedings of the 4th Asian Regional Conference on Geosynthetics, Shanghai, China, 17–20 June 2008. [Google Scholar]
- Stoltz, G.; Delmas, P.; Barral, C. Comparison of the behavior of various geotextiles used in the filtration of clayey sludge: An experimental study. Geotext. Geomembr. 2019, 47, 230–242. [Google Scholar] [CrossRef]
- Fannin, R.J.; Vaid, Y.P.; Shi, Y.C. Filtration behavior of nonwoven geotextiles. Can. Geotech. J. 1994, 31, 555–563. [Google Scholar] [CrossRef]
- Shan, H.Y.; Wang, W.L.; Chou, T.C. Effect of boundary conditions on the hydraulic behavior of geotextile filtration system. Geotext. Geomembr. 2001, 19, 509–527. [Google Scholar] [CrossRef]
- Cazzuffi, D.; Moraci, N. Design of geotextile filters in contact with granular soils. In Keynote lecture. In Proceedings of the 4th Asian Regional Conference on Geosynthetics, Shanghai, China, 17–20 June 2008; pp. 142–163. [Google Scholar]
- ASTM D5101-12; Standard Test Method for Measuring the Filtration Compatibility of Soil-Geotextile System. American Society for Testing and Materials: West Conshohocken, PA, USA, 2017.
- Calhoun, C.C. Development of Design Criteria and Acceptance Specifications for Plastic Filter Cloths; U.S. Army Corps of Engineers, Waterways Experiment Station: Vicksburg, MS, USA, 1972; Technical Report S-72-7; pp. 1–83.
- U.S. Army Corps of Engineers. Plastic Fiber Cloth. Civil Works Construction Guide; Specification No. CE-02215; Office, Chief of Engineers: Washington, DC, USA, 1977.
- Palmeria, E.M.; Gardoni, M.G. Drainage and filtration properties of non-woven geotextiles under confinement using different experimental techniques. Geotext. Geomembr. 2002, 20, 97–115. [Google Scholar] [CrossRef]
- Gardoni, M.G.; Palmeria, E.M. Microstructure and pore characteristics of synthetic filters under confinement. Geotechnique 2002, 52, 405–418. [Google Scholar] [CrossRef]
- EN ISO 14688-2; Geotechnical Investigation and Testing—Identification and Classification of Soil—Part 2: Principles for a Classification. International Organization for Standardization: Geneva, Switzerland, 2017.
- Kenney, T.C.; Lau, D. Internal stability of granular filters. Can. Geotech. J. 1985, 22, 215–225. [Google Scholar] [CrossRef]
- Moraci, N.; Mandaglio, M.C.; Cazzuffi, D. Geotextiles with filter function in contact with granular soils: Design criteria and parameters. Ital. Geotech. J. 2010, 2, 45–69. [Google Scholar]
- Fannin, R.J.; Vaid, Y.P.; Shi, Y.C. A critical evaluation of the gradient ratio test. Geotech. Test. J. 1995, 18, 389–390. [Google Scholar]
- ASTM D5101-99; Standard Test Method for Measuring the Soil-Geotextile System clogging potential by the gradient ratio. American Society for Testing and Materials: West Conshohocken, PA, USA, 1999.
- Aydilek, A.H.; Edil, T.B. Long-term filtration performance of nonwoven geotextile-sludge systems. Geosynth. Int. 2003, 10, 110–123. [Google Scholar] [CrossRef]
- Abbaspour, A.; Tanyu, B.F.; Aydilek, A.H. Methodology to evaluate hydraulic compatibility of geotextile and RCA in underdrain systems. Geosynth. Int. 2018, 25, 67–84. [Google Scholar] [CrossRef]
- Palmeira, E.; Fannin, R.; Vaid, Y. A study on the behavior of soil-geotextile systems in filtration tests. Can. Geotech. J. 1996, 33, 899–912. [Google Scholar] [CrossRef]
- Giroud, J.P. Granular filter layer and geotextile filter layer. In Fifth National Geosynthetics Conference; Geosynthetics Engineering Association: Yichang China, 2000; pp. 134–135. [Google Scholar]
- Mannsbart, G.; Christopher, B.R. Long term performance of nonwoven geotextile filters in five coastal and bank protection projects. Geotext. Geomembr. 1997, 15, 207–221. [Google Scholar] [CrossRef]
- ASTM D5199-12; Standard Test Method for Measuring the Nominal Thickness of Geosynthetics. American Society for Testing and Materials: West Conshohocken, PA, USA, 2019.
- Hong, Y.S.; Wu, C.S. Filtration behavior of soil-nonwoven geotextile combinations subjected to various loads. Geotext. Geomembr. 2011, 29, 102–115. [Google Scholar] [CrossRef]
- Giroud, J.P. Granular filters and geotextile filters. In Proceedings of the Geofilters ’96; Lafleur, J., Rollin, A.L., Eds.; Ecole Polytechnique de Montreal: Montreal, QC, Canada, 1996; pp. 565–680. [Google Scholar]
- EN ISO 9863-1; Geosynthetics—Determination of Thickness at Specified Pressures—Part 1: Single Layers. CEN: Brussels, Belgium, 2016.
- Carroll, R.G. Geotextile filter criteria. Transp. Res. Rec. 1983, 916, 46–53. [Google Scholar]
- Giroud, J.P. Filter criteria for geotextiles. In Proceedings of the 2nd International Conference on Geotextiles, Las Vegas, NV, USA, 1–6 August 1982; Volume 1, pp. 103–108. [Google Scholar]
- Christopher, B.R.; Holtz, R.D. Geotextile Engineering Manual; United States Department of Transportation, Federal Highway Administration: Washington, DC, USA, 1985; Report No. FHWA-TS-86/203.
- GB/T 50290-2014; Technical Code for Application of Geosynthetics. Ministry of Water Resources of China, China Plan Publishing House: Beijing, China, 2014.
- Lafleur, J. Selection of geotextiles to filter broadly graded cohesionless soils. Geotext. Geomembr. 1999, 17, 299–312. [Google Scholar] [CrossRef]
- Cedergren, H.R. Seepage, Drainage and Flow Nets, 3rd ed.; John Wiley & Sons, Inc.: New York, NY, USA, 1989. [Google Scholar]


| Property | Nonwoven Geotextiles | |||
|---|---|---|---|---|
| GT1 | GT2 | GT3 | GT4 | |
| Thickness tGT (1) (mm) | 1.0 | 1.9 | 2.8 | 3.2 |
| Mass per unit area MA (g/m2) | 125 | 200 | 300 | 400 |
| Filtration opening size O95 (2) (mm) | 0.17 | 0.12 | 0.077 | 0.066 |
| Permeability kn (3) (m/s) | 4.33 × 10⁻³ | 4.27 × 10⁻³ | 3.73 × 10⁻³ | 3.28 × 10⁻³ |
| Density of the fibres ρf (kg/m3) | 1320 | 1320 | 1320 | 1320 |
| Porosity n (4) | 0.90 | 0.92 | 0.92 | 0.91 |
| Fiber diameter df (mm) | 0.018 | 0.018 | 0.016 | 0.015 |
| Specific surface area per unit area Sa (5) (m2/m2) | 22.2 | 33.7 | 56 | 76.8 |
| Parameter | Silty Clay (Stable) | Silt (Unstable) |
|---|---|---|
| d10 (mm) | 0.0002 | 0.001 |
| d15 (mm) | 0.0004 | 0.0085 |
| d30 (mm) | 0.0015 | 0.0279 |
| d50 (mm) | 0.0039 | 0.0363 |
| d60 (mm) | 0.0059 | 0.0408 |
| d85 (mm) | 0.0177 | 0.0768 |
| Cu | 29.5 | 40.8 |
| Cc | 1.91 | 19.08 |
| Permeability coefficient (m/s) | 2.70 × 10⁻⁹ | 4.10 × 10⁻⁷ |
| Particle Diameter, d (mm) | Point Coordinate (Fn; Hn) | Notes |
|---|---|---|
| 0.0003 | (F0; H0) = (5; 5) | Fn = mass fraction smaller than the particle size d; Hn = mass fraction between particle sizes d and 4d. |
| 0.0012 | (F1; H1) = (10; 4) | |
| 0.0048 | (F2; H2) = (14; 6) | |
| 0.0192 | (F3; H3) = (20; 64) | |
| 0.0768 | (F4; H4) = (84; 16) | |
| 0.3072 | (F5; H5) = (100; 0) |
| Test Group | Normal Stress (kPa) | Protected Soil | Geotextiles | Hydraulic Gradient |
|---|---|---|---|---|
| T1~T8 | 0 | C/M | GT1 GT2 GT3 GT4 | i = 1.0 |
| T9~T16 | 5 | |||
| T17~T24 | 10 | |||
| T25~T32 | 15 | |||
| T32~T40 | 25 |
| Normal Stress (kPa) | Fine Particles Retained in Geotextile Fibers (g/m2) (i = 1.0) | |||||||
|---|---|---|---|---|---|---|---|---|
| GT1 | GT2 | GT3 | GT4 | |||||
| C | M | C | M | C | M | C | M | |
| 0 | 127 | 459 | 271 | 465 | 437 | 503 | 605 | 610 |
| 5 | 318 | 506 | 415 | 510 | 555 | 578 | 690 | 701 |
| 10 | 306 | 543 | 425 | 544 | 532 | 666 | 704 | 768 |
| 15 | 471 | 627 | 441 | 662 | 558 | 726 | 724 | 916 |
| 25 | 586 | 708 | 531 | 715 | 698 | 839 | 846 | 939 |
| Soil | Geotextile | Coefficient of Permeability (10−9 m/s) | GR | O95/d85 | Mass of Particles Retained Inside Geotextile (g/m2) | |||||
|---|---|---|---|---|---|---|---|---|---|---|
| ks | ksg | ks | ksg | 0 kPa | 5 kPa | |||||
| 0 kPa | 0 kPa | 5 kPa | 5 kPa | 0 kPa | 5 kPa | |||||
| C | GT1 | 3.44 | 3.17 | 2.69 | 2.45 | 1.08 | 1.10 | 9.6 | 127 | 318 |
| GT1 * | 3.46 | 3.19 | 2.68 | 2.44 | 1.10 | 1.07 | 9.6 | 140 | 332 | |
| GT4 | 2.0 | 2.44 | 1.99 | 1.81 | 0.82 | 1.10 | 3.73 | 605 | 690 | |
| GT4 * | 2.2 | 2.45 | 2.0 | 1.83 | 0.89 | 1.09 | 3.73 | 623 | 700 | |
| Soil | Geotextile | Normal Stress (kPa) | ksg (m/s) | ks (m/s) | kR | GR |
|---|---|---|---|---|---|---|
| Silty clay (C) | GT1 | 0 | 3.17 × 10⁻⁹ | 3.44 × 10⁻⁹ | 1.08 | 1.08 |
| 5 | 2.45 × 10⁻⁹ | 2.69 × 10⁻⁹ | 1.10 | 1.10 | ||
| 10 | 1.47 × 10⁻⁹ | 1.71 × 10⁻⁹ | 1.16 | 1.16 | ||
| 15 | 1.36 × 10⁻⁹ | 1.63 × 10⁻⁹ | 1.20 | 1.20 | ||
| 25 | 1.09 × 10⁻⁹ | 1.51 × 10⁻⁹ | 1.38 | 1.38 | ||
| GT2 | 0 | 2.28 × 10⁻⁹ | 2.98 × 10⁻⁹ | 1.31 | 1.31 | |
| 5 | 2.01 × 10⁻⁹ | 2.72 × 10⁻⁹ | 1.35 | 1.35 | ||
| 10 | 1.55 × 10⁻⁹ | 2.27 × 10⁻⁹ | 1.46 | 1.46 | ||
| 15 | 1.25 × 10⁻⁹ | 1.89 × 10⁻⁹ | 1.52 | 1.52 | ||
| 25 | 1.11 × 10⁻⁹ | 1.77 × 10⁻⁹ | 1.60 | 1.60 | ||
| GT3 | 0 | 2.95 × 10⁻⁹ | 2.36 × 10⁻⁹ | 0.80 | 0.80 | |
| 5 | 2.45 × 10⁻⁹ | 2.49 × 10⁻⁹ | 1.02 | 1.02 | ||
| 10 | 1.62 × 10⁻⁹ | 2.10 × 10⁻⁹ | 1.30 | 1.30 | ||
| 15 | 1.01 × 10⁻⁹ | 1.94 × 10⁻⁹ | 1.92 | 1.92 | ||
| 25 | 6.09 × 10⁻¹⁰ | 1.45 × 10⁻⁹ | 2.39 | 2.39 | ||
| GT4 | 0 | 2.44 × 10⁻⁹ | 2.0 × 10⁻⁹ | 0.82 | 0.82 | |
| 5 | 1.81 × 10⁻⁹ | 1.99 × 10⁻⁹ | 1.10 | 1.10 | ||
| 10 | 1.26 × 10⁻⁹ | 1.66 × 10⁻⁹ | 1.32 | 1.31 | ||
| 15 | 7.28 × 10⁻¹⁰ | 1.59 × 10⁻⁹ | 2.18 | 2.18 | ||
| 25 | 4.64 × 10⁻¹⁰ | 1.33 × 10⁻⁹ | 2.88 | 3.03 |
| Soil | Geotextile | Normal Stress (kPa) | ksg (m/s) | ks (m/s) | kR | GR |
|---|---|---|---|---|---|---|
| Silt (M) | GT1 | 0 | 4.09 × 10⁻⁷ | 4.18 × 10⁻⁷ | 1.02 | 1.02 |
| 5 | 3.04 × 10⁻⁷ | 3.49 × 10⁻⁷ | 1.15 | 1.15 | ||
| 10 | 1.55 × 10⁻⁷ | 2.14 × 10⁻⁷ | 1.38 | 1.38 | ||
| 15 | 1.11 × 10⁻⁷ | 1.61 × 10⁻⁷ | 1.45 | 1.45 | ||
| 25 | 5.36 × 10⁻⁸ | 8.88 × 10⁻⁸ | 1.66 | 1.66 | ||
| GT2 | 0 | 3.54 × 10⁻⁷ | 3.86 × 10⁻⁷ | 1.09 | 1.09 | |
| 5 | 2.49 × 10⁻⁷ | 3.26 × 10⁻⁷ | 1.31 | 1.31 | ||
| 10 | 1.78 × 10⁻⁷ | 2.52 × 10⁻⁷ | 1.42 | 1.41 | ||
| 15 | 1.10 × 10⁻⁷ | 1.63 × 10⁻⁷ | 1.48 | 1.48 | ||
| 25 | 6.22 × 10⁻⁸ | 1.10 × 10⁻⁷ | 1.77 | 1.77 | ||
| GT3 | 0 | 3.84 × 10⁻⁷ | 4.27 × 10⁻⁷ | 1.11 | 1.11 | |
| 5 | 2.50 × 10⁻⁷ | 2.73 × 10⁻⁷ | 1.09 | 1.39 | ||
| 10 | 1.57 × 10⁻⁷ | 2.30 × 10⁻⁷ | 1.46 | 1.46 | ||
| 15 | 1.08 × 10⁻⁷ | 1.72 × 10⁻⁷ | 1.58 | 1.58 | ||
| 25 | 5.70 × 10⁻⁸ | 1.03 × 10⁻⁷ | 1.80 | 1.80 | ||
| GT4 | 0 | 3.35 × 10⁻⁷ | 4.10 × 10⁻⁷ | 1.22 | 1.22 | |
| 5 | 2.19 × 10⁻⁷ | 3.16 × 10⁻⁷ | 1.44 | 1.44 | ||
| 10 | 1.47 × 10⁻⁷ | 2.23 × 10⁻⁷ | 1.52 | 1.52 | ||
| 15 | 1.03 × 10⁻⁷ | 1.74 × 10⁻⁷ | 1.69 | 1.69 | ||
| 25 | 5.09 × 10⁻⁸ | 9.85 × 10⁻⁸ | 1.93 | 1.93 |
| Natural Soils | Silty-Clay (C) | Silt (M) | ||||||
|---|---|---|---|---|---|---|---|---|
| GT Type | Thin GT2 | Thick GT4 | Thin GT2 | Thick GT4 | ||||
| Normal stress (kPa) | 0 | 25 | 0 | 25 | 0 | 25 | 0 | 25 |
| Total flow volume (cm3) | 10.05 | 6.52 | 8.87 | 5.1 | 894.2 | 374.1 | 865.7 | 360.7 |
| Average flow rate (cm3/h) | 0.21 | 0.14 | 0.18 | 0.11 | 18.63 | 7.79 | 18.04 | 7.51 |
| Final soil void ratio | 1.02 | 0.99 | 1.02 | 0.98 | 0.89 | 0.85 | 0.89 | 0.86 |
| Kinit. (10−8 m/s) | 0.41 | 1.03 | 1.06 | 0.59 | 173 | 134 | 170 | 132 |
| Kfinal (10−8 m/s) | 0.31 | 0.18 | 0.24 | 0.09 | 39.50 | 8.90 | 40.20 | 8.51 |
| Final Krel | 0.77 | 0.17 | 0.22 | 0.15 | 0.23 | 0.07 | 0.24 | 0.06 |
| Final (RPV) | 0.0002 | 0.0001 | 0.00017 | 0.00007 | 0.034 | 0.0074 | 0.032 | 0.0068 |
| Fine particles retained (g/m2) | 271 | 531 | 605 | 846 | 465 | 715 | 610 | 939 |
| Filtration result | clog | clog | clog | clog | clog | Blind + clog | clog | Blind + clog |
Publisher’s Note: MDPI stays neutral with regard to jurisdictional claims in published maps and institutional affiliations. |
© 2022 by the authors. Licensee MDPI, Basel, Switzerland. This article is an open access article distributed under the terms and conditions of the Creative Commons Attribution (CC BY) license (https://creativecommons.org/licenses/by/4.0/).
Share and Cite
Du, C.; Xu, C.; Yang, Y.; Wang, J. Filtration Performance of Nonwoven Geotextile Filtering Fine-Grained Soil under Normal Compressive Stresses. Appl. Sci. 2022, 12, 12638. https://doi.org/10.3390/app122412638
Du C, Xu C, Yang Y, Wang J. Filtration Performance of Nonwoven Geotextile Filtering Fine-Grained Soil under Normal Compressive Stresses. Applied Sciences. 2022; 12(24):12638. https://doi.org/10.3390/app122412638
Chicago/Turabian StyleDu, Chunxue, Chao Xu, Yang Yang, and Jiangfeng Wang. 2022. "Filtration Performance of Nonwoven Geotextile Filtering Fine-Grained Soil under Normal Compressive Stresses" Applied Sciences 12, no. 24: 12638. https://doi.org/10.3390/app122412638
APA StyleDu, C., Xu, C., Yang, Y., & Wang, J. (2022). Filtration Performance of Nonwoven Geotextile Filtering Fine-Grained Soil under Normal Compressive Stresses. Applied Sciences, 12(24), 12638. https://doi.org/10.3390/app122412638