Article

Laser Generated Broadband Rayleigh Waveform Evolution for Metal Additive Manufacturing Process Monitoring

by
Chaitanya Bakre
1,
Seyed Hamidreza Afzalimir
1,
Cory Jamieson
2,
Abdalla Nassar
2,
Edward W. Reutzel
2 and
Cliff J. Lissenden
1,*
1
Engineering Science and Mechanics, Penn State University, State College, PA 16801, USA
2
Applied Research Laboratory, Penn State University, State College, PA 16801, USA
*
Author to whom correspondence should be addressed.
Appl. Sci. 2022, 12(23), 12208; https://doi.org/10.3390/app122312208
Submission received: 27 October 2022 / Revised: 26 November 2022 / Accepted: 26 November 2022 / Published: 29 November 2022
(This article belongs to the Special Issue Application of Laser-Ultrasonics in Metal Processing)

Abstract

:

Featured Application

Process monitoring of additive manufacturing of metals for material nonlinearity using finite amplitude ultrasonic Rayleigh waves.

Abstract

This work proposes that laser pulses can generate finite amplitude Rayleigh waves for process monitoring during additive manufacturing. The noncontact process monitoring uses a pulsed laser to generate Rayleigh waves, and an adaptive laser interferometer to receive them. Experiments and models in the literature show that finite amplitude waveforms evolve with propagation distance and that shocks can even form in the in-plane particle velocity waveform. The nonlinear waveform evolution is indicative of the material nonlinearity, which is sensitive to the material microstructure, which in turn affects strength and fracture properties. The measurements are made inside a directed energy deposition additive manufacturing chamber on planar Ti-6Al-4V and IN-718 depositions. By detecting the out-of-plane particle displacement waveform, the in-plane displacement and velocity waveforms are also available. The waveform evolution can be characterized (i) for one source amplitude by reception at different points or (ii) by reception at one point by applying different source amplitudes. Sample results are provided for intentionally adjusted key process parameters: laser power, scan speed, and hatch spacing.

1. Introduction

The study of nonlinear ultrasonics for nondestructive evaluation of engineering materials has predominately focused on the generation of higher harmonics from a monochromatic source and combinational harmonics from the mixing of narrowband waves. Many authors (e.g., [1,2,3]) have used second harmonic generation as a sensitive indicator of material degradation. In an effort to minimize the effects of measurement system nonlinearity other authors (e.g., [4,5,6]) have mixed waves to create mutual interactions that transfer wave energy to the sum and difference frequencies. Acoustoelasticity is another nonlinear ultrasound phenomenon that has been used to nondestructively determine stress (e.g., [7,8]). In comparison, broadband Rayleigh waveforms have rarely been used for nondestructive evaluation purposes even though the wave propagation physics are well defined by focused laser ultrasound efforts in the 1990s and 2000s (as reviewed below).
The objective of this article is to show that the nonlinear evolution of broadband Rayleigh waveforms generated by short-duration laser pulses provide a novel nondestructive material characterization capability that could be useful for in-situ process monitoring during the additive manufacturing of metals. Specifically, the directed energy deposition method of additive manufacturing is addressed here. While the laser ultrasound system would be capable of typical linear measurements, nonlinear measurements sensitive to the material microstructure are the focus. Ultimately, this capability could improve the quality assurance testing of high-value components and provide feedback for process control.
We start by reviewing literature on laser generated finite amplitude surface waves, after which models that characterize the waveform evolution are described. These models will be crucial for solving the inverse problem for the material parameters based on the waveform evolution, although that is not part of the current work. Then we turn to the application of additive manufacturing (AM) and describe the laser ultrasound system that is integrated into a directed energy deposition additive manufacturing (DED-AM) chamber and the methods that we use. Before presenting DED-AM chamber results we show the waveform evolution with propagation distance for Ti-6Al-4V. Then selected results for Ti-6Al-4V and IN-718 depositions are reported for intentionally adjusted DED-AM process parameters.

1.1. Laser Generated Finite Amlitude Rayleigh Waves

Pulses from a Q-switched Nd:YAG laser formed into an intense beam nominally 6–15 mm long and 0.05 mm wide can generate finite amplitude surface waves that can be approximated as planar for a reasonable range of propagation distances. In practice, the laser pulses usually have a wavelength of 1064 nm, a duration of ~7 ns, and energies in the 100–200 mJ range. The transduction from light (electromagnetic wave) energy to sound (elastic wave) energy can be enhanced by a thin layer of light-absorbing fluid on the surface. If the solid media is isotropic, homogeneous, and well represented by a half-space having a traction-free surface, then Rayleigh waves are the dominant type of wave generated. Given the short pulse duration, the Rayleigh waves are broadband and have finite amplitudes associated with extremely high stresses that cause nonlinear evolution of the waveform with propagation distance. In this literature investigating the physics of nonlinear surface wave pulses [9,10,11,12], and their application to surface cleaning [13], characterization [14,15,16], and fracture [17,18,19,20], the dual-probe-beam deflection method with continuous wave lasers (~4 μm spot size) was used to determine the surface slope at two points separated by about 16 mm. The surface slope is proportional to the out-of-plane particle velocity component, v3. In this article, without loss of generality, we take the Rayleigh waves to propagate in the x1 direction and the outward normal to the surface to be in the negative x3 direction. If the surface slope measurement is properly calibrated then v3 has engineering units (e.g., m/s). A smooth surface is required for this detection method because the small diameter beam is reflected at an oblique angle from the surface to a photodetector. The in-plane particle velocity v1 can be computed using the Hilbert transform and may have clearly defined shock fronts, which depend upon the algebraic sign of the nonlinearity parameters [11]. Experimental studies on fused quartz [9,11,18], fused silica [10,14], aluminum [14], stainless steel [12,15,16], and single-crystal silicon [9,13,17,18,19,20] are reported. Single-crystal silicon is anisotropic, therefore the waves are not Rayleigh waves, but rather are described simply as surface acoustic waves (SAWs).
Waveform evolution occurs because the particle velocity depends on the wave amplitude, which varies with depth. Shock formation occurs in the v1 Rayleigh waveform in a similar fashion to shock formation in fluids, depending upon the ‘sign of the nonlinearity’ as described below. Herein, we refer to the material parameter ε 1 used in the Gusev et al model [21,22] for the sign of the nonlinearity, as it has been shown to dominate the waveform evolution [14]. Materials with positive ε 1 nonlinearity parameter tend to have a v1 waveform described by a large negative peak followed by a smaller positive peak as shown in Figure 1. The negative peak travels faster than the positive peak resulting in waveform compression, or steepening, leading to a higher peak frequency known as a frequency up-conversion. If the steepening is sufficiently high, it can cause shock formation. Materials with negative ε 1 nonlinearity parameter tend to have a v1 waveform described as an inverted N-shape as sketched in Figure 1, where the leading negative peak travels faster than the trailing positive peak. When this occurs, the peaks separate, resulting in a lower peak frequency known as a frequency down-conversion. In this case, shock fronts can form at the leading and trailing edges. We will see that nonlinearity in the v3 Rayleigh waveform is evident by sharpening of the negative peak for material with positive nonlinearity and widening of the valley between the positive peaks for material with negative nonlinearity.
The evolution of the v1 Rayleigh waveform from a sinusoid to sawtooth-like is described theoretically by two different models. The first model represents the wavefield as a Fourier series and uses Hamilton’s principle to determine the amplitudes of the harmonics [23,24,25,26,27,28]. The second model makes no a-priori assumption about the displacement profiles of the harmonics and uses the slowly varying wave profile method (described by Rudenko and Soluyan [29]) to handle the secular terms associated with shock front formation [21,22]. Both models have been shown to predict shock wave formation in good agreement with experimental results; i.e.,
(1)
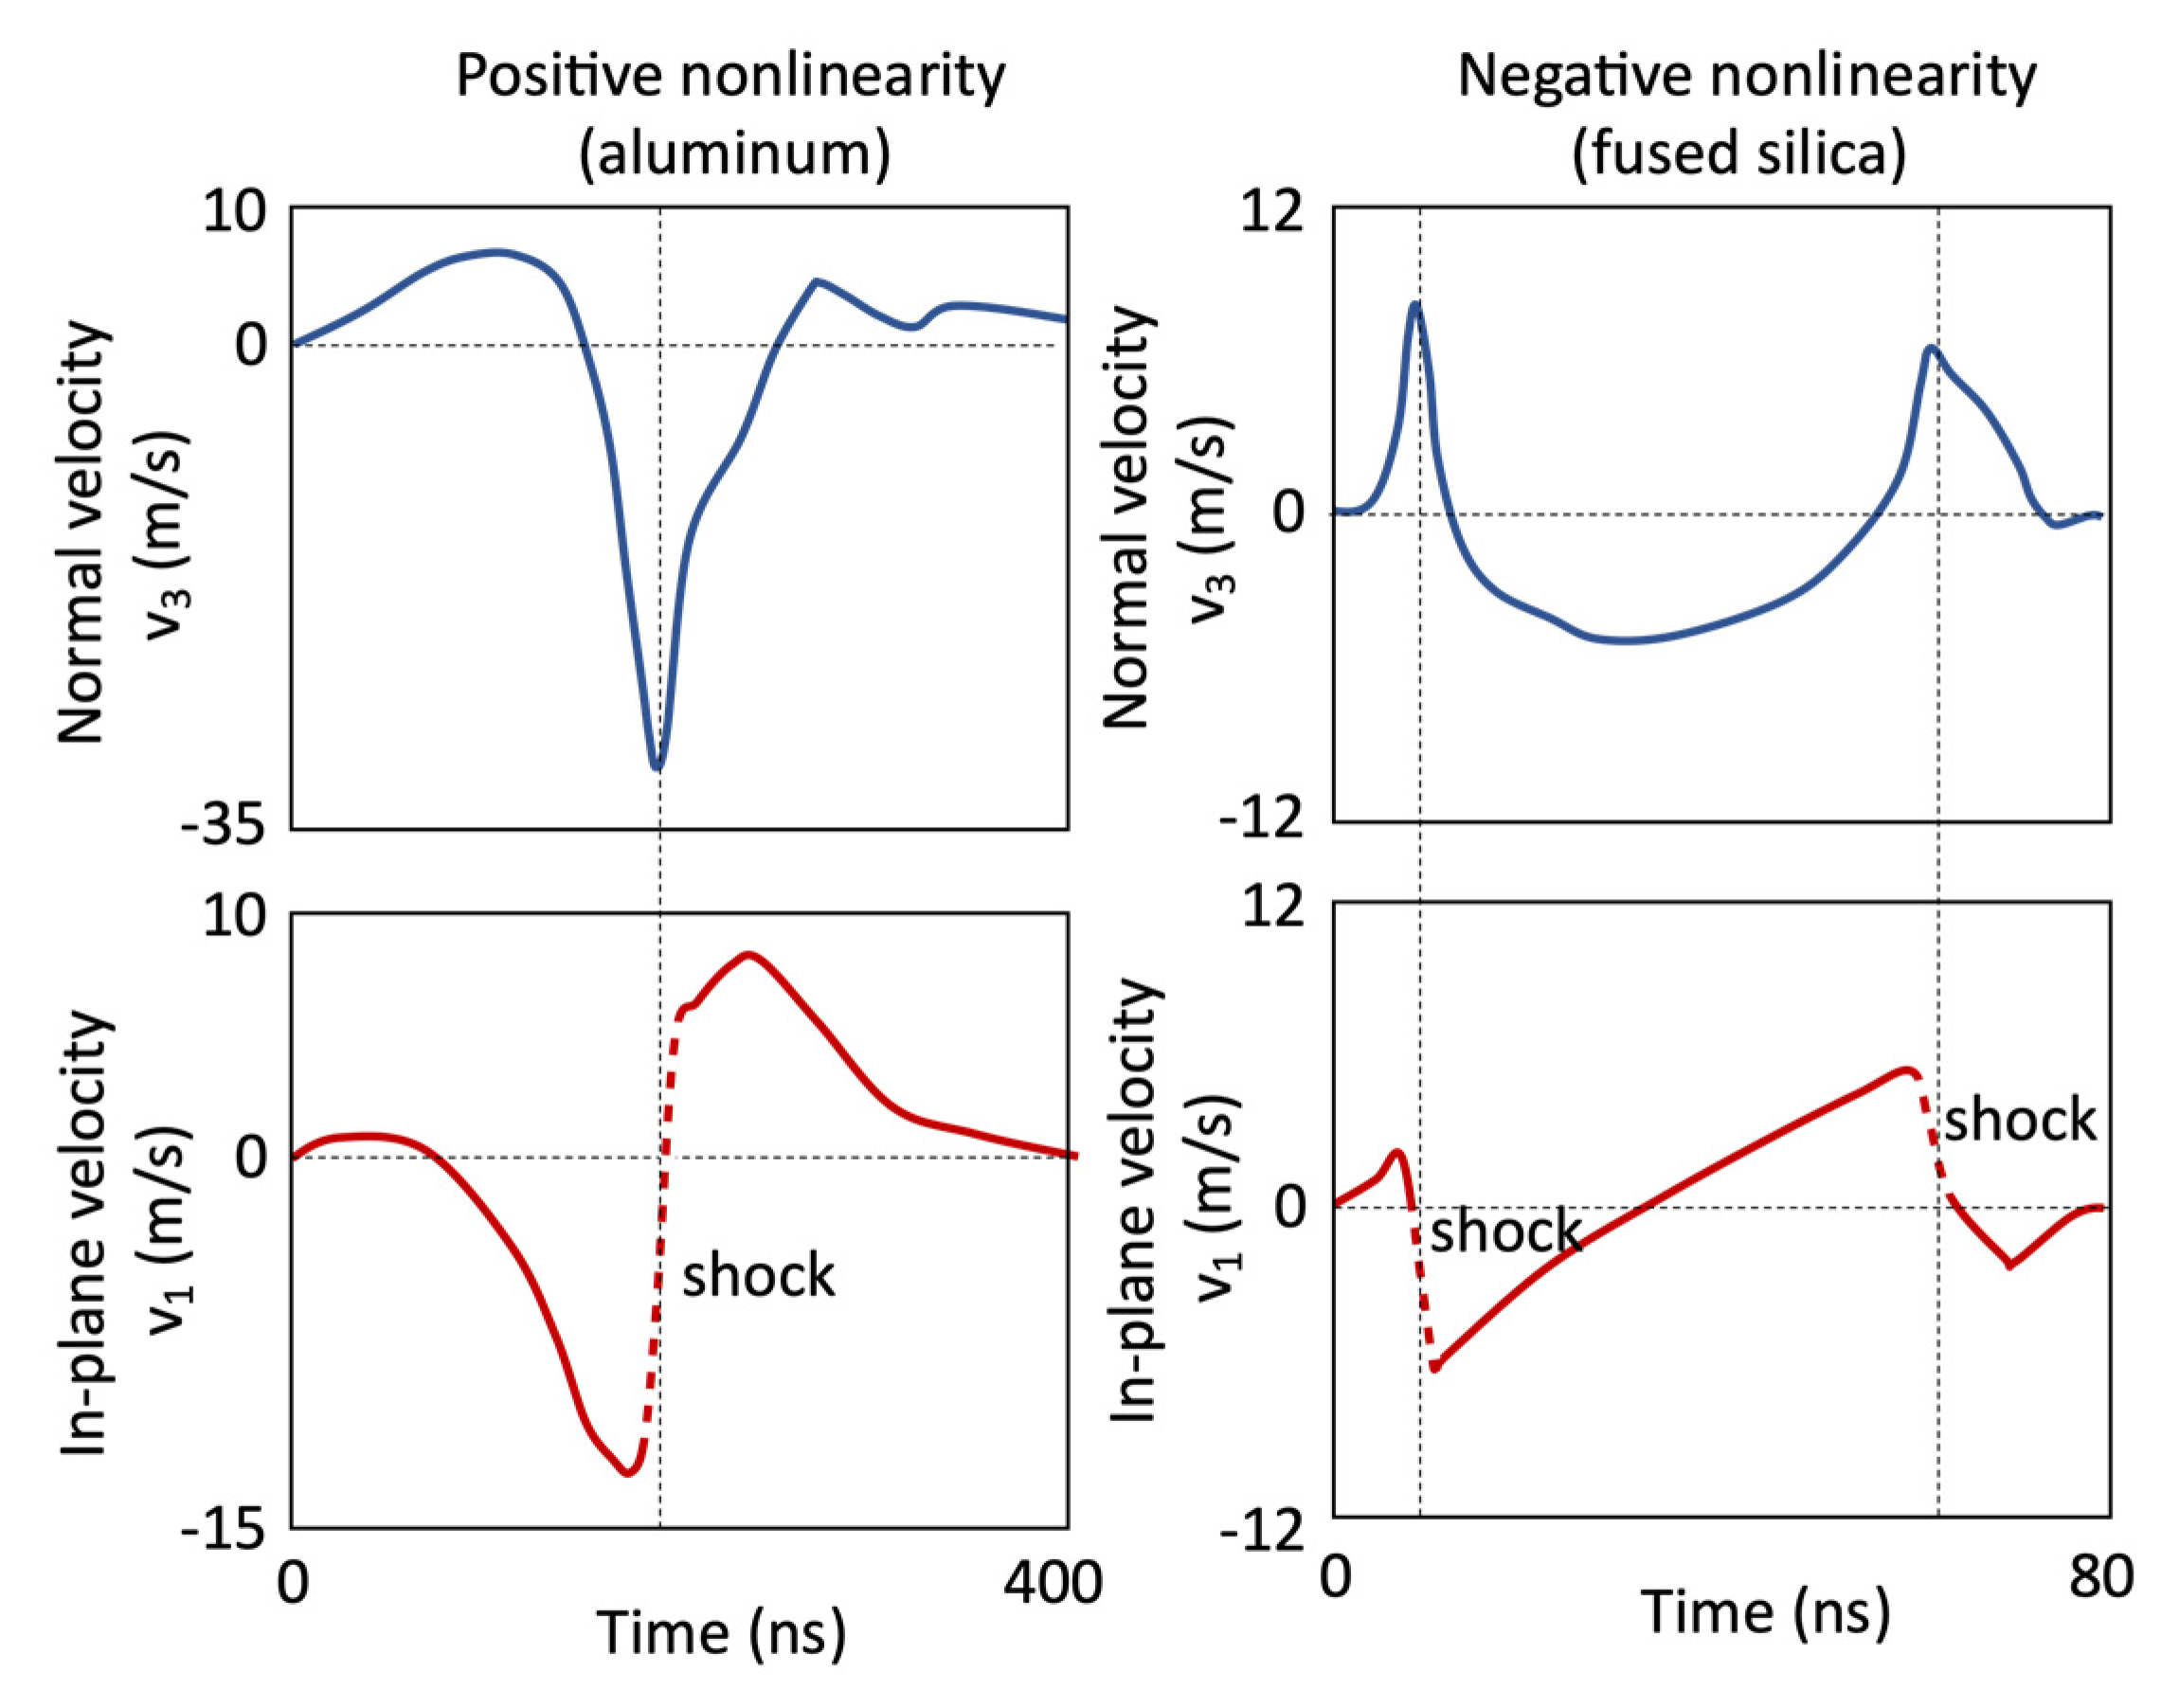
for materials having a ‘positive nonlinearity’ the shock front in the v1 waveform corresponds with a negative spike-like pulse in the v3 waveform that narrows with increasing amplitude with propagation,
(2)
for materials having a ‘negative nonlinearity’ shock fronts in the v1 waveform form at the leading and trailing edges, which correspond to two positive peaks in the v3 waveform that are separating as the valley between them expands with propagation.
The workhorse aerospace alloys Ti-6Al-4V and IN-718 are of interest in the current work. These polycrystalline metals have a positive nonlinearity and are therefore expected to display evolution towards a single, spike-like pulse in the v3 waveform and towards shock formation in the v1 waveform as in case (1) above. We consider the application of Rayleigh waveform evolution for process monitoring during additive manufacturing, therefore the use of an absorbent fluid on the surface is impractical, making shock formation unlikely.
The prior experiments used the dual-probe-beam deflection method to detect the surface slope and compute the v3 particle velocity component, which is impractical in the additive manufacturing environment. Instead, an adaptive laser interferometer is used to measure the u3 particle displacement component. Time differentiation of the time series u3 data enables computation of v3, and the Hilbert transform can be used to compute the in-plane components u1 and v1. To show what these four components look like for a metal (i.e., a polycrystalline aluminum alloy) having positive nonlinearity, we have digitized the v3 waveform from Kolomenskii and Schuessler [14] and then computed the associated waveforms. The Kolomenskii and Schuessler [14] results are plotted in Figure 2 at the propagation distances of 13.9 and 26.7 mm.
The waveform evolution predicted by the Shull et al. [24] model for an IN-718 half-space using the material parameters (ρ = 8170 kg/m3, λ = 121 GPa, µ = 80 GPa, A = −484 GPa, B = −382 GPa, C = −174 GPa) determined by Gartsev and Köhler [30] is shown in Figure 3. The waveform evolution is from a sinusoid to a cusped sawtooth as the propagation distance increases. A shock front occurs in the v1 waveform due to steepening, while the v3 initial cosine-shape evolves into a negative spike with increasing amplitude. The displacement component waveform evolutions are much different, with u1 steepening and its peak sharpening and u3 exhibiting some sharpening, but retaining its overall character. The next section introduces process monitoring for additive manufacturing.

1.2. Additive Manufacturing Process Monitoring

Additive manufacturing (AM) is a promising technology for manufacturing a wide range of components and complex geometries directly from computer-aided design files. The rapid on-demand fabrication of parts has attracted many high-value applications in the medical, energy, aerospace, and defense sectors. However, AM technology is still maturing, and the complex physical and metallurgical processes during deposition may lead to undesired microstructure, and therefore undesirable properties (e.g., yield strength, fracture strength, fatigue strength, creep strength) in the final part. The phase transitions, thermal behavior, and melt pool behavior during the AM process strongly depend on the process parameters such as hatch spacing, processing speed, laser power and are difficult to observe in real-time [31]. Subtle changes in the process parameters can lead to undesired microstructure in a part or variability from one part to another [32]. Thus, an in-situ monitoring technique sensitive to changes in the microstructure of the part is highly desirable.
A multitude of in-situ monitoring strategies have been and are actively being explored for AM, and laser ultrasonics is considered a promising candidate. Given the tremendous interest in in-situ monitoring for AM it is not possible to provide a comprehensive review in this work, but interested readers are advised to consult the numerous review articles that have been published on in-situ monitoring of AM in recent years [33,34,35,36,37,38,39,40], and a few of the more important strategies are touched on below. Monitoring the deposition laser (or electron) beam characteristics, process characteristics, and motion characteristics are typical strategies used for in-situ AM monitoring [41,42]. Another common strategy is to study the melt pool dynamics, as they are critical in determining the quality of the AM deposition. Alternatively, optical emission monitoring is developing as a means to assess process stability [43,44]. In contrast, ultrasonic techniques for in-situ monitoring of AM are unique because they are able to detect internal defects with high sensitivity.
Honarvar and Farahani [45] and others [46,47,48,49,50] conducted in-depth reviews of ultrasonic techniques for nondestructive testing of AM. While most traditional ultrasonic inspection techniques are difficult or impractical for in-situ monitoring of AM, laser ultrasound is identified as one of the suitable candidates as it is noncontact [40,51]. Thus, a significant amount of research is currently underway on laser ultrasonic characterization and monitoring of AM material [52,53,54,55,56,57,58]. We note that x-ray computed tomography is an excellent tool for ex-situ quality assurance testing, but it is not well-suited for process monitoring.
Unique considerations for using laser ultrasound as a means to monitor the AM process include:
  • the act of monitoring should not impede the manufacturing process;
  • detection of both flaws and micro/mesostructure variations that affect mechanical properties are important;
  • the surface of the deposited material is rough.
It is well-known that fully noncontact laser ultrasound systems are suitable for many manufacturing environments. Likewise, the scattering of Rayleigh waves from surface and near-surface flaws makes them useful for flaw detection. The novelty of the current work is that it investigates the potential for laser generated broadband Rayleigh waves to provide useful in-situ information about material nonlinearity that can reasonably be expected to influence mechanical performance of the deposited material. Moreover, the laser ultrasound system will perform process monitoring in-situ on rough surfaces.

2. Materials and Methods

Many details of the materials and methods used in this work are described in recent related publications [59,60,61] and are not repeated here. The laser ultrasound (LU) system was integrated into a LENS MR-7 Optomec DED-AM chamber as shown in Figure 4. Multiple layers of Ti-6Al-4V and IN-718 were deposited onto baseplates of the same material. The deposition process was periodically interrupted to translate the ‘build’ into position to interrogate the deposition with laser generated Rayleigh waves.
Rayleigh waves are generated using a Q-switched Nd:YAG pulsed laser (Inlite III-10, Continuum, Milpitas, CA, USA) with a 6 ns pulse duration and an 8 Hz repetition rate. The laser beam with an initial diameter of 7 mm is first expanded using a 3X beam expander and then reflected using a mirror (Parts 35-099 and 38-900, Edmond Optics Inc., Barrington, NJ, USA) onto a cylindrical lens (LJ1703RM-B, Thorlabs Inc., Newton, NJ, USA) that forms a nominally 15 mm × 0.36 mm linear footprint on the specimen surface. The stand-off distance for the cylindrical lens is approximately equal to its focal length (FL = 75 mm). The linear source actuates broadband Rayleigh waves that are received by a dynamic holographic interferometer based on two-wave mixing in a photorefractive crystal [62]. We reiterate that, unlike previous work [9,10,11,12,13,14,15,16,17,18,19,20], absorbent liquid was not used on the surface to amplify the transduction, nor is the dual-probe-beam deflection method used for detection.
The laser interferometer (AIR-1550-TWM, Intelligent Optical Systems Inc., Torrance, CA, USA) detects the out-of-plane displacement u3 at a point on the surface. Its adaptability to variable surface roughness and reflectivity makes it a critical component in the system. The reception laser head is mounted on an XY stage to enable scanning along the centerline of the nominally planar wavefield. In addition to the benefits of the two-wave mixing approach, the interferometer has two output signals – AC (alternating current) and DC (direct current). The AC signal contains the time-varying voltage proportional to the surface displacements, while the DC level provides a measure of the light reflected from the surface. Thus, normalizing the AC signal by the DC level provides a means to compare the signals obtained from surfaces with varying roughness and reflectivity. Additionally, the wave propagation distance is kept low to minimize the attenuation and diffraction effects and improve the signal-to-noise ratio (SNR). When scanning across the hatches, the scan increment is a multiple of the hatch spacing, such that the reception laser beam is focused on the top of each track, thereby maximizing the light collected by the reception laser head.
As the build height increases the deposition head (part b in Figure 4) moves up, taking the reception laser head (part c) and the cylindrical lens (part d) with it. For the relatively small build heights used here, there is no need to change the angle of the mirror (part e).
The reception laser head is scanned along the centerline of the Rayleigh wavefield. The AC and DC ports of the laser interferometer are connected to an oscilloscope (InfiniiVision MSOX3024T, Keysight, Santa Rosa, CA, USA) to observe and record the wave signals. Synchronous averaging (128 times unless specified otherwise) increases the SNR. The AC signals are normalized with respect to the DC level. Matlab algorithms are used for further processing the recorded signals.
In addition to in-situ experiments in the DED-AM chamber, experiments were also conducted on a LU test bed. The test bed was setup to mimic the in-situ experiments. The u3 waveform was received and processed, from which the u1 waveform was computed using the Hilbert transform [14]
u 1 ( τ ) = 1 γ H ( u 3 ( τ ) )
H ( u 3 ) = 1 π Pr u 3 ( t ) d t t t
where τ = t x 1 / c is the retarded time,
γ = [ 1 δ / δ 1 1 δ ] 1 / 4
δ = [ c R c T ] 2 δ 1 = [ c L c T ] 2
and c R , c T , and c L are the Rayleigh, transverse (shear), and longitudinal wave speeds respectively. Pr represents the principal value of the integral. Then the displacement waveforms are differentiated with respect to time to obtain the v3 and v1 waveforms as was described relative to Figure 2. Scanning experiments were conducted for the baseplate and the as-built deposition in our laser ultrasound testbed (i.e., not in the DED-AM chamber). Prior work documented that wrought baseplate Ti-6Al-4V has different nonlinearity than DED-AM as-built Ti-6Al-4V [60]. In addition, prior experiments [59] indicate that the surface roughness affects the nonlinearity, at least partially due its effect on attenuation. In addition, an experiment was conducted at low pulse energy to clarify linear from nonlinear behavior.
Selected results are presented from laser ultrasound experiments conducted inside the DED-AM chamber on depositions having the artificially changed process parameters given in Table 1. It is our experience that the speed and power of the deposition laser and the hatch spacing are important parameters relative to the mechanical behavior of the material and are readily adjustable. The changed parameters are not intended to create isolated flaws, but rather influence the material micro/meso-structure in subtle ways. Results from the four build sequences described in Table 2 are presented. The Ti-6Al-4V and IN-718 baseplates (process parameter sets A and D respectively) are 10 mm thick and typical cross-sections are shown in Figure 5.
Surface profilometry (using Newview NX2, Zygo, Middlefield, CT, USA) was used to quantify the surface roughness with ISO 25178-2 areal parameters: Sa, Sq, and Sz, which are the arithmetic mean height, root mean square height, and maximum height respectively. The results provided in Table 3 show that the variations in process parameters had a more significant effect on roughness for IN-718 than for Ti-6Al-4V. The effect of process parameters on surface roughness (and microstructure) is analyzed in more detail by Dong et al. [63]. Clearly, the AM depositions are much rougher than their respective baseplates, but the effect that the variation in process parameters has on roughness is minor in comparison.

3. Results

Experimental results are presented first that demonstrate how the laser generated Rayleigh wave pulses evolve with propagation distance when the amplitude is large. Then results obtained from within the DED-AM chamber are presented for materials having intentionally off-normal process parameters to demonstrate the capability of the new approach. In all cases the Rayleigh waves propagated across the hatches.

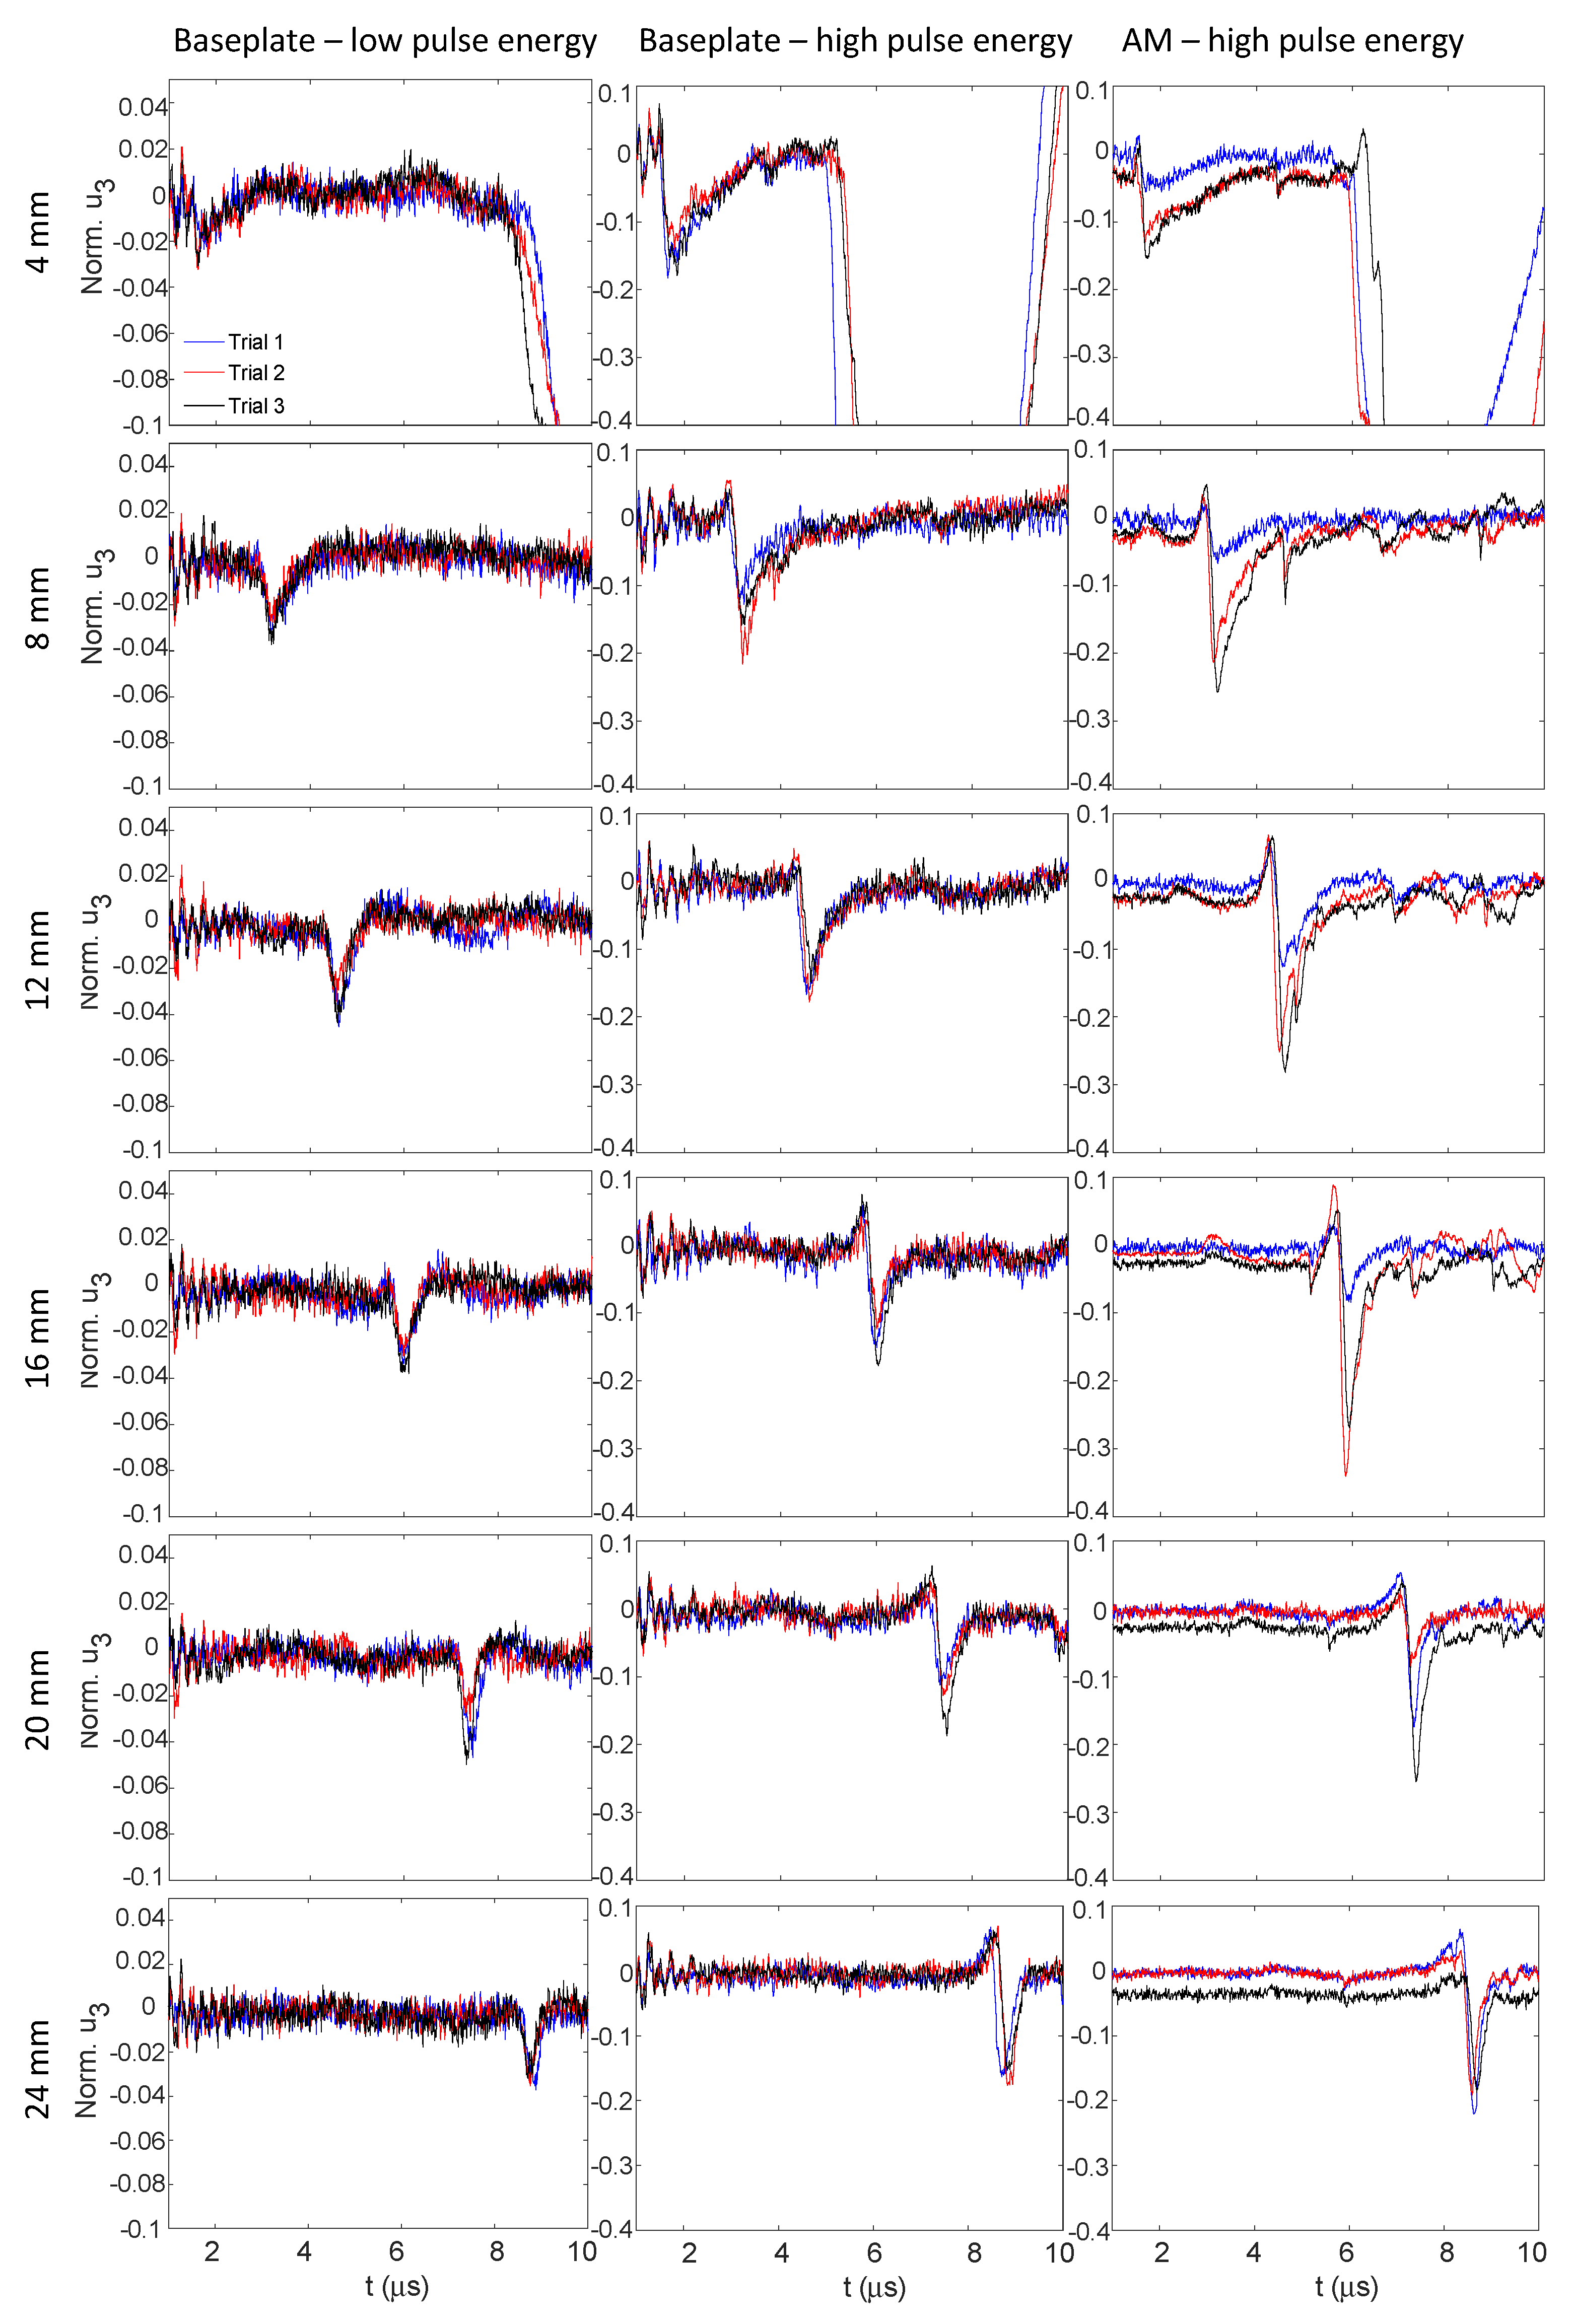
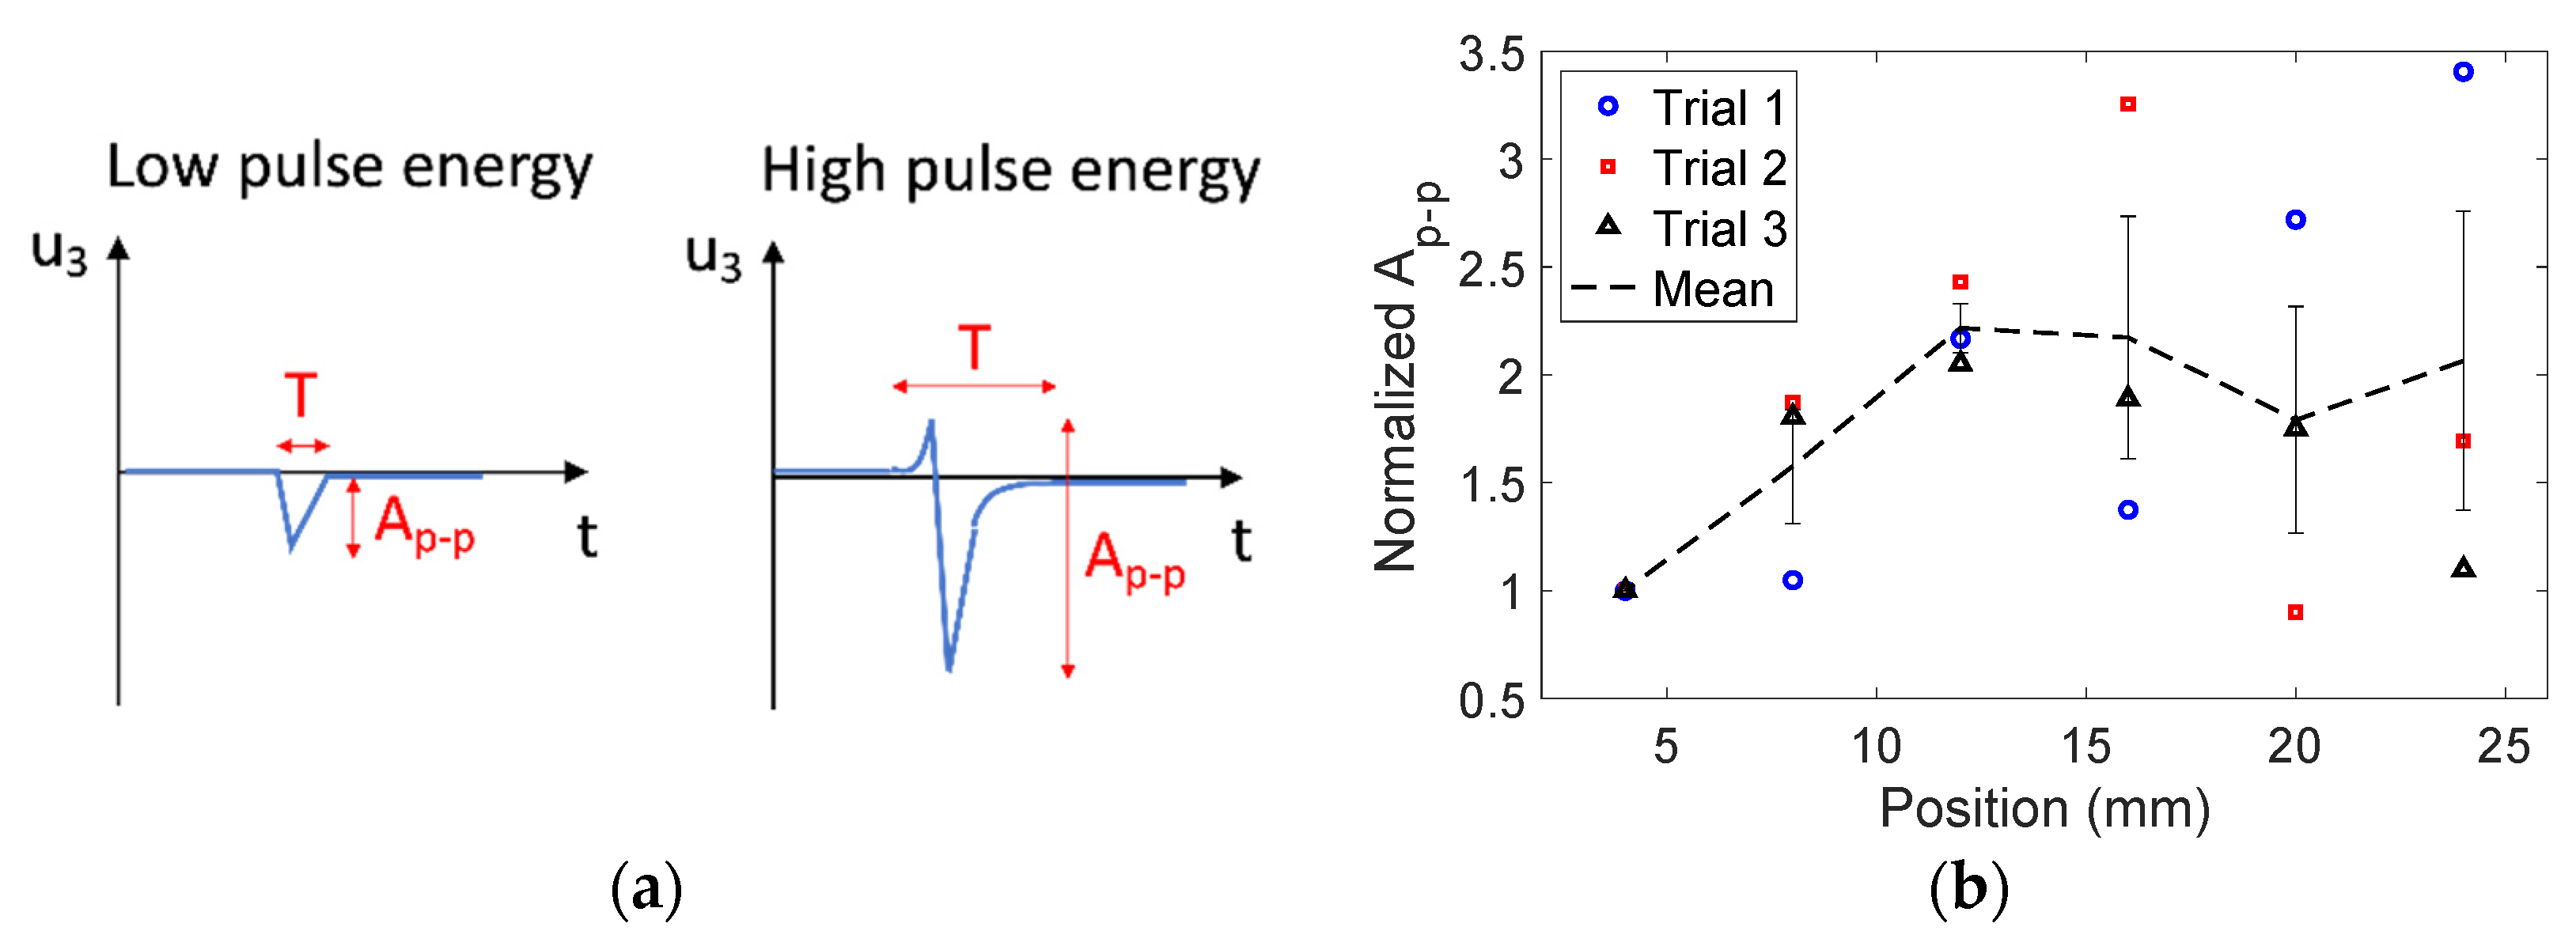
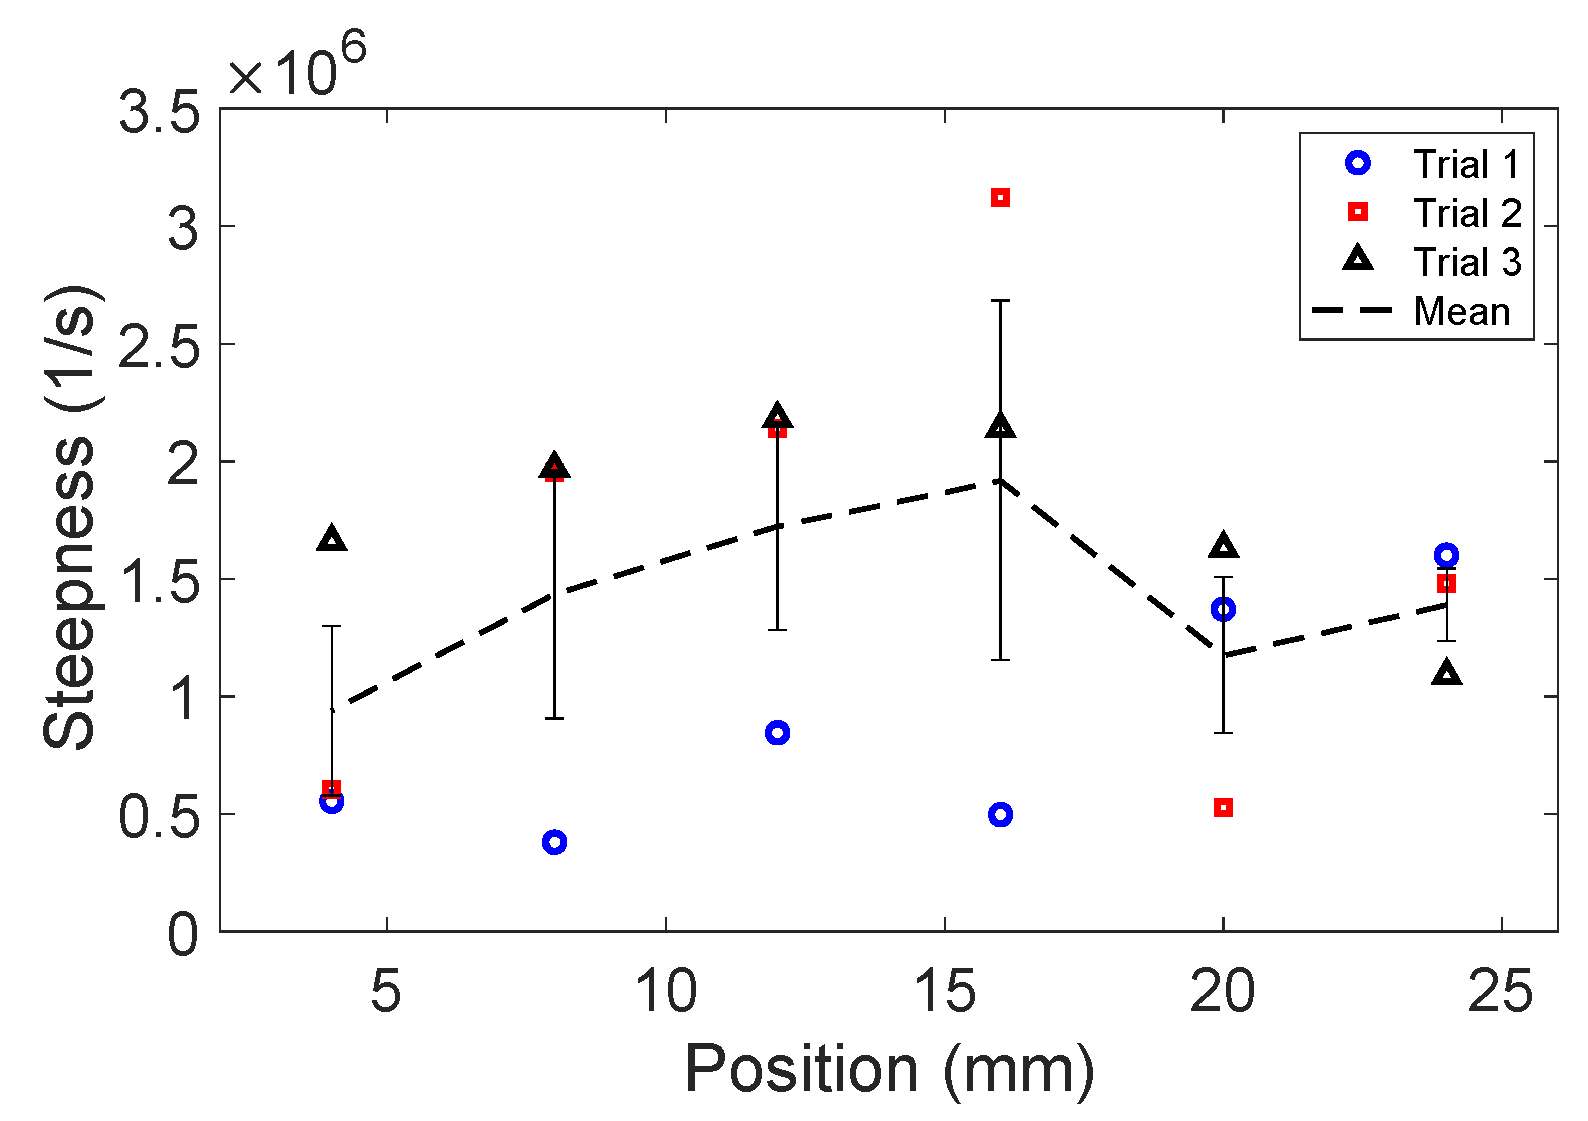
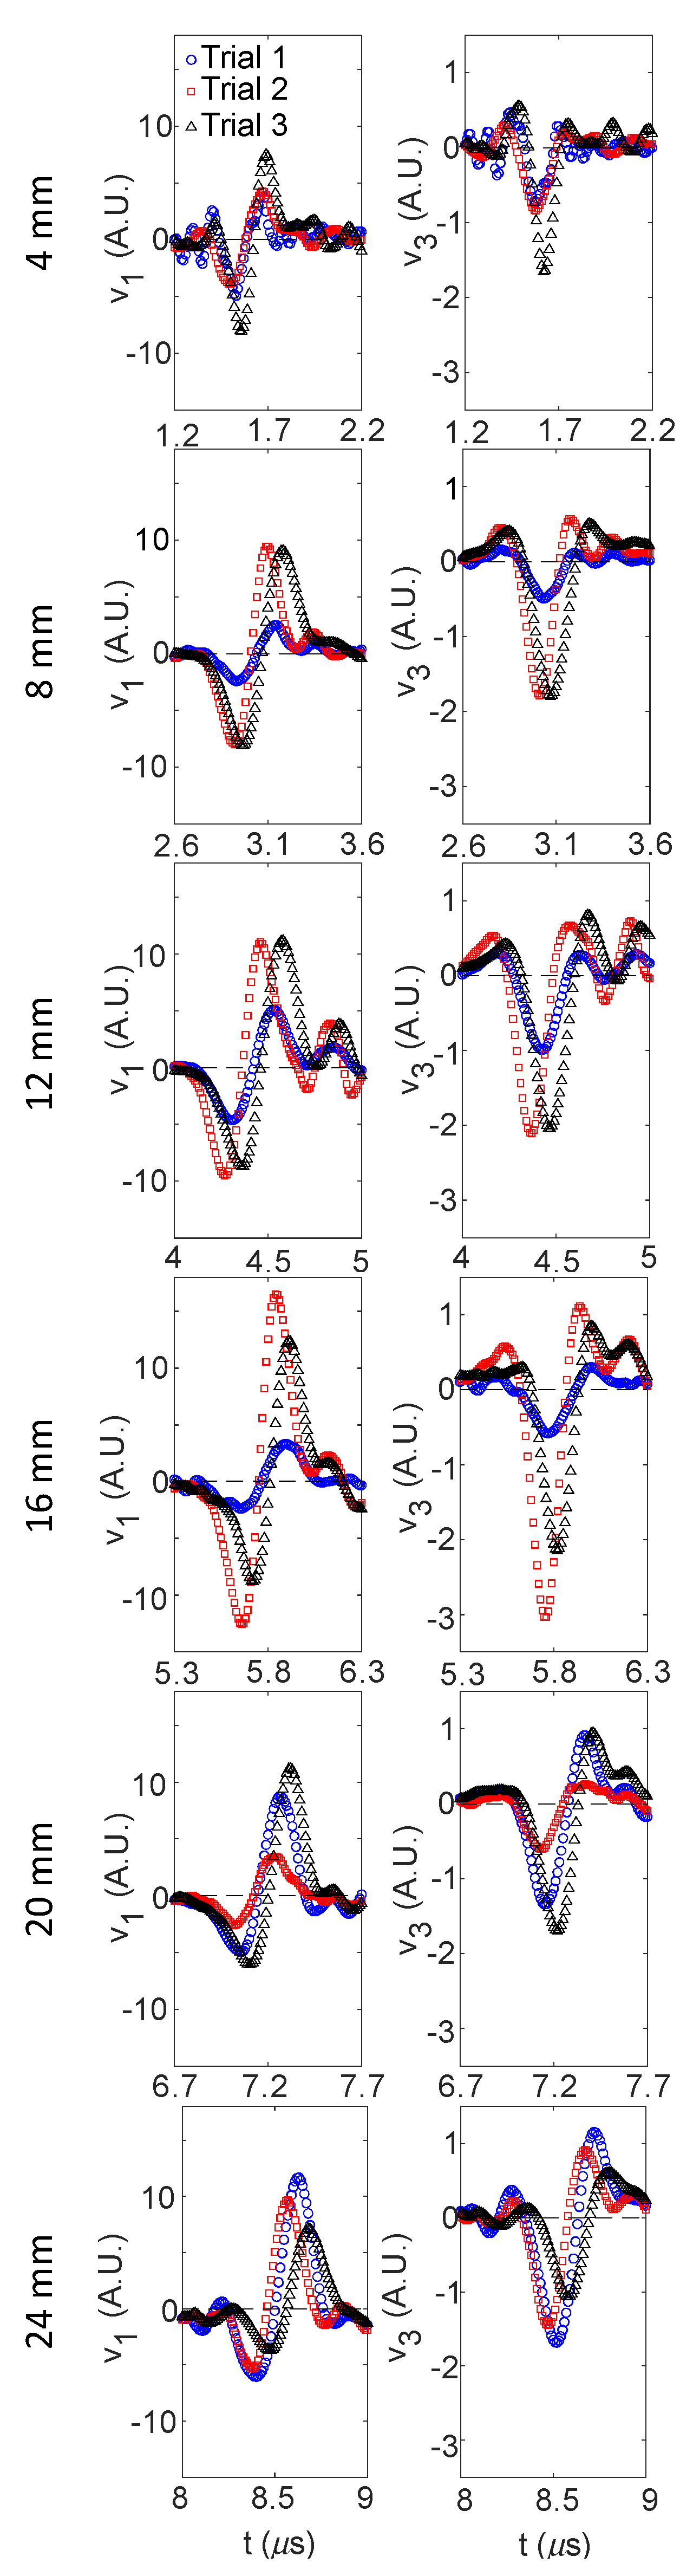
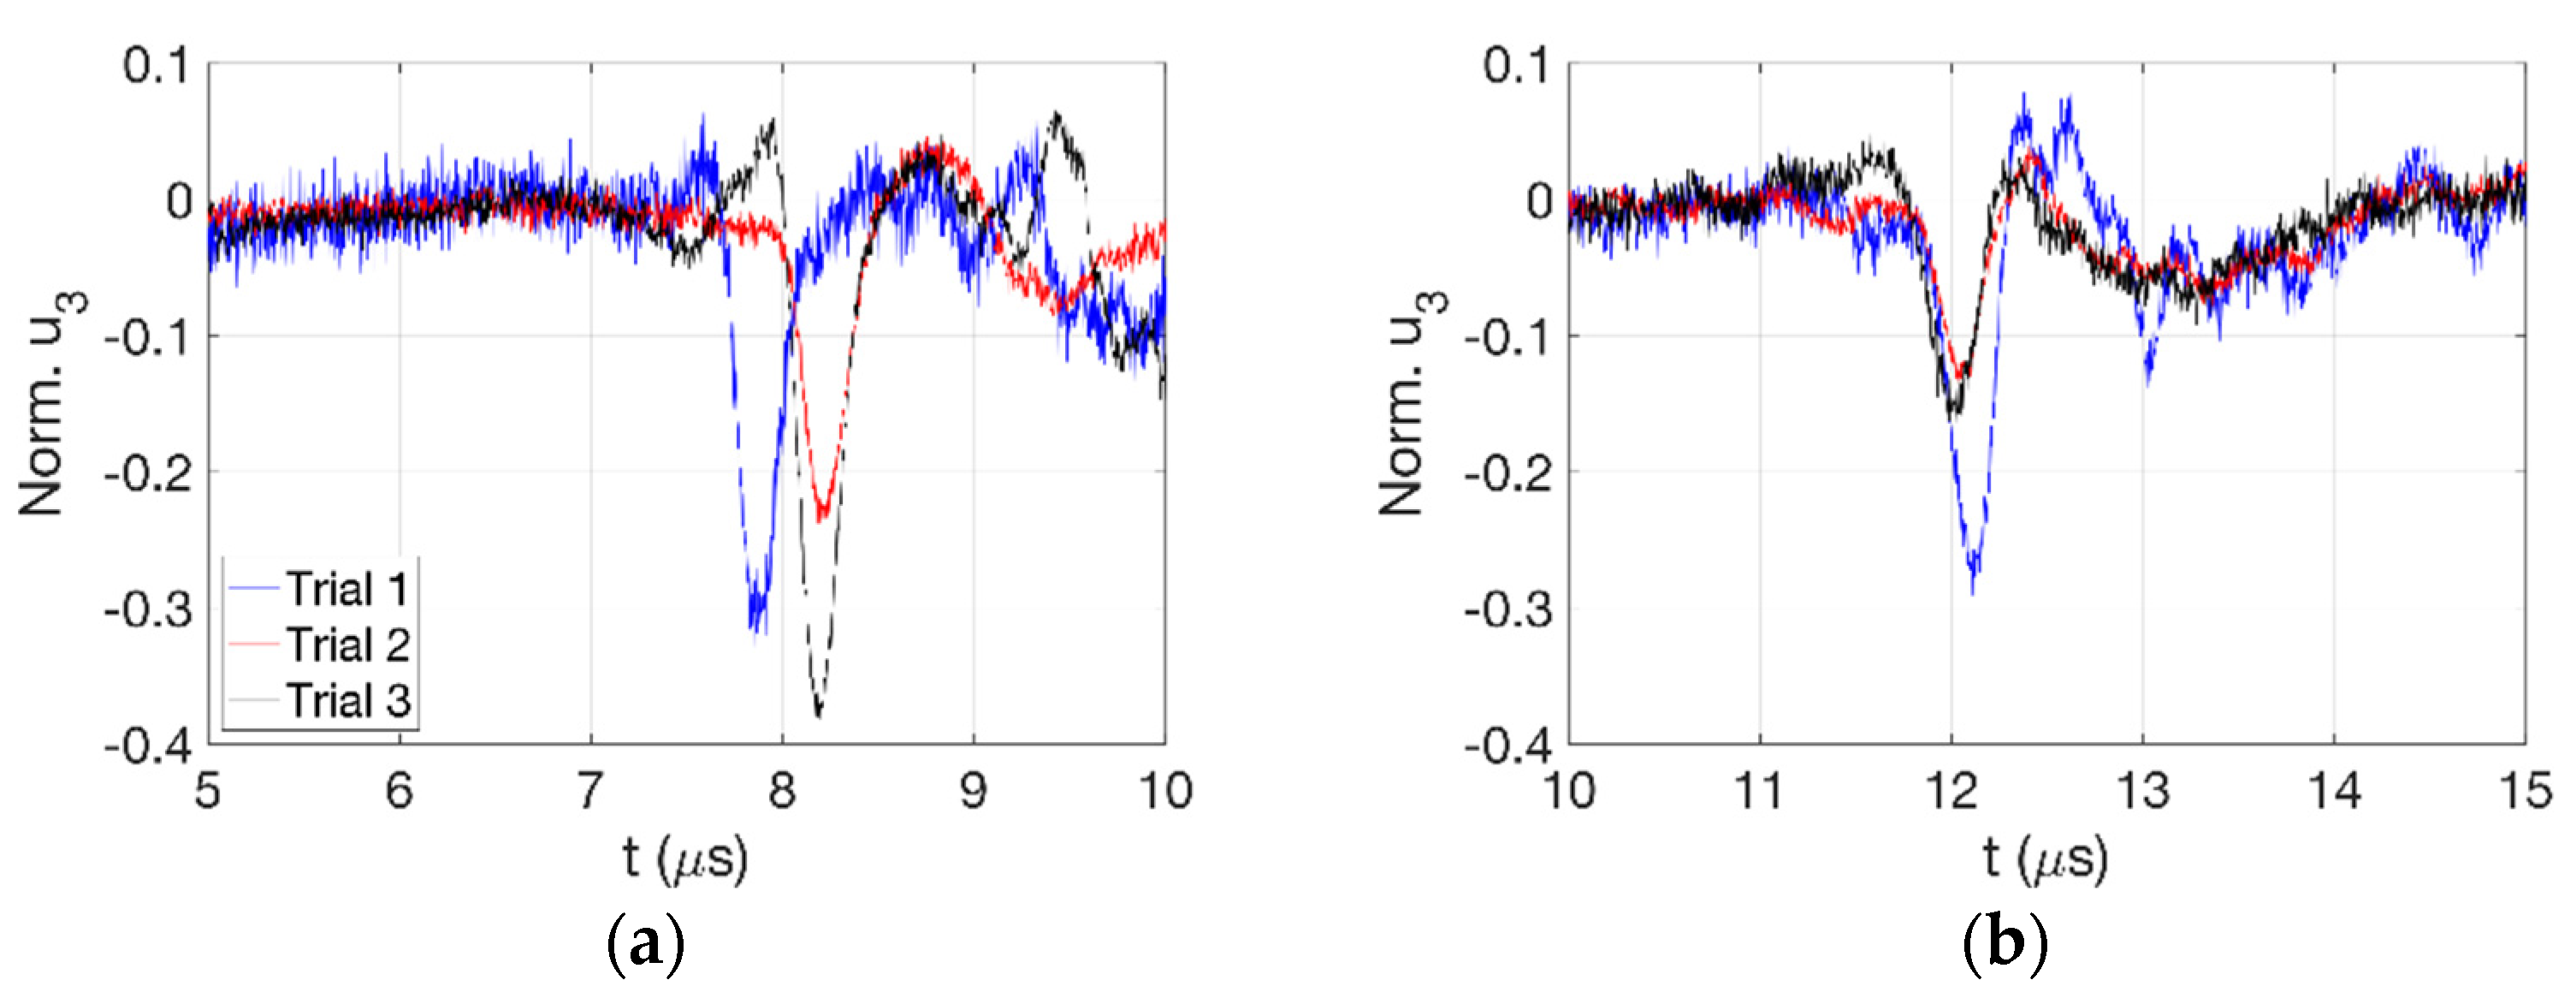
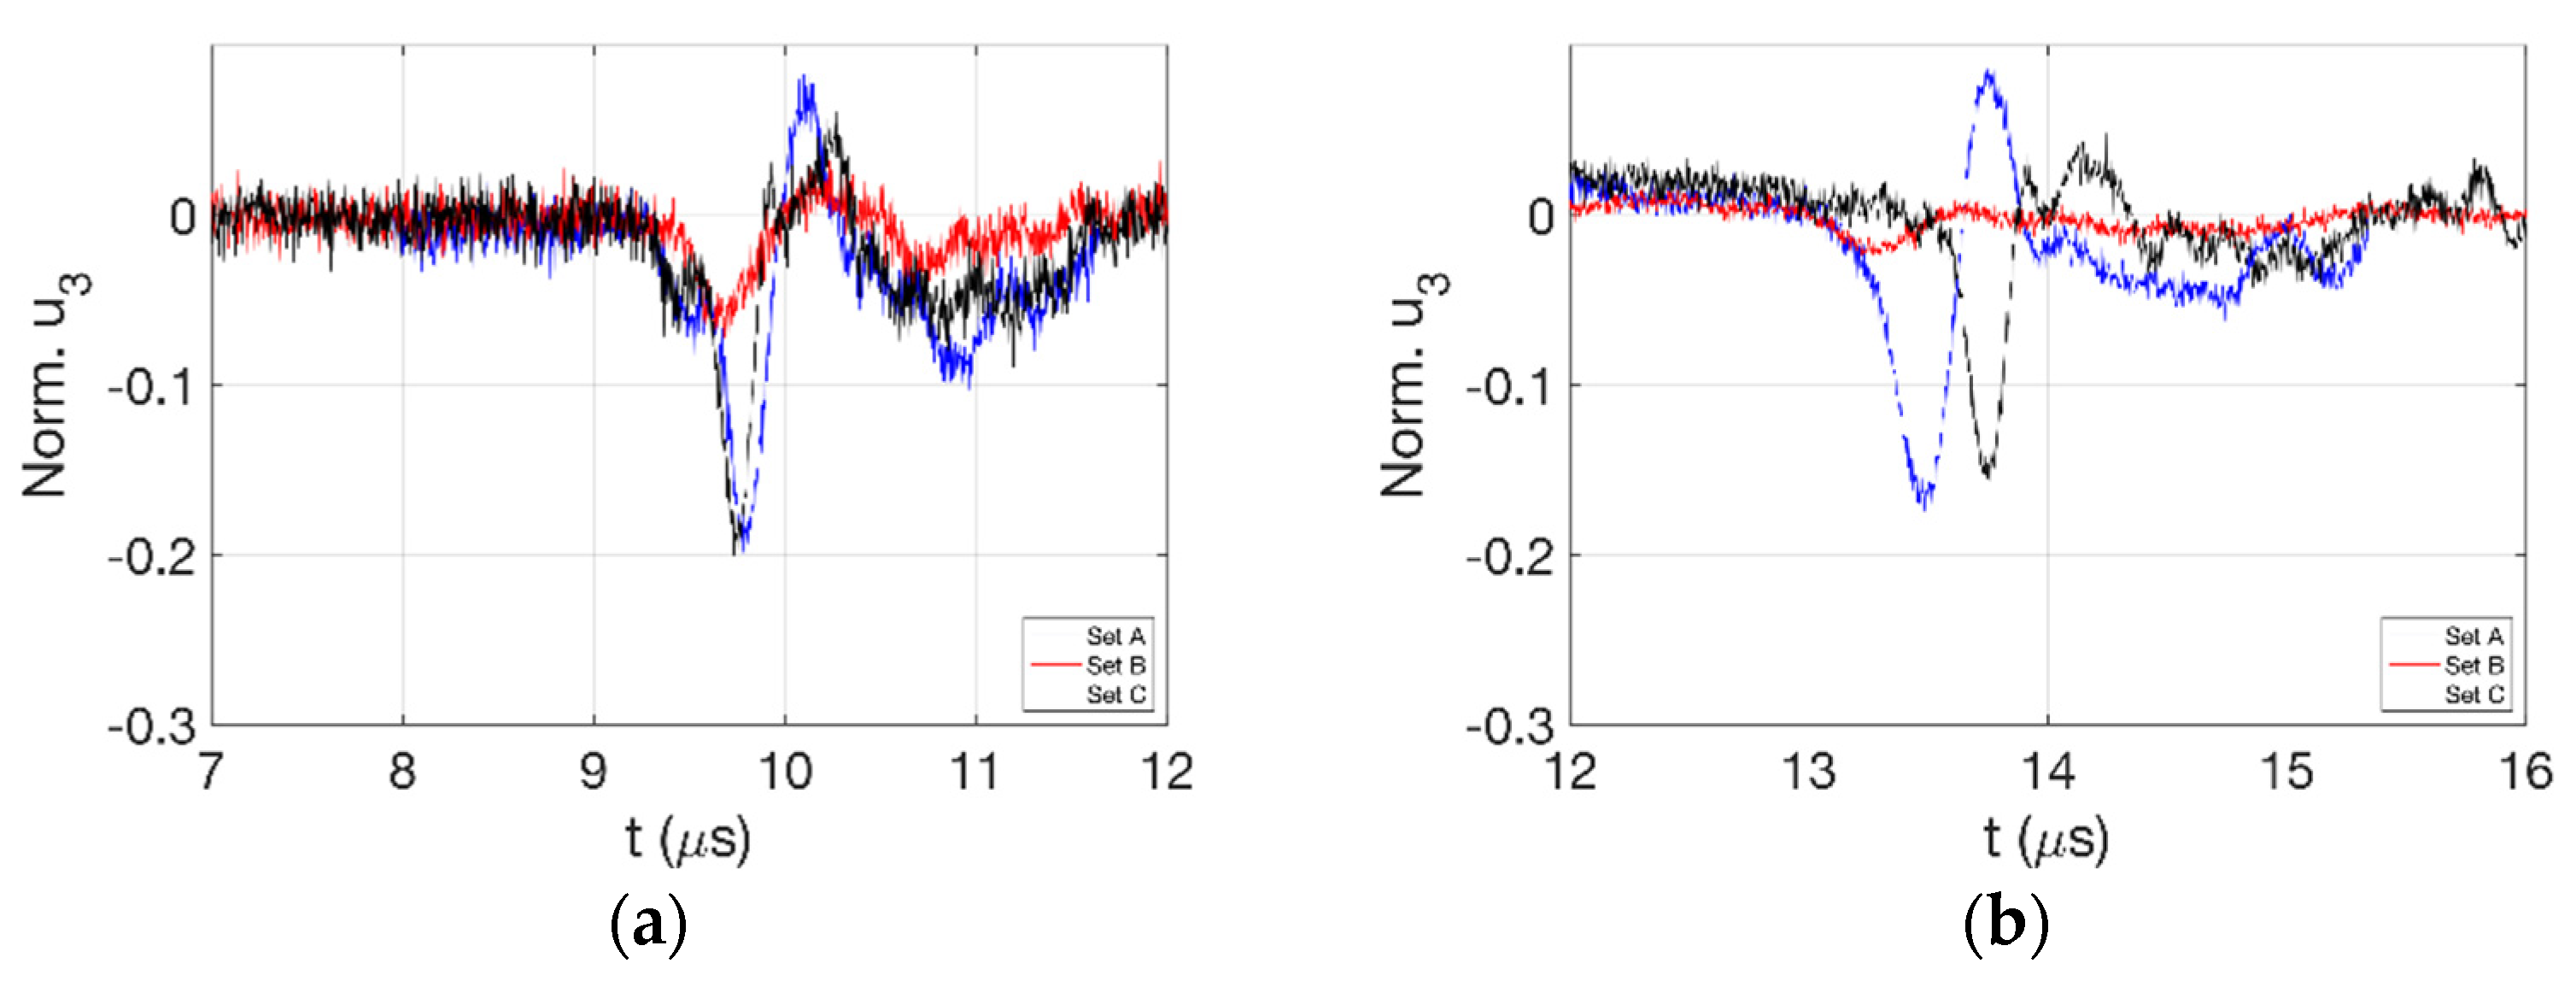
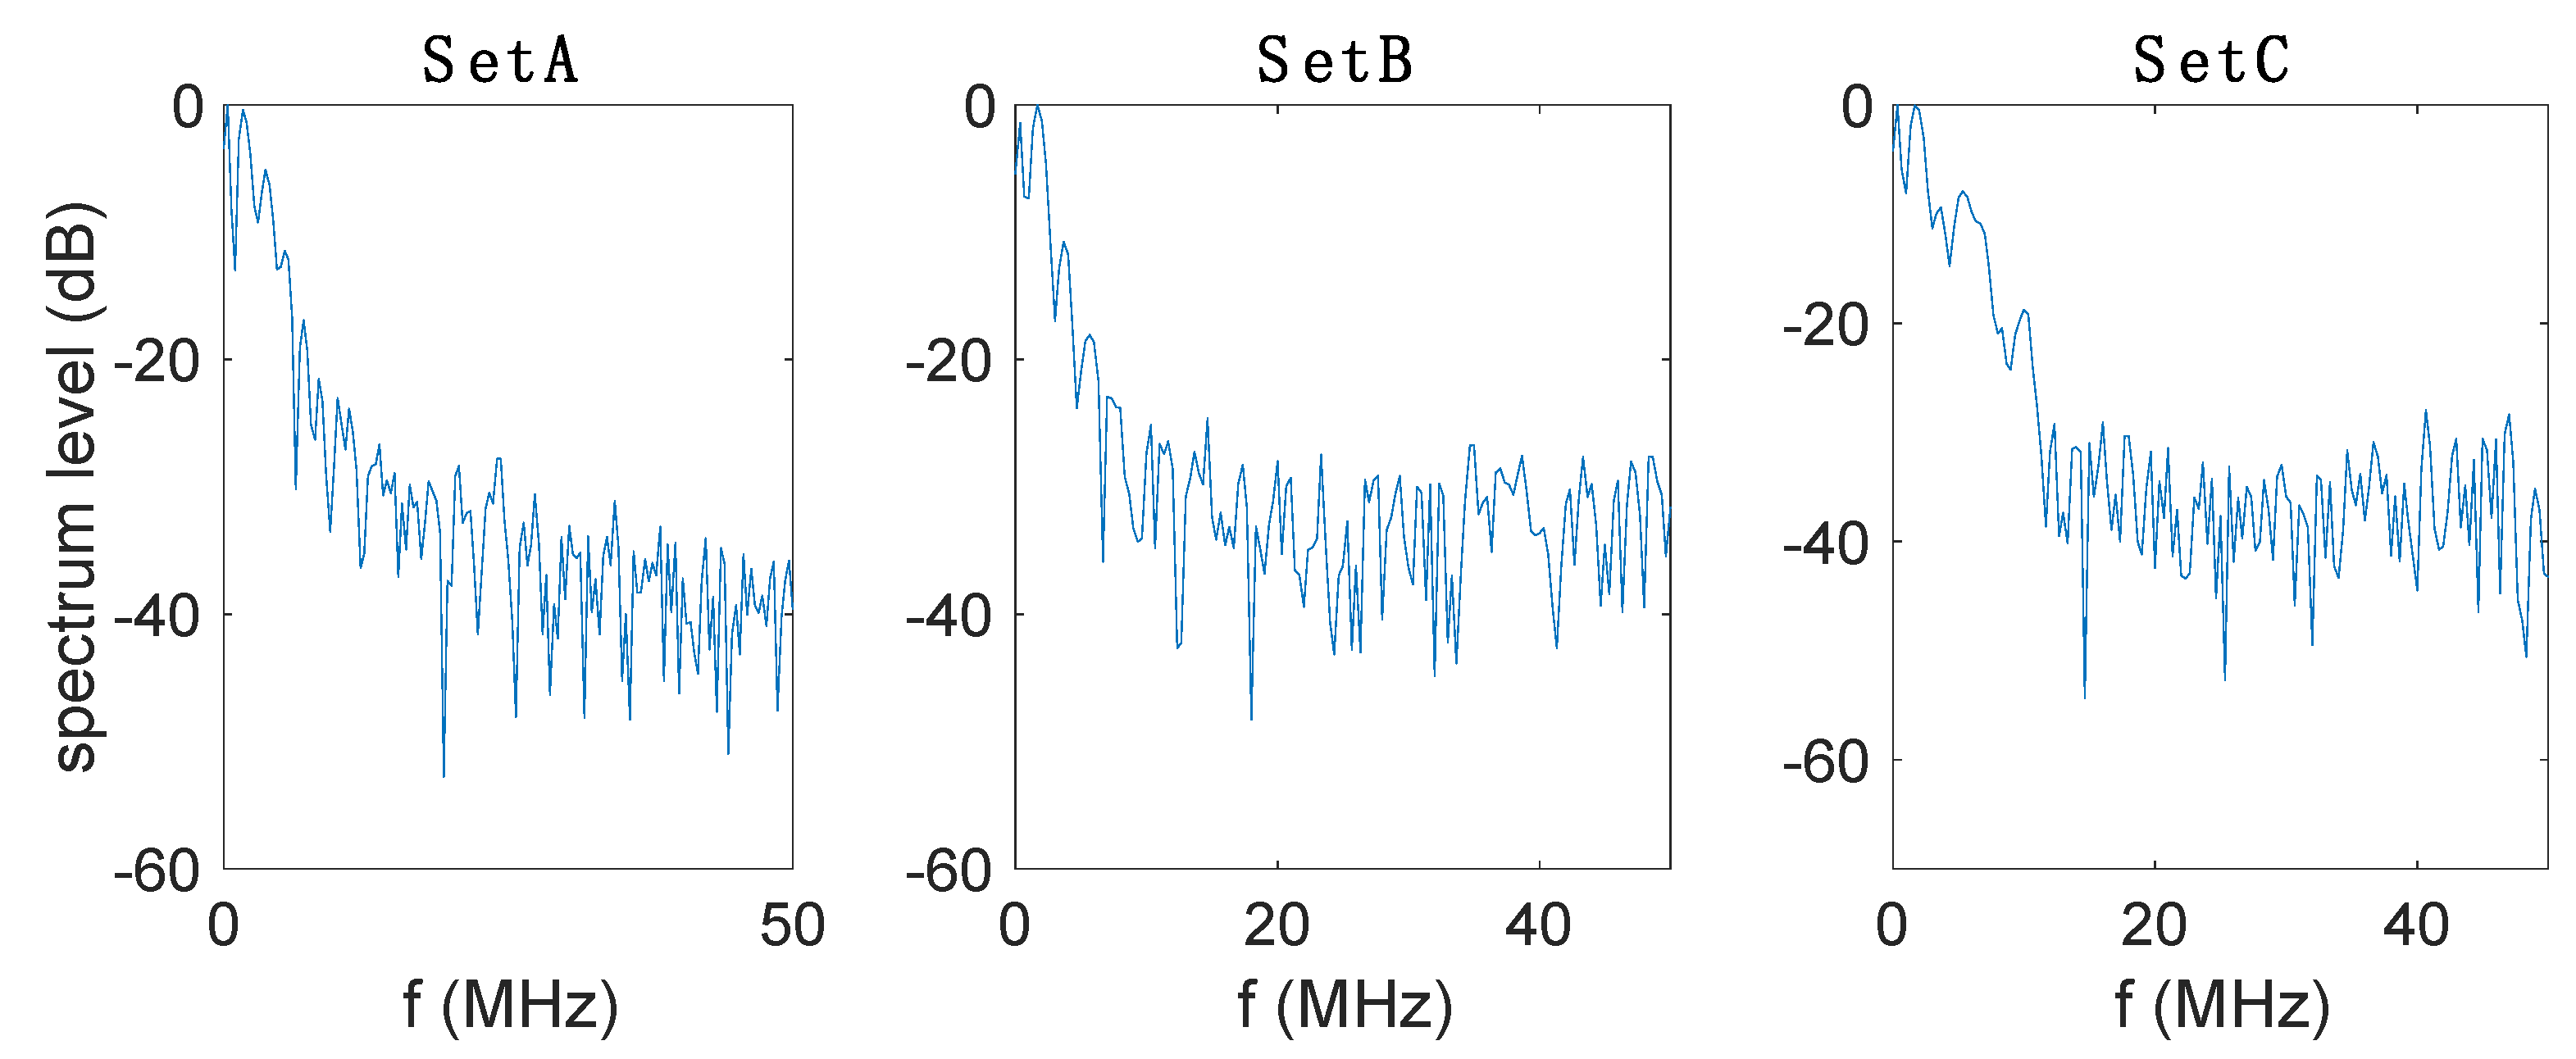
3.1. Detected Waveform Evolution

Rayleigh wave experiments were conducted on a Ti-6Al-4V specimen in the LU test bed. Process parameter set C (see Table 1) was used for this deposition. During these experiments the generation position remains fixed while the reception point is moved in 4 mm increments. 512 synchronous averages were used to minimize the random noise in the signals received at propagation distances of 4–24 mm. The source for finite amplitude Rayleigh waves was obtained by setting the Nd:YAG Q-switch delay to 185 μs, giving a pulse energy of approximately 335 mJ, which will be referred to as the high pulse energy. The high pulse energy ablates the surface, which we deem acceptable for process monitoring since material will be deposited on top of the current surface as the build progresses. Low pulse energy was used to generate predominantly linear Rayleigh wave pulses by increasing the Q-switch delay to 290 μs. It is worth noting that filtering can drastically change the waveform shape, therefore in this article filtering has not been used.
The received waveforms from three longitudinal scan trials are compiled in Figure 6 for (i) the as-received baseplate using low pulse energy, (ii) the as-received baseplate using high pulse energy, and (iii) the as-built AM deposition using high pulse energy. It is worth reiterating that while the chemical compositions of the baseplate and AM deposition are nominally the same (Ti-6Al-4V), the microstructures are much different as documented in previous work [60] and the surface roughness is also much different (see Table 3). The waveforms are the particle displacement component normal to the surface, u3, with the laser interferometer detected AC signal normalized with respect to the mean DC level. Note that the variability in the DC level was approximately five times larger for tests on AM depositions than on the baseplate. The line-focused Nd:YAG laser beam generates a low-frequency airborne wave that is detected by the interferometer after the Rayleigh wave arrival. This wave is observed in the A-scan from 4 mm but is not of interest here.
The waveforms in Figure 6 were generated by impulse loading rather than a sinusoid and thus do not compare well with the u3 waveforms in Figure 3. The Rayleigh waveform generated by low pulse energy is the most repeatable in Figure 6, both for the three trials and as a function of propagation distance. Thus, the V-shaped waveform represents a linear Rayleigh wave, as the nonlinearity is too small to notice. In contrast, the waveforms generated by high pulse energy, having much higher peak-to-peak amplitudes (note the amplitude scales are different for low and high pulse energy), have a different waveform shape and evolve with propagation distance. These two features could be invaluable for characterizing the material nonlinearity. For low pulse energy, the segments of the V-shaped pulse appear to have nominally the same steepness. However, for high pulse energy, the first segment is significantly steeper (and smoother) than the second segment. Thus, it may be possible to define a steepness ratio to characterize nonlinearity independent from propagation distance. These observations apply to high pulse energy for both the baseplate and the AM deposition.
Based on the high pulse energy results for the baseplate only, the V-shape evolves with propagation distance through the formation of an initial wing at 16, 20 and 24 mm. That is, the waveform starts upward before the downward slope of the V-shape. For these waveforms the peak-to-peak amplitude is defined by the first segment of the V-shape since the segments have different lengths.
The results for high pulse energy on the AM deposition in Figure 6 indicate that normalizing the AC signal with respect to the DC level did not eliminate the scatter between trials, suggesting that the scatter is not associated with surface reflectivity. To assess whether the scatter is due to source variability (whether from the surface or the pulsed laser itself) we observe that the peak-to-peak amplitude for trial 1 is significantly lower than trials 2 and 3 for propagation distances of 4–16 mm, but then increases to be the largest at 24 mm. Hence, the scatter does not appear to be due to source variability.
For high pulse energy the peak-to-peak amplitude for the AM deposition generally increases between 4 and 12 mm and then decreases between 12 to 24 mm (Figure 7b), which is a strong indicator of cumulative nonlinearity that becomes overwhelmed by attenuation (starting at 12 mm). To the contrary, the peak-to-peak amplitude for low pulse energy remains essentially constant. In addition, the V-shaped waveform has strong asymmetry due to the presence of an initial wing and because the first leg of the V-shape is much steeper than the second leg for high pulse energy. Moreover, the second leg of the V is often curved. Figure 7a shows idealized sketches of the low pulse energy and high pulse energy V-shaped waveforms. We analyzed the steepening of the first leg of the V-shape with propagation distance for the AM deposition by computing the absolute value of the slope in the middle portion of the peak-to-peak distance. The results in Figure 8 have significant scatter, but the average steepness increases by a factor of almost two for propagation distances of 4–16 mm before it decreases. It appears that the scatter in Figure 8 appear may be due to the low amplitudes for Trial 1 observed in Figure 6.
The u3 waveforms in Figure 6 were differentiated with respect to time to derive the v3 waveforms plotted in Figure 9. Since the u3 waveforms were not calibrated to actual displacements in nm the v3 waveforms have only arbitrary units (A.U.). The Hilbert transform is then used to compute the v1 waveforms, which are also plotted in Figure 9. In general terms, the velocity waveforms agree with Figure 1, Figure 2 and Figure 3. The v3 waveforms can be described as a negative spike-like pulse, while the v1 waveforms have a negative peak followed by a positive peak. However, in many cases in Figure 9 the following positive peak is larger than the initial negative peak in the v1 waveform.

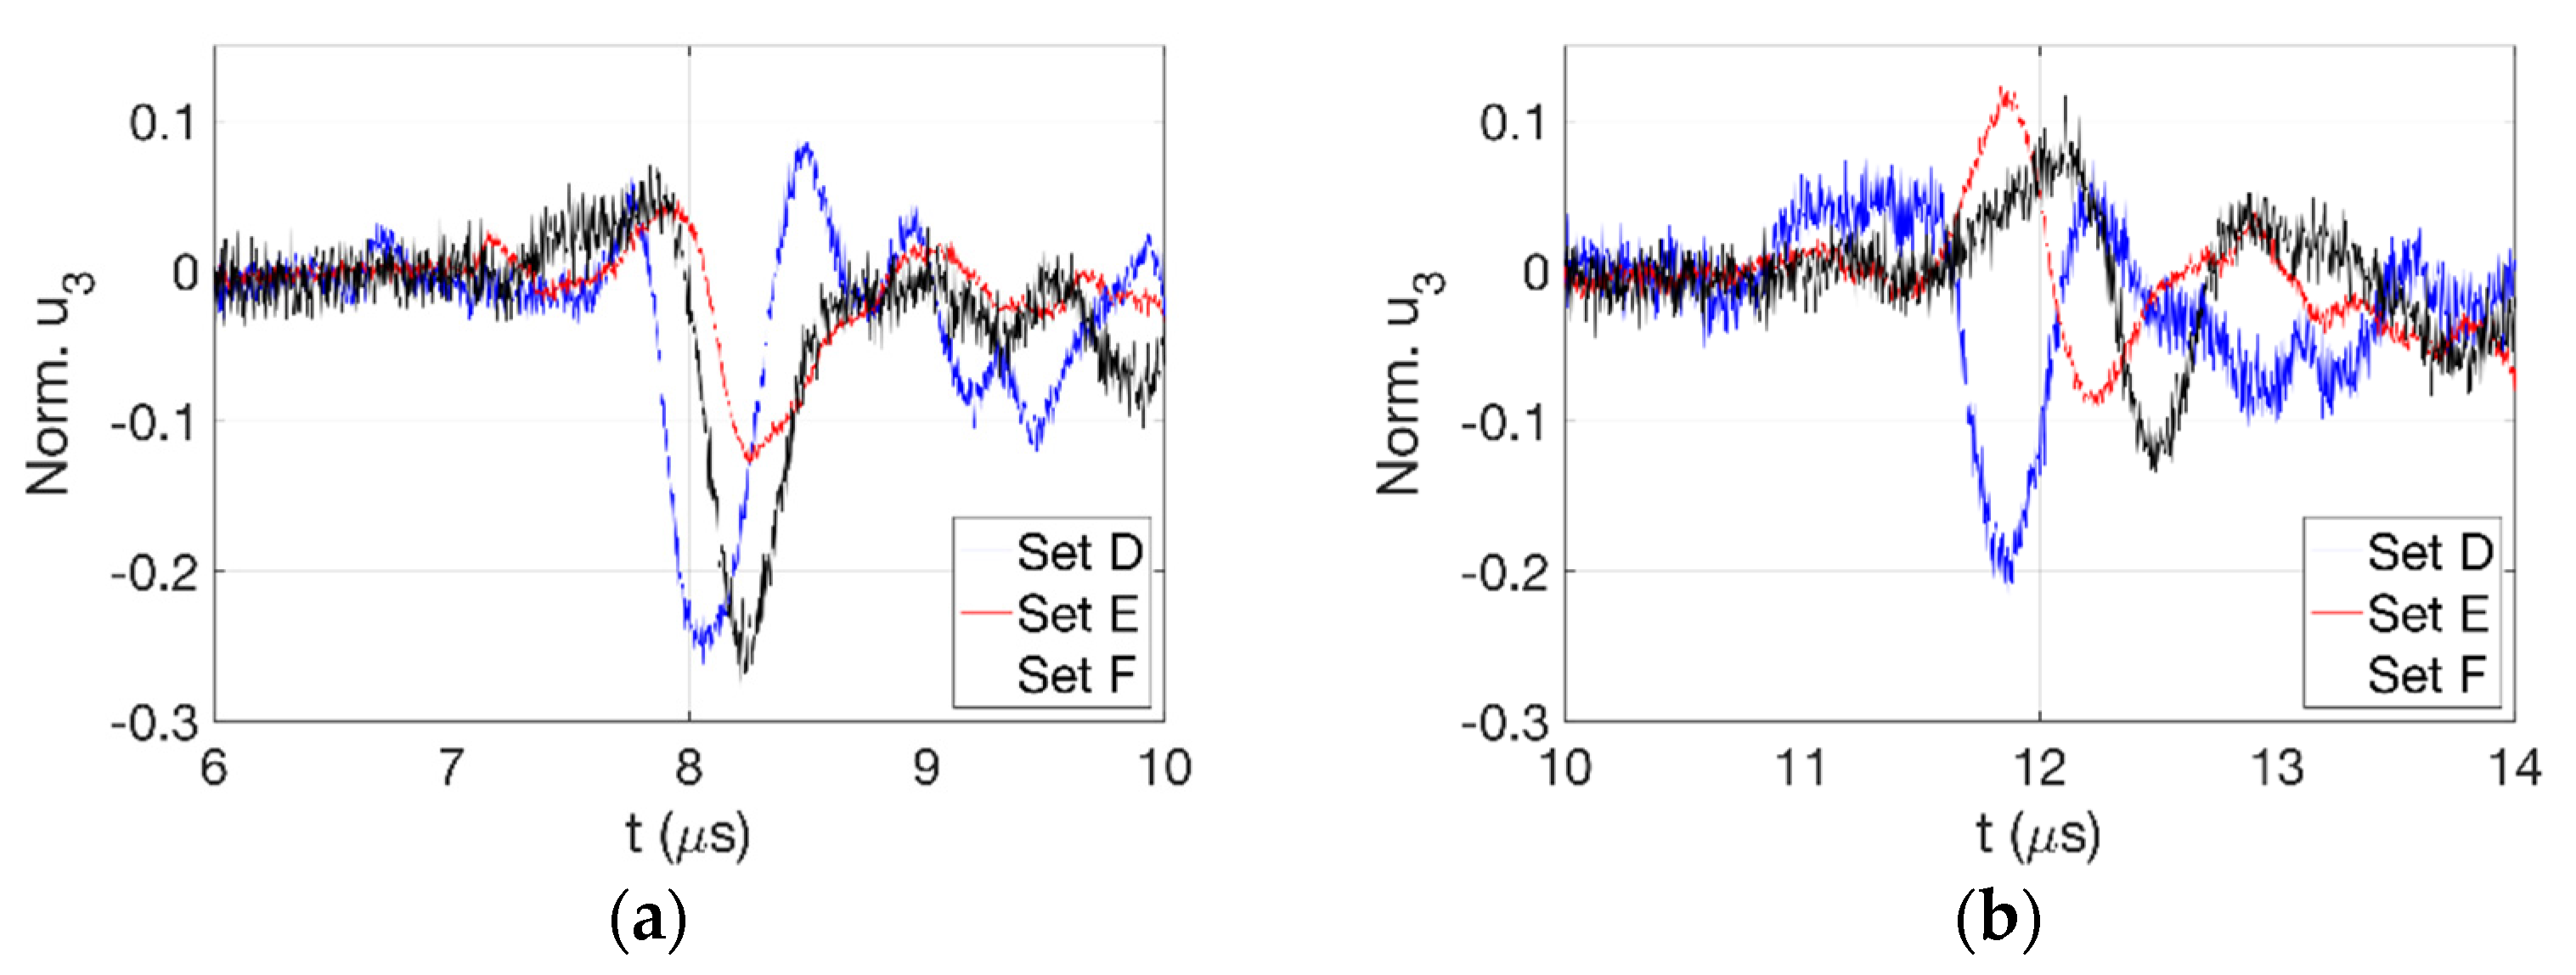
3.2. Effect of Off-Normal Processing Parameters

LU Rayleigh wave testing inside the DED-AM chamber focused on assessing the effect that off-normal processing parameter sets have on the Rayleigh waveform. Rather than detect flaws or anomalies, the goal was to assess whether the Rayleigh waveforms are sensitive to the process parameters. Lower laser pulse energies are used to reduce ablation.

3.2.1. Ti-6Al-4V

The laser pulse energy of 60 mJ was used in the first experiments aimed at characterizing the repeatability of the waveforms for different AM depositions. The three (blue, red, black) waveforms shown in Figure 10 are on nominally the same material (process parameter set A) and roughly the same propagation distances (~23 mm and ~39 mm for points 1 and 2 respectively). As in Figure 6, there is variability in the peak-to-peak amplitudes, but the waveforms are all quite similar V-shapes. Probably due to the lower pulse energy, the initial wing in the waveform is less than for the high pulse energy results in Figure 6. The variation in phase is primarily due to the variations in the actual positions of points 1 and 2.
Off-normal process parameter sets B and C are compared with set A at points 1 and 2 in Figure 11. The waveform for set B (in red) has a much lower amplitude, especially at point 2, suggesting that the reduced deposition laser power of 380 W (see Table 1) results in material having more internal losses that cause more attenuation than the normal laser power (450 W). The waveform for set C (in black) is similar to its counterpart for set A, suggesting that the 0.1 mm difference in hatch spacing does not change the material nonlinearity enough to be detectable. Received signals quite similar to those shown in Figure 11 were obtained for parallel wave paths. The linear frequency spectra for the signals received at point 1 are shown in Figure 12. The spectra were obtained by fast Fourier transformation (FFT) using a rectangular window from 8–11 μs and zero padding the time sequence. There are no obvious differences in the spectra resulting from the parameter sets A–C, nor are there any obvious differences from the frequency spectra obtained from the Figure 6 data (these spectra are not shown).

3.2.2. IN-718

First, process parameter sets D, E, and F were investigated using 60 mJ laser pulse energy generated Rayleigh waves received at 23 and 39 mm. The results are plotted in Figure 13. Aside from the amplitude for Set E being smaller than for Sets D and F, at 23 mm the waveforms are similar. However, at 39 mm the waveforms for both off-normal parameter sets E and F are substantially different from those for set D in that they have a sine wave appearance, while set D is primarily V-shaped. While no significant microstructural differences were observed in the optical micrographs, property-affecting microstructural features are often too small to resolve with optical microscopy. While we do not have mechanical test results to confirm that the off-normal process parameters have deleterious effects on the material, we feel that the different waveforms provide a useful first step.
In the final experiment to be reported we assessed the possibility of receiving the waveforms at a single point and describing nonlinear waveform evolution by changing the amplitude of the source. In Figure 14 the process parameter sets D, G, and H, having different hatch spacings, were investigated using a low pulse energy (30 mJ) and high pulse energy (120 mJ) and receiving after a wave propagation distance of 28 mm. The waveforms have the characteristic V-shape indicative of linear behavior for the low pulse energy. However, for the high pulse energy the waveform is more like a sine wave followed by erratic secondary peaks. Unfortunately, we do not yet understand the cause of the secondary peaks or if there is a way to distinguish between the normal and off-normal process parameters.

4. Discussion

Conceptually, a short high-energy laser pulse generates a finite amplitude Rayleigh waveform that evolves with propagation distance by increasing in nonlinearity up to a point where it then decreases due to attenuation (and diffraction) and eventually becomes essentially linear. Our results in Figure 6 illustrate waveform evolution for high-energy pulses and that waveform for low-energy pulses is minimal. The length scale over which this occurs has not been defined here and is expected to depend on the material nonlinearity, surface roughness, and diffraction (if the length of the loading line is short). We can hypothesize that the best data to quantify material nonlinearity are obtained near the peak nonlinearity. From the perspective of AM process monitoring, the closer this is to the source the better, to minimize the size of the interrogation region of parts that have complex geometries.
The length scale referred to above is related to the shock formation length [27] and acoustic Mach number [14] and can be computed based on the material nonlinearity. However, while Gartsev and Köhler [30] determine nonlinearity parameters for both Ti-6Al-4V and IN-718, the parameters for Ti-6Al-4V have very high uncertainty. Furthermore, the nonlinearity parameters are very sensitive to the microstructure and the microstructure of AM depositions is much different than that of the bulk materials used by Gartsev and Köhler. Therefore, determining the length scale for these AM deposited materials is a good topic for future work. Determining the acoustic Mach number requires the actual particle velocity to be known, which requires that actual particle displacements be determined based on calibrated measurements. This is also a good topic for future work.
The evolution of the u3 waveforms in Figure 6 indicates that the peak-to-peak amplitude has substantial variability between trials, implying that it is not a good feature to quantify the nonlinearity. However, despite the amplitude variability normalized amplitudes as in Figure 7b are useful. In addition, the waveform shapes are self-similar and the change in steepness between the two legs of the V-shape could be a good way to quantify the nonlinearity. We note that this feature could be employed for waveforms acquired as a function of propagation distance as in Figure 6, or as a function of source amplitude at the same propagation distance. Quantifying the nonlinearity could be achieved by fitting nonlinearity parameters (e.g., third order elastic constants) to the waveform evolution through the evolution equations for finite amplitude Rayleigh waves.
Finally, we note that these experiments are the first of their kind. The optimal test parameters are still being worked out. We believe the results presented here are promising and that they can be improved upon with more experience.

5. Conclusions

Noncontact laser ultrasound is proposed for in-situ process monitoring of additive manufacturing (AM) of metals. The general approach is based on the evolution of finite amplitude Rayleigh waveforms associated with nonlinearity of the broadband pulse generated by a laser. The out-of-plane particle displacement is detected on the rough AM surface by an adaptive laser interferometer. From this, the in-plane particle displacement can be computed using the Hilbert transform and the particle velocity components can be computed by time differentiation of the displacement components. The out-of-plane particle displacement waveform for low pulse energy is V-shaped, while for high pulse energy there is typically an initial wing (an increase followed by a decrease) before the downward portion of the V, which steepens, while the upward portion of the V is less steep and more curved. The peak-to-peak amplitude actually increases with propagation distance for high pulse energy. Our results demonstrate that these measurements can be made in-situ. AM process parameters for Ti-6Al-4V and IN-718 builds were intentionally changed to assess whether doing so would change the material nonlinearity enough to be detectable by the received waveforms. Although determination of the optimal test parameters is still in progress, the results appear to be positive for the AM parameters investigated.

Author Contributions

Conceptualization, C.B. and C.J.L.; methodology, C.B., C.J. and C.J.L.; software, C.B., C.J. and S.H.A.; validation, A.N., E.W.R. and C.J.L; formal analysis, C.B. and S.H.A.; investigation, C.B.; resources, A.N., E.W.R. and C.J.L.; data curation, C.B. and S.H.A.; writing—original draft preparation, C.B.; writing—review and editing, A.N., E.W.R. and C.J.L.; visualization, S.H.A.; supervision, C.J.L.; project administration, A.N., E.W.R. and C.J.L.; funding acquisition, C.J.L. All authors have read and agreed to the published version of the manuscript.

Funding

This article is based upon the work supported by National Science Foundation (NSF) under award number 1727292. This research was partially funded by the Government under Agreement No. W911W6-17-2-0003. The U.S. Government is authorized to reproduce and distribute reprints for Government purposes notwithstanding any copyright notation thereon.

Institutional Review Board Statement

Not applicable.

Informed Consent Statement

Not applicable.

Data Availability Statement

The data presented in this study are available in the article.

Acknowledgments

S.H.A. and C.J.L. acknowledge support from Andrew Bozek in the laboratory.

Conflicts of Interest

The authors declare no conflict of interest.

References

  1. Cantrell, J.H. Fundamentals and Applications of Nonlinear Ultrasonic Nondestructive Evaluation. In Ultrasonic Nondestructive Evaluation: Engineering and Biological Material Characterization; Kundu, T., Ed.; CRC Press: Boca Raton, FL, USA, 2004; pp. 363–433. [Google Scholar]
  2. Jhang, K.-Y. Nonlinear Ultrasonic Techniques for Nondestructive Assessment of Micro Damage in Material: A Review. Int. J. Precis. Eng. Manuf. 2009, 10, 123–135. [Google Scholar] [CrossRef]
  3. Matlack, K.H.; Kim, J.-Y.; Jacobs, L.J.; Qu, J. Review of Second Harmonic Generation Measurement Techniques for Material State Determination in Metals. J. Nondestruct. Eval. 2015, 34, 273. [Google Scholar] [CrossRef]
  4. Korneev, V.A.; Demčenko, A. Possible Second-Order Nonlinear Interactions of Plane Waves in an Elastic Solid. J. Acoust. Soc. Am. 2014, 135, 591–598. [Google Scholar] [CrossRef] [PubMed]
  5. Zhang, Z.; Nagy, P.B.; Hassan, W. Analytical and Numerical Modeling of Non-Collinear Shear Wave Mixing at an Imperfect Interface. Ultrasonics 2016, 65, 165–176. [Google Scholar] [CrossRef] [PubMed]
  6. Hasanian, M.; Lissenden, C.J. Second Order Ultrasonic Guided Wave Mutual Interactions in Plate: Arbitrary Angles, Internal Resonance, and Finite Interaction Region. J. Appl. Phys. 2018, 124, 164904. [Google Scholar] [CrossRef]
  7. Norris, A. Finite Amplitude Waves in Solids. In Nonlinear Acoustics; Academic Press: Cambridge, MA, USA, 1998; pp. 263–277. [Google Scholar]
  8. Guyer, R.A.; Johnson, P.A. Nonlinear Mesoscopic Elasticity: The Complex Behaviour of Granular Media Including Rocks and Soil; Wiley-VCH: Weinheim, Germany, 2009. [Google Scholar]
  9. Lomonosov, A.; Hess, P. Laser Excitation and Propagation of Nonlinear Surface Acoustic Wave Pulses. In Proceedings of the Nonlinear Acoustics in Perspective; Wei, R.J., Ed.; Nanjing University Press: Nanjing, China, 1996. [Google Scholar]
  10. Kolomenskii, A.A.; Lomonosov, A.M.; Kuschnereit, R.; Hess, P.; Gusev, V.E. Laser Generation and Detection of Strongly Nonlinear Elastic Surface Pulses. Phys. Rev. Lett. 1997, 79, 1325–1328. [Google Scholar] [CrossRef]
  11. Lomonosov, A.; Mikhalevich, V.G.; Hess, P.; Knight, E.Y.; Hamilton, M.F.; Zabolotskaya, E.A. Laser-Generated Nonlinear Rayleigh Waves with Shocks. J. Acoust. Soc. Am. 1999, 105, 2093–2096. [Google Scholar] [CrossRef] [Green Version]
  12. Kolomenskii, A.A.; Lioubimov, V.A.; Jerebtsov, S.N.; Schuessler, H.A. Nonlinear Surface Acoustic Wave Pulses in Solids: Laser Excitation, Propagation, Interactions (Invited). Rev. Sci. Instrum. 2003, 74, 448–452. [Google Scholar] [CrossRef] [Green Version]
  13. Kolomenskii, A.A.; Schuessler, H.A.; Mikhalevich, V.G.; Maznev, A.A. Interaction of Laser-Generated Surface Acoustic Pulses with Fine Particles: Surface Cleaning and Adhesion Studies. J. Appl. Phys. 1998, 84, 2404–2410. [Google Scholar] [CrossRef] [Green Version]
  14. Kolomenskii, A.A.; Schuessler, H.A. Characterization of Isotropic Solids with Nonlinear Surface Acoustic Wave Pulses. Phys. Rev. B 2001, 63, 085413. [Google Scholar] [CrossRef]
  15. Schuessler, H.A.; Jerebtsov, S.N.; Kolomenskii, A.A. Determination of Linear and Nonlinear Elastic Parameters from Laser Experiments with Surface Acoustic Wave Pulses. Spectrochim. Acta Part B At. Spectrosc. 2003, 58, 1171–1175. [Google Scholar] [CrossRef]
  16. Jerebtsov, S.N.; Kolomenskii, A.A.; Schuessler, H.A. Characterization of a Polycrystalline Material with Laser-Excited Nonlinear Surface Acoustic Wave Pulses. Int. J. Thermophys. 2004, 25, 485–490. [Google Scholar] [CrossRef]
  17. Lomonosov, A.M.; Hess, P. Impulsive Fracture of Silicon by Elastic Surface Pulses with Shocks. Phys. Rev. Lett. 2002, 89, 095501. [Google Scholar] [CrossRef] [PubMed]
  18. Lehmann, G.; Lomonosov, A.M.; Hess, P.; Gumbsch, P. Impulsive Fracture of Fused Quartz and Silicon Crystals by Nonlinear Surface Acoustic Waves. J. Appl. Phys. 2003, 94, 2907–2914. [Google Scholar] [CrossRef] [Green Version]
  19. Kozhushko, V.V.; Hess, P. Anisotropy of the Strength of Si Studied by a Laser-Based Contact-Free Method. Phys. Rev. B 2007, 76, 144105. [Google Scholar] [CrossRef]
  20. Kozhushko, V.V.; Lomonosov, A.M.; Hess, P. Intrinsic Strength of Silicon Crystals in Pure- and Combined-Mode Fracture without Precrack. Phys. Rev. Lett. 2007, 98, 195505. [Google Scholar] [CrossRef] [PubMed]
  21. Gusev, V.E.; Lauriks, W.; Thoen, J. Theory for the Time Evolution of Nonlinear Rayleigh Waves in an Isotropic Solid. Phys. Rev. B 1997, 55, 9344–9347. [Google Scholar] [CrossRef]
  22. Gusev, V.E.; Lauriks, W.; Thoen, J. New Evolution Equations for the Nonlinear Surface Acoustic Waves on an Elastic Solid of General Anisotropy. J. Acoust. Soc. Am. 1998, 103, 3203–3215. [Google Scholar] [CrossRef]
  23. Zabolotskaya, E.A. Nonlinear Propagation of Plane and Circular Rayleigh Waves in Isotropic Solids. J. Acoust. Soc. Am. 1992, 91, 2569–2575. [Google Scholar] [CrossRef]
  24. Shull, D.J.; Hamilton, M.F.; Il’insky, Y.A.; Zabolotskaya, E.A. Harmonic Generation in Plane and Cylindrical Nonlinear Rayleigh Waves. J. Acoust. Soc. Am. 1993, 94, 418–427. [Google Scholar] [CrossRef]
  25. Shull, D.J.; Kim, E.E.; Hamilton, M.F.; Zabolotskaya, E.A. Diffraction Effects in Nonlinear Rayleigh Wave Beams. J. Acoust. Soc. Am. 1995, 97, 2126–2137. [Google Scholar] [CrossRef]
  26. Hamilton, M.F.; Il’insky, Y.A.; Zabolotskaya, E.A. Local and Nonlocal Nonlinearity in Rayleigh Waves. J. Acoust. Soc. Am. 1995, 97, 882–890. [Google Scholar] [CrossRef]
  27. Hamilton, M.F.; Il’insky, Y.A.; Zabolotskaya, E.A. Evolution Equations for Nonlinear Rayleigh Waves. J. Acoust. Soc. Am. 1995, 97, 891–897. [Google Scholar] [CrossRef]
  28. Knight, E.Y.; Hamilton, M.F.; II’inskii, Y.A.; Zabolotskaya, E.A. General Theory for the Spectral Evolution of Nonlinear Rayleigh Waves. J. Acoust. Soc. Am. 1997, 102, 1402–1417. [Google Scholar] [CrossRef]
  29. Rudenko, O.V.; Solui͡an, S.I. Theoretical Foundations of Nonlinear Acoustics; Studies in Soviet science; Consultants Bureau: New York, NY, USA, 1977; ISBN 978-0-306-10933-1. [Google Scholar]
  30. Gartsev, S.; Köhler, B. Direct Measurements of Rayleigh Wave Acoustoelastic Constants for Shot-Peened Superalloys. NDT E Int. 2020, 113, 102279. [Google Scholar] [CrossRef]
  31. Song, B.; Dong, S.; Liao, H.; Coddet, C. Process Parameter Selection for Selective Laser Melting of Ti6Al4V Based on Temperature Distribution Simulation and Experimental Sintering. Int. J. Adv. Manuf. Technol. 2012, 61, 967–974. [Google Scholar] [CrossRef]
  32. Saboori, A.; Gallo, D.; Biamino, S.; Fino, P.; Lombardi, M. An Overview of Additive Manufacturing of Titanium Components by Directed Energy Deposition: Microstructure and Mechanical Properties. Appl. Sci. 2017, 7, 883. [Google Scholar] [CrossRef] [Green Version]
  33. Reutzel, E.W.; Nassar, A.R. A Survey of Sensing and Control Systems for Machine and Process Monitoring of Directed-Energy, Metal-Based Additive Manufacturing. Rapid Prototyp. J. 2015, 21, 159–167. [Google Scholar] [CrossRef] [Green Version]
  34. Boddu, M.R.; Landers, R.G.; Liou, F.W. Control of Laser Cladding for Rapid Prototyping—A Review. In Proceedings of the 2001 International Solid Freeform Fabrication Symposium, Austin, TX, USA, 6–8 August 2001. [Google Scholar]
  35. Bi, G.; Gasser, A.; Wissenbach, K.; Drenker, A.; Poprawe, R. Identification and Qualification of Temperature Signal for Monitoring and Control in Laser Cladding. Opt. Lasers Eng. 2006, 44, 1348–1359. [Google Scholar] [CrossRef]
  36. Svetlizky, D.; Das, M.; Zheng, B.; Vyatskikh, A.L.; Bose, S.; Bandyopadhyay, A.; Schoenung, J.M.; Lavernia, E.J.; Eliaz, N. Directed Energy Deposition (DED) Additive Manufacturing: Physical Characteristics, Defects, Challenges and Applications. Mater. Today 2021, 49, 271–295. [Google Scholar] [CrossRef]
  37. Ahn, D.-G. Directed Energy Deposition (DED) Process: State of the Art. Int. J. Precis. Eng. Manuf.-Green Tech. 2021, 8, 703–742. [Google Scholar] [CrossRef]
  38. Zhu, L.; Xue, P.; Lan, Q.; Meng, G.; Ren, Y.; Yang, Z.; Xu, P.; Liu, Z. Recent Research and Development Status of Laser Cladding: A Review. Opt. Laser Technol. 2021, 138, 106915. [Google Scholar] [CrossRef]
  39. Liu, W.-W.; Tang, Z.-J.; Liu, X.-Y.; Wang, H.-J.; Zhang, H.-C. A Review on In-Situ Monitoring and Adaptive Control Technology for Laser Cladding Remanufacturing. Procedia CIRP 2017, 61, 235–240. [Google Scholar] [CrossRef]
  40. Tapia, G.; Elwany, A. A Review on Process Monitoring and Control in Metal-Based Additive Manufacturing. J. Manuf. Sci. Eng. 2014, 136, 060801. [Google Scholar] [CrossRef]
  41. Steen, W.M.; Mazumder, J. Laser Automation and In-Process Sensing. In Laser Material Processing; Springer: London, UK, 2010; pp. 485–518. [Google Scholar]
  42. Nassar, A.R.; Reutzel, E.W.; Brown, S.W.; Morgan, J.P.; Morgan, J.P.; Natale, D.J.; Tutwiler, R.L.; Feck, D.P.; Banks, J.C. Sensing for Directed Energy Deposition and Powder Bed Fusion Additive Manufacturing at Penn State University; Gu, B., Helvajian, H., Piqué, A., Eds.; SPIE: Bellingham, WA, USA, 2016; p. 97380R. [Google Scholar]
  43. Song, L.; Mazumder, J. Real Time Cr Measurement Using Optical Emission Spectroscopy During Direct Metal Deposition Process. IEEE Sens. J. 2012, 12, 958–964. [Google Scholar] [CrossRef]
  44. Stutzman, C.B.; Nassar, A.R.; Reutzel, E.W. Multi-Sensor Investigations of Optical Emissions and Their Relations to Directed Energy Deposition Processes and Quality. Addit. Manuf. 2018, 21, 333–339. [Google Scholar] [CrossRef]
  45. Honarvar, F.; Varvani-Farahani, A. A Review of Ultrasonic Testing Applications in Additive Manufacturing: Defect Evaluation, Material Characterization, and Process Control. Ultrasonics 2020, 108, 106227. [Google Scholar] [CrossRef] [PubMed]
  46. Park, S.-H.; Hong, J.-Y.; Ha, T.; Choi, S.; Jhang, K.-Y. Deep Learning-Based Ultrasonic Testing to Evaluate the Porosity of Additively Manufactured Parts with Rough Surfaces. Metals 2021, 11, 290. [Google Scholar] [CrossRef]
  47. Sotelo, L.D.; Karunakaran, R.; Pratt, C.S.; Sealy, M.P.; Turner, J.A. Ultrasound in Situ Characterization of Hybrid Additively Manufactured Ti6Al4V. J. Acoust. Soc. Am. 2021, 150, 4452–4463. [Google Scholar] [CrossRef]
  48. Smoqi, Z.; Sotelo, L.D.; Gaikwad, A.; Turner, J.A.; Rao, P. Ultrasonic Nondestructive Evaluation of Additively Manufactured Wear Coatings. NDT E Int. 2023, 133, 102754. [Google Scholar] [CrossRef]
  49. Hespeler, S.; Dehghan-Niri, E.; Juhasz, M.; Luo, K.; Halliday, H.S. Deep Learning for In-Situ Layer Quality Monitoring during Laser-Based Directed Energy Deposition (LB-DED) Additive Manufacturing Process. Appl. Sci. 2022, 12, 8974. [Google Scholar] [CrossRef]
  50. Sreeraj, P.R.; Mishra, S.K.; Singh, P.K. A Review on Non-Destructive Evaluation and Characterization of Additively Manufactured Components. Prog. Addit. Manuf. 2022, 7, 225–248. [Google Scholar] [CrossRef]
  51. Everton, S.K.; Hirsch, M.; Stravroulakis, P.; Leach, R.K.; Clare, A.T. Review of In-Situ Process Monitoring and in-Situ Metrology for Metal Additive Manufacturing. Mater. Des. 2016, 95, 431–445. [Google Scholar] [CrossRef]
  52. Smith, R.J.; Hirsch, M.; Patel, R.; Li, W.; Clare, A.T.; Sharples, S.D. Spatially Resolved Acoustic Spectroscopy for Selective Laser Melting. J. Mater. Process. Technol. 2016, 236, 93–102. [Google Scholar] [CrossRef]
  53. Millon, C.; Vanhoye, A.; Obaton, A.-F.; Penot, J.-D. Development of Laser Ultrasonics Inspection for Online Monitoring of Additive Manufacturing. Weld. World 2018, 62, 653–661. [Google Scholar] [CrossRef]
  54. Davis, G.; Nagarajah, R.; Palanisamy, S.; Rashid, R.A.R.; Rajagopal, P.; Balasubramaniam, K. Laser Ultrasonic Inspection of Additive Manufactured Components. Int. J. Adv. Manuf. Technol. 2019, 102, 2571–2579. [Google Scholar] [CrossRef]
  55. Pieris, D.; Stratoudaki, T.; Javadi, Y.; Lukacs, P.; Catchpole-Smith, S.; Wilcox, P.D.; Clare, A.; Clark, M. Laser Induced Phased Arrays (LIPA) to Detect Nested Features in Additively Manufactured Components. Mater. Des. 2019, 187, 108412. [Google Scholar] [CrossRef]
  56. Park, S.-H.; Liu, P.; Yi, K.; Choi, G.; Jhang, K.-Y.; Sohn, H. Mechanical Properties Estimation of Additively Manufactured Metal Components Using Femtosecond Laser Ultrasonics and Laser Polishing. Int. J. Mach. Tools Manuf. 2021, 166, 103745. [Google Scholar] [CrossRef]
  57. Yu, J.; Zhang, D.; Li, H.; Song, C.; Zhou, X.; Shen, S.; Zhang, G.; Yang, Y.; Wang, H. Detection of Internal Holes in Additive Manufactured Ti-6Al-4V Part Using Laser Ultrasonic Testing. Appl. Sci. 2020, 10, 365. [Google Scholar] [CrossRef] [Green Version]
  58. Zou, Y.; Chai, Y.; Wang, D.; Li, Y. Measurement of Elastic Modulus of Laser Cladding Coatings by Laser Ultrasonic Method. Opt. Laser Technol. 2022, 146, 107567. [Google Scholar] [CrossRef]
  59. Bakre, C.; Lissenden, C.J. Surface Roughness Effects on Self-Interacting and Mutually Interacting Rayleigh Waves. Sensors 2021, 21, 5495. [Google Scholar] [CrossRef] [PubMed]
  60. Bakre, C.; Nassar, A.R.; Reutzel, E.W.; Lissenden, C.J. Ultrasonic Rayleigh Wave Interrogation of Directed Energy Deposition Ti–6Al–4V Having a Rough Surface. J. Nondestruct. Eval. Diagn. Progn. Eng. Syst. 2022, 5, 031008. [Google Scholar] [CrossRef]
  61. Bakre, C.; Meyer, T.; Jamieson, C.; Nassar, A.R.; Reutzel, E.W.; Lissenden, C.J. In-Situ Laser Ultrasound-Based Rayleigh Wave Process Monitoring of DED-AM Metals. Res. Nondestruct. Eval. 2022, 1–25. [Google Scholar] [CrossRef]
  62. Krishnaswamy, S. Theory and Applications of Laser-Ultrasonic Techniques. In Ultrasonic Nondestructive Evaluation; CRC Press: Boca Raton, FL, USA, 2004; pp. 436–489. [Google Scholar]
  63. Dong, Z.; Liu, Y.; Wen, W.; Ge, J.; Liang, J. Effect of Hatch Spacing on Melt Pool and As-Built Quality During Selective Laser Melting of Stainless Steel: Modeling and Experimental Approaches. Materials 2018, 12, 50. [Google Scholar] [CrossRef] [PubMed]
Figure 1. Nonlinear Rayleigh particle velocity waveform sketches based on [14].
Applsci 12 12208 g001
Figure 2. Particle velocity and displacement waveforms from aluminum substrate at (a) 13.9 mm and (b) 26.7 mm. v3 was detected by Kolomenskii and Schuessler [14] and digitized by us, then v1 was computed using the Hilbert transform, and finally u3 and u1 were computed by numerical integration. All waveforms are at the surface x3 = 0.
Applsci 12 12208 g002
Figure 3. Particle velocity and displacement waveform evolution predicted by Shull et al. model [24] for IN-718: v1, v3, u1, u3. The nondimensional abscissa is the product of the initial monochromatic frequency and the retarded time. The nondimensional ordinate is the waveform normalized with respect to the initial amplitude of the v1 sinusoid. X is propagation distance normalized with respect to shock formation distance.
Applsci 12 12208 g003
Figure 4. Laser ultrasound system integrated into DED-AM chamber: (a) photograph, (b) schematic.
Applsci 12 12208 g004
Figure 5. Cross-sections of (a) Ti-6Al-4V and (b) IN-718 AM depositions on baseplate.
Applsci 12 12208 g005
Figure 6. Sample u3 displacement waveforms for Ti-6Al-4V received by laser interferometer after propagation distances of 4–24 mm for baseplate and AM deposition.
Applsci 12 12208 g006
Figure 7. (a) Schematic representatives of V-shaped waveforms in Figure 6 for low pulse energy and high pulse energy, (b) Normalized peak-to-peak amplitude evolution with propagation distance for Ti-6Al-4V AM, with mean and standard deviation.
Applsci 12 12208 g007
Figure 8. Steepness of Ti-6Al-4V AM waveforms in Figure 6 as a function of propagation distance, with mean and standard deviation.
Applsci 12 12208 g008
Figure 9. Sample v1 and v3 velocity waveforms derived from the displacement waveforms in Figure 6.
Applsci 12 12208 g009
Figure 10. Three different Ti-6Al-4V AM depositions for process parameter set A in Table 1 received at (a) point 1 and (b) point 2.
Applsci 12 12208 g010
Figure 11. Ti-6Al-4V AM depositions for process parameter sets A, B, C in Table 1 received at (a) point 1 and (b) point 2.
Applsci 12 12208 g011
Figure 12. Frequency spectra for signals received at point 1 (Figure 11a) for process parameter sets A, B, C.
Applsci 12 12208 g012
Figure 13. IN-718 process parameter sets D, E, F where processing laser speed changes. Signals received at (a) 23 mm, (b) 39 mm.
Applsci 12 12208 g013
Figure 14. IN-718, 28 mm propagation distance, process parameter sets D, G, H where hatch spacing changes given laser pulse energies of (a) 30 mJ, (b) 120 mJ.
Applsci 12 12208 g014
Table 1. Process parameter sets for DED-AM builds.
SetMaterialLaser Power (W)Scan Speed (mm/s)Hatch Spacing (mm)
A 1Ti-6Al-4V45010.60.8
BTi-6Al-4V38010.60.8
CTi-6Al-4V45010.60.9
D 1IN-71840010.60.6
EIN-7184009.30.6
FIN-71840011.80.6
GIN-71840010.60.75
HIN-71840010.60.85
1 Nominal processing parameters.
Table 2. DED-AM build sequence with laser ultrasound (LU) testing.
1234
Ti-6Al-4VTi-6Al-4VIN-718IN-718
baseplatebaseplatebaseplatebaseplate
4 layers Set A4 layers Set A4 layers Set D4 layers Set D
LU testLU testLU testLU test
4 layers Set B4 layers Set C4 layers Set E4 layers Set G
LU testLU testLU testLU test
4 layers Set F4 layers Set H
LU testLU test
Table 3. Profilometer-measured surface roughness.
MaterialSa (µm)Sq (µm)Sz (μm)
Ti-6Al-4V baseplate1.141.4210.25
Ti-6Al-4V Set A33.0441.39371.4
Ti-6Al-4V Set B33.0942.26385.7
Ti-6Al-4V Set C30.6338.84397.0
IN-718 baseplate3.724.6433.94
IN-718 Set D19.5925.23264.7
IN-718 Set E18.2722.65318.5
IN-718 Set F17.5221.76352.1
IN-718 Set G13.8918.16237.8
IN-718 Set H25.6031.82293.3
Publisher’s Note: MDPI stays neutral with regard to jurisdictional claims in published maps and institutional affiliations.

