Article

Laser-Ultrasound-Based Grain Size Gauge for the Hot Strip Mill

1
Swerim AB, 164 40 Stockholm, Sweden
2
SSAB EMEA AB, 781 84 Borlänge, Sweden
3
EMG Automation GmbH, 57482 Wenden, Germany
*
Author to whom correspondence should be addressed.
Appl. Sci. 2022, 12(19), 10048; https://doi.org/10.3390/app121910048
Submission received: 20 September 2022 / Revised: 30 September 2022 / Accepted: 4 October 2022 / Published: 6 October 2022
(This article belongs to the Special Issue Application of Laser-Ultrasonics in Metal Processing)

Abstract

:
The paper summarizes the creation of a robust online grain size gauge for a hot strip mill. A method and algorithm for calculating the grain size from the measured ultrasonic attenuation is presented. This new method is self-calibrating, does not rely on a geometrical reference sample and can cope with the effects of diffraction on the attenuation. The model is based on 52 quenched samples measured with more than 23,000 laser ultrasonics shots and has a correlation coefficient R2 of 0.8. Typical online laser ultrasonic measurements from the hot strip mill and the calculated grain size versus length are presented for a couple of steel strips.

1. Introduction

The properties of high-strength steel, and many other steels, depend to a large extent on the austenite grain size prior to cooling. It is, therefore, very desirable to be able to characterize the austenite microstructure during the hot rolling process. However, the temperatures of the material of interest in a hot strip mill ranges between 800–1200 °C, and the material moves at 1–10 m/s. Due to these severe conditions, the only method capable of measuring the microstructure in bulk is laser ultrasonics (LUS), which is a non-contact measurement technique for generating and detecting ultrasonic waves in a material using lasers. There are a few variations of how this technique can be employed. However, the most common setup is to use a short-pulsed Q-switched laser directed to the surface of the material to generate the ultrasound and use another laser to detect the response. The short high-energy pulses of the Q-switched laser create plasma on the surface, which, due to thermal expansion, generates an ultrasonic shockwave that propagates through the material. The ultrasonic response is then measured by analyzing the Doppler shift of the surface reflection on the material usually from a single-longitudinal-mode laser. A more thorough description of the LUS technique can be found elsewhere in the literature, e.g., Scruby and Drain [1].
The laser ultrasonic technique that was developed in the 1980s and the 1990s has been commercially employed in the metal industry to monitor the wall thickness during the production of seamless tubes [2] since the beginning of the 2000s. There are currently tens of these LUS-based thickness gauges installed in tube mills around the world.
The research community has furthermore shown the potential for measuring material properties in-line with LUS [3,4,5,6,7,8]. More recently, it was also shown that LUS has the possibility of reliably measuring grain size during the hot rolling of steel strips in a hot strip mill [9,10,11]. The work presented herein summarizes the creation of a new LUS grain size gauge installed in the hot strip mill at Borlänge in Sweden. This first permanent system to monitor the microstructure during hot rolling was installed in 2022, positioned after the last stand and before the run-out table, in the SSAB mill.
In order to develop a gauge with a robust grain-size calculation, a new model and algorithm has been developed, which is corrected for temperature and does not require a reference sample [12]. Additionally, the grain size gauge has been equipped with optics for a long working distance of 600 mm and suitable protection for the harsh environment.

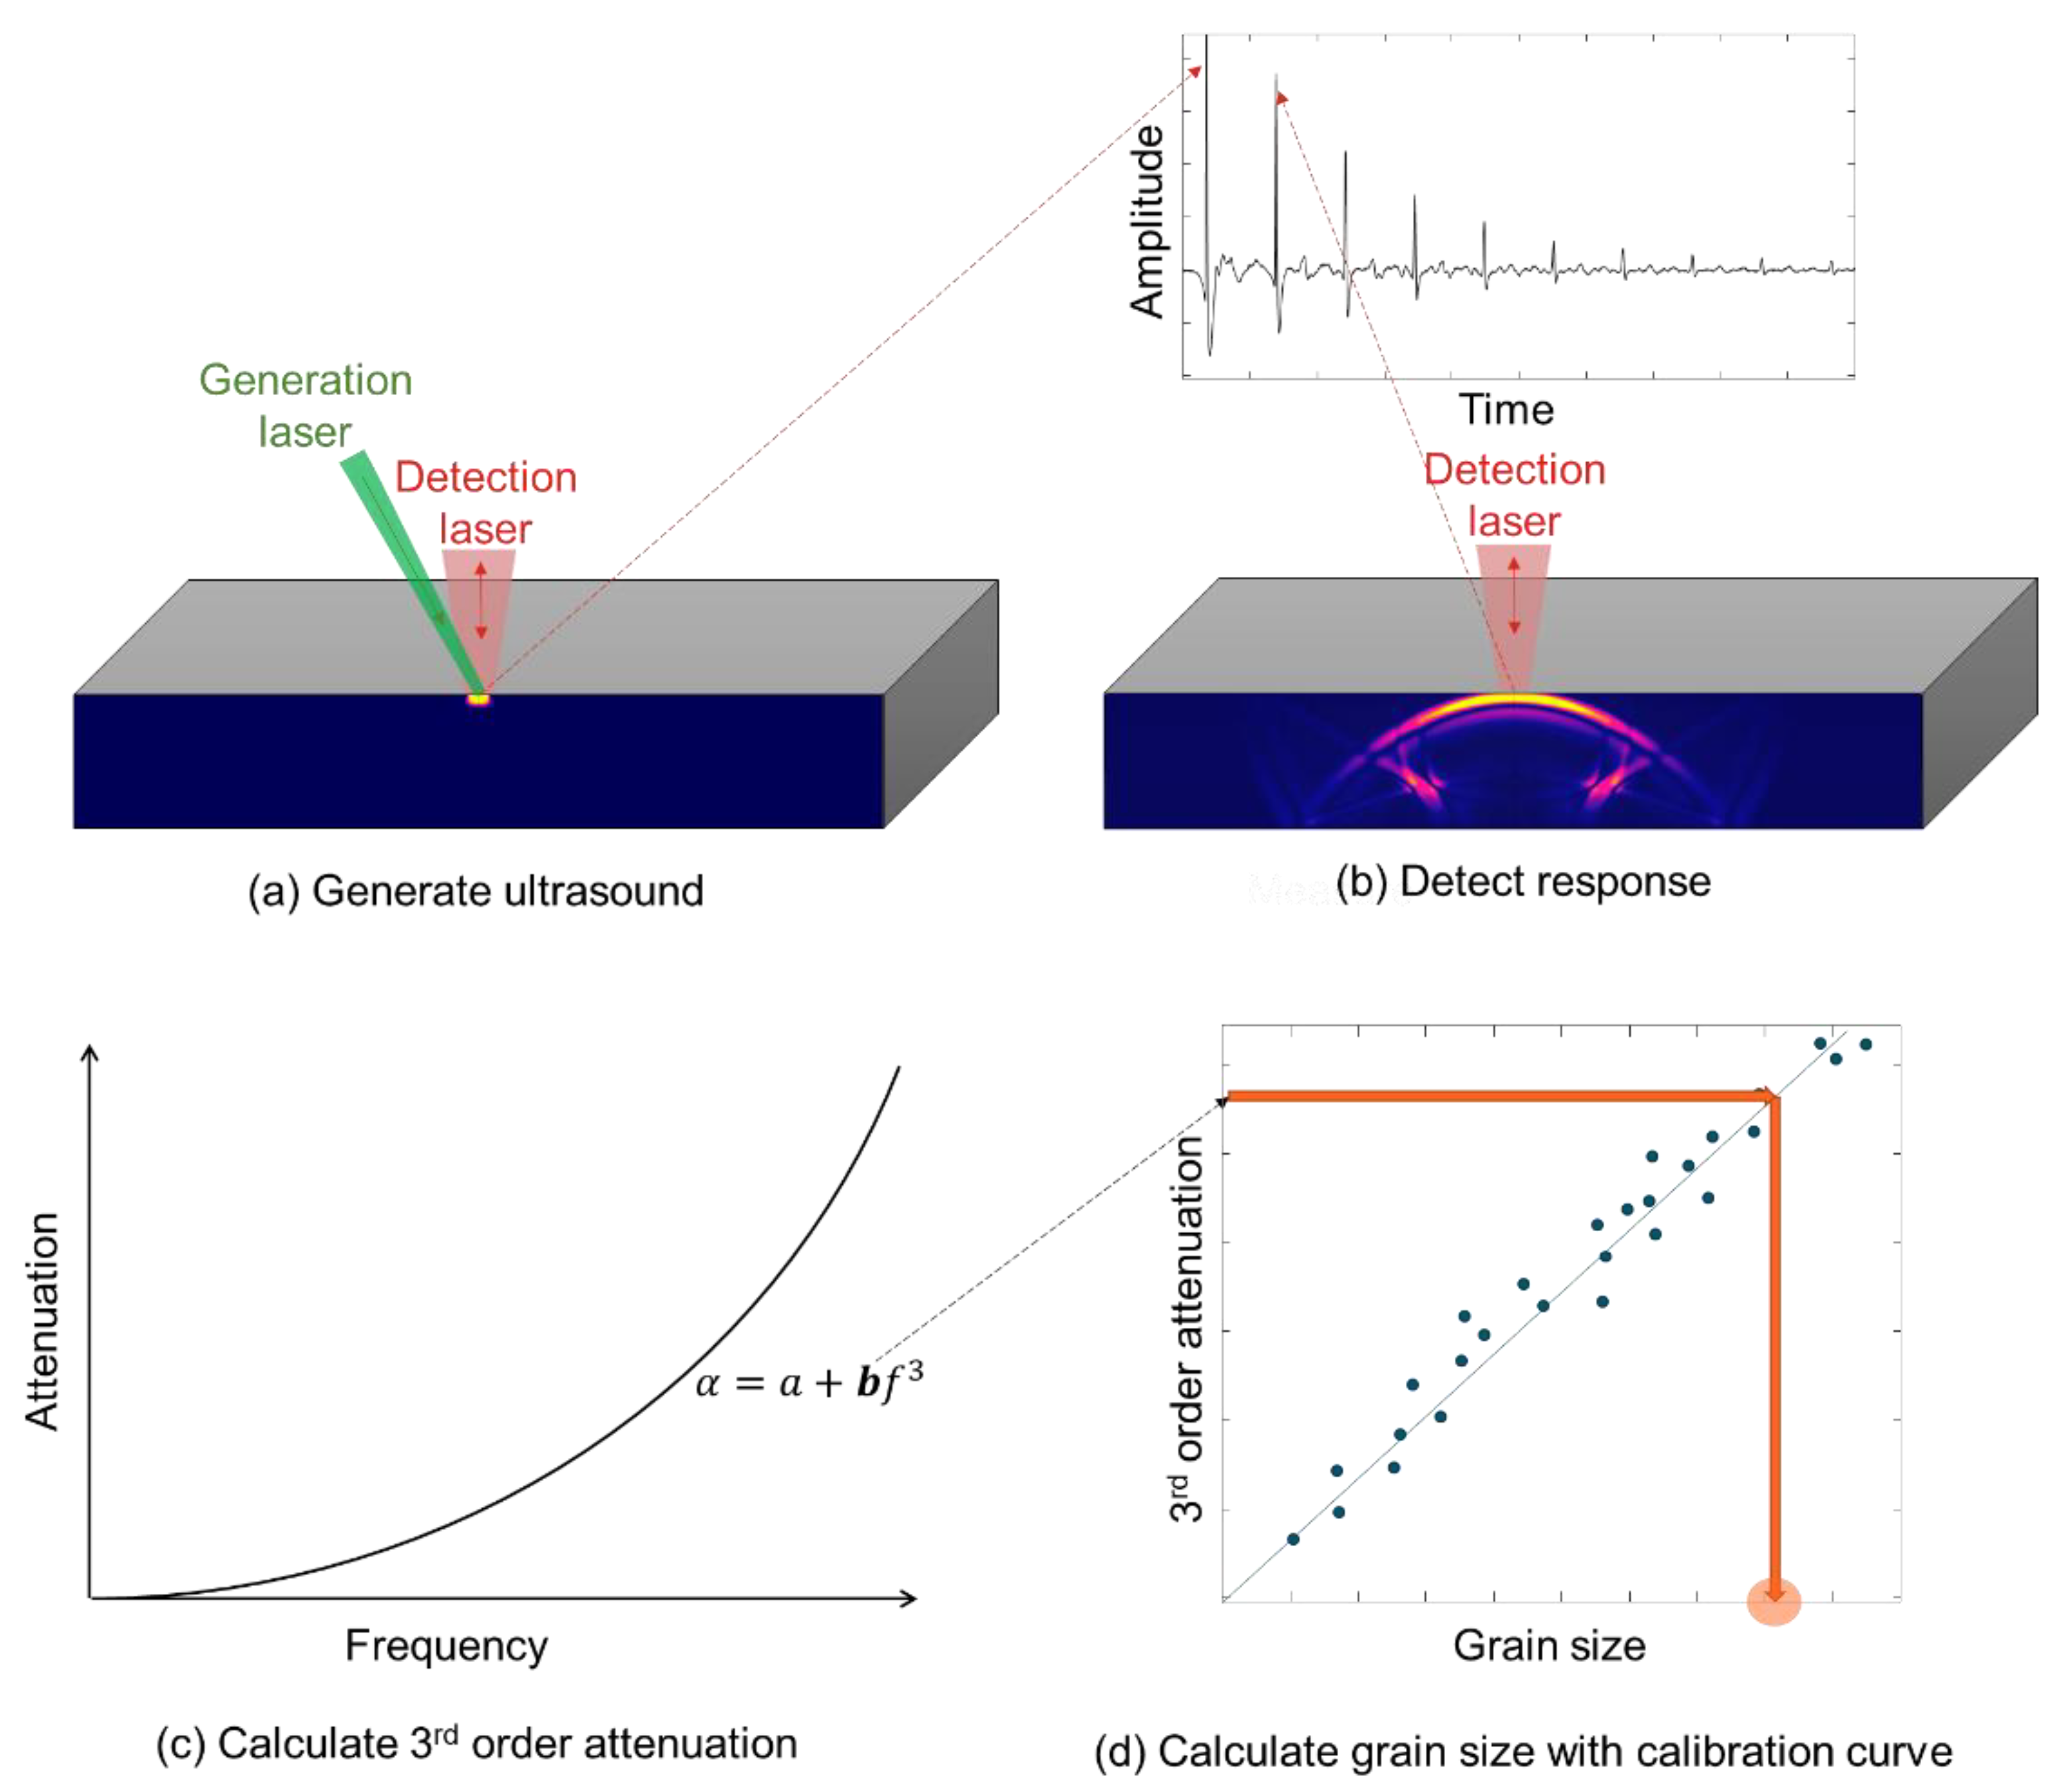
Grain-Size Measurement with Laser Ultrasonics

Ultrasonic attenuation has been used to characterize microstructure in polycrystalline materials for a long time and there are numerous proposed methods. Some of the suggestions for analyzing laser ultrasound include monitoring the rise-time of the echoes [13]; the multiple echo method [14,15], wherein the attenuation between two echoes are compared; and later the single echo method [16], which is an ingenious way of circumventing the diffraction effects and thus calculating the grain size rather accurately. In addition, more exotic methods have been proposed, such as backscattering amplitude analysis [17] and machine learning [18]. These methods have their individual strengths and weaknesses, and the conditions for which they are robust and valid depend on the experimental setup, as well as the material properties of the object being studied. Currently, there is no method that is universally supreme. Instead, one must select that method that fits best for the requirement of the application of interest and apply the appropriate assumptions/simplifications.
In the present paper, the frequency-dependent attenuation is considered to calculate the grain size. Generally, four steps are involved to acquire the average through-thickness grain size, which is illustrated in Figure 1a–d below. Figure 1a displays a schematic of a sample cross-section where the ultrasound is generated by laser ablation on the surface, which creates a shockwave in the material. The ultrasonic response of a sample is acquired by recording the surface vibration amplitude as a function of time for several backwall echoes, illustrated by Figure 1b. The cross-section of the sample illustrates the ultrasonic wave as the first backwall echo reaches the surface, which corresponds to the second peak in the A-scan. In Figure 1c, a theoretical plot of the measured frequency-dependent ultrasonic attenuation for the echoes is displayed. Finally, the grain size is acquired with a calibration curve, which transfers the measured 3rd order attenuation b to a grain size value, as illustrated in Figure 1d.
The total ultrasonic attenuation α can be described by the sum of three parts as:
α = α a b s + α d i f f + α s c a t
where α a b s is the material absorption stemming from, e.g., internal friction, α d i f f is the frequency-dependent attenuation due to diffraction, and α s c a t is the frequency-dependent attenuation describing the average grain-scattering effects that in turn are dependent on the material properties, such as the anisotropy, texture and the average grain size. The LUS measurement of attenuation in the material is a sum of all of the scattering events at the grain boundaries, where the reflected/scattered/refracted waves reach the area of the detection laser. Scattering in polycrystalline materials has been described in the literature by, e.g., [19] and is simplified to the following relation between the average grain size D ¯ and the attenuation due to scattering:
α s c a t ~ K ( T ) D ¯ n 1 f n ,
where n is dependent on the scattering regime (Rayleigh n = 4, stochastic n = 2), and K(T) accounts for the temperature-dependent anisotropy. The frequency range considered here is roughly 1–40 MHz, which is in between the stochastic and the Rayleigh regimes. It has been shown that fixing the exponent to n = 3 gives a reasonable linearization of the problem [20,21,22,23,24]. Additionally, if only high enough frequencies are considered in the calculation, then the effects from diffraction are small in comparison and can be neglected. The result of this is that the total attenuation can be written as:
α = a + b f 3 ,
where
b = K ( T ) D ¯ 2 ,
and a is a constant offset which contains the material absorption and other constant contributions. For the actual grain-size calculations, only the third-order frequency-dependent attenuation b is considered, and the first parameter a is disregarded. For convenience, the average grain size can be expressed as
D ¯ = Γ ( T ) b ,
where b = 1000 b and Γ ( T ) = 1 K ( T ) is a transfer function from attenuation to grain size containing the material- and temperature-dependent factors, such as anisotropy/texture.
The challenge of calculating the grain size from laser ultrasonic measurements consists of knowing the transfer function, i.e., the calibration curve, which can be obtained theoretically or, as in the present paper, experimentally, by comparing the measured attenuation on several samples with accompanying microscopy for the determination of the actual grain size.

2. Materials and Methods

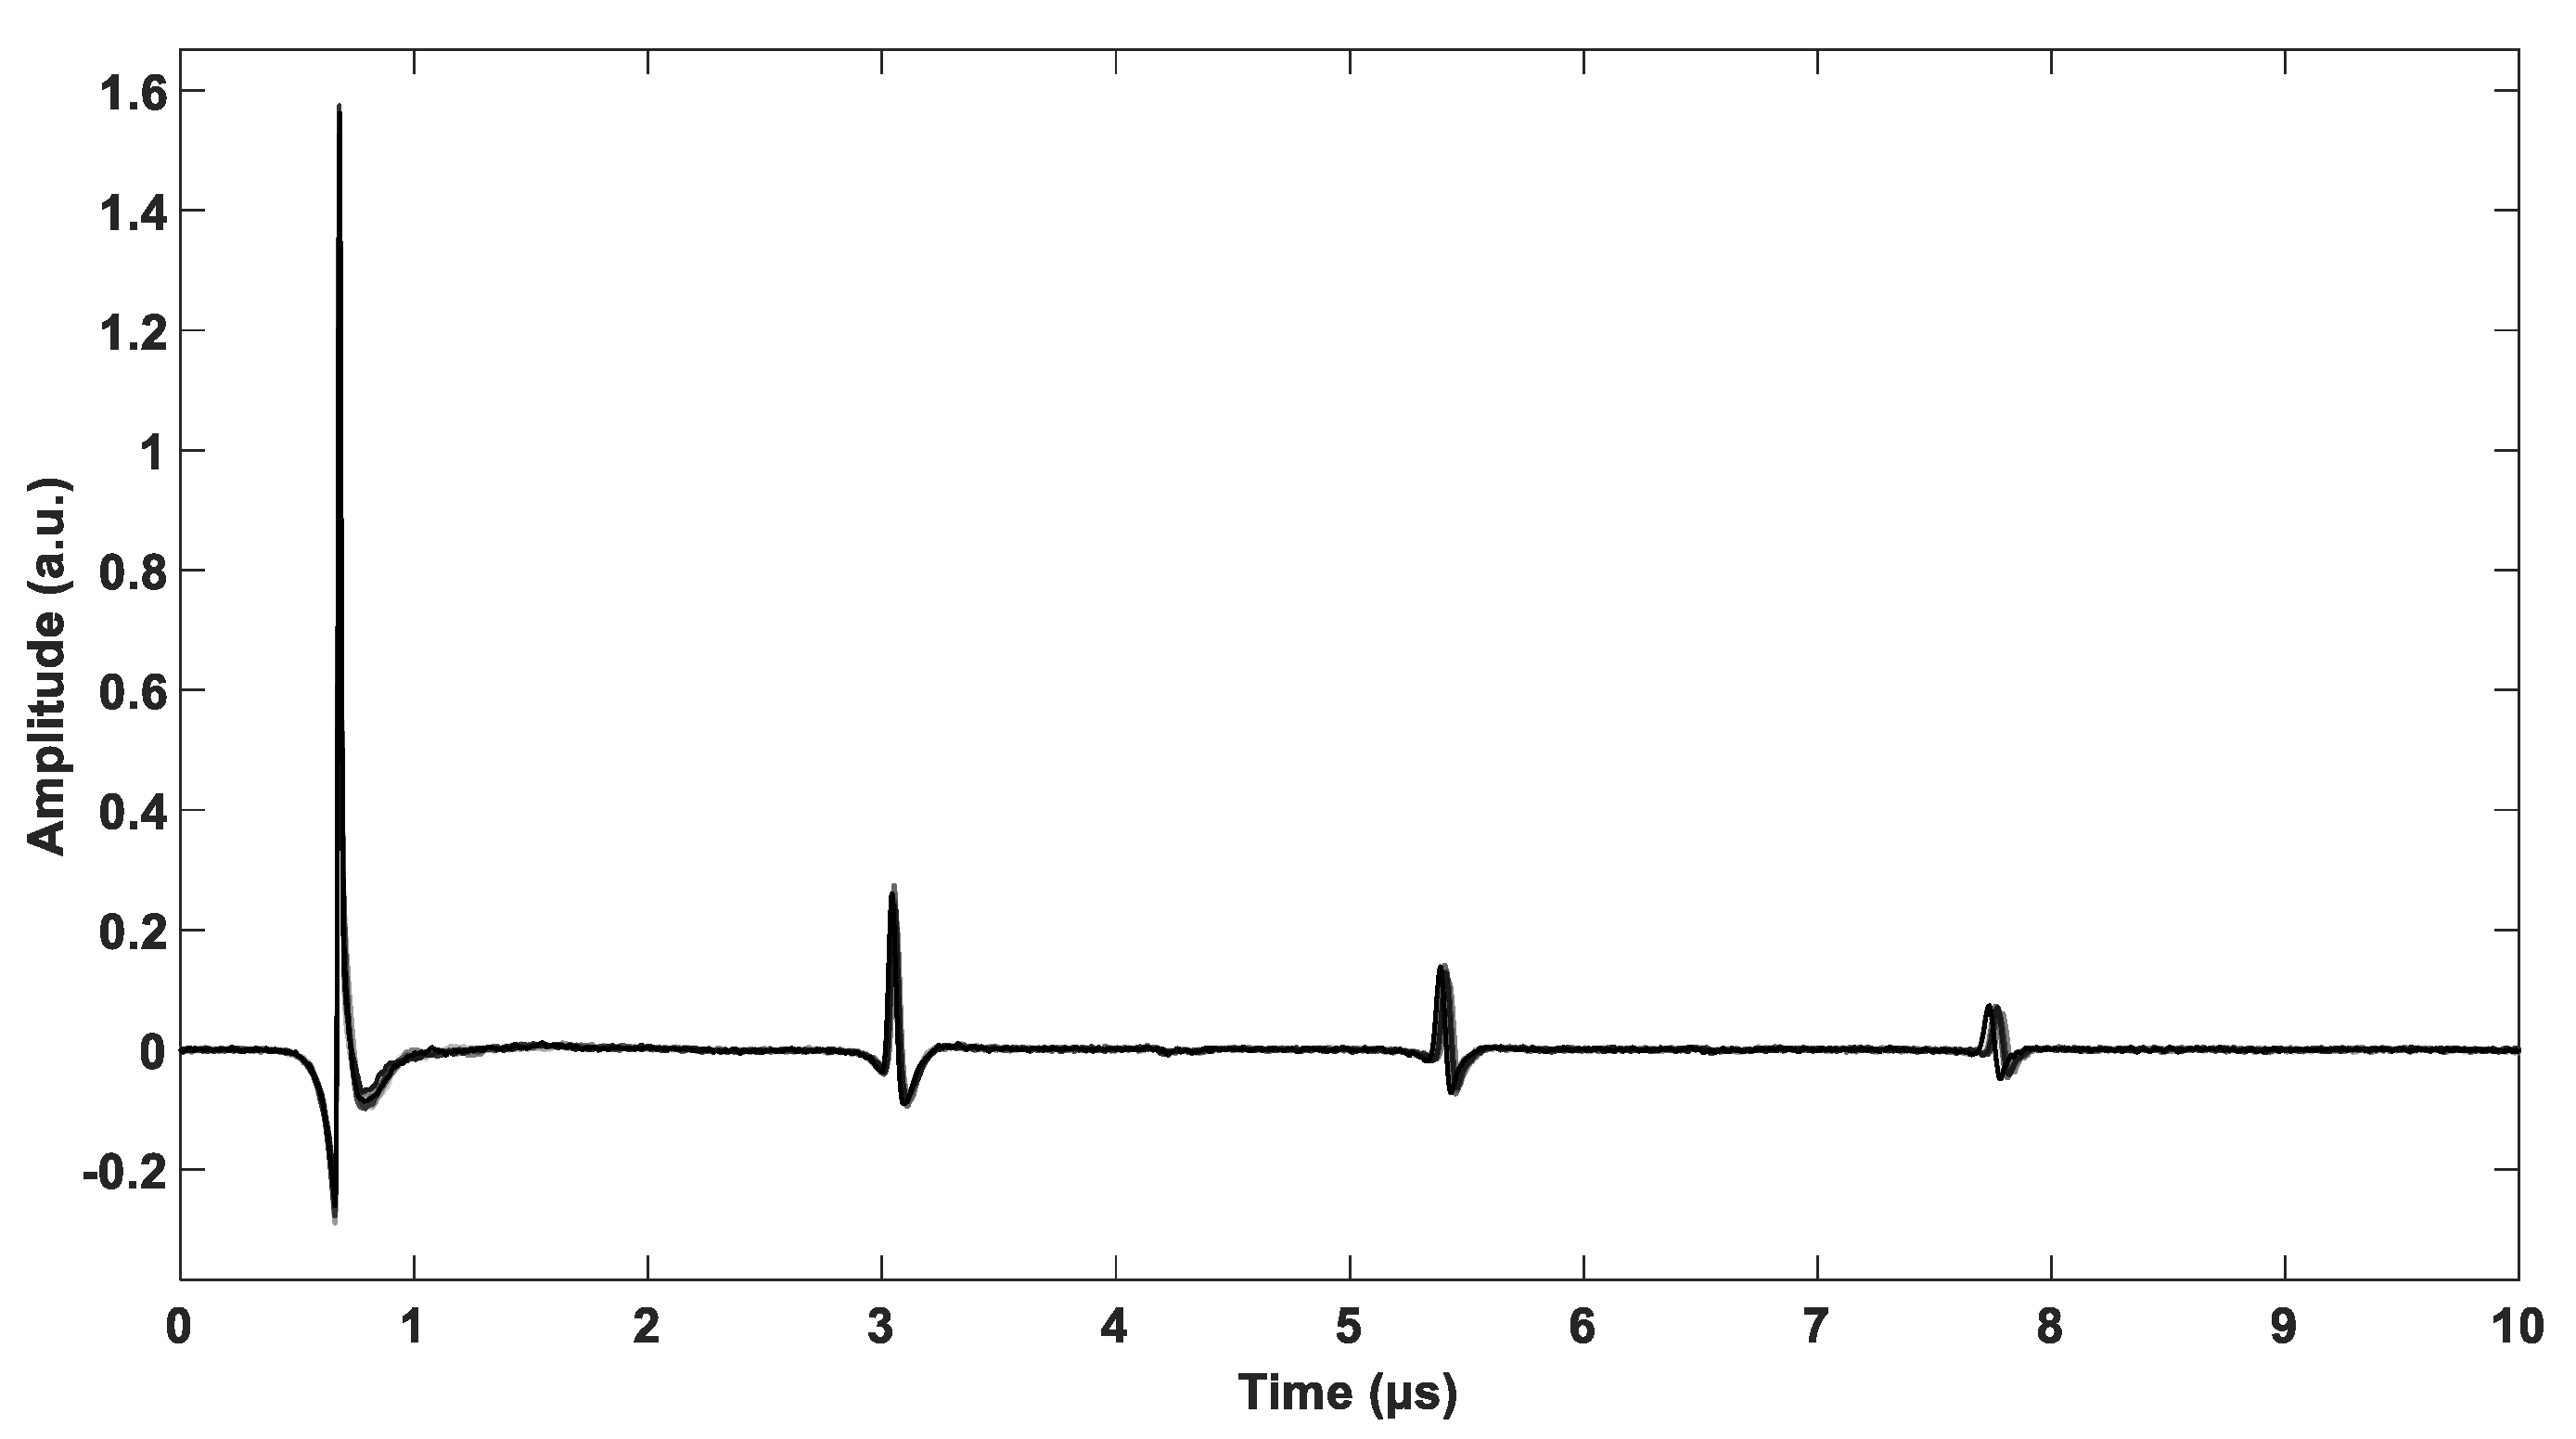
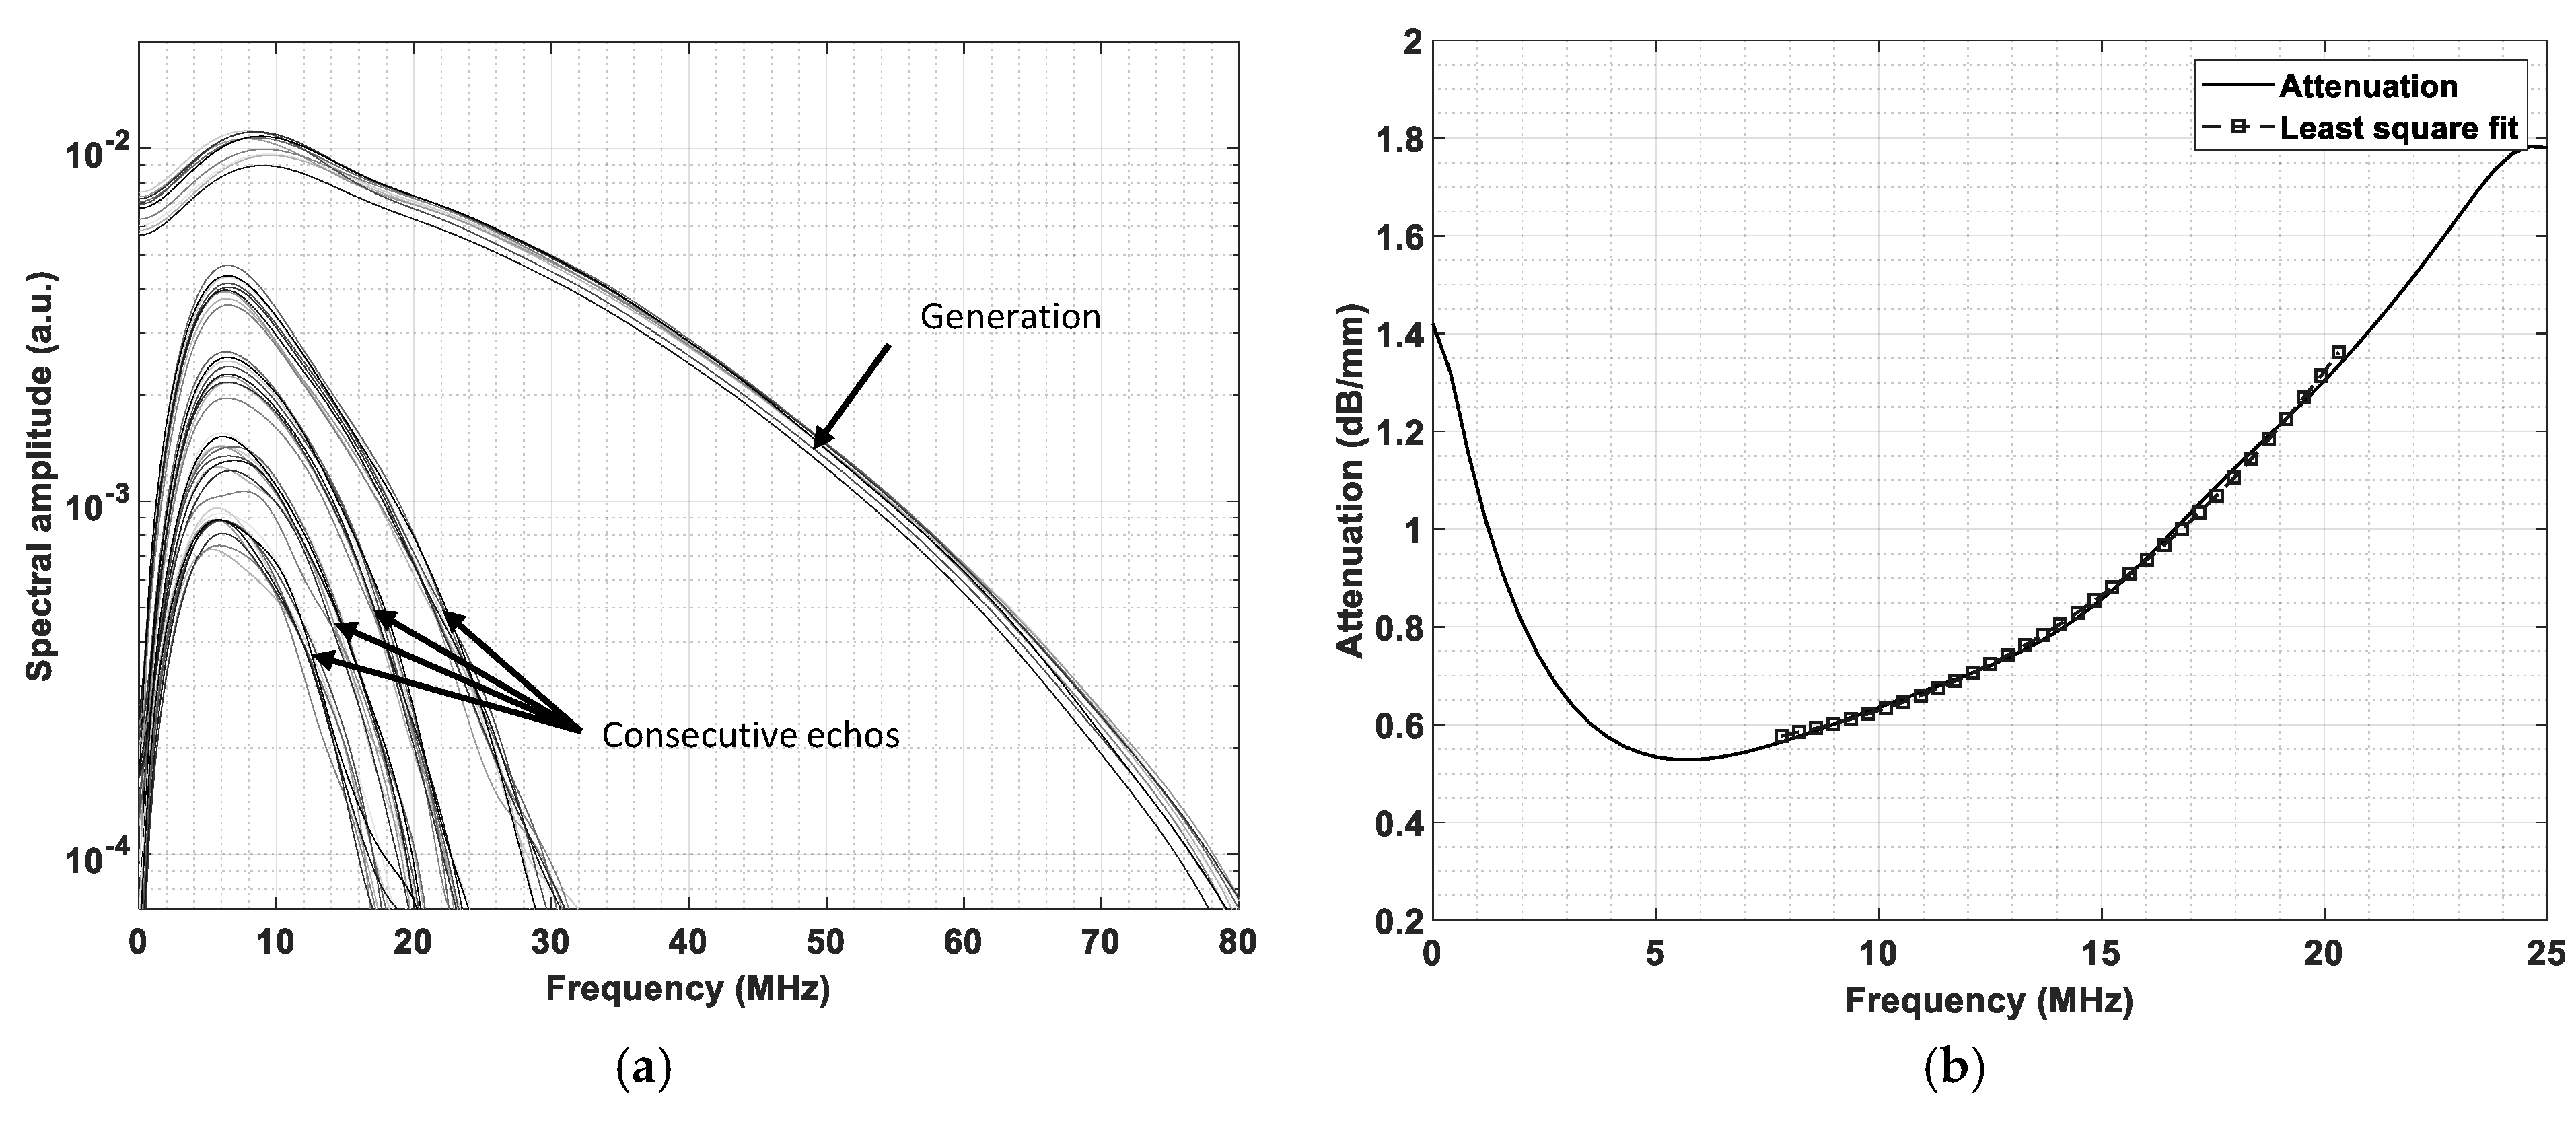
2.1. The Generation Event Method

The ultrasonic method/algorithm developed herein is an adaptation of the multiple echo method, wherein the frequency-dependent attenuation is evaluated, after which the grain size is calculated using a calibration curve. The unique aspect of this new method is that the reference spectrum that is used for the attenuation calculation is the actual generation event. Typically, with epicentric LUS measurements, the surface movement during the generation/ablation is too large to fit within the dynamic range of the interferometer. This is especially prominent when the sample is at room temperature, since the surface moves significantly due to the thermal expansion. However, during a trial measurement campaign in a hot strip mill in 2018 [10], it was empirically observed that the LUS measurement conditions in the hot strip mill were so favorable that the surface movement of the generation/ablation could be fully measured. Figure 2 shows ten LUS measurements on a strip, where the generation event is the first peak at 0.7 µs and the three following peaks are the consecutive backwall echoes with a peak-to-peak separation of ~2.4 µs. The measurement of the whole strip contains more than a thousand shots, but only ten A-scans are shown for clarity.
The reason why the generation event could be measured in the mill is believed to be due to the material temperature at the generation spot being close to the melting temperature, which limits the available surface movement by thermal expansion. During ablation, the uppermost part of the surface is heated to the melting point. Considering that surface movement is proportional to the temperature change ΔT, the change at the generation point for a sample starting at room temperature is almost 1000 degrees larger than for the strip in the mill, which starts at ~1000 °C.
Figure 3a displays the frequency content of the ten generation events presented in Figure 2, as well the consecutive backwall echoes. The data clearly shows that the higher frequencies are attenuated more than the lower frequencies. In the method/algorithm developed herein, the measured generation event serves as the reference spectrum for the following attenuation analysis. Therefore, the online system is self-calibrating in the sense that if the generation laser pulse characteristics, or any of the environmental factors, change, then the system will automatically adapt. This is because the spectrum for the generation event that is used for evaluation will mirror these changes. However, using the generation-event spectrum as a reference requires that the method for calculating the grain size can cope with the effects from diffraction, which is mainly managed by using only adequately high frequencies when fitting the data to Equation (3). Additionally, if the grain size is relatively small, then the US attenuation will be low, and several echoes will have a high enough signal-to-noise ratio (SNR) and can serve as input to the attenuation analysis. If, on the other hand, the grain size is relatively large, the grain scattering effects will be larger than the diffraction effects. In this case, the measurement may only contain one backwall echo, but since the measured attenuation is then mainly due to grain scattering, most of the measured frequencies in the spectral analysis of the echo can be utilized in the attenuation analysis when fitting the data to Equation (3). Figure 3b displays the calculated attenuation (solid line) of one of the echoes presented in Figure 3a together with the result of the least square fit of the data to Equation (3) (dashed line with square markers). The result of the fit is only shown in the frequency region of consideration for the least square fitting.
To translate the measured attenuation to a grain size, a calibration curve is required, which is established by measuring the frequency-dependent attenuation on several samples with LUS in the hot state, and then quenching the samples from which the prior austenite grain size (PAGS) can be determined. Several definitions of grain size are available, e.g., grain size by American Society for Testing and Materials (ASTM) number, equivalent circle diameter (ECD or EQAD) and mean circular intercept length, and additionally these methods can be area-weighted, depending on the interest. In the present work, the mean linear intercept (MLI), including annealing twin boundaries, is used as the definition of grain size. While the twin crystals have the same ultrasonic impedance for normally incident longitudinal waves, the grains have almost random orientation, so that only a very small fraction of all of the twin boundaries meet this condition. Hence, the twin boundary should be treated as all other boundaries in terms of ultrasonic propagation.
The calibration curve is attained by comparing the known grain size to the LUS measurements at different temperatures, and a least square regression is performed to determine the function Γ ( T ) from Equation (5). The regression includes the austenite grain size determined with electron back scattering diffraction (EBSD) for the stainless steel samples that are austenitic at room temperature as well as in a hot state. The low alloying samples were also part of the regression, but since they underwent a phase transformation during quenching, their prior austenite grain size was analyzed with the martensite parent grain reconstruction (MPGR) technique [25]. The grain boundaries are defined in this work as a misorientation of >5°.
Various low-alloy steel and stainless steel samples were measured in the thermomechanical simulator GLEEBLE 3800 at Swerim in Stockholm with the ancillary in-house laser ultrasonics GLUS® for microstructure monitoring during thermal cycles. The samples had thicknesses between 3 and 5 mm, and most of them were flat, with a few exceptions, which were standard GLEEBLE cylindrical compression samples with a diameter of 10 mm. The samples were measured in either transmission or reflection mode, i.e., the lasers were directed at opposite sides or on the same side of the sample, respectively. For the GLUS measurements, the generation event could not be reliably measured, especially for the samples measured in transmission. Therefore, the reference spectrum used for the attenuation analysis of these samples was the average of the generation events measured in the mill during 2018 with the same lasers.
The various samples were annealed between 900 and 1200 °C for 2–3 min, after which they were held at ~900 °C for a few seconds before they were either quenched with air or naturally cooled down. The stainless steel samples are almost entirely austenitic from room temperature to annealing temperatures, so the ultrasonic response could be monitored during their natural cooling down to 100–200 °C. Some of the low-alloy samples were cooled close to their phase-transformation temperatures before quenching.

2.2. The Online Grain Size Gauge

A robust grain-size-calculation method was developed in this work for measuring the grain size in a hot strip mill in an automated fashion. In addition to the necessary protections in the obviously harsh environment, the prerequisites for a grain size gauge suitable for a hot strip mill after the last stand include a large standoff distance (>0.5 m), measurable thickness from a few mm to ~15 mm, measurable grain-size range from a few µm to several tens of µm and, preferably, a self-calibrating system.
This new LUS-based grain size gauge consists of a nanosecond-pulsed generation laser and a microsecond-pulsed detection laser. The generation laser is a Q-switched, flashlamp pumped laser delivering optical pulses at 20 Hz with a pulse energy up to 200 mJ and with a pulse length of 6 ns at a wavelength of 532 nm. The detection laser system comprises a single longitudinal-mode laser emitting at a 1064 nm wavelength that is amplified by a flashlamp-pumped Nd:YAG crystal delivering pulses of ~100 µs length and a peak power of 600 W. The reflected detection laser light is sent to a GaAs two-wave interferometer [26,27] to convert the frequency-modulated light into amplitude-modulated light that can be detected by photodiodes. The GaAs crystal is optically pumped by the same amplified single longitudinal-mode laser.
Figure 4a shows the layout of the hot strip mill and the placement of the LUS system. The hot strip mill process in Borlänge starts with a reheating furnace that heats the slabs to ~1250 °C, while the slabs are shifted through the furnace by walking-beams from one side to the other. After the slabs are heated, they are descaled before entering the roughing mill, where the slabs are reduced to ~3 cm thickness. After the reversible roughing mill, the material is coiled in a coil box, which evens out the temperature along the strip. The material is then passed on to the finishing mill, where the strip is reduced by the six consecutive stands to the final thickness between 2 and 15 mm. Figure 4b shows a photograph of the installed EMG iLUS grain size gauge, developed by the Swedish metal research institute Swerim and manufactured by the German company EMG Automation GmbH, just before the runout table.
The measurement head is the yellow box in the center of the image; in Figure 4b, it is mounted on a translation stage and moves up toward the hot strip between two strip guiding rollers during the grain-size measurement. The head contains the generation laser, whereas the detection laser is positioned in a cabinet a few meters away, and the laser light from it is guided through fibers to the optics inside the measurement head. The light from both lasers is re-focused onto the same spot on the strip, and the working distance of the measurement head is just over half a meter. On top of the head, a black funnel is visible, which has an integrated air-knife to protect the optics from dirt and water.

3. Results and Discussion

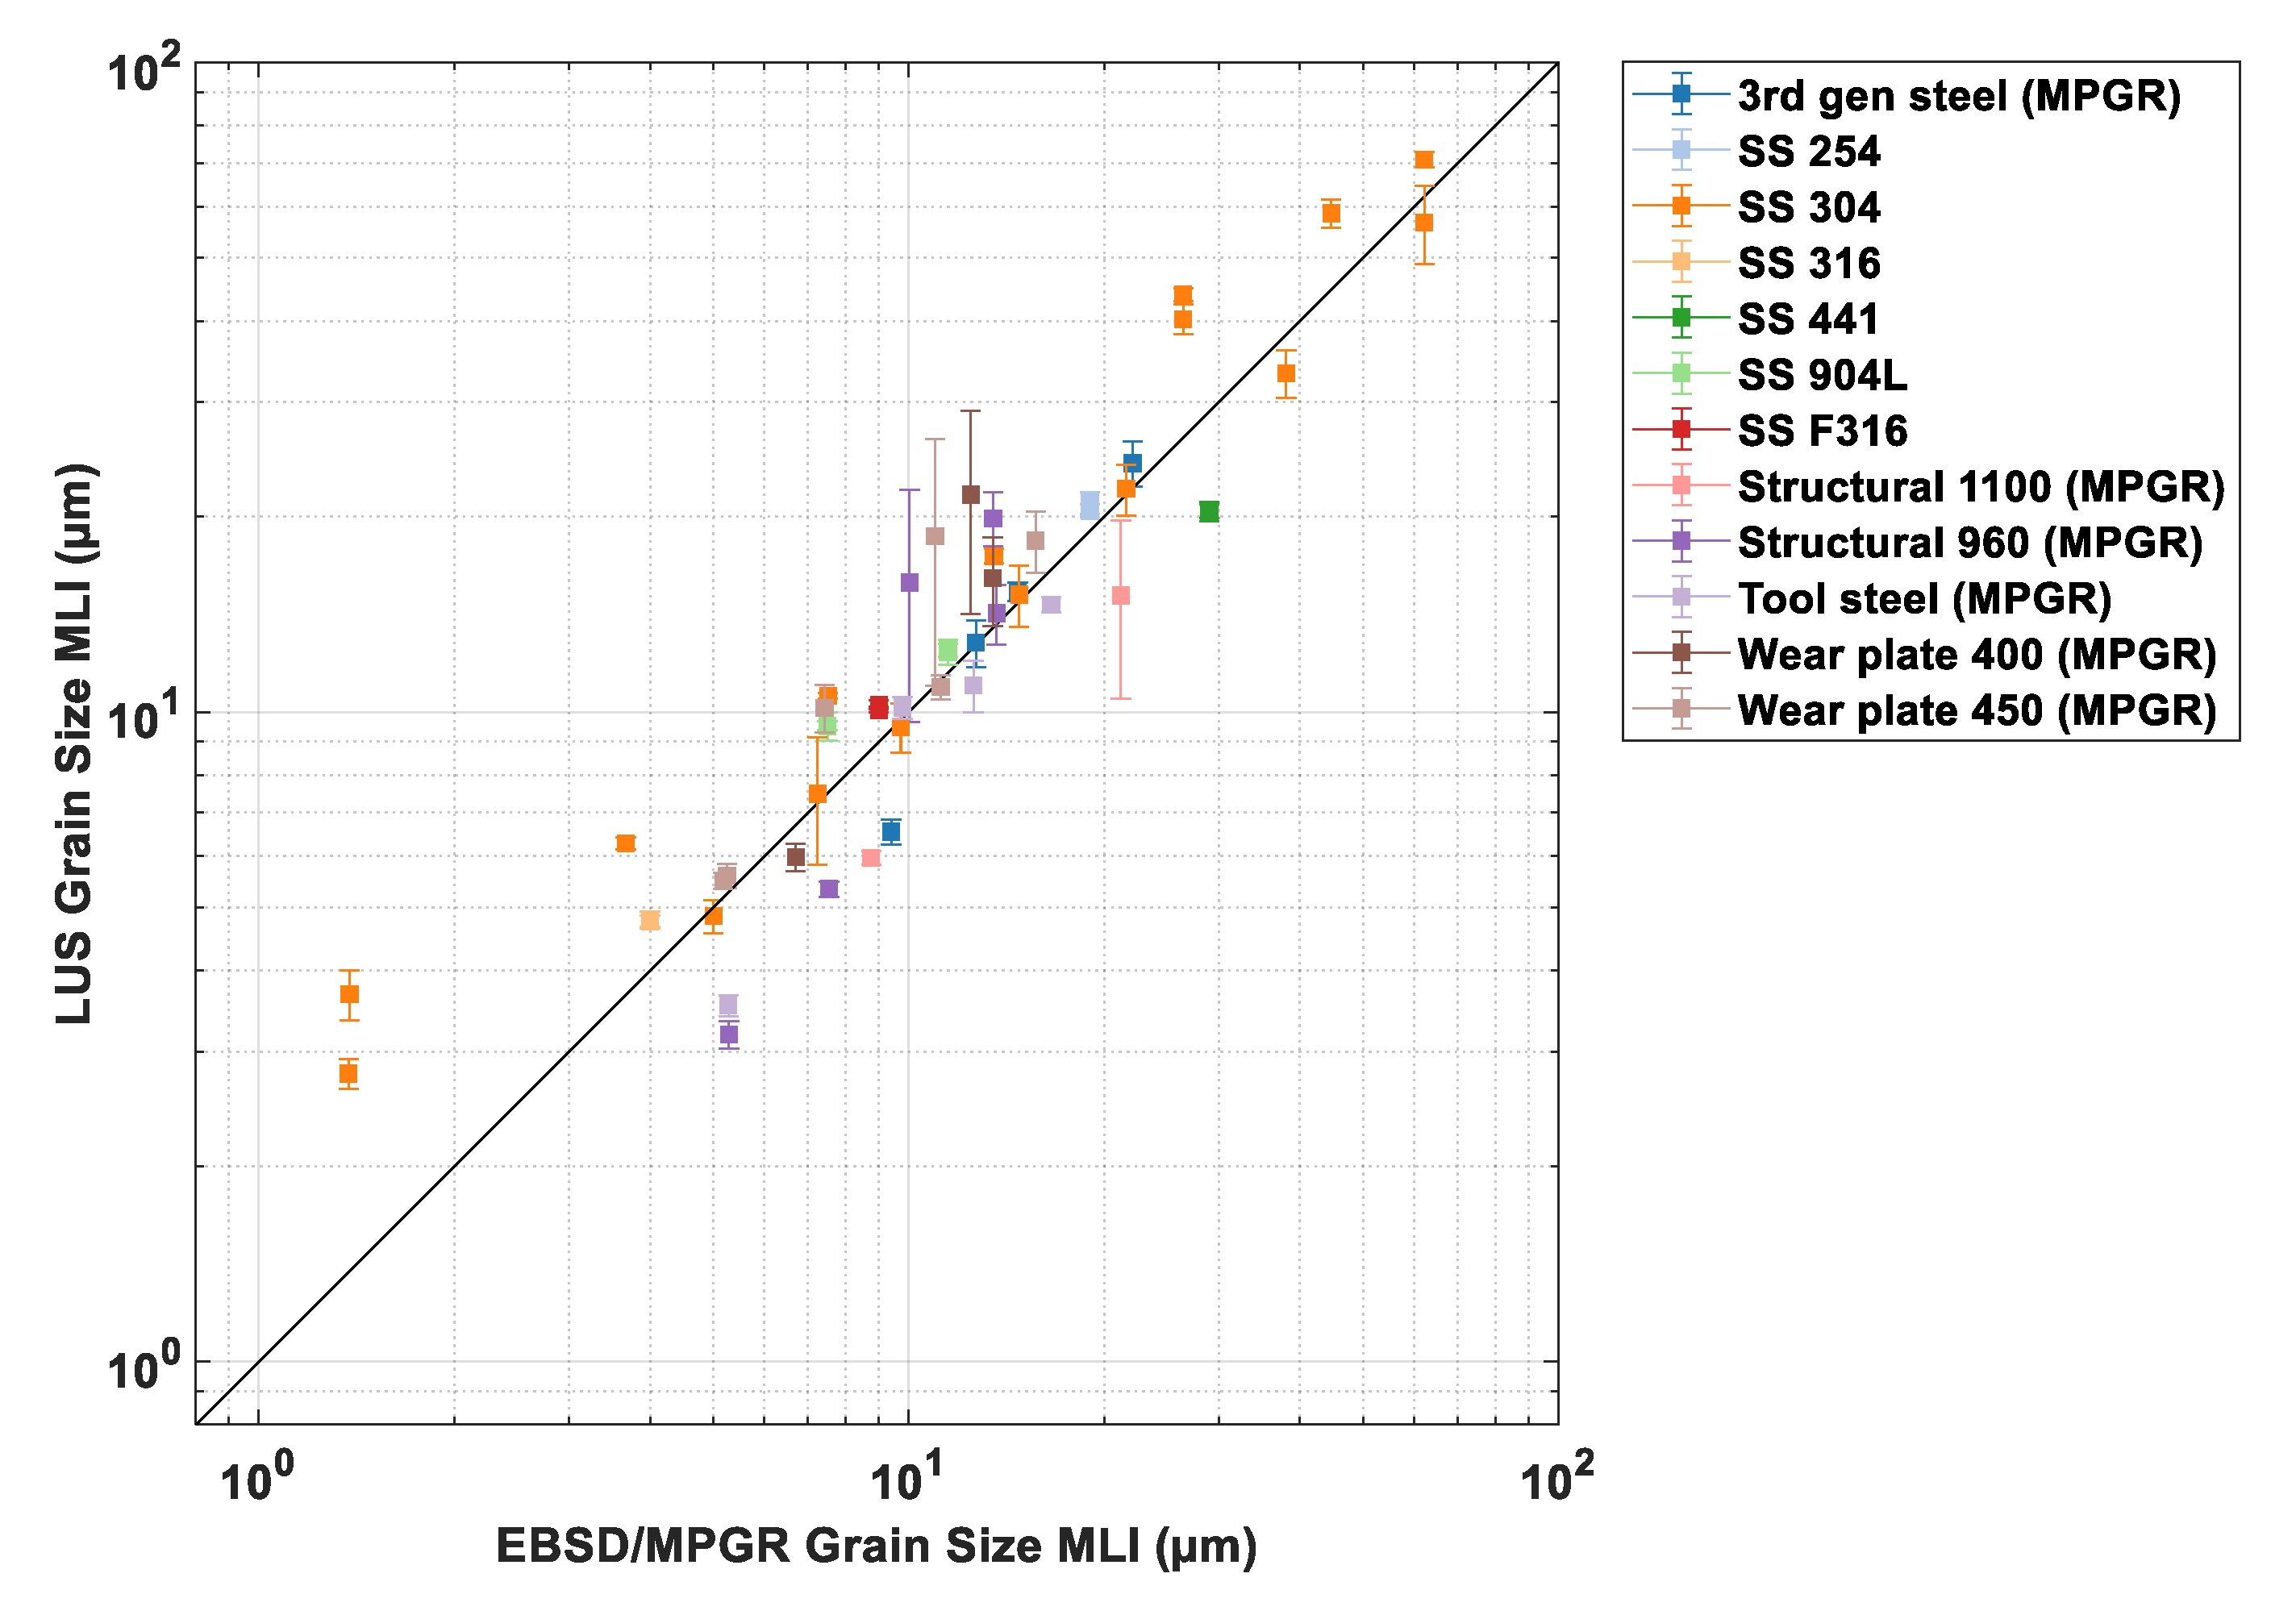
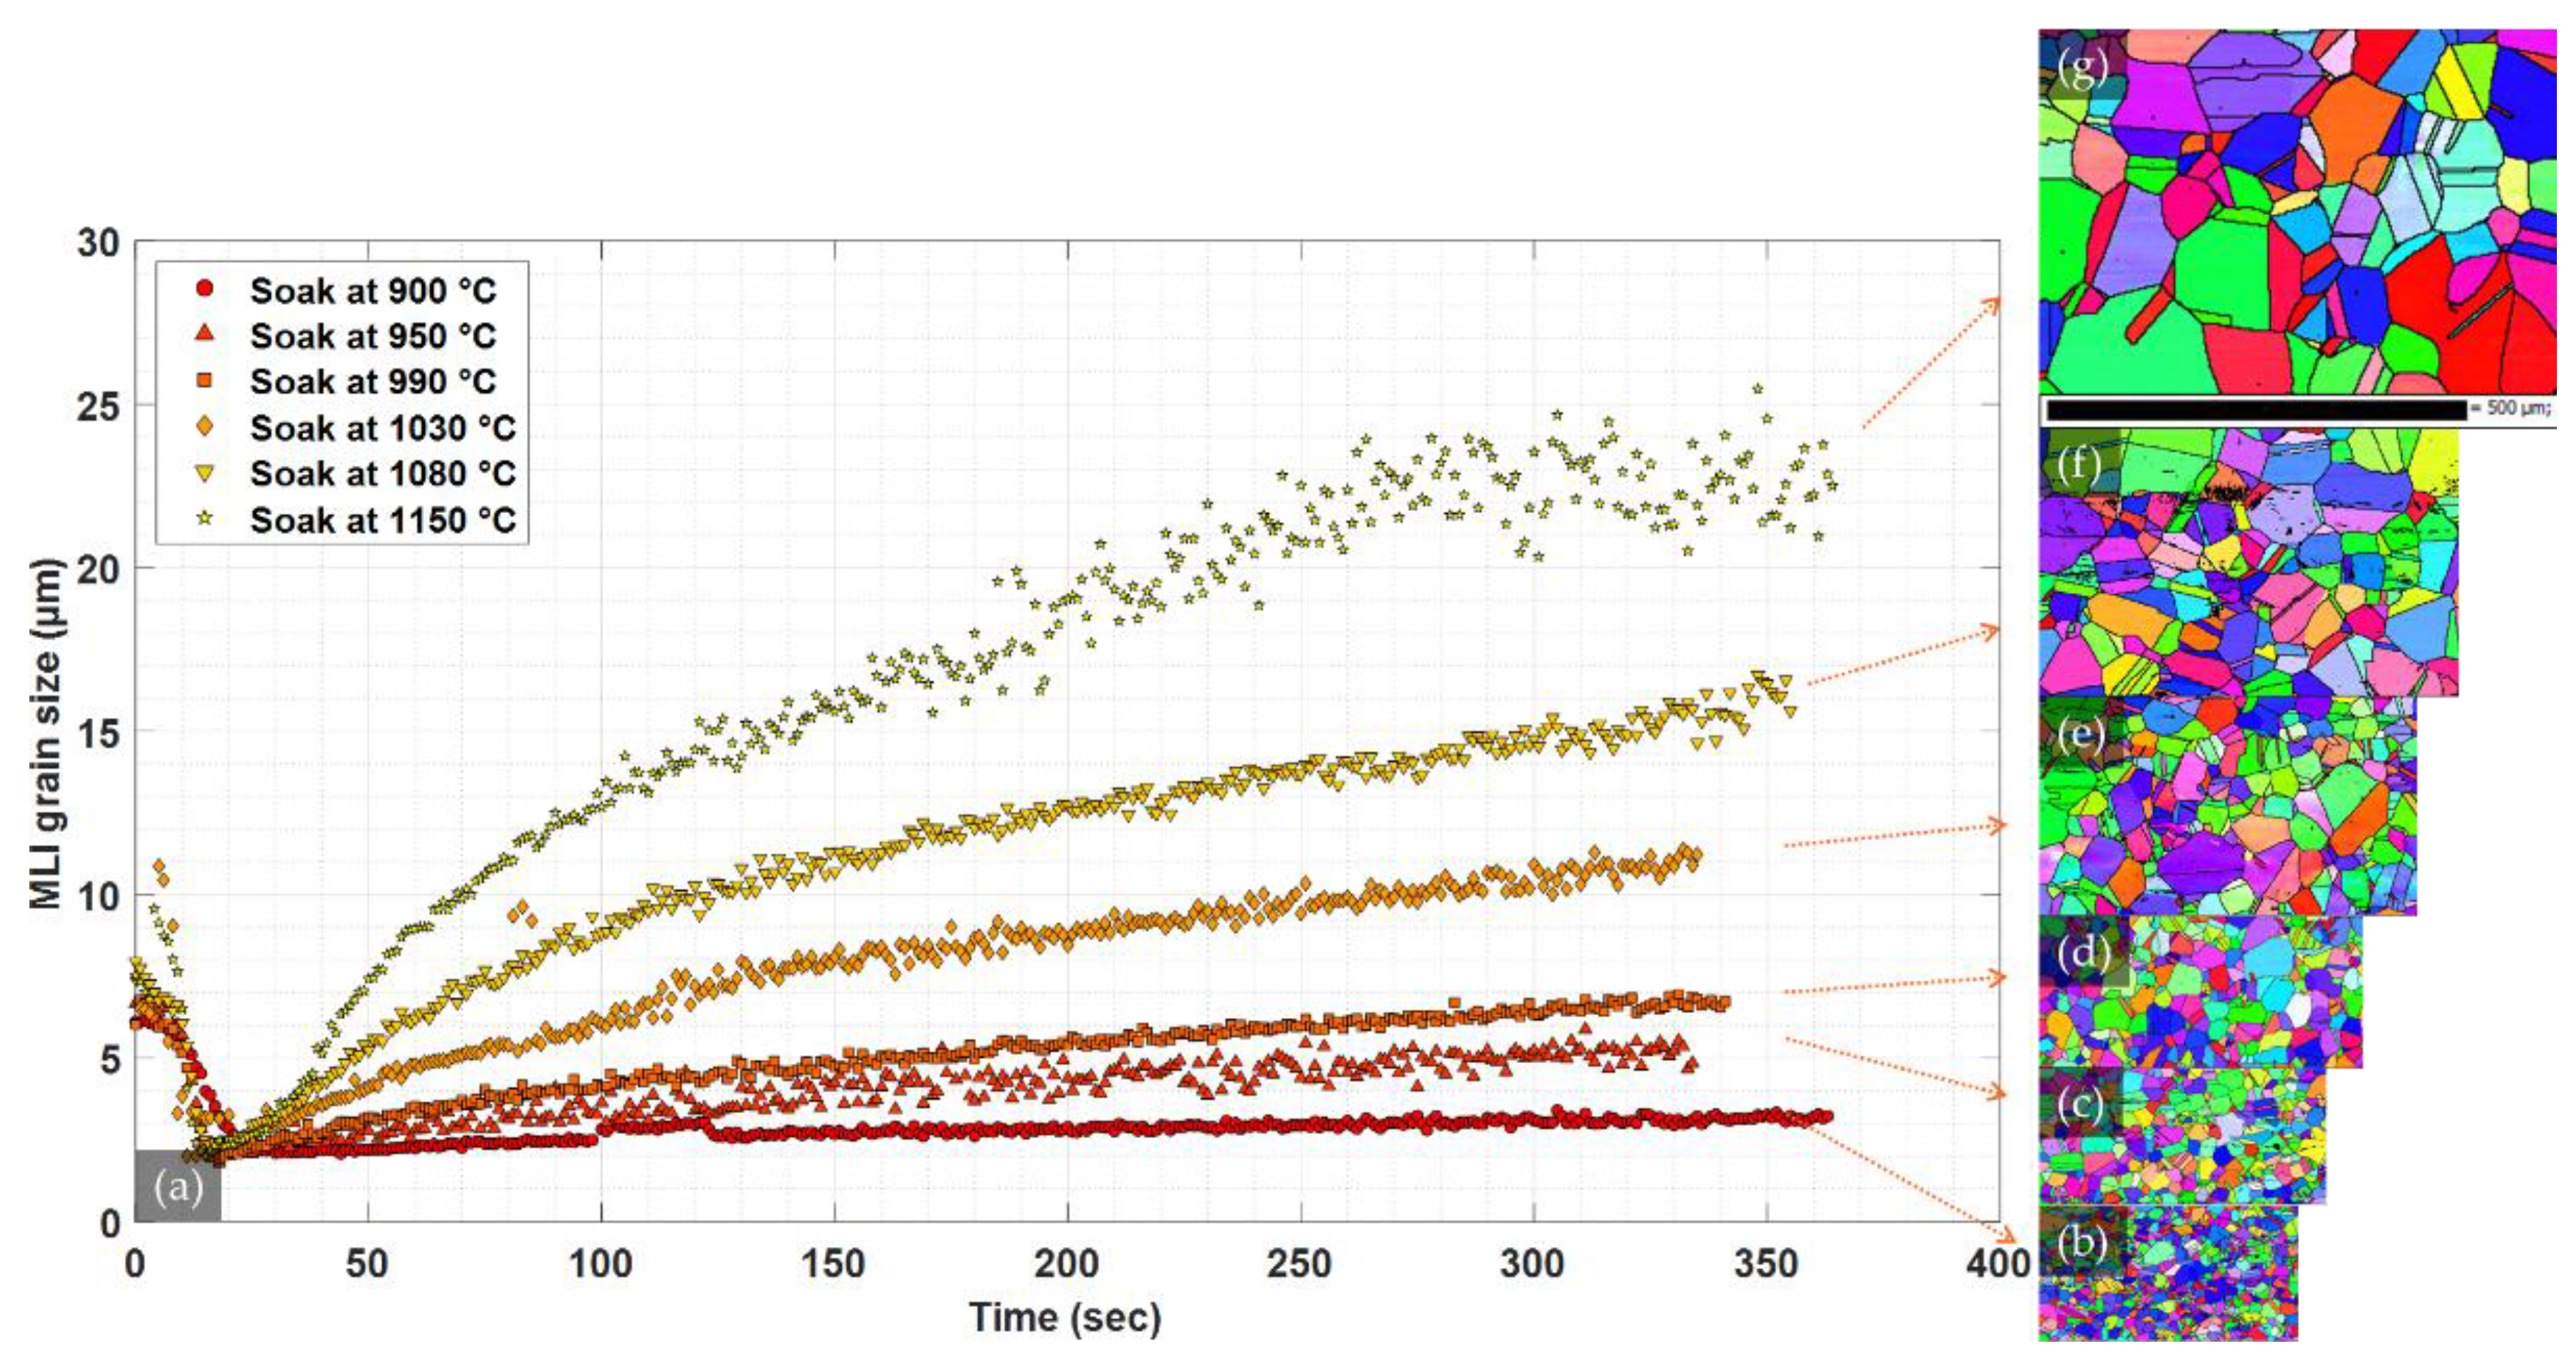
3.1. Grain-Size Calibration Curve

After the thermal treatment and EBSD/MPGR analysis of the samples as described in the methods section, the ultrasonic response of the relevant part of the GLUS measurements were extracted, i.e., the part of the annealing cycle wherein the samples had attained a stable-enough grain size. The attenuation from this relevant part of all of the GLUS measurements was then fed into a weighted least square analysis to solve for a function Γ ( T ) that translates the measured attenuation to a grain size. Each calculated attenuation in the LUS measurement was weighted by the signal-to-noise ratio of the echoes used for the attenuation calculation, the width of the frequency span, and the R2 of the 3rd-order polynomial fit of b i.e., the least square of Equation (3).
A few different transfer functions i.e., versions of Equation (5), were tested, and the simplest and best solution to the data at hand was the following equation, which describes the average grain size D ¯ as a function of spectral attenuation b and temperature T :
D ¯ ( T , b ) = b c 1 + c 2 Z A ( T ) .
The function Z A ( T ) is the Zener A-parameter, which is a temperature-dependent variable describing the amount of crystal anisotropy:
Z A ( T ) = 2 C 44 C 11 C 12 ,
where C i j refers to elastic constants in Voigt notation that vary with temperature and is usually enhanced at elevated temperatures [28]. The material anisotropy effect on attenuation is well known [19] and has been suggested for laser ultrasonics earlier by, e.g., [23,29]. The need for an offset parameter c 1 is attributed to the many assumptions and simplifications made and partly to the measurement system, i.e., the total frequency response of the optical and digital components and the postprocessing of the data. However, the constant c 1 is relatively small in comparison to c 2 Z A . Below, in Figure 5, the average grain size calculated with the measured frequency-dependent attenuation together with Equation (6) is compared to the measured grain size by the EBSD and MPGR techniques.
For an ideal model, the plotted points in the above figure would be positioned exactly on the diagonal 1:1 line. The graph is based on 52 different LUS measurements containing a total of ~23,000 A-scans. For each A-scan, the spectral attenuation was calculated for each of the available P-echoes that could be automatically located. These b values were then averaged to one single value and served as input for the weighted least square fit. When the final grain-size calibration curve is compared to the microscopic grain size, c.f., Figure 5, the residual, R2, is just over 0.8. Some of the points have significantly larger error bars, which is mainly attributed to the GLUS measurements that, for those samples, were performed in transmission and which can result in significant oxide growth during the measurement. This oxide scale can have the disadvantage of the reflected intensity of the detection laser being lower. Furthermore, it is also believed to lead to the laser being screened from the actual sample surface that deteriorates the frequency content in the measurement. One should also note that the statistical grain-size distribution will also affect the perceived attenuation as predicted in [19], which is not taken into consideration herein; hence, some small variation in the vertical axis is expected due to this.
An example of the GLUS-measured grain size as a function of time during the annealing of 304 stainless steel at various soaking temperatures is shown in Figure 6a below. Each point in the graph is a calculated grain-size value for the available echoes in one A-scan. The starting material was cold-rolled with a pancaked structure and was heated at 10 °C/s up to the soaking temperature. The timing of the measurements is shifted to be aligned to the point of recrystallization, which occurs as the temperature reaches ~890 °C. The samples displayed in Figure 6 were then cooled and cut in the center of the ultrasonic path and EBSD-analyzed.
Preliminary results indicate that this grain-size calibration curve could also be directly employed on polygonal ferrite by using the single-crystal elastic constants [30] in the Zener anisotropy factor calculation as foreseen in [19]. The method has only been tested on a limited number of ferrite samples and needs a more thorough investigation before the valid range of this grain-size calibration curve is established for ferrite.

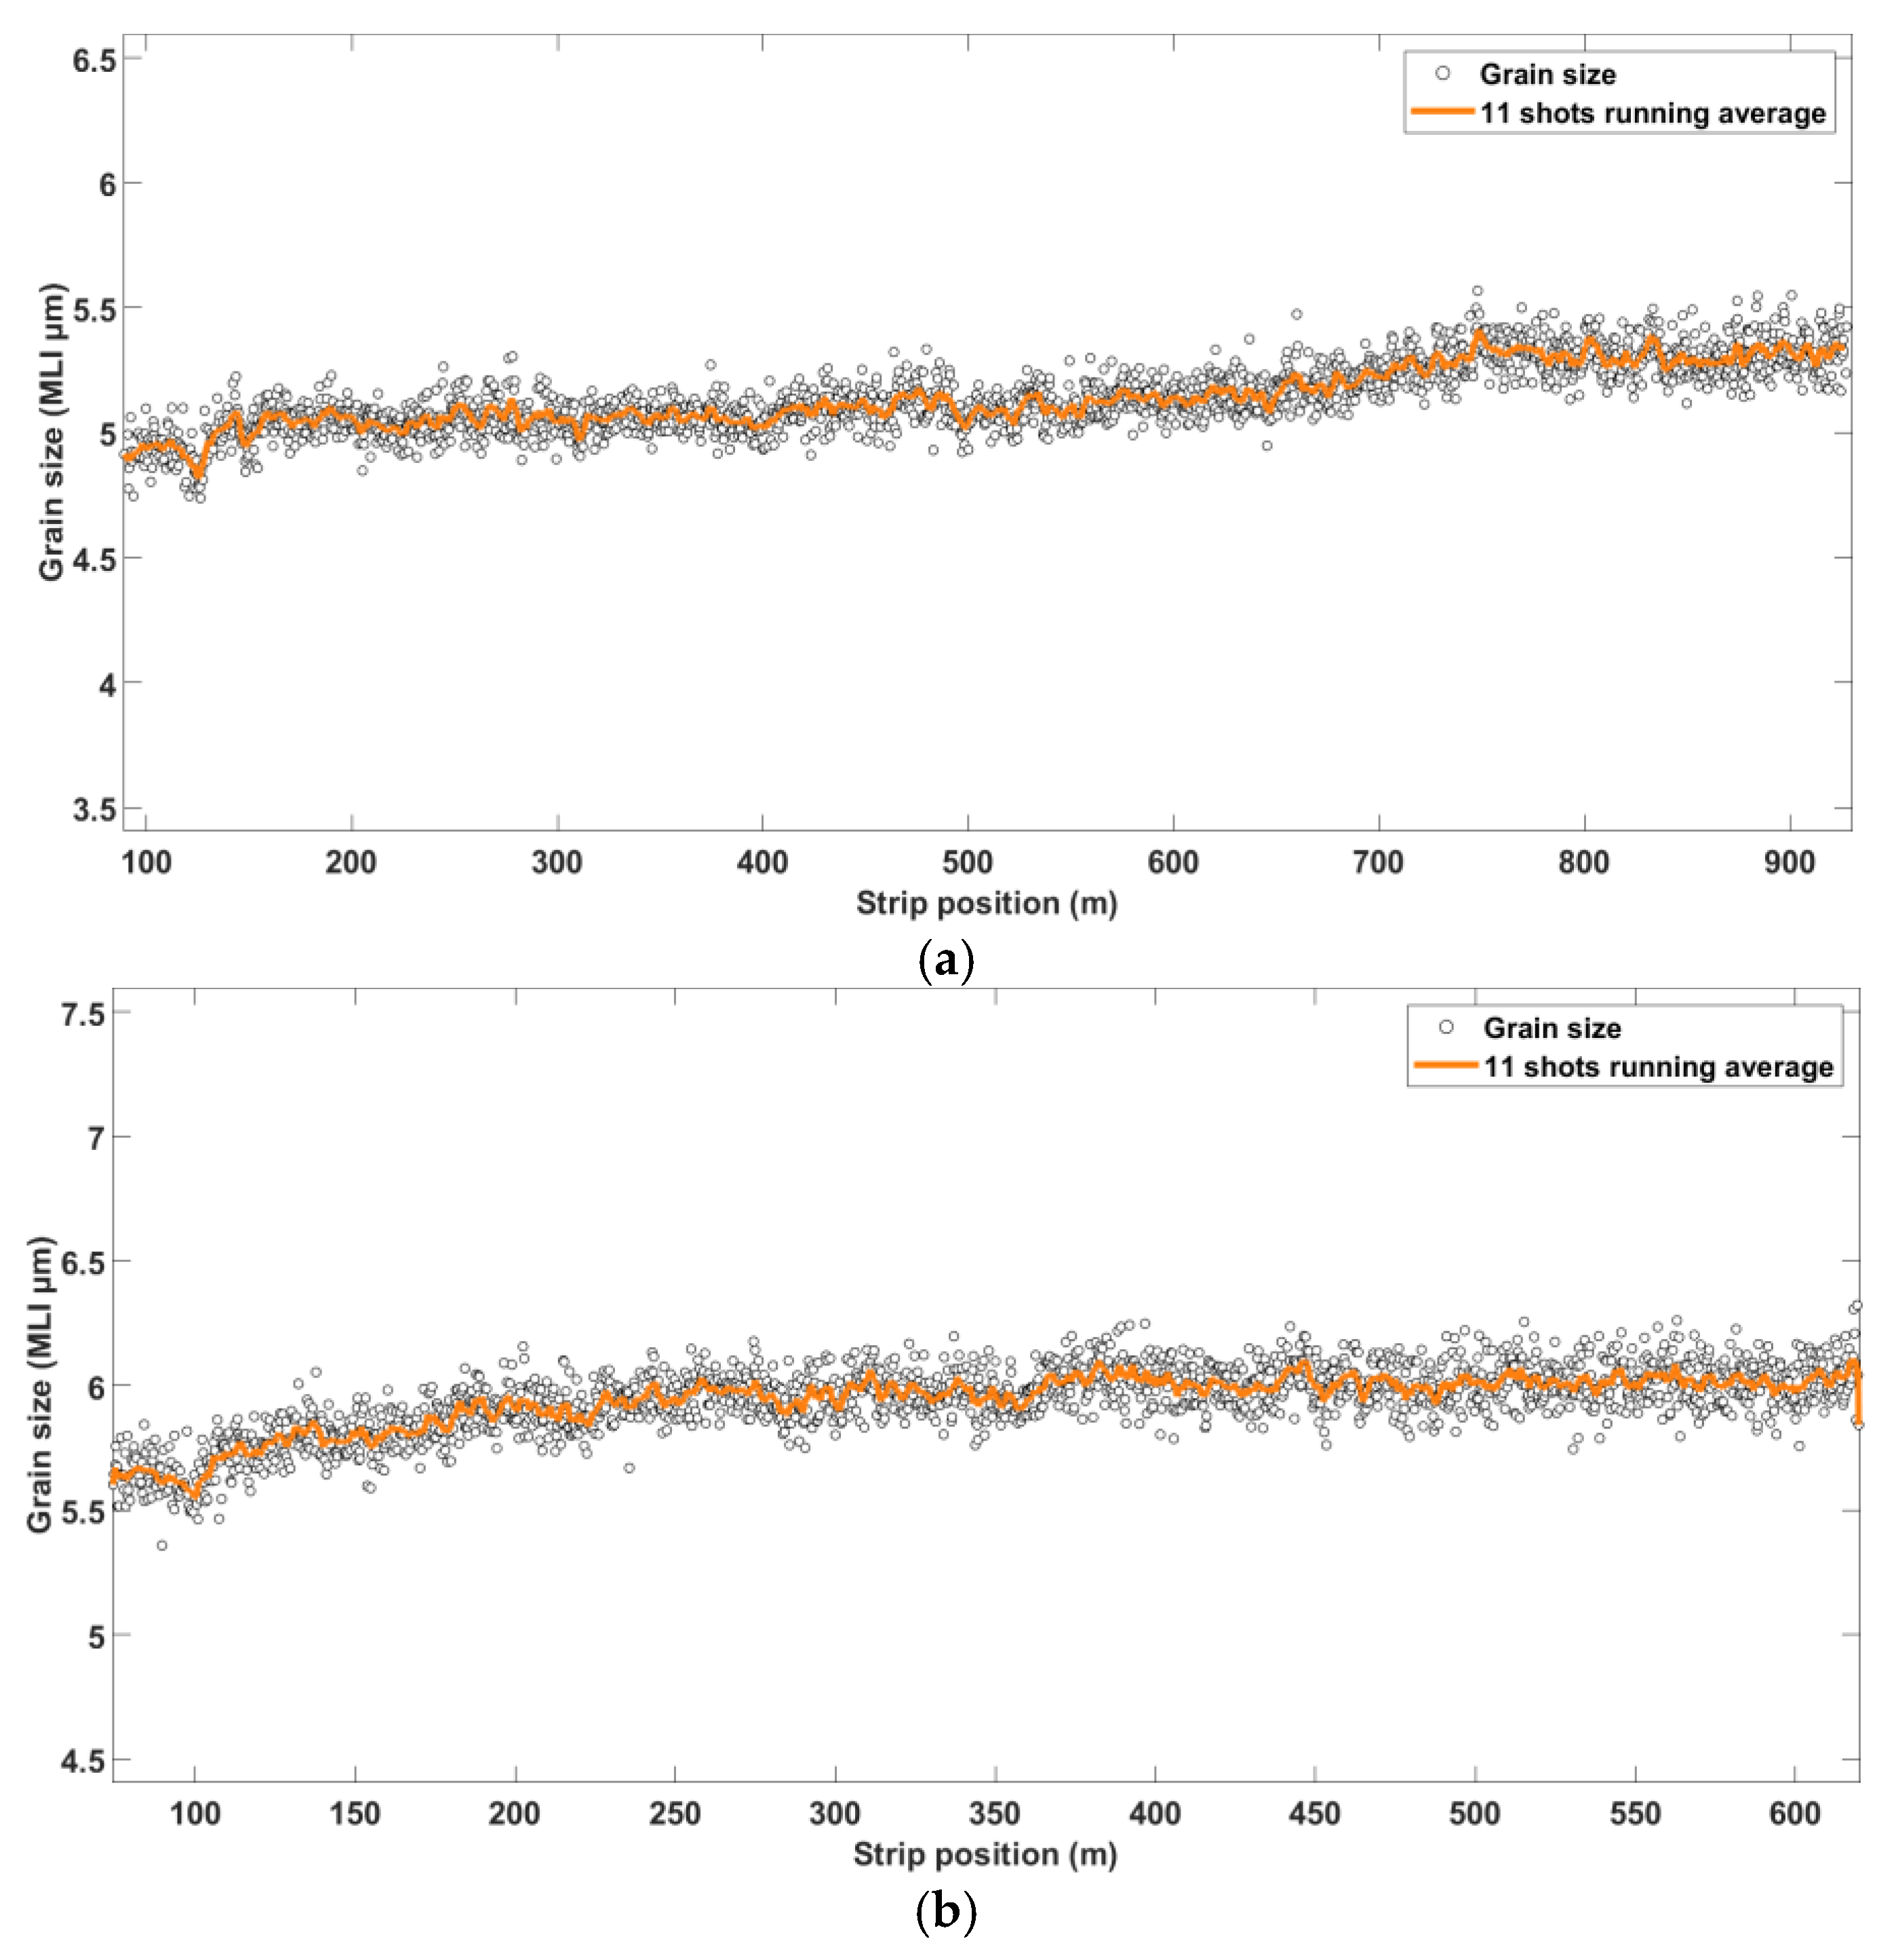
3.2. Online Measurements

The grain size gauge consists of one measurement head and four smaller cabinets containing:
  • the climate control for the head and driver for the generation laser,
  • the interferometer and the control computers,
  • the detection laser, and
  • the electronic wiring and control unit for the motors.
The control computer communicates with the mill and moves the head into measurement position and turns on the lasers when a strip is present. The control computer collects the ultrasonic response and the necessary mill data and stores it in a database that is then accessed by the analyzing computer. This second computer extracts the relevant information from the A-scan and calculates the grain size, which is then written back to the database and/or is sent to the mill control system. The algorithm finds the longitudinal echoes and decides which part of the spectrum should be utilized in the attenuation calculation.
Below, in Figure 7, some bandpass-filtered A-scans from the grain size gauge are displayed. The ultrasonic generation occurs at time ~0.7 µs, and at ~2 µs, the first back wall echo is present. The consecutive echoes have a separation of ~1.2 µs, and their amplitude is clearly attenuated, which is expected from both the grain scattering and geometric effects, as well as the shedding of energy into other waves, such as shear waves. In between the main longitudinal echoes, much smaller negative peaks are visible, which are the mode-converted PS-waves.
The signal-to-noise ratio of this system is above 400, but it is expected to deteriorate slightly with time together with the output of the lasers. The grain size gauge has some overcapacity in terms of the generation laser, which is currently operated at around 50% of the maximum output power. Therefore, up to 50% degradation of the generation laser system can be fully compensated by the control computer by allowing more laser light through the internal attenuator. The calculated mean linear intercept grain size including twin boundaries from two online LUS measurements are displayed below in Figure 8. The strips had a length of 1000 m and 650 m and had average grain sizes of just over 5 and around 6 µm in (a) and (b), respectively. The head and tail end of the strip are not measured to provide extra-large safety margins, and, hence, the first and last part of the strip are not displayed. In principle, the lasers could start as soon as the system detects hot material above the gauge by using the detection laser as a material detector [31], which could potentially allow the LUS grain size gauge to make the first measurement just a few millimeters into the strip head end.
Both measurements display a slightly increasing grain size along the length of the strip, which could be the result of a variation in rolling speed. Changing the zoom during rolling implies that the grain-size measurement will be performed at a different time from the last stand comparing the head and the tail end of the strip. Since the material usually experiences a time dependent recrystallization the head and tail end of the strip will be at slightly different stages of the recrystallization kinetics if the rolling speed varies.
The observant reader will notice a small periodicity with ~9 periods along the length of the strips, which are the consequence of an earlier processing step in the hot strip mill. This is likely an effect of skid marks. As mentioned earlier, when the slab is heated in the re-heating furnace, it travels through the furnace from one side to the other on walking beams. These beams are actively cooled to survive the high temperature in the furnace, and one outcome of this is that the slabs are heated unevenly, giving rise to temperature deviations called skid marks. The use of the coil-box prior to the finishing mill neutralizes this temperature difference to the extent that the effect is barely noticeable for most materials. It is not seen in temperature measurements on the final strip but is detected by the LUS measurement.
These new online grain-size measurements can enable a new paradigm for material development. The new data can be used as feedback information to the mill directly or for adjustments of the setup calculation to the next strip of the same grade. The data are also expected to be valuable as input when creating new material models and to result in more rapid development of new alloying concepts. Additionally, this new grain size gauge has the potential to improve quality control by identifying deviations in the production, to indicate if there are parts of the strip that should be directly internally recycled. This new information is also expected to be utilized as feedforward information in the later material processing steps.
The grain size gauge currently assumes that the laser ultrasonic measurements are performed on a defect-free strips. The current hot strip mill produces material with high quality and high uniformity. Just before the laser ultrasonic measurement, the strip is de-scaled, removing the oxide scale which enables the grain size gauge to measure reliably. In less favorable conditions, however, defects in the strip such as inclusions and delaminations could deteriorate the measured response. Oxide scales that are not removed by the de-scaler could also have a negative effect on the measured frequency response. The effects of this oxide screening, inclusions or delaminations have not yet been observed in the measurements.
However, the presence of any of the errors described above would only result in one faulty measurement since the steel strip is continuously moving in front of the LUS gauge. Furthermore, the model and algorithm only evaluate the grain size if the signal response has a high enough signal-to-noise ratio, which allows it to cope with the worst errors introduced by the unlikely defects.

4. Conclusions

A new online grain size gauge based on laser ultrasonics has been installed in a hot strip mill and presented. It is a unique solution for austenite grain-size measurement during hot rolling with:
  • Grain-size calculation performed with a new reference object-free model/algorithm utilizing the generation event as a reference spectrum.
  • The model used for grain-size calculation is based on 52 samples that are evaluated with EBSD/MPGR and is correlated with more than 23,000 LUS measurements. The correlation coefficient R2 of this model is 0.8.
  • Calculated grain sizes from online LUS measurements provide the ability to detect small variations in austenite grain size along the strip in situ.
This gauge creates new possibilities for the process control in the mill by enabling new information for feedback and feedforward control by optimizing the grain size. The gauge is also expected to accelerate the material development of new alloying concepts by rapid prototyping facilitated by the new grain-size data.

Author Contributions

Conceptualization, M.M., B.H., L.B. and H.S.; Data curation, M.M., A.J., J.L. and S.H.; Formal analysis, M.M.; Funding acquisition, M.M. and H.S.; Investigation, M.M., A.J., J.L. and S.H.; Methodology, M.M., A.J., B.H. and L.B.; Project administration, M.M., A.J., L.G., L.B., H.S. and M.B.; Resources, L.B., H.S. and M.B.; Software, M.M. and S.H.; Supervision, M.M., L.G., H.S. and P.L.; Validation, M.M. and L.B.; Visualization, M.M.; Writing—original draft, M.M.; Writing—review & editing, M.M., A.J., B.H., L.B. and M.B. All authors have read and agreed to the published version of the manuscript.

Funding

This work was partially financed by the strategic innovation program Metallic Materials, by Vinnova, the Swedish Energy Agency, and Formas grant no. 2018-03916 and 2015-03474, as well as the European Union’s Research Fund for Coal and Steel (RFCS) research program under grant agreement no. RFCS-2018-847296.

Institutional Review Board Statement

Not applicable.

Informed Consent Statement

Not applicable.

Data Availability Statement

Not applicable.

Conflicts of Interest

The authors declare no conflict of interest.

References

  1. Scruby, C.B.; Drain, L.E. Laser Ultrasonics Techniques and Applications; CRC Press: Boca Raton, FL, USA, 1990; ISBN 978-0-7503-0050-6. [Google Scholar]
  2. Lévesque, D.; Kruger, S.E.; Lamouche, G.; Kolarik, R.; Jeskey, G.; Choquet, M.; Monchalin, J.-P. Thickness and Grain Size Monitoring in Seamless Tube-Making Process Using Laser Ultrasonics. NDT E Int. 2006, 39, 622–626. [Google Scholar] [CrossRef] [Green Version]
  3. European Union. On Line Structure Monitoring by Laser Ultrasonics for Process Control in Rolling and Heat Treatment (CUSTOM); Dorota Artymowicz; Stefan Sundin; Bevis Hutchinson; Andy Astill; Michel Nogues; Grant agreement ID: BRPR960359; European Union: Brussels, Belgium, 2000. [Google Scholar]
  4. European Union. New Approaches to Non-Destructive Characterisation of Microstructure and Applications to Online Control of Steel Quality (NANDACS); Office for Official Publications of the European Communities: Luxembourg, 2006; ISBN 92-79-01089-1. [Google Scholar]
  5. European Union. Investigation, Modelling and Control of the Influence of the Process Route on Steel Strip Technological Parameters and Coating Appearance after Hot Dip Galvanising (IMGALVA); Link, N., Langer, M., Torre, V., Meré, J.O., Lindh-Ulmgren, E., Stolzenberg, M., Eds.; EUR Research Fund for Coal and Steel Series; Publication Office of the European Union: Luxembourg, 2009; ISBN 978-92-79-12481-5. [Google Scholar]
  6. Stolzenberg, M.; Schmidt, R.; Casajus, A.; Kebe, T.; Falkenstrom, M.; Martinez-de-Guerenu, A.; Link, N.; Ploegaert, H.; van den Berg, F.; Peyton, A. Online Material Characterisation at Strip Production (OMC); Office for Official Publications of the European Communities: Luxembourg, 2013; ISBN 978-92-79-28961-3. [Google Scholar]
  7. Van den Berg, F.; Lombard, P.; Labbé, S.; Peyton, A.; Martinez-de-Guerenu, A.; Colla, V.; Gutierrez, I.; Mocci, C.; Reboud, C.; Stolzenberg, M.; et al. Product Uniformity Control (PUC): Final Report; Publications Office of the European Union: Luxembourg, 2020; ISBN 978-92-76-17320-5. [Google Scholar]
  8. Falkenström, M.; Engman, M.; Lindh-Ulmgren, E.; Hutchinson, B. Laser Ultrasonics for Process Control in the Metal Industry. Nondestruct. Test. Eval. 2011, 26, 237–252. [Google Scholar] [CrossRef]
  9. Legrand, N.; Satyanarayan, L.; Sarkar, S.; Engmann, M.; Falkenstrom, M.; Lundin, P.; Lindh-Ulmgren, E.; Babu, B.; Johnsson, A.; Lefaudeux, N.; et al. Combined Online Microstructure Sensor and Model for a Better Control of Hot Strip Rolling Conditions and Final Products Properties (MICROCONTROL): Final Report; Publications Office of the European Union: Luxembourg, 2015; ISBN 978-92-79-50412-9. [Google Scholar]
  10. Malmström, M.; Lindh-Ulmgren, E.; Hutchinson, B.; Martin, D.; Sollander, H.; Moosavi, E. In-Situ Övervakning Av Mikrostrukturer För Effektiv Utveckling Och Tillverkning Av Högpresterande Stål (REMOMIC PLUS); Jernkontorets Forskning: Stockholm, Sweden, 2018; ISSN 0280-249X. [Google Scholar]
  11. Satyanarayan, L.; Legrand, N.; Meilland, P.; Naumann, N.; Ayeb, A.; Lindh-Ulmgren, E.; Malmström, M.; Schwartz, T.I.; Babu, B.; Levesque, D. Combined Online Microstructure Sensor and Model for a Better Control of Hot Rolling Conditions and Final Products Properties (Phase 2) (MicroControl-PLUS); Publications Officeof the European Union: Luxembourg, 2019. [Google Scholar]
  12. Malmström, M. A Method and Arrangement for Estimating a Material Property of an Object by Means of a Laser Ultrasonic (LUS) Measurement Equipment. U.S. Patent 20220205954A1, 30 June 2020. [Google Scholar]
  13. Scruby, C.B.; Smith, R.L.; Moss, B.C. Microstructural Monitoring by Laser-Ultrasonic Attenuation and Forward Scattering. NDT Int. 1986, 19, 307–313. [Google Scholar] [CrossRef]
  14. Faßbender, S.; Kulakov, M.; Hoffmann, B.; Paul, M.; Peukert, H.; Arnold, W. Non-Contact and Nondestructive Evaluation of Grain-Size in Thin Metal Sheets. In Nondestructive Characterization of Materials; Höller, P., Hauk, V., Dobmann, G., Ruud, C.O., Green, R.E., Eds.; Springer: Berlin/Heidelberg, Germany, 1989; pp. 337–344. [Google Scholar]
  15. Dubois, M.; Militzer, M.; Moreau, A.; Bussière, J.F. A New Technique for the Quantitative Real-Time Monitoring of Austenite Grain Growth in Steel. Scr. Mater. 2000, 42, 867–874. [Google Scholar] [CrossRef]
  16. Kruger, S.; Lamouche, G.; Levesque, D.; Monchalin, J.-P. Method and System for Determining Material Properties Using Ultrasonic Attenuation. U.S. Patent 7353709B2, 8 April 2008. [Google Scholar]
  17. Kruger, S.E.; Moreau, A.; Lévesque, D.; Lord, M. Laser Ultrasonic Measurements of Scattered Waves in Steel. AIP Conf. Proc. 2001, 557, 1298–1305. [Google Scholar] [CrossRef]
  18. Wang, H.; Bai, X.; Ma, J.; Wu, H.; Zhang, Z. Application of Deep Learning in Nondestructive Evaluation of Metal Microstructural Grain Size. In Proceedings of the 2022 International Conference on Computer Engineering and Artificial Intelligence (ICCEAI), Shijiazhuang, China, 22–24 July 2022; pp. 581–585. [Google Scholar]
  19. Stanke, F.E.; Kino, G.S. A Unified Theory for Elastic Wave Propagation in Polycrystalline Materials. J. Acoust. Soc. Am. 1984, 75, 665–681. [Google Scholar] [CrossRef]
  20. Sarkar, S.; Moreau, A.; Militzer, M.; Poole, W.J. Evolution of Austenite Recrystallization and Grain Growth Using Laser Ultrasonics. Metall. Mater. Trans. A 2008, 39, 897–907. [Google Scholar] [CrossRef]
  21. Militzer, M.; Garcin, T.; Poole, W.J. In Situ Measurements of Grain Growth and Recrystallization by Laser Ultrasonics. Mater. Sci. Forum 2013, 753, 25–30. [Google Scholar] [CrossRef]
  22. Moreau, A.; Lévesque, D.; Sarkar, S. Laser-Ultrasonics for Metallurgy: Overview and Latest Developments; NRC: Ottawa, ON, Canada, 2013. [Google Scholar] [CrossRef]
  23. Garcin, T.; Schmitt, J.H.; Militzer, M. In-Situ Laser Ultrasonic Grain Size Measurement in Superalloy INCONEL 718. J. Alloys Compd. 2016, 670, 329–336. [Google Scholar] [CrossRef]
  24. Keyvani, M.; Garcin, T.; Fabrègue, D.; Militzer, M.; Yamanaka, K.; Chiba, A. Continuous Measurements of Recrystallization and Grain Growth in Cobalt Super Alloys. Metall. Mater. Trans. A 2017, 48, 2363–2374. [Google Scholar] [CrossRef]
  25. Nyyssönen, T.; Malmström, M.; Lindell, D.; Jansson, A.; Lönnqvist, J.; Hutchinson, B. Laser Ultrasonic Measurements as a Complementary Technique for Parent Austenite Reconstruction in Advanced High-Strength Steels. Appl. Sci. 2022; submitted. [Google Scholar]
  26. Klein, M.B. Beam Coupling in Undoped GaAs at 1.06 Μm Using the Photorefractive Effect. Opt. Lett. 1984, 9, 350–352. [Google Scholar] [CrossRef] [PubMed]
  27. Blouin, A.; Monchalin, J. Detection of Ultrasonic Motion of a Scattering Surface by Two-wave Mixing in a Photorefractive GaAs Crystal. Appl. Phys. Lett. 1994, 65, 932–934. [Google Scholar] [CrossRef]
  28. Hutchinson, B.; Malmström, M.; Lönnqvist, J.; Bate, P.; Ehteshami, H.; Korzhavyi, P.A. Elasticity and Wave Velocity in Fcc Iron (Austenite) at Elevated Temperatures—Experimental Verification of Ab-Initio Calculations. Ultrasonics 2018, 87, 44–47. [Google Scholar] [CrossRef] [PubMed]
  29. Garcin, T. Laser Ultrasonic Sensitivity to Abnormal Grain Growth and Twinning during Metal Processing. In Proceedings of the 3rd International Workshop on Laser-Ultrasound for Metals, Stockholm, Sweden, 21–22 September 2017. [Google Scholar]
  30. Dever, D.J. Temperature Dependence of the Elastic Constants in A-iron Single Crystals: Relationship to Spin Order and Diffusion Anomalies. J. Appl. Phys. 1972, 43, 3293–3301. [Google Scholar] [CrossRef]
  31. Malmström, M. Optical Material Detector for Safer Laser Ultrasonic Measurements. In Proceedings of the NDE 2021—Virtual Conference & Exhibition, Virtual, Chennai, India, 9–11 December 2021; p. CP103. [Google Scholar]
Figure 1. Schematic of the principle for laser ultrasonic grain-size measurement. (a) The ultrasound is generated in the sample by a generation laser hitting the surface with a short optical pulse. (b) The ultrasonic response of the sample is acquired with the detection laser collecting several backwall echoes. (c) The frequency-dependent attenuation is calculated for the backwall echoes. (d) The third-order frequency-dependent attenuation b is transferred by a calibration curve plotting known attenuation vs. grain sizes.
Applsci 12 10048 g001
Figure 2. Ten typical bandpass−filtered A−scans from an online measurement in a hot strip mill [10]. The first peak at 0.7 µs is the generation event, and the following peaks are the consecutive backwall echoes.
Applsci 12 10048 g002
Figure 3. (a) Plot of frequency content in the generation event and the consecutive echoes from the A-scans shown in Figure 2. (b) The calculated attenuation as a function of frequency (solid black line) for the 2nd backwall echo of one of the A−scans in (a), The fitted 3rd-order attenuation (dashed line with square markers) is also plotted. The fitting is only performed in the region where the SNR sufficiently large and the frequencies are high enough for the diffraction to be negligible.
Applsci 12 10048 g003
Figure 4. (a) Illustration of the hot strip mill in Borlänge, Sweden. The different components are denoted from the reheating furnaces on the left to the downcoilers on the right. The position of the new LUS grain size gauge is marked by the yellow arrow just before the runout table. (b) Image of the LUS grain size gauge, produced by EMG Automation GmbH.
Applsci 12 10048 g004
Figure 5. Calculated LUS grain size versus the mean linear intercept-length grain size, as measured by EBSD and MPGR, including the twin boundaries. The error bars in the vertical direction represent the standard deviation of all of the LUS shots considered when calculating the average grain size.
Applsci 12 10048 g005
Figure 6. (a) Graph of the measured grain size as a function of time at the soaking temperature for six of the stainless steel samples. (bg), EBSD inverse pole figure (IPF) maps of the samples post annealing at 900–1150 °C, respectively. The micrographs are, for pedagogic reasons, cropped and resized to share the same size scale.
Applsci 12 10048 g006
Figure 7. A few typical bandpass−filtered A−scans from the online LUS-based grain-size gauge installed in the Borlänge hot strip mill.
Applsci 12 10048 g007
Figure 8. Calculated grain size along the length of a 1000 m (a) and 650 m (b) long strip as measured by the online LUS grain size gauge. The head and tail end were not measured due to extra safety margins employed during the first few LUS measurements performed with the new grain size gauge.
Applsci 12 10048 g008
Publisher’s Note: MDPI stays neutral with regard to jurisdictional claims in published maps and institutional affiliations.

