Featured Application
The developed solar air heater can be applied in drying and space heating applications from 50 °C to 90 °C. The solar collector could be modular, so it can be coupled to a variety of processes.
Abstract
Solar air heaters can reduce climate change by replacing conventional fossil fuel-burning technologies in drying and space heating applications. Concentrating solar technologies, such as compound parabolic concentrators, allow air temperatures up to 120 °C; however, it is desirable to improve their heat transfer to reduce the space requirements for their installation. In this work, a parabolic concentrator composed of a flat receiver designed to recover heat from the cover–receiver–reflectors cavity is analyzed, operating it as a U-shape double pass solar heater. With this operation, first, the air flows through the cavity, and then it is incorporated into the duct, where the dominant heat gain occurs due to the capture of solar radiation. Thus, four input–output configurations in the cavity were modeled through dynamic simulations to determine the influence of the inlet and outlet air flow positions on the solar concentrator outlet temperature. Therefore, the incorporation of the first pass has a contribution of between 36% and 45% in useful energy gain, showing that this appropriate and relatively simple strategy can be implemented to improve the thermal performance of solar air collectors, resulting in instantaneous efficiencies higher than 75%. However, the simulation results demonstrate that the position of the inlets and outlets does not significantly impact the efficiency and outlet temperature.
Keywords:
solar energy; CPC; solar heating; solar drying; industrial process; solar air heater; space heating 1. Introduction
Air heating is used for various applications, such as heating and air conditioning of buildings or drying of food and industrial products, among others. Air can be heated with electric heaters or by directly burning fuels such as gas; however, their use implies the emission of greenhouse gases and their consequent contribution to climate change. One way to minimize fossil fuel burning is to use solar collectors to directly heat the air, ranging from flat-plate collectors to solar concentrators.
According to the International Energy Agency, 985 MWth of solar air collectors were installed by the end of 2020, and the global market was around 12 MWth [1]. As of March 2022, 41 solar air collector systems producing solar process heat are registered, with a cumulative capacity of 6 MWth [1]. Thus, the direct application of solar collectors for air heating is low due to the boost that low fossil fuel prices give to using conventional technologies [2], so it is essential to develop reliable and economically efficient solar air heating technologies. Flat-plate solar collectors are recommended for temperatures below 70 °C because of their ease of manufacture and operation. For higher temperatures, it is necessary to use some solar concentrating technology, such as compound parabolic concentrators (CPCs), which allow fluid heating temperatures up to 120 °C, depending on their design, and are easy to operate and maintain.
However, to ensure good efficiency of CPCs, it is necessary to perform an optimal optical design and minimize thermal losses or improve heat transfer. Strategies to reduce convection losses in the receiver of a solar collector include using evacuated tubes or filling the CPC cavity with gases such as Argon and Krypton [3,4], which are denser gases and have lower thermal conductivity than air, or even applying a vacuum throughout the cavity [5]. In contrast, double absorbers have been proposed to reduce conduction losses [6].
In other technologies, such as flat-plate solar air heaters, it has been proposed to increase the heat transfer rate by incorporating multiple passages, including extended surfaces, artificial roughness, and packed mesh [7]. This multi-pass strategy is used in hybrid CPCs (PV/T) to cool the photovoltaic cells on the flat-plate receiver with fins on the back side [8].
In the general design of solar collectors, computational fluid dynamics (CFD) tools can be used to reliably estimate their thermo-hydraulic performance before building them, saving time and resources. Several analyses of solar collectors by computational fluid dynamics (CFD) can be found in the literature, both for liquid and air heating. Table 1 provides an overview of the different solar collector models and assumptions found in the literature review.

Table 1.
Solar collectors CFD and radiation models in the literature review.
Thus, Mekahlia et al. determined the influence of the thickness and number of transparent covers to reduce the heat losses of a flat-plate solar collector [9], and Pawar and Sobhansarbandi modeled an evacuated heat-pipe solar collector with and without integrated phase change materials as a thermal storage medium [10]. In the particular case of solar air collectors, Singla et al. analyzed an evacuated tube collector with ribs of different roughness [11]. At the same time, Ammar et al. performed a three-dimensional CFD model to optimize the design of a solar air collector with an extended surface area by a different number of rectangular fins [12]. In addition, they analyzed the effect of adding a selective surface on the absorber.
Regarding the analysis of CPC collectors, Li et al. analyzed by CFD the thermal behavior of an evacuated tube collector as a receiver of a compound parabolic concentrator, and the simulation was validated with experimental data [13]. Barrón-Díaz et al. performed the numerical simulation of CPCs with tubular receivers, with and without fins, for residential water heating [14]. This study focused on the ray-tracing analysis of radiation and heat transfer by coupled finite element and CFD methods. In addition, Yuan et al. developed two simplified computational fluid dynamics models to determine the temperature and velocity distribution in two almost identical parabolic tube-receiver CPCs [15]. One had a transparent ETFE sheet around the receiver to reduce convective heat losses. The models included the reflector, receiver, cover, and back insulating material and allowed the analysis of both air movement in the cavity and water movement in the absorber tube. Ray tracing was applied to analyze the radiation distribution on the receiver tube at normal incidence, with a correlation of the absorbed solar energy as a function of the angle along the perimeter of the tube. Both models were experimentally validated, and relative errors of less than 3.7% in temperature and 1% in efficiency were obtained.
On the other hand, Antonelli et al. analyzed the air heat transfer inside the cavity of a collector with a tubular receiver and with a flat-plate receiver and developed some correlations to express the Nusselt over the receiver [16]. Subsequently, Francesconi and Antonelli performed the numerical analysis of a panel with several tubular receiver CPCs to determine the influence on the thermal efficiency of the number and position of the CPCs along the panel, the use of a second transparent cover, the spacing between collectors, and the truncation of the reflectors [17]. For their part, Reddy et al. performed three-dimensional modeling of a flat-plate receiver CPC to determine the thermal losses in the cavity as a function of its aspect ratio and tilt, the optical properties of the materials, and the absorber and ambient temperatures [18]. To model the internal radiative heat transfer, they used a discrete ordinary radiation model, and for the external one, they established the thermal boundary conditions and emissivity.
As mentioned above, another strategy to improve the efficiency of solar air heating collectors is to increase the number of passes. Thus, Al-Damook et al. analyzed the effect of double-pass configuration in a solar air heater when operating in concurrent parallel flow, parallel in counterflow, and double U-pass [19]; the latter presented the best thermal performance. Tuncer et al. analyzed, through CFD simulation, two flat-plate solar collectors for air heating with three and four passes and determined which one had the best performance to evaluate it experimentally [20]. In both solar collectors analyzed, air enters through the lower pass and exits through the upper pass, which has the radiant heat gain. They found that the four-pass collector has a heat gain 3 °C higher than that obtained with the three-pass collector and that the maximum deviation between the CFD model and the experimental results was 10%. In addition, Mutabilwa and Nwaigwe performed a CFD analysis of a two-covers, double-pass flat-plate solar collector for air heating, which was validated with experimental results [21]. The air enters through the space between the two covers and returns between the second cover and the absorber plate. The temperatures on the absorber plate obtained with the model had a standard deviation from experimental results between 1.05 K and 4.65 K, while for the cover, it was between 0.1 K and 0.45 K.
Likewise, improved surfaces or novel geometries have been incorporated in multi-passes solar collectors, such as the work of Desisa and Shekata [22]; they analyzed the impact of using smooth, rough, and corrugated surfaces in a double-pass flat-plate air solar collector and obtained average thermal efficiencies of 78%, 62%, and 90%, respectively. On the other hand, Singh determined the performance of double-pass flat-plate air solar collectors with different fin configurations [23]. They varied in size, angle, arrangements (in-line, staggered, and hybrid), and hydraulic diameter. Finally, Kumar et al. proposed a curved air heater with asymmetric double-pass counterflow turbulators, whose design was determined from CFD analysis by comparing various flow configurations and geometric parameters [24].
Two or more pass technologies have been applied in flat-plate solar collectors to improve their efficiency; however, this strategy has not been applied in CPCs for air heating. This study proposes the CFD analysis of a CPC-type solar air heater with U-shape double-pass airflow. The air first circulates through the trapezoidal cavity contained in the volume formed by the cover, the reflecting walls of the CPC, and the flat-plate receiver and then circulates in counterflow through the receiver’s duct interior. The objective of the numerical analysis presented is to test different inlet and outlet configurations in the CPC array to determine how these configurations influence the velocity distribution, outlet temperature, and instantaneous efficiency of the U-shape double-pass CPC solar heater.
Section 2 of this manuscript describes the main characteristics of the U-shape double-pass CPC and the four air inlet/outlet configurations considered in its design. It also defines the mesh design to perform the CFD simulation, the mathematical model for such simulation, the boundary conditions applied in the study, and the methodology followed to estimate the thermal efficiency of the U-shape double-pass CPC. Section 3 includes a summary of the simulation results obtained and their discussion and concludes with a summary of the efficiencies calculated for each of the four configurations analyzed.
2. Materials and Methods
2.1. U-Shape Double-Pass CPC Description and Physical Model
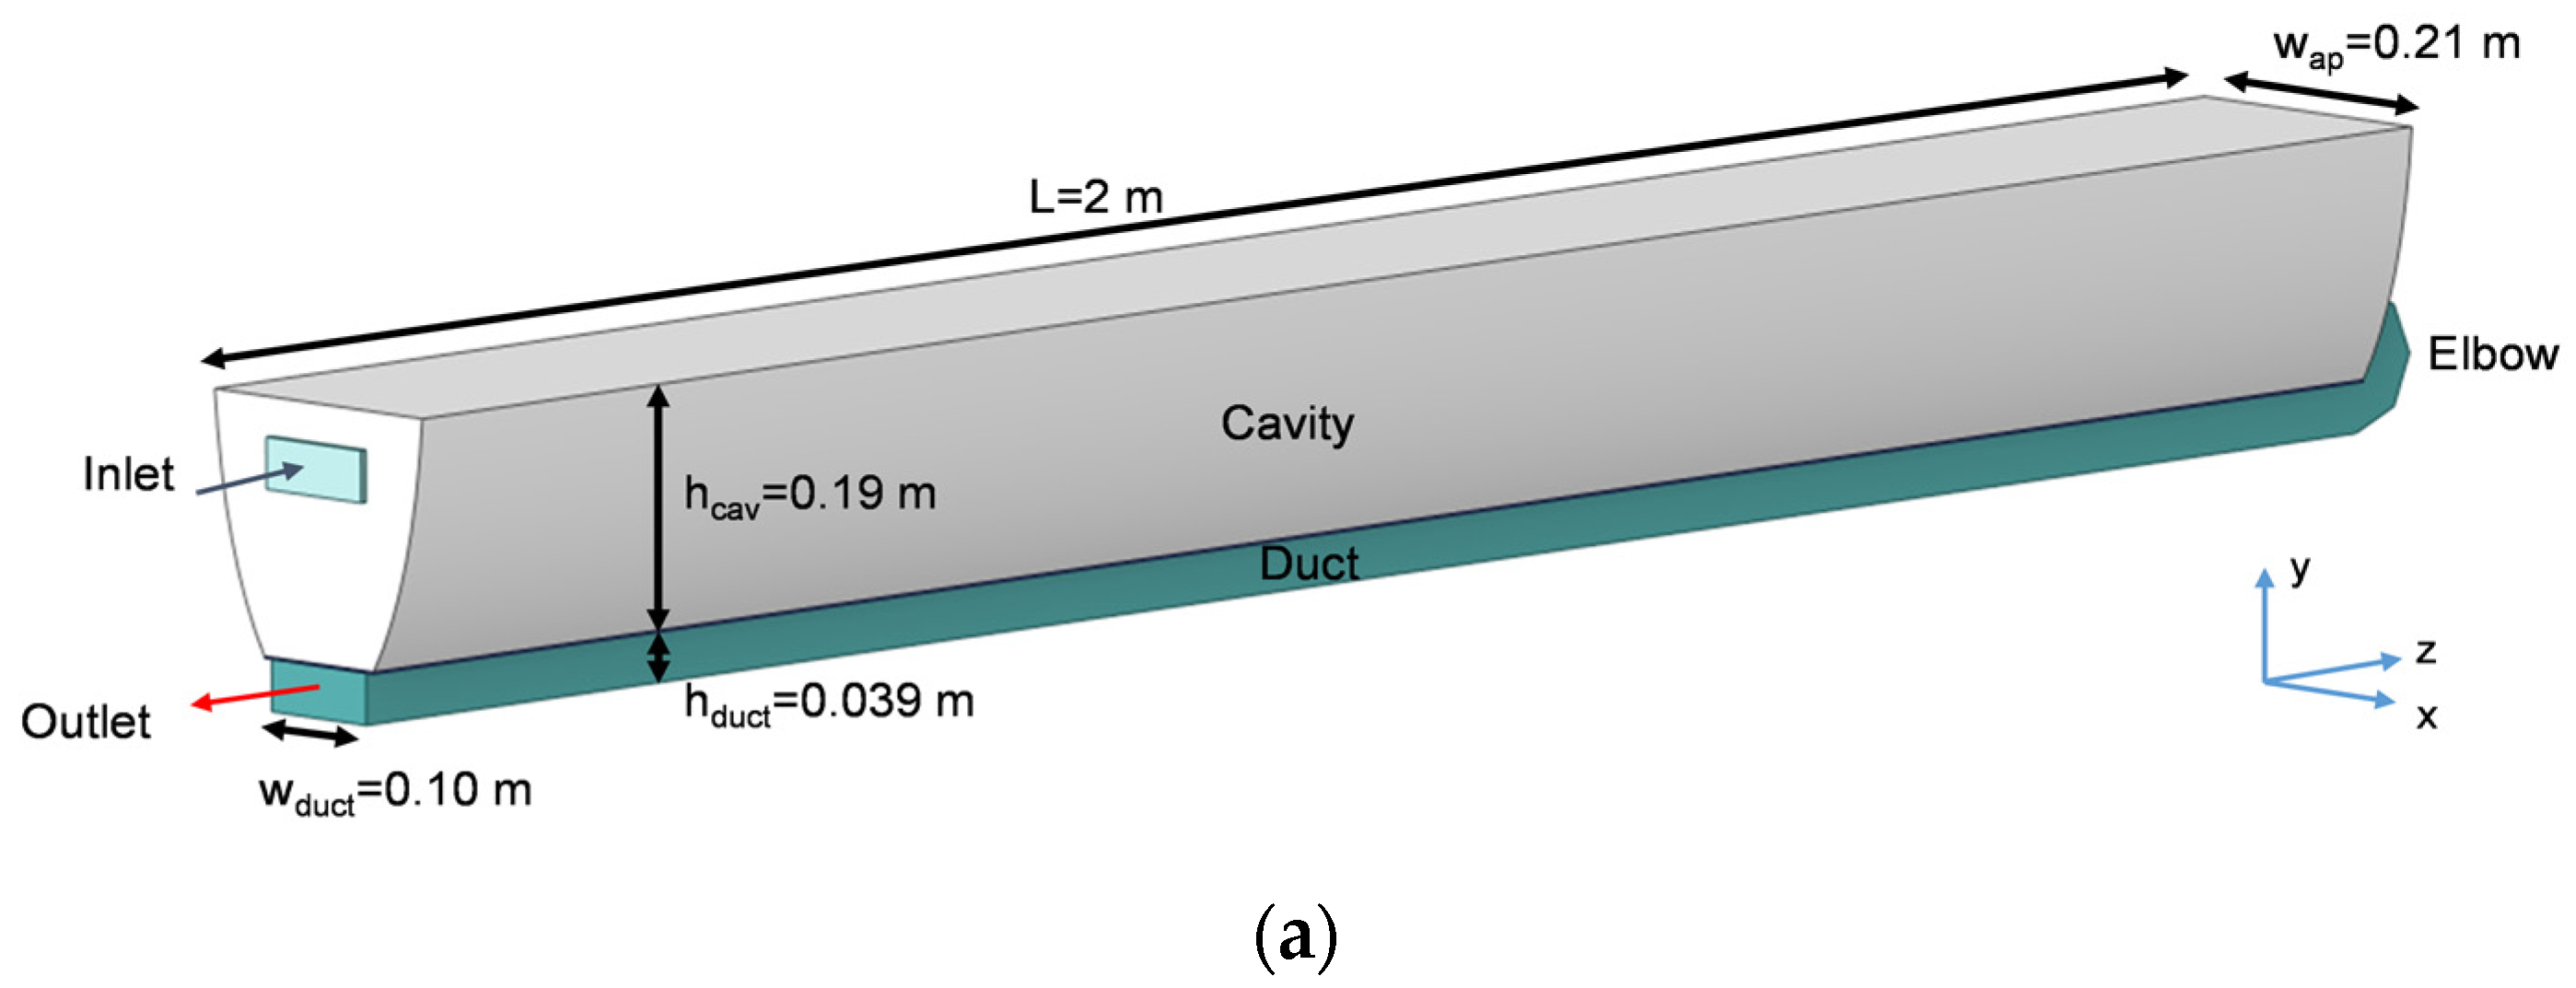
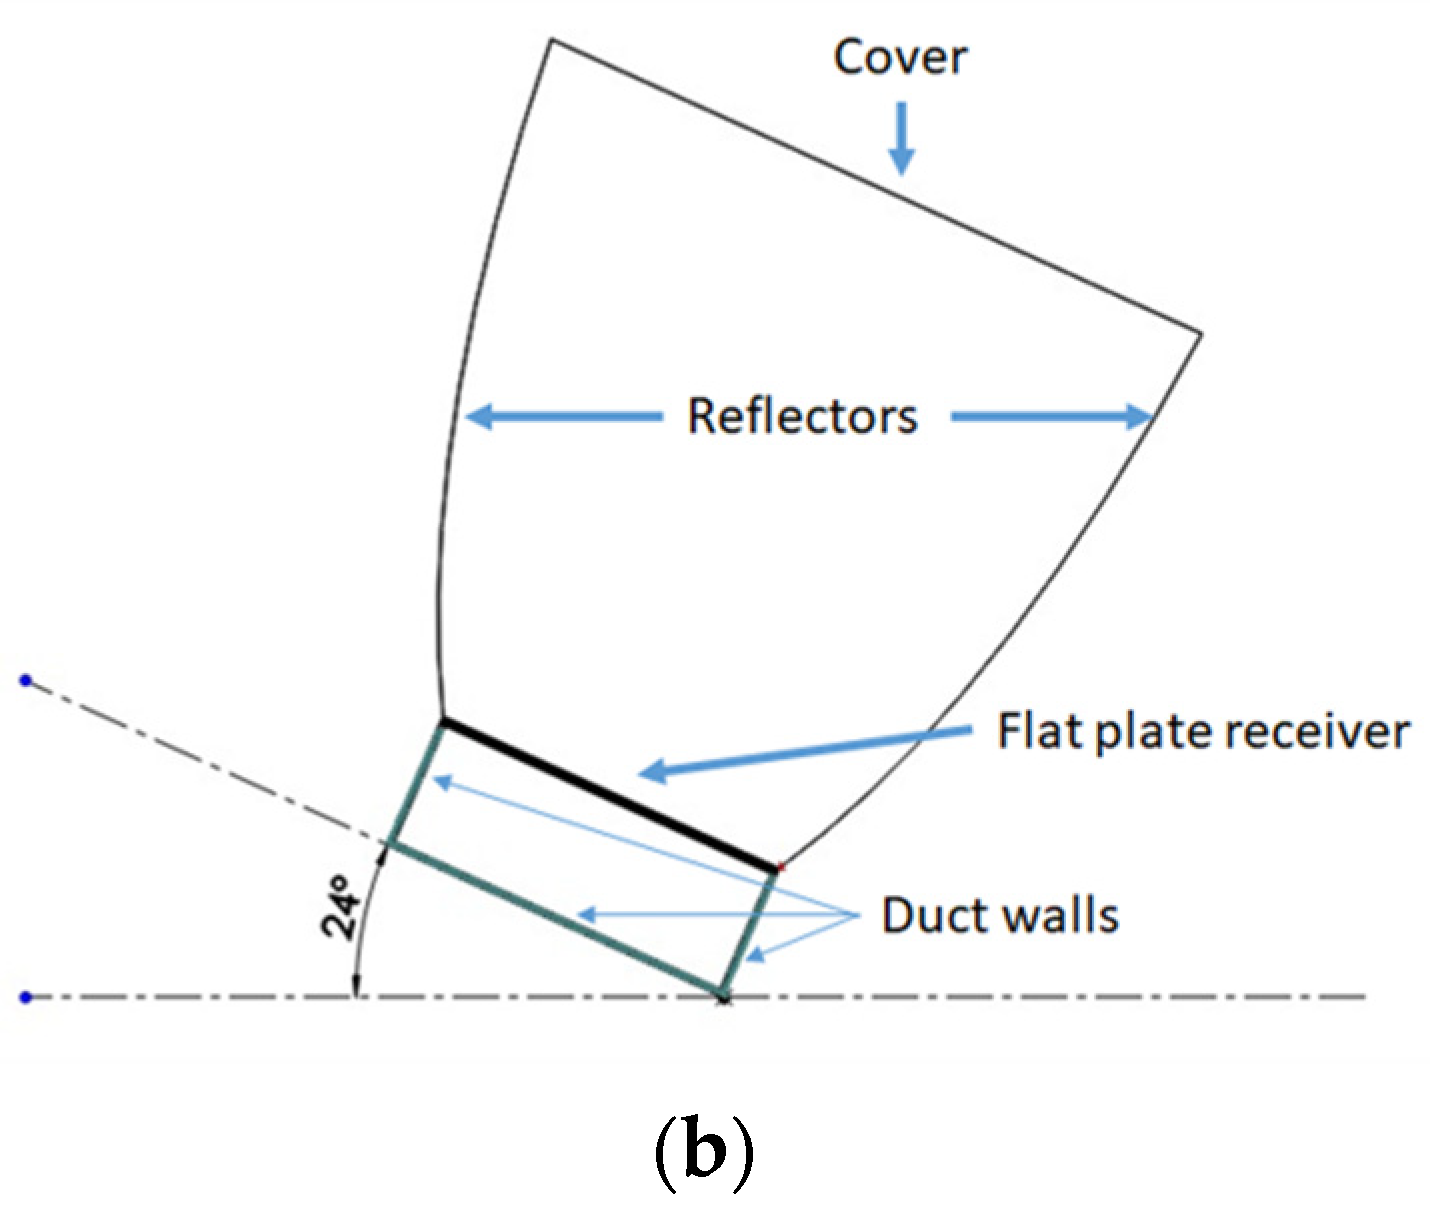
The proposed solar air heater is a variant of the flat-plate receiver Compound Parabolic Concentrator (CPC) conceptualized as a U-shape double-pass heat exchanger. Figure 1a shows the evaluated geometry dimensions and the inlet and outlet positions, whereas, in Figure 1b, the CPC cross-section is shown. The CPC is tilted 24° since it is the latitude of the City of interest (Durango, Mexico) and consists of a flat-plate receiver, two reflectors, a cover, and a duct. The first pass of the airflow inside the CPC occurs in the cavity formed by the receiver, two reflectors, and the cover, while the second pass is in the duct section. The aperture area where the solar radiation enters the CPC is 0.42 m2, while the area where it is absorbed is 0.20 m2.
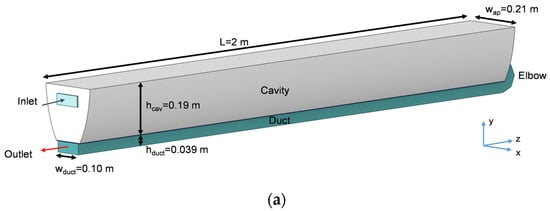
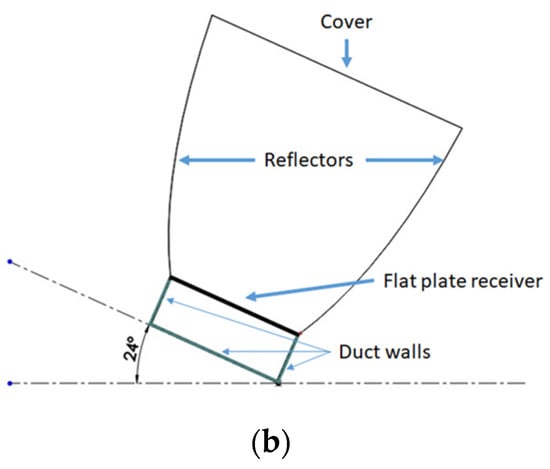
Figure 1.
U-shape double-pass CPC solar heater. (a) Geometry; (b) Cross-section.
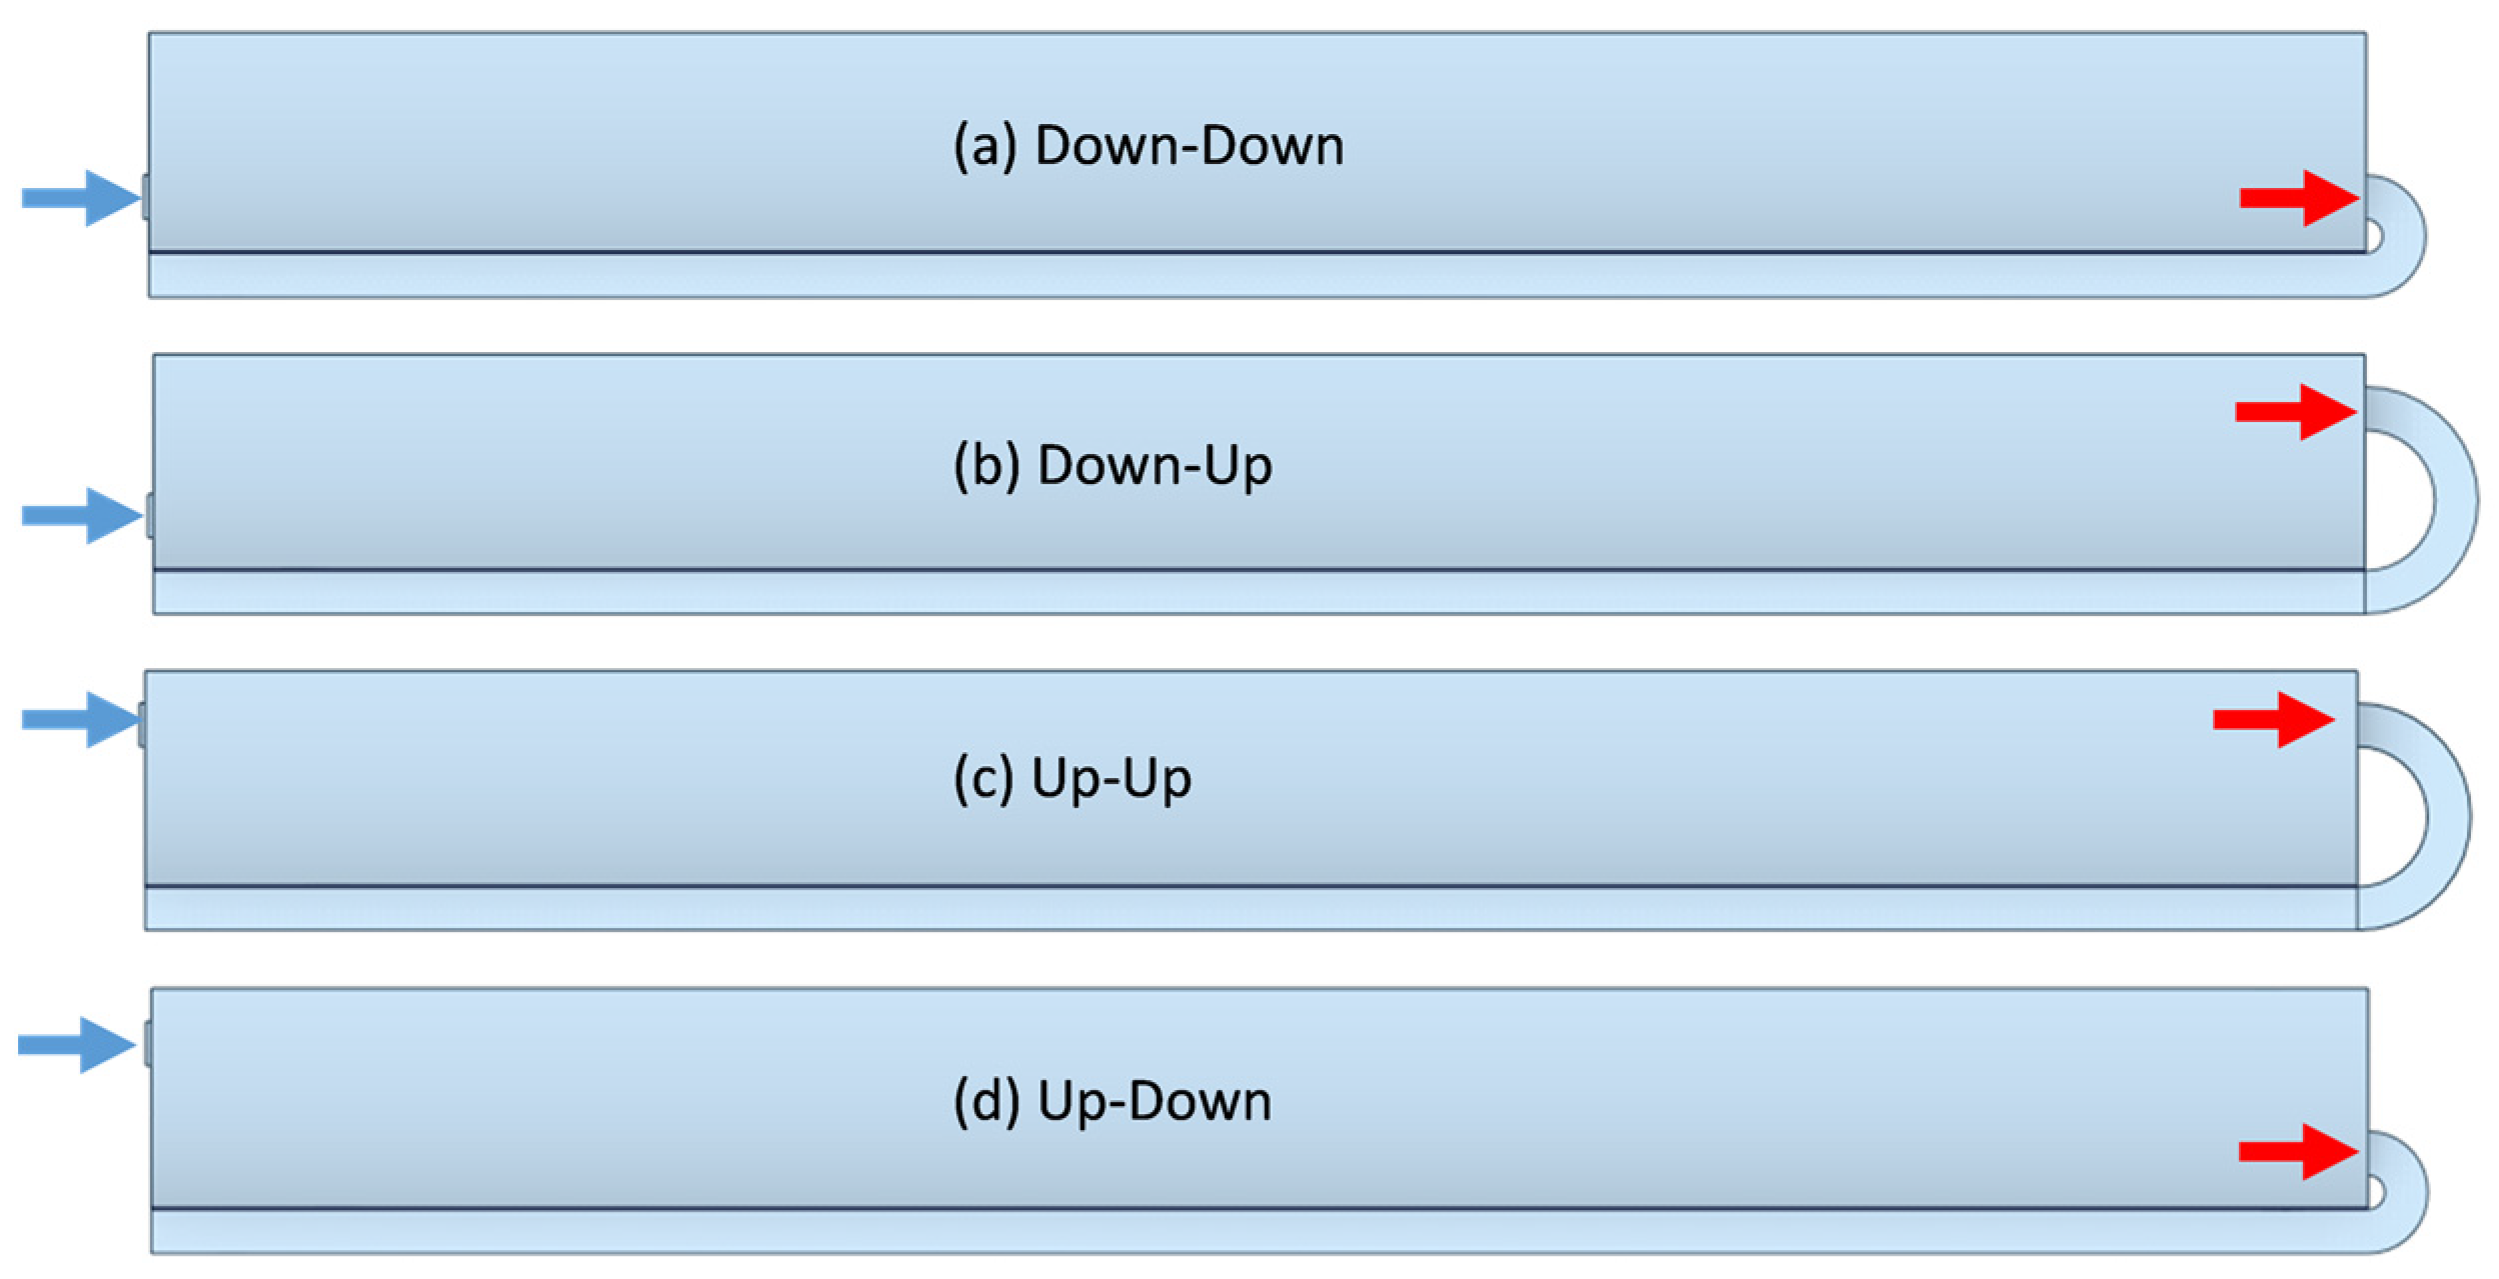
The analysis of the position of the air inlet and outlet in the cavity consisted of the study of four configurations that were positioned concerning the height of the cavity (hcav): (a) inlet ¼hcav-outlet ¼hcav (Down–Down), (b) inlet ¼hcav-outlet ¾hcav (Down–Up), (c) inlet ¾hcav-outlet ¾hcav (Up–Up), and (d) inlet ¾hcav-outlet ¼hcav (Up–Down). The air inlet and outlet configurations are shown in Figure 2.
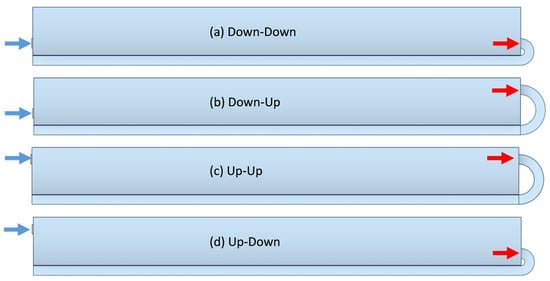
Figure 2.
Inlet and outlet studied configurations of U-shape double-pass CPC.
The properties were considered constant in the solid (Table 2). The reflector is made of anodized aluminum, while the other components of the U-shape double-pass CPC, shown in Table 2, were considered in the CFD simulation with a certain thickness to model the conduction. The duct is made of aluminum, and the receiver substrate has a selective surface; this surface has high absorptivity in the solar spectrum and low emissivity in the infrared to avoid losses due to thermal radiation. Finally, the cover is made of solid polycarbonate, and an insulating material (EPS) was considered outside the reflector and the duct to avoid thermal losses from the surface exposed to the environment.

Table 2.
Material properties of the U-shape double-pass CPC elements.
For air, the density, thermal conductivity, and viscosity were considered as polynomial functions of temperature, and the specific heat as a piecewise-linear function (Table 3).

Table 3.
Thermal properties of air.
2.1.1. Computational Domain
The fluid and solid domains were generated in the SolidWorks 2013 SP2.0 software. The solid domain simulated the absorber plate, while the fluid domain was sectioned into three volumes to facilitate meshing: (a) inlet section, (b) cavity, and (c) elbow-duct.
2.1.2. Mesh
A hexahedral structured mesh was generated according to the proposed computational domain. The near-wall model approach was used to accurately predict the hydrodynamic behavior of the flow and the heat transfer in the system. The method was to implement 15 cells to cover the viscous and buffer sublayer to have accurate results in a reasonable computation time.
The mesh refinement was carried out considering the shear stress for the hydrodynamic phenomenon and the Nusselt number (Nu) for the thermal boundary layer. The Nusselt number represents the dimensionless temperature gradient in the wall of interest.
The mesh size was refined until the variation of the shear stress and the average Nu was less than 1%. Next, the size of the viscous sublayer and the buffer sublayer were calculated for the interval 0.5 < y+ < 5 using Equation (1), and for the thermal sublayer, the Nu was monitored. In addition, y+ values of 35 and 60 were applied to the turbulent sublayer to carry out the mesh independence study; this monitoring was carried out to describe the viscous sublayer. Then, to obtain the final mesh size used in this work, the mesh was refined in the z-axis from 100 divisions to 1600. Through the analysis, Nu varied 0.2% with y+ values of 0.8 and 0.5, selecting y+ 0.8.
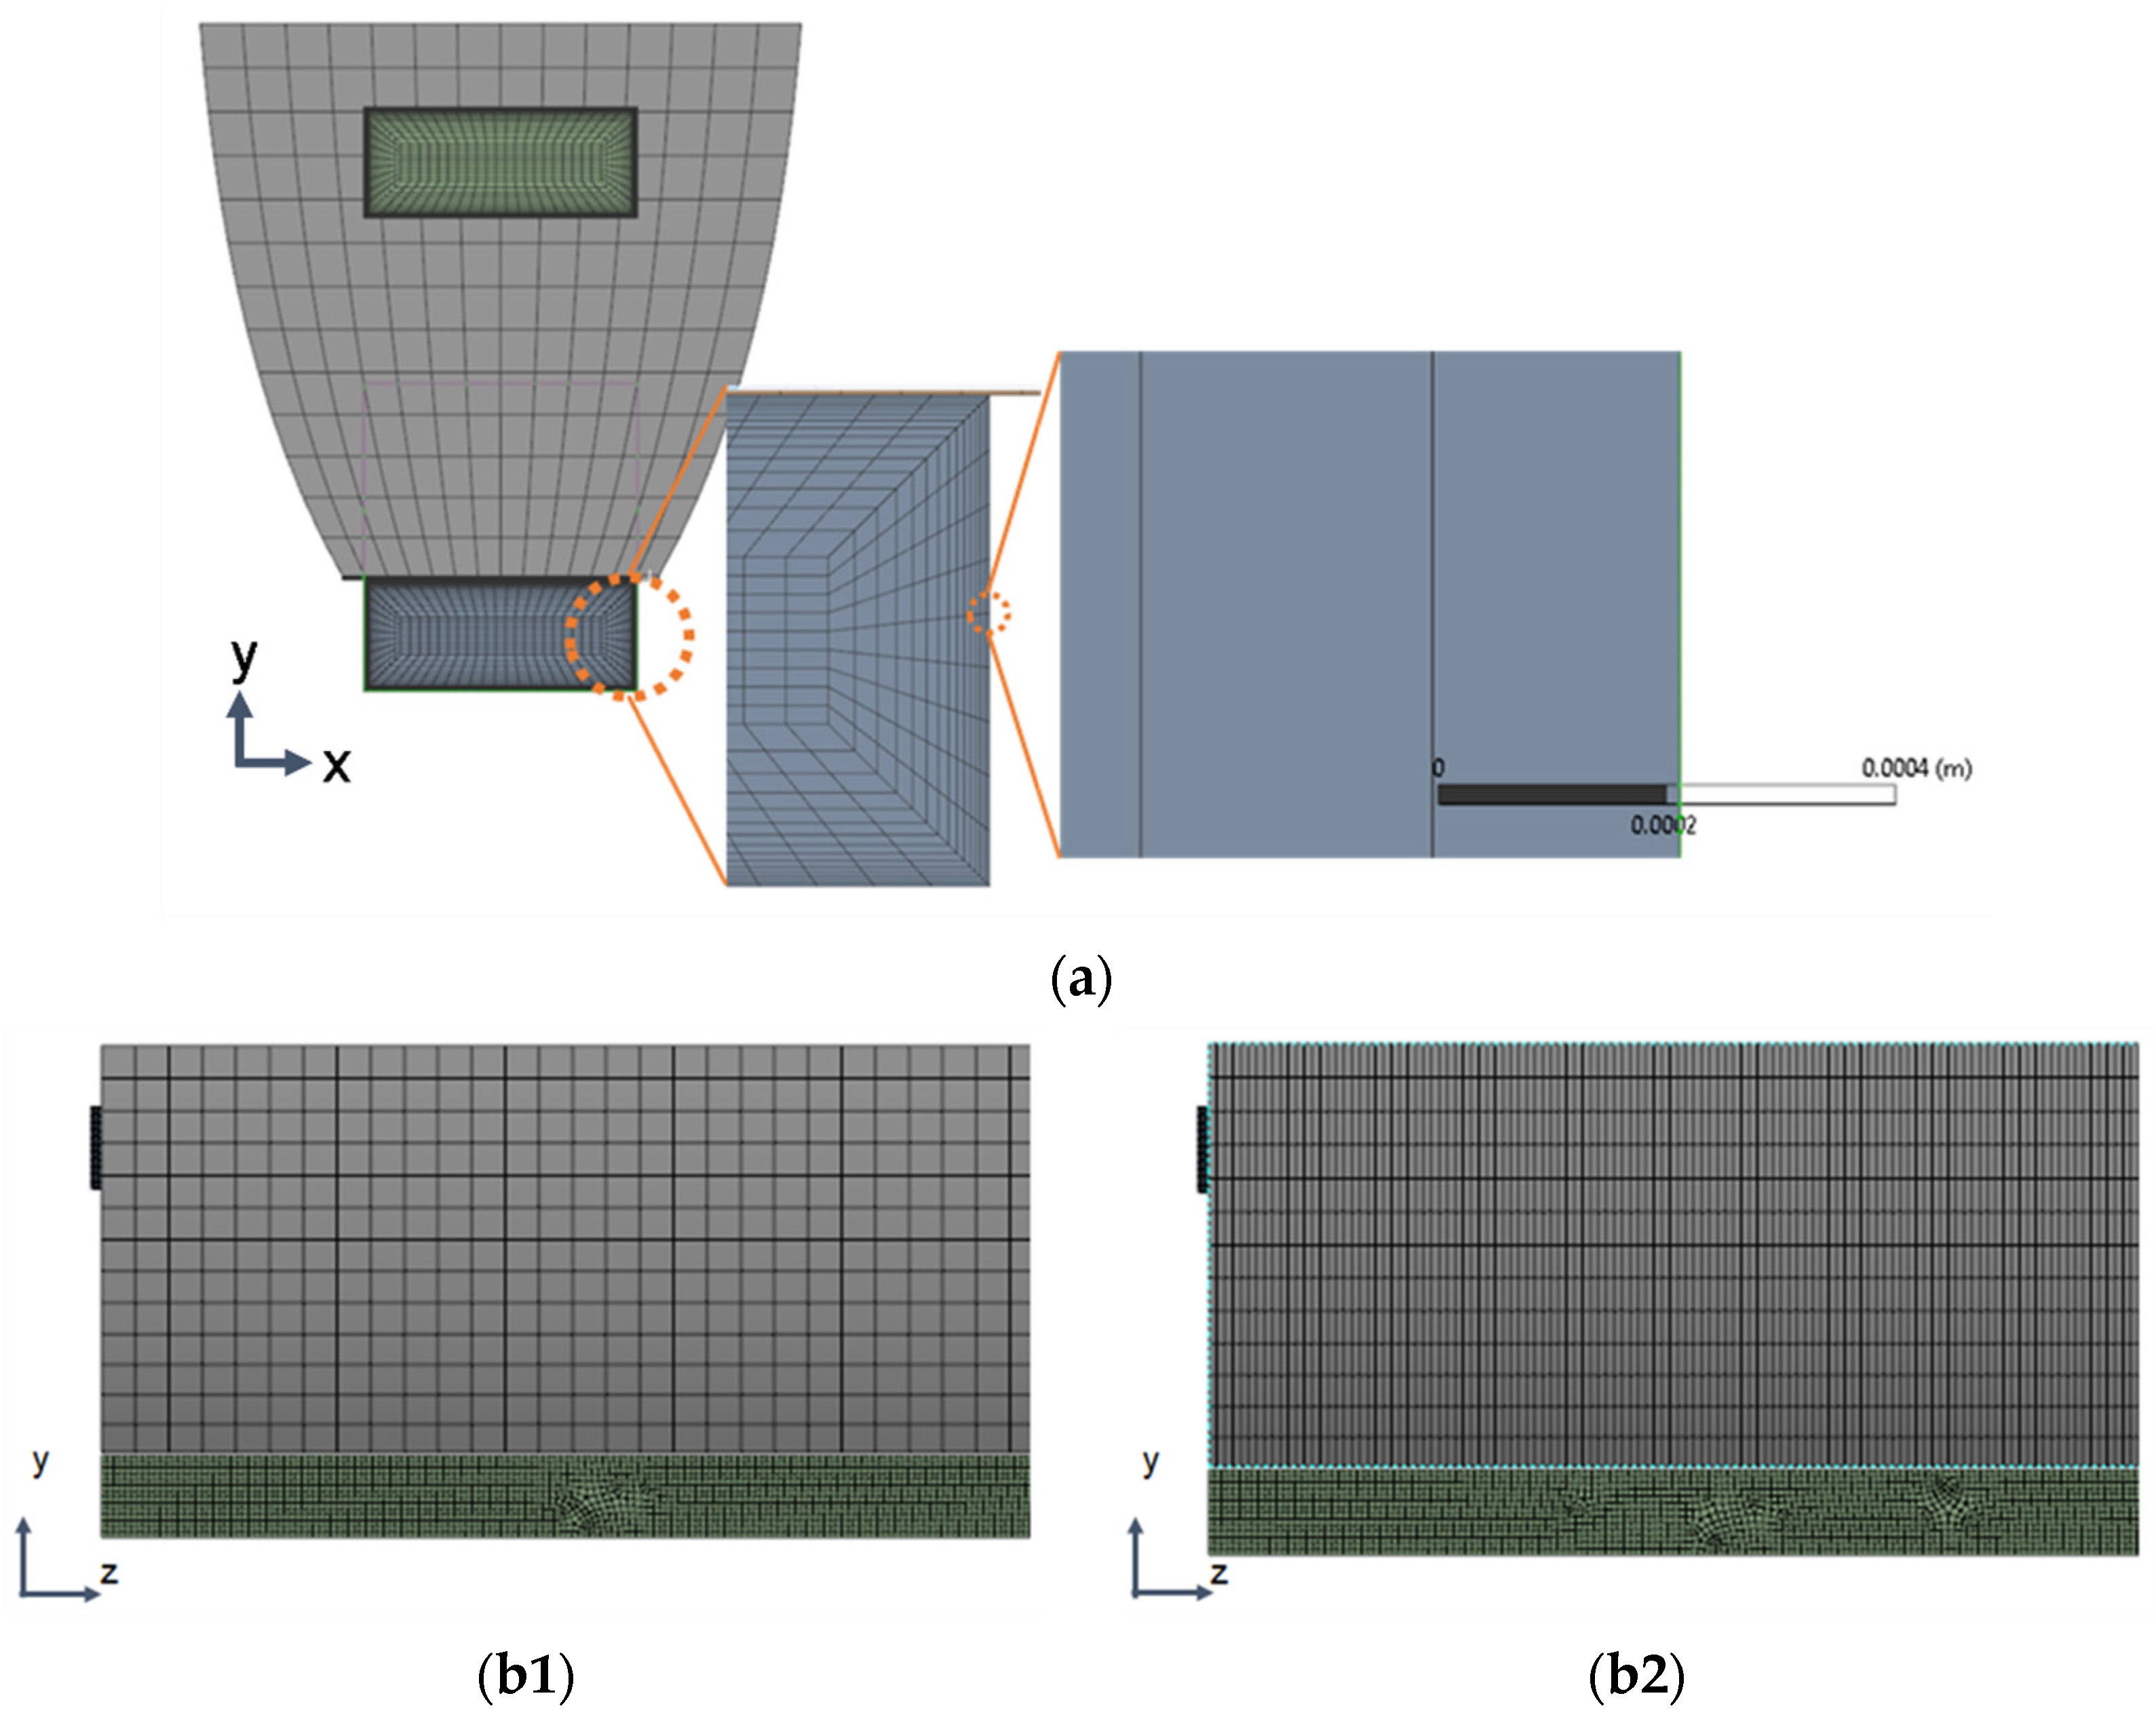
Additionally, the mesh size was verified in the direction of the entrance flow with a cavity mesh refinement in the longitudinal axis (z-axis), as shown in Figure 3. The analysis found that the Nusselt had a variation of less than 0.1% from 550 divisions onwards. In Figure 3a, a cross-section of the U-shape double-pass CPC solar heater is shown, with the magnified detail of the mesh in the receiver. Figure 3(b1,b2) present the longitudinal section, where the coarse and refined mesh in the cavity are presented.
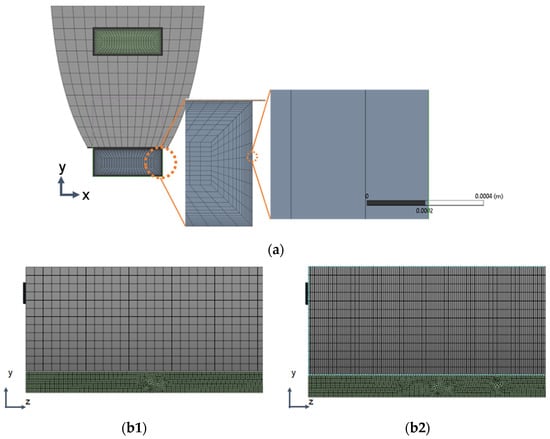
Figure 3.
Solar collector mesh. (a) Transversal section; (b1) coarse mesh in longitudinal section; (b2) refined mesh in longitudinal section.
The k-ω models are y+ insensitive treatments; therefore, the ω-equation can be integrated without additional terms through the viscous sublayer. Nevertheless, the Transition SST k-ω model requires a more stringent grid resolution to solve the thin laminar boundary layer upstream of the transition location. For this reason, using a near-wall mesh with y+ ≈ 1, especially for heat transfer predictions, is recommended [26].
2.2. Mathematical Model
The mathematical model had the subsequent considerations for the governing equations: steady state, Newtonian fluid, incompressible flow, and transition turbulence regime; therefore, the governing equations for the U-shape double-pass solar heater are as follows.
2.2.1. Turbulence Model
A preliminary hydrodynamic analysis performed in the SolidWorks 2013 SP2.0 software determined that the flow separates due to the sudden expansion at the cavity inlet. Furthermore, the flow was found to be under development (Lh,turbulent < Lcollector), and the calculated average Reynolds numbers (Re) were very low (for flow 1 (0.01 kg/s) was Recav-1 = 2972, and for flow 2 (0.02 kg/s) was Recav-2 = 5961). The k-ω turbulence models are better at predicting adverse pressure gradient boundary layer flows and separation, and they also have the ability to simulate the laminar–turbulent transition of wall boundary layers [26]. Additionally, the k-ω models have low-Reynolds number terms (Re < 104) that mimic laminar–turbulent transition processes. However, this function is not widely calibrated in the SST k-ω model; therefore, it is recommended to use the Transition SST k-ω model [27,28].
The Transition SST model was selected based on the described above and considering the required accuracy to predict heat transfer from the absorber plate to the air as the flow. Furthermore, the buoyancy effects were adjusted to full, and the viscous heating was activated. The turbulence modeling consisted of implementing the Transition SST k-omega model described in Equations (5)–(12). Equation (5) corresponds to the transport equation for intermittency (γ), whereas Equations (6) and (7) represent the transition sources Pγ1 and Eγ1, respectively; and Equations (8) and (9), the destruction/re-laminarization sources Pγ2 and Eγ2.
Flows 1 and 2 were selected based on a preliminary analysis using the thermal model described in [29]; among those flows, the best balance between air outlet temperature and thermal efficiency was found. In the calculation of the Reynolds number, the cavity was approximated as a trapezoidal cross-section duct for calculating the hydraulic diameter (Dh).
On the other hand, Equation (10) refers to the interaction of the transition model with the SST turbulence model by modifying equation k, where and are the original production and destruction terms of the SST model [28].
The pressure-based solver with the Coupled scheme was selected, and a second-order spatial discretization scheme was implemented. The gradient evaluation method selected was based on Least Squares Cell-Based, and the high-order term relaxation option was used. The pressure factor was adjusted to 0.1, and the Flow Courant Number to 4.
2.2.2. Boundary Conditions
The momentum boundary conditions in the walls were considered no-slip stationary with a constant rugosity of 0.5. The thermal boundary conditions modeled the incident solar radiation on the cover and the absorber plate as a heat generation source, calculated using Equations (13) and (14).
where q(t) is the heat generation, I(t) is the solar irradiance, Pg is the gap loss factor (0.96), α is the absorptivity, τ is the transmissivity, ρ is the reflectivity, Ac is the cover area, Ap is the absorber plate area, and wc and wg, are the thickness of the cover and plate, respectively. The optical properties of the cover are αc = 0.05, τc = 0.89 y ρc = 0.05, the receiver are αp = 0.95 and ρp = 0.05, and from the reflector ρr = 0.91.
The heat transfer coefficient from the cover to the environment (HTCc-a) was obtained by applying the flow around finite flat-plates methodology reported in [30], while the convection losses of the external walls were calculated using the heat transfer coefficient (HTCb) correlation proposed by [31]. Additionally, in laminar flow, the heat transfer coefficient from the flat-plate receiver to the fluid in the cavity (HTCp-cav) was estimated using the discretized Fourier’s law, considering the local temperature normal to the wall [26]. Moreover, in turbulent flow, the HTCp-cav was determined using the law of the wall for estimating the local temperature of the fluid by applying the Reynolds analogy [26].
The heat conduction in the exterior walls of the CPC was modeled as shell conduction, whereas the radiation losses in the cover were calculated with an emissivity value of εc = 0.81, and the sky temperature (Ts) was calculated with the correlation proposed by Swinbank (Equation (15)), reported in [32], where Ta refers to the ambient temperature.
Regarding the turbulence parameters, a turbulence intensity of 5% and a turbulent viscosity ratio of 10 were applied. Table 4 summarizes the parameters of the boundary conditions of the CFD modeling.

Table 4.
Boundary conditions considered in the CFD modeling of the U-shape double-pass CPC.
The pressure-based solver with the Coupled scheme was selected. In addition, a Second-Order scheme for spatial discretization was implemented because of numerical simulation stability. The formal truncation errors of individual terms in the governing equations were calculated; the error for the HTCp-cav was 1.27%, 0.051% for the shear stress, and 0.05% for the Nusselt number (with a security factor of Fs = 3) [32]. In addition, values of 1 × 10⁻⁴ for the mass residual and a mass imbalance of 5.3 × 10⁻⁸% and 2 × 10⁻⁷ energy residual were accomplished. The verification of the results was carried out by quantifying the uncertainty of the numerical calculations. For Nu, the spatial error of 0.51% was obtained, while for HTCp-cav and shear stress were 0.66% and 0.37%, respectively. The grid convergence index was also verified, finding out 0.05% for Nu, 0.19% for shear stress, and 0.09% for HTCp-cav.
2.3. Efficiency Calculation
The thermal efficiency of the collector is calculated as the ratio between the useful energy gained by the fluid on the collector’s cavity and absorber and the net solar energy on the collector’s aperture, using Equation (16):
The heat transfer of the analyzed solar collector resembles a counterflow heat exchanger, where the cold fluid flows through the cavity, and the hot fluid flows through the duct. Therefore, the useful energy gain of the collector is calculated using Equation (17).
3. Results and Discussion
Once the simulation model of the four CPC configurations with different inlet and outlet positions was implemented (see Figure 2), simulations were carried out considering the boundary conditions for two different values of mass flow rates to analyze: 0.01 kg/s and 0.02 kg/s. The materials, air properties, and boundary conditions are presented in Table 2, Table 3 and Table 4, respectively. In addition, the results of the hydraulic and thermal behavior of the air in the cavity of the CPC for each of these configurations are presented below.
3.1. Hydraulic Behavior
Figure 4 and Figure 5 show the velocity streamlines with the two analyzed air mass flow rates (flow 1: 0.01 kg/s and flow 2: 0.02 kg/s, respectively). In Figure 4 (flow 1: 0.01 kg/s), the configurations with an inlet from below (a and b), a sudden expansion occurs near the inlet of the cavity, forming an eddy in the upper part of the collector. While in the configurations with the entrance at the top (c and d), the eddy forms at the bottom. Further, in all configurations except (b), it is observed that after the air enters the cavity, several families of eddies form until the end of the collector (z = 2.0 m). On the other hand, in configuration (b), a large eddy is observed in the first half of the cavity, and then the formation of some smaller eddies. Finally, it is essential to note that the highest magnitude velocities are generated at the elbow and at the beginning of the duct (second pass).


Figure 4.
Streamlines at the collector cross-section with air mass flow 1: 0.01 kg/s. (a) Down–Down; (b) Down–Up; (c) Up–Up; (d) Up–Down.


Figure 5.
Streamlines at the collector cross-section with air mass flow 2: 0.02 kg/s. (a) Down–Down; (b) Down–Up; (c) Up–Up; (d) Up–Down.
In Figure 5, a similar behavior to the one described for flow 1 is shown for flow 2 (0.02 kg/s), where a sudden expansion of air near the inlets occurs. For configurations (a) and (b) (inlet from the bottom), a visible jet can be observed at the bottom of the cavity; here, an eddy at the upper region can also be observed. Contrarily, in the configurations with an inlet from above, the jet is formed at the top, whereas the eddy occurs at the bottom region. Additionally, in configurations (a) and (c) (either both inlet and outlet from above or below), there is a primary air current with high speed. In configuration (a), the current goes up and down the cavity, generating several eddies at the upper and bottom sides opposite to the main flow. Contrarily, in configurations (b) and (d), which have inlet and outlet in opposite positions on the y-axis, a large eddy is formed near the cavity inlet, observing a larger eddy in configuration (b) that moves towards the exit in a disorderly manner. Moreover, the largest speed occurs at the elbow of the collector, having higher speeds in the configurations with a bottom outlet.
One reason that explains a disordered and asymmetric flow is because of the collector tilt (see Figure 1). In addition, the pressure increase justifies the phenomenon of the sudden air contraction caused by the elbow area reduction. Furthermore, a higher mass flow influences the amplitude and turbulence of the eddies found in the first section of the cavity.
3.2. Thermal Behavior
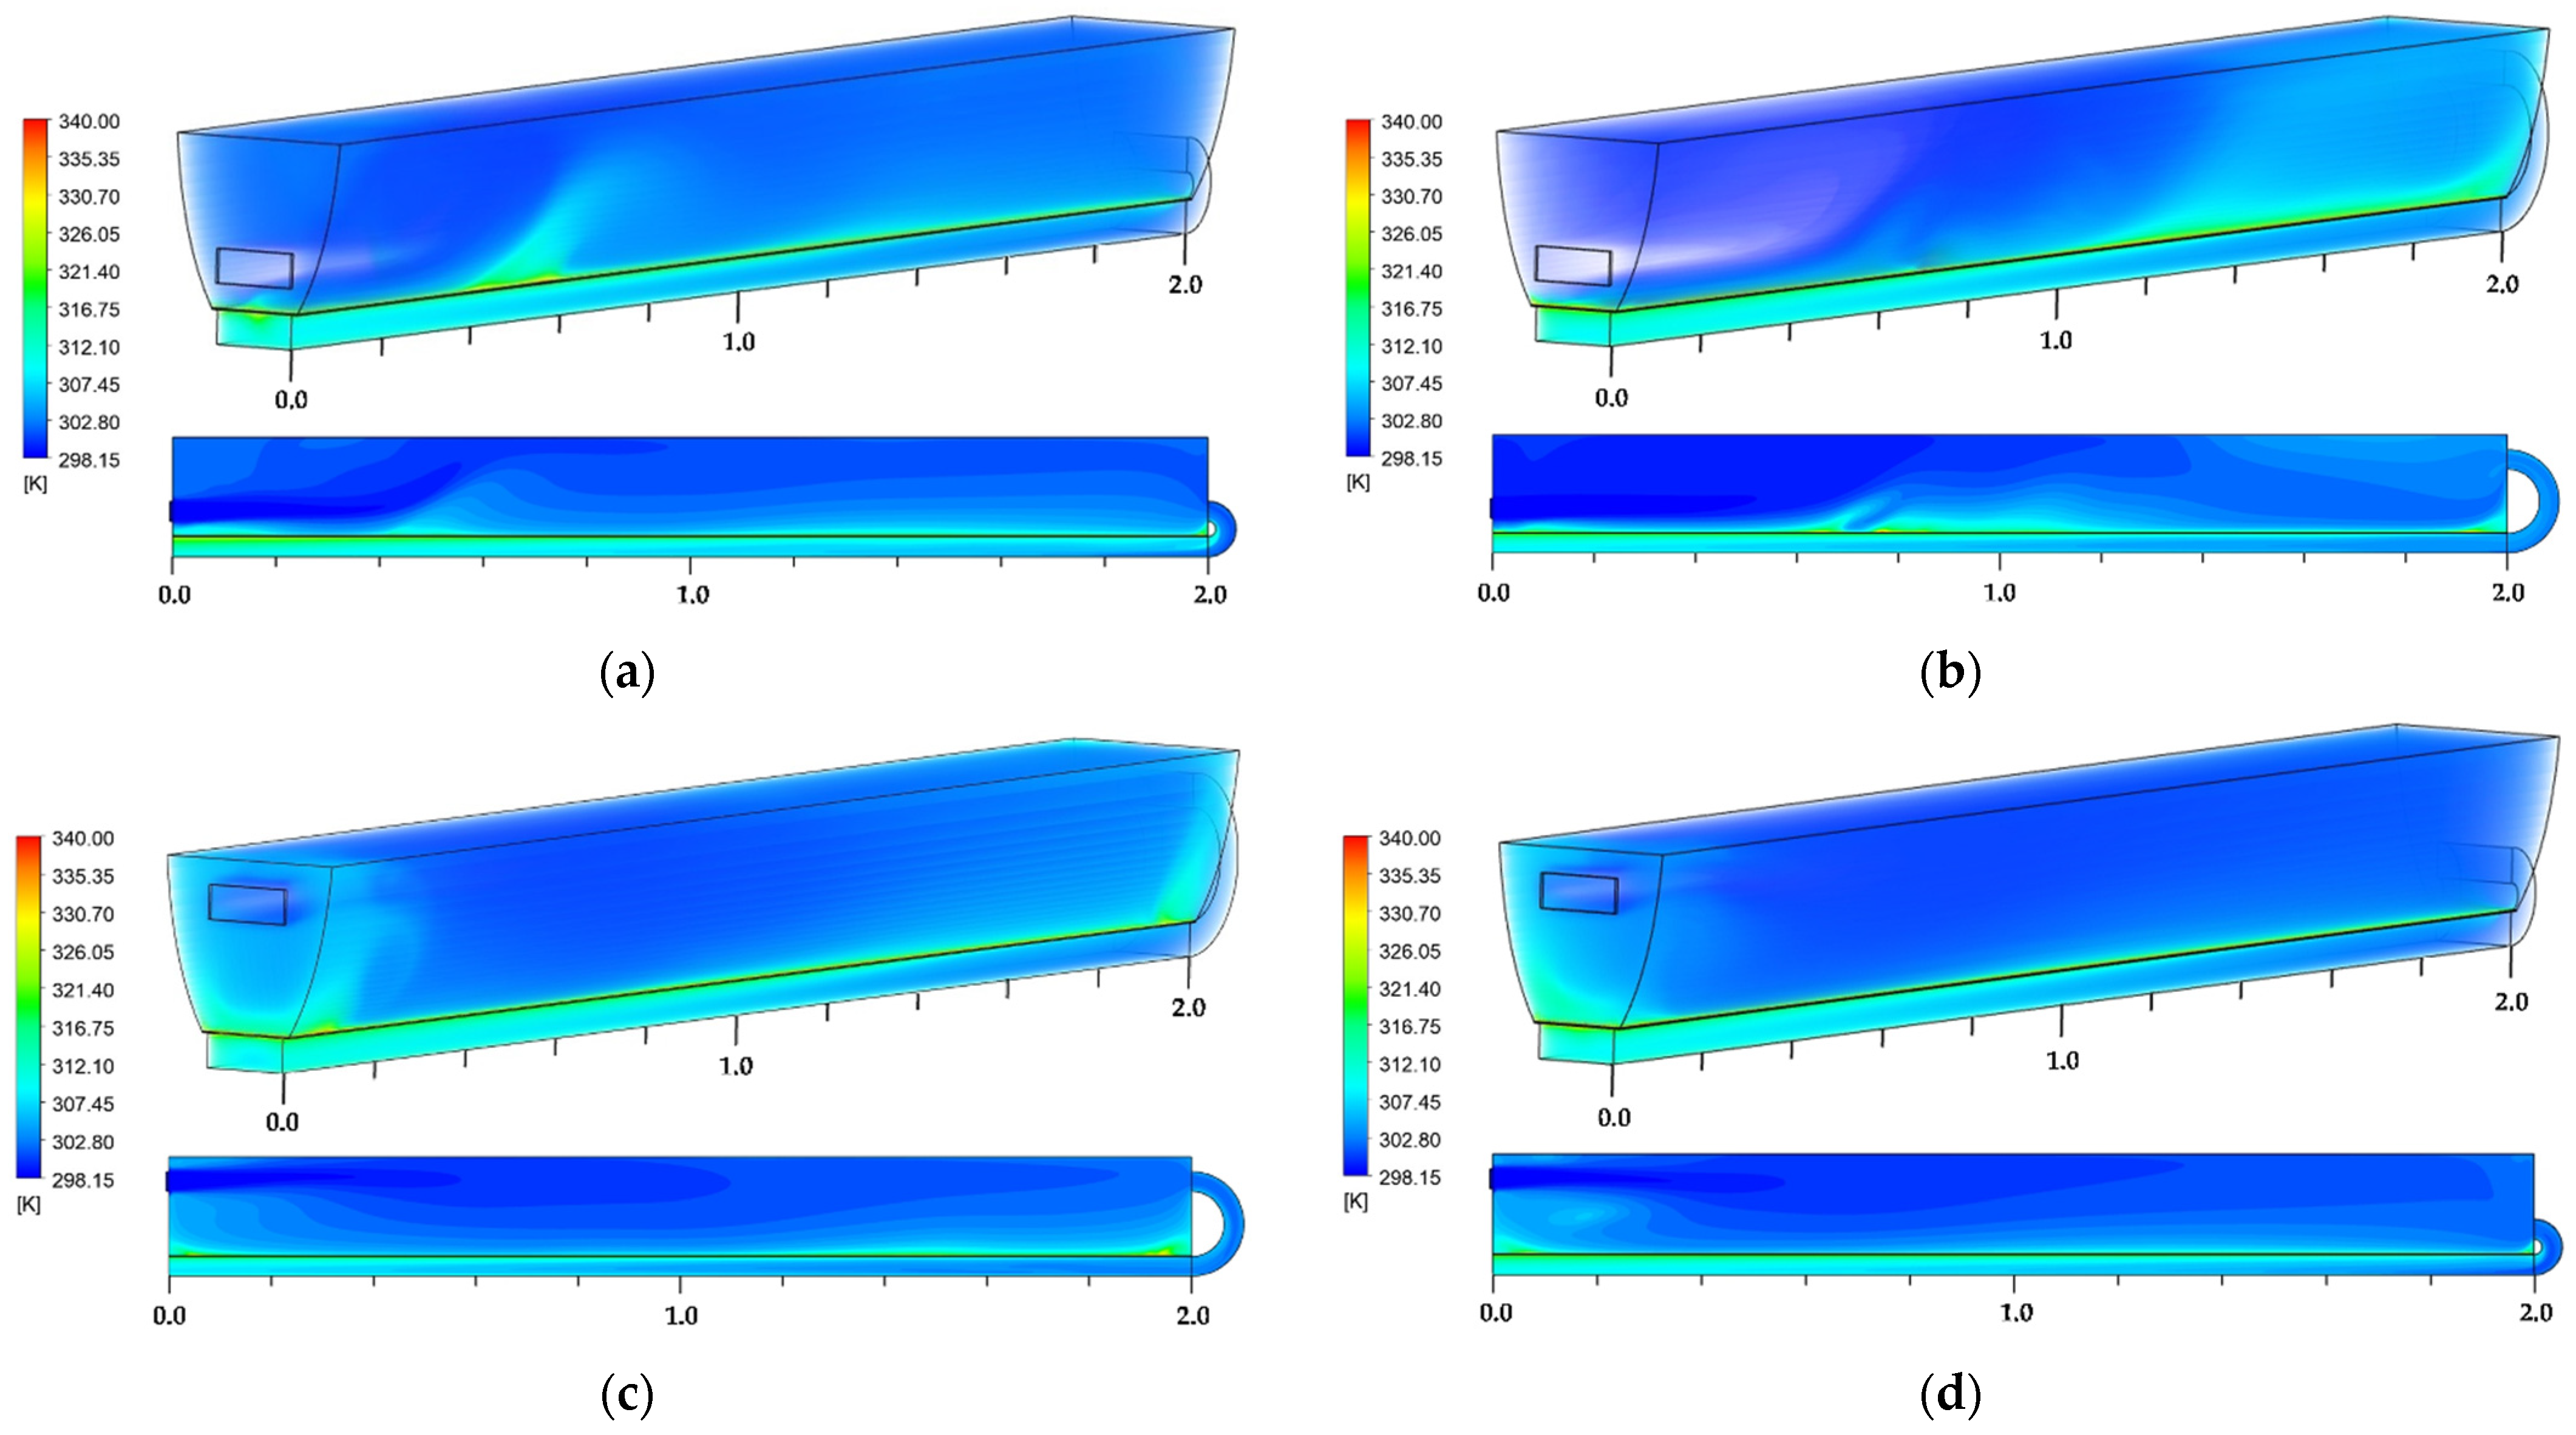
Figure 6 and Figure 7 show the temperature fields of the four analyzed configurations. In Figure 6, for flow 1, it is observed that there is an extended region at low temperatures for all configurations in the cavity inlet, which is related to the air inlet in the form of a jet described in Figure 4. In all configurations, a region with low temperature is generated related to the jet of cold air that enters the cavity. For the configurations with an inlet from the bottom, the zone is located in the upper left corner. This is due to the presence of the primary eddies observed in the hydrodynamic behavior of the fluid (Figure 4 and Figure 5). In configurations with a top inlet, the area is also extended towards the middle of the cavity, which is related to less turbulence in the movement of the fluid.


Figure 6.
Air temperature fields at the collector cross-section with air mass flow 1: 0.01 kg/s. (a) Down–Down; (b) Down–Up; (c) Up–Up; (d) Up–Down.
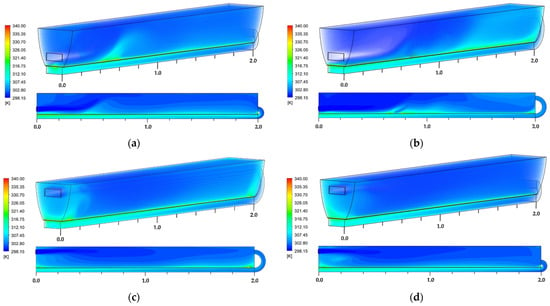
Figure 7.
Air temperature fields at the collector cross-section with air mass flow 2: 0.02 kg/s. (a) Down–Down; (b) Down–Up; (c) Up–Up; (d) Up–Down.
When the air enters from above, a zone of hot air is generated in the region near the entrance and another near the exit, while configurations with a bottom inlet have a heat recovery since the air enters the cavity.
For all configurations, the region with the highest temperature is located in the proximity of the receiver, and it is related to the heat generation on the receiver plate. Consequently, in the final part of the duct, there is another region with high temperatures. High temperatures are highly desirable since heat is extracted from the plate to the working fluid.
In Figure 7 (flow 2: 0.02 kg/s), the temperatures are lower than the ones observed in flow 1 (0.01 kg/s). In the four configurations, the temperature fields are highly dependent on the movement of the fluid in the cavity. The phenomena that drive the low temperatures in the section near the cavity inlet are the presence of a cold air jet from the inlet air and the consequent formation of eddies throughout the cavity. In the configurations with an inlet from below (a and b), there is another circumstance that causes the low temperatures, and it is due to the formation of the main eddy in the upper part of the cavity that promotes the stagnation of cold air in this section. Similar to the behavior described for temperatures of flow 1, for flow 2, the highest temperatures are always found in the regions neighboring the receiving duct.
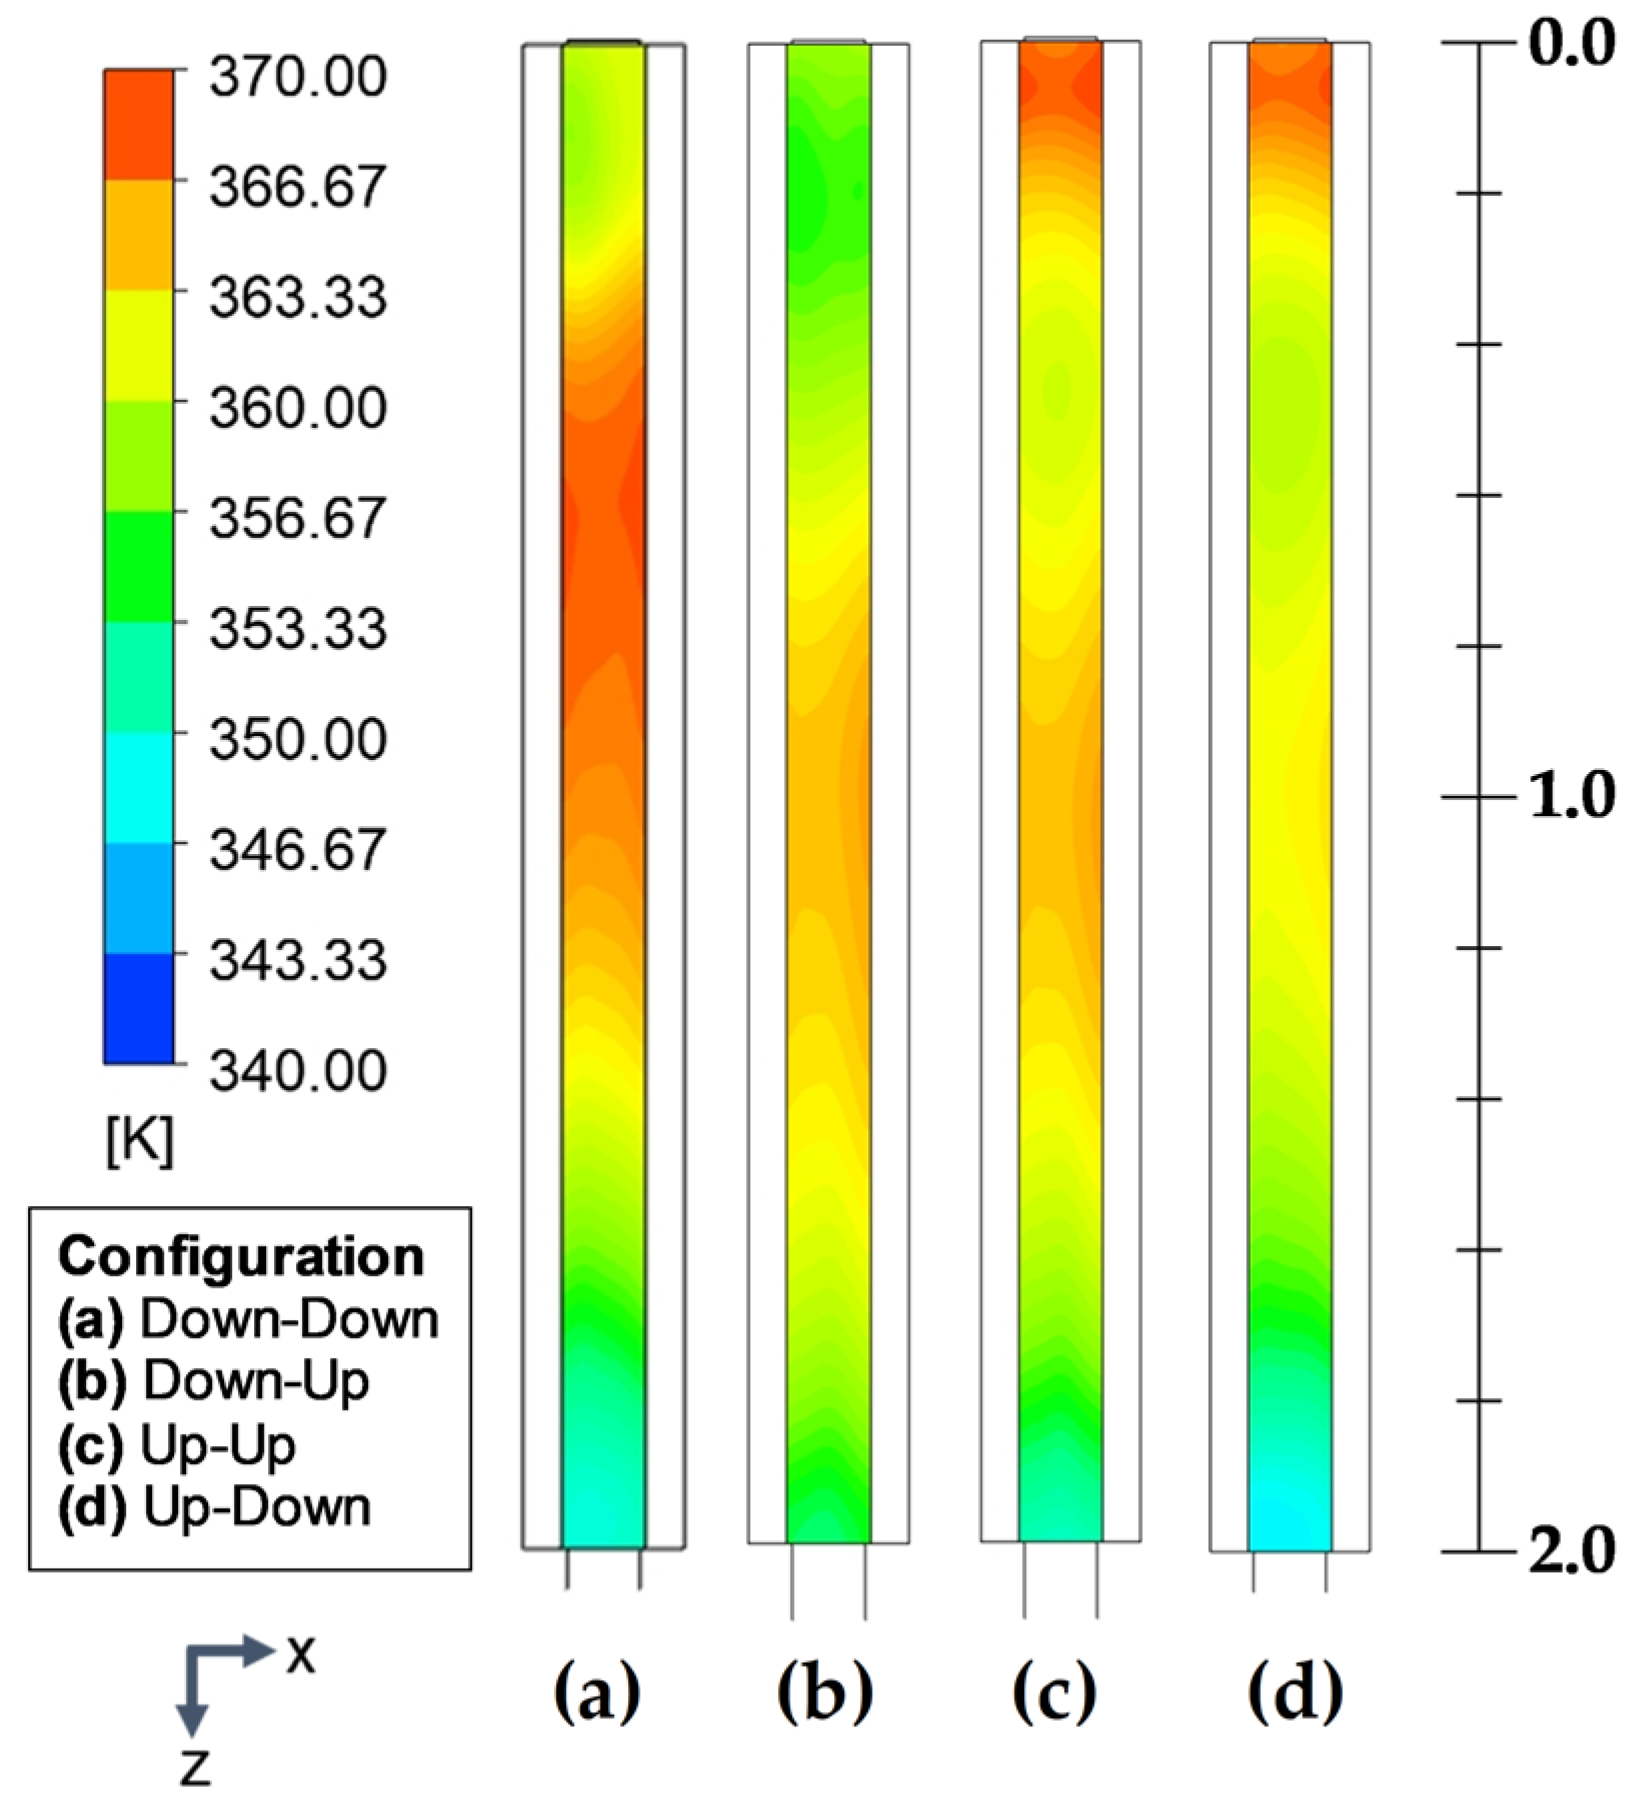
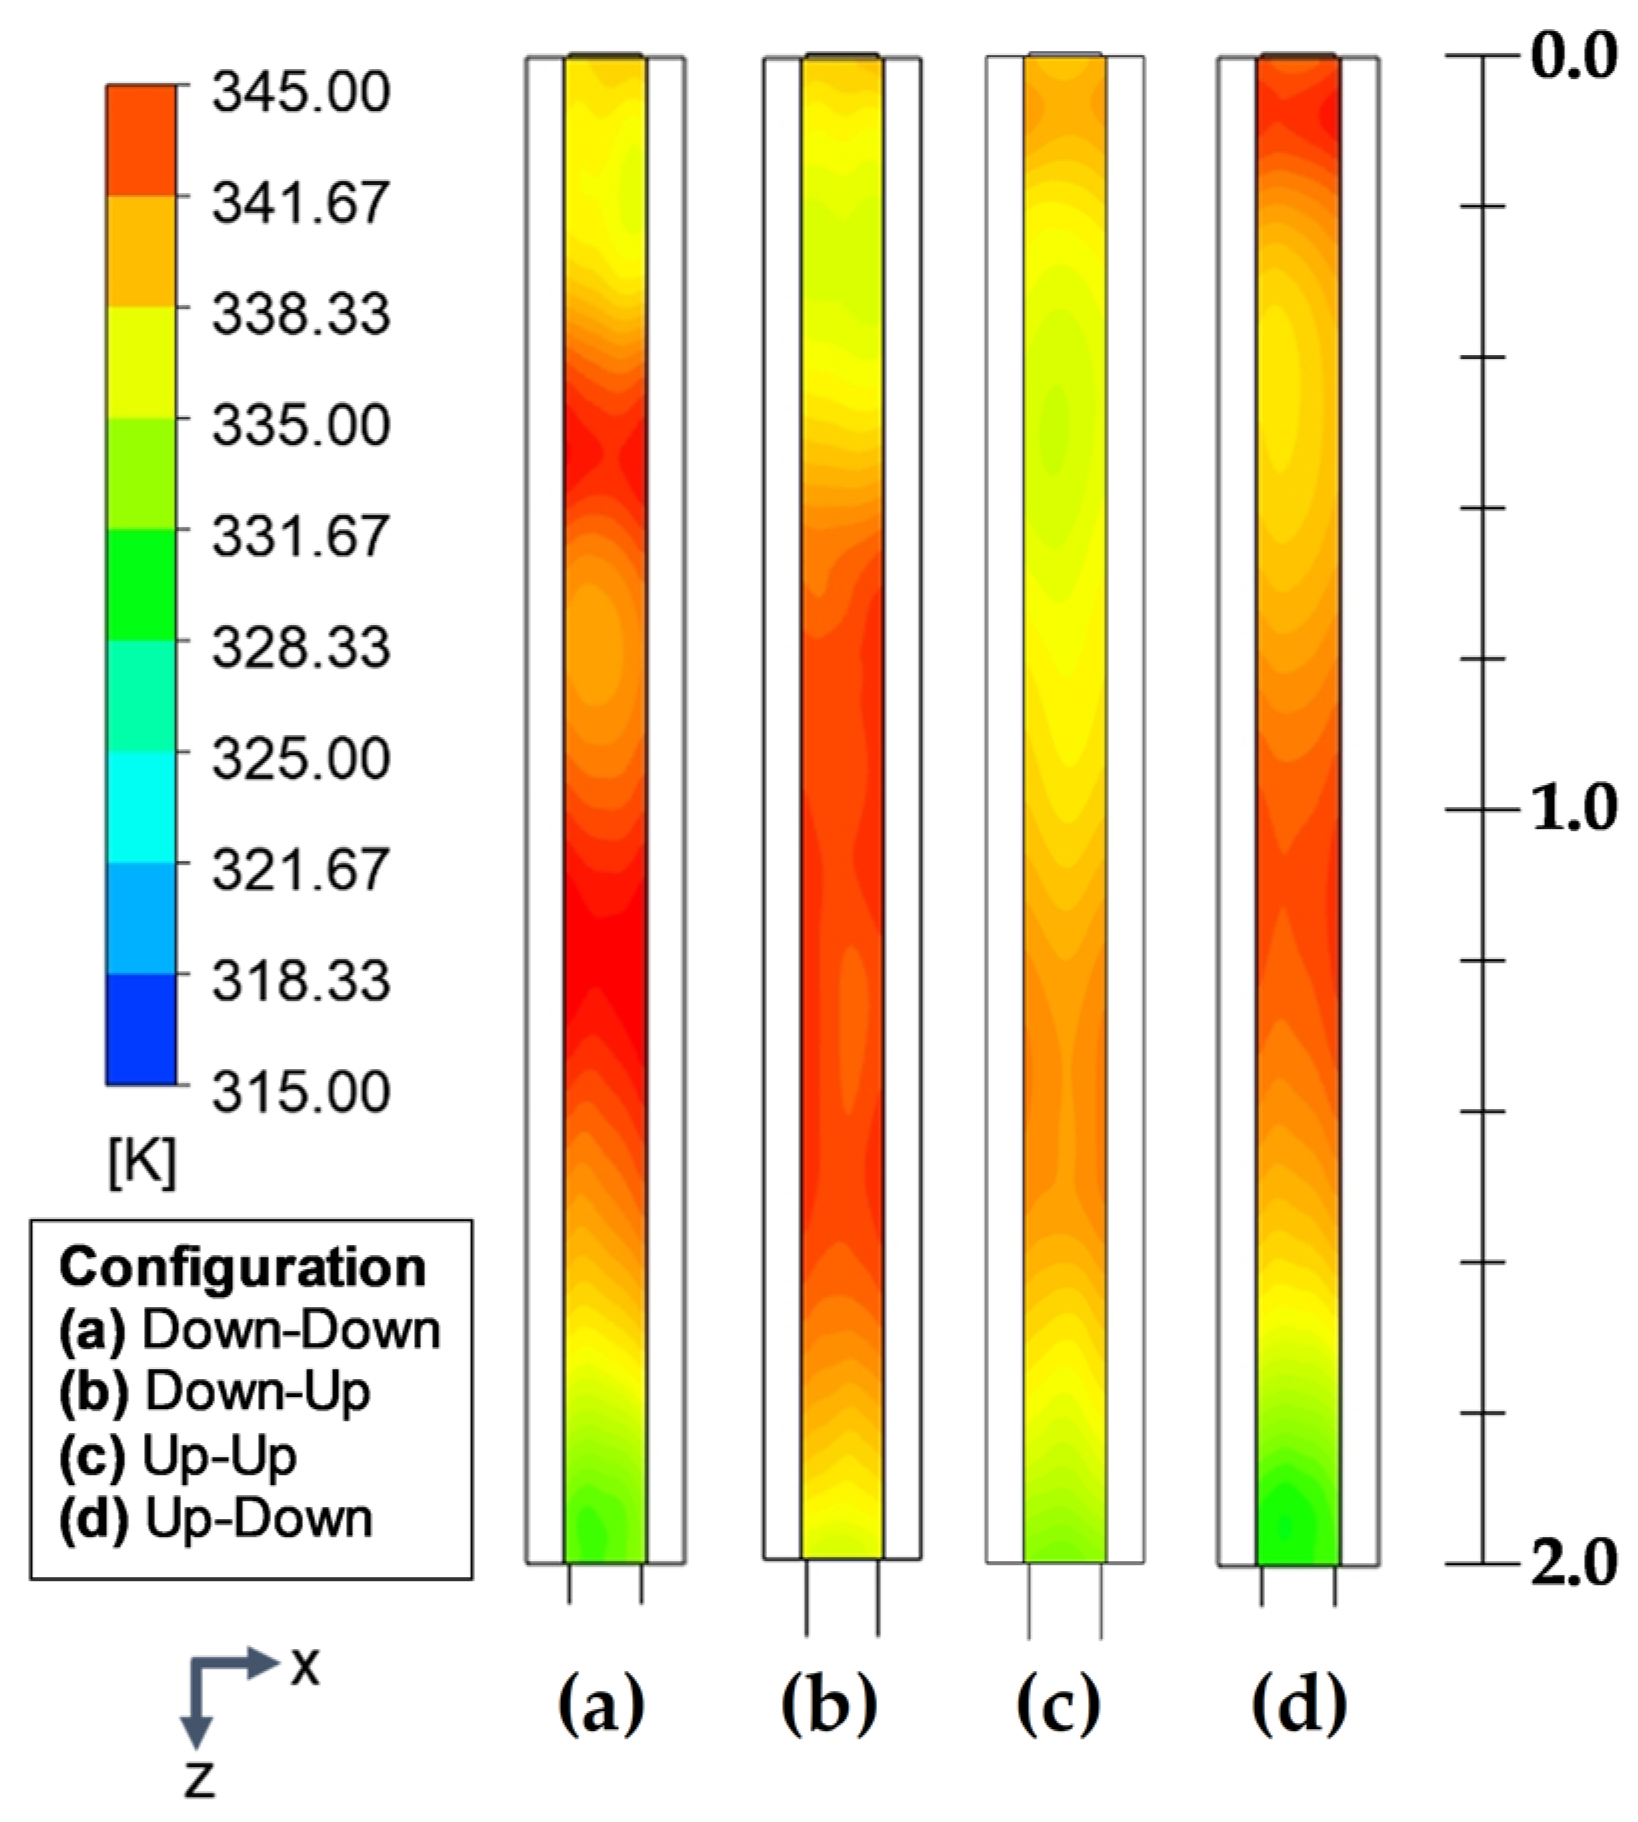
Figure 8 and Figure 9 show the four configurations of the flat plate receiver temperature contours at flow 1 (0.01 kg/s) and flow 2 (0.02 kg/s), respectively.
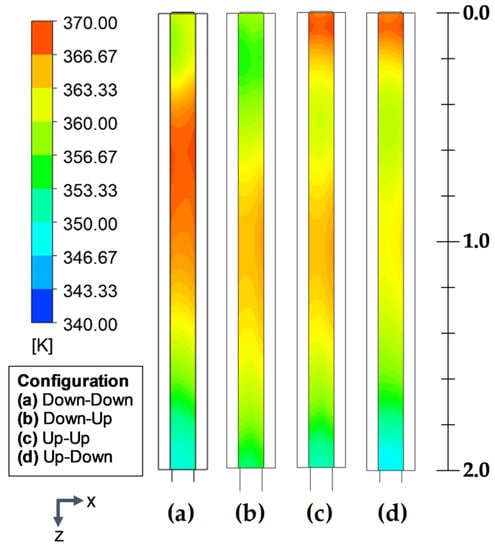
Figure 8.
Temperature contours in the flat plate receiver, first pass (Flow 1: 0.01 kg/s).
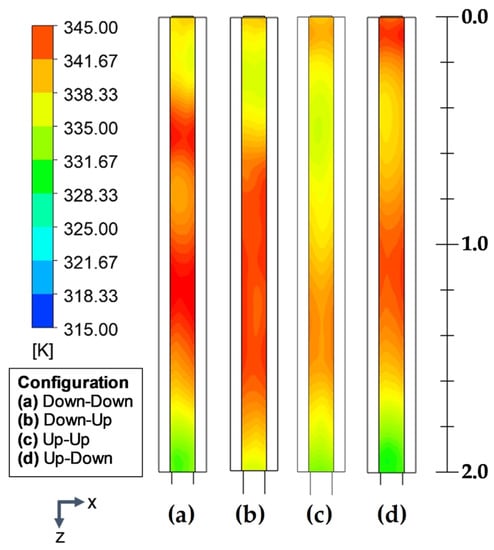
Figure 9.
Temperature contours in the flat plate receiver, first pass (Flow 2: 0.02 kg/s).
Figure 8 (flow 1: 0.01 kg/s) shows that when the air enters from below (configurations a and b), it removes heat from the first part of the receiver since it enters the cavity. In contrast, when the air enters from above (configurations c and d), the zones with lower temperatures are displaced from around positions z = 0.30 m to z = 0.65 m. The displacement of the presence of the lower temperature zones is a direct consequence of the formation of the main eddy, which helps to remove heat from the receiver. On the other hand, in configuration (a) Down–Down, a higher temperature of around 370 K is observed, indicating that the heat would not be uniformly removed in the first pass. This high-temperature zone is explained by contrasting with the hydrodynamic behavior observed in Figure 4, since when the air enters from the bottom, it heats up when it comes into contact with the receiver and rises, then continues its movement mainly through the upper part and then descend when looking for the exit that is in the lower part of the cavity. In contrast, configurations (b), (c), and (d) have a medium–high temperature zone in the center of the receiver. When the air leaves the collector cavity (z = 2.0 m), low-temperature zones are generated in the configurations with an outlet from below (configurations (a) and (d)).
In contrast, in configurations (c) and (d), the existence of two zones of low and medium–high temperature indicates that although heat removal is heterogeneous, energy is recovered in the zone between z = 0.30 m and z = 0.8 m, which is related to the presence of a large eddy in the inlet zone surroundings. In configuration (b), two low-temperature zones are observed at the inlet and outlet of the collector and a medium–high temperature zone in the center.
In Figure 9, similar temperatures but lesser magnitude can be observed, corresponding to the prevalence of high velocities due to the application of a large mass flow rate (0.02 kg/s). Low-temperature regions are observed near the inlets in the receiver plates of configurations (a) and (b), where the inlet is from below. Configurations (a) and (d), with outlets from below, have low-temperature regions near the outlets meaning that heat removal mainly occurs in those sections. On the other hand, configurations (a) and (b) have a sizeable high-temperature area in their central zone, noting that this area comprises most of the receiver plate extension. For configuration (c), a zone from z = 0.2 m to z = 1.0 m with lower temperatures is observed, and even though its outlet is from above; it also has a small region with low temperatures near the exit. Contrastingly, configuration (d) has most of its receiver flat-plate with high temperatures, except for its final part (around z = 1.7 m to z = 2.0 m). Still, it is essential to note that the high temperatures observed for the receiver plates of Figure 9 (around 345 K) are of lesser magnitude than those observed in Figure 8 (around 370 K), and thus higher heat removal was accomplished with the application of flow 2 (0.02 kg/s).
Table 5 shows the average temperatures in the flat plate receiver (Tp,avg) for both airflow rates. The highest temperature, as expected, is obtained with flow 1, 362.2 K with configuration (a); the lowest is obtained with flow 2, with configuration (c), of 338.5 K. The flat-plate temperature differences between flows 1 and 2 are greater than 19.7 K.

Table 5.
Mean temperatures in the flat plate receiver of the U-shape double-pass CPC.
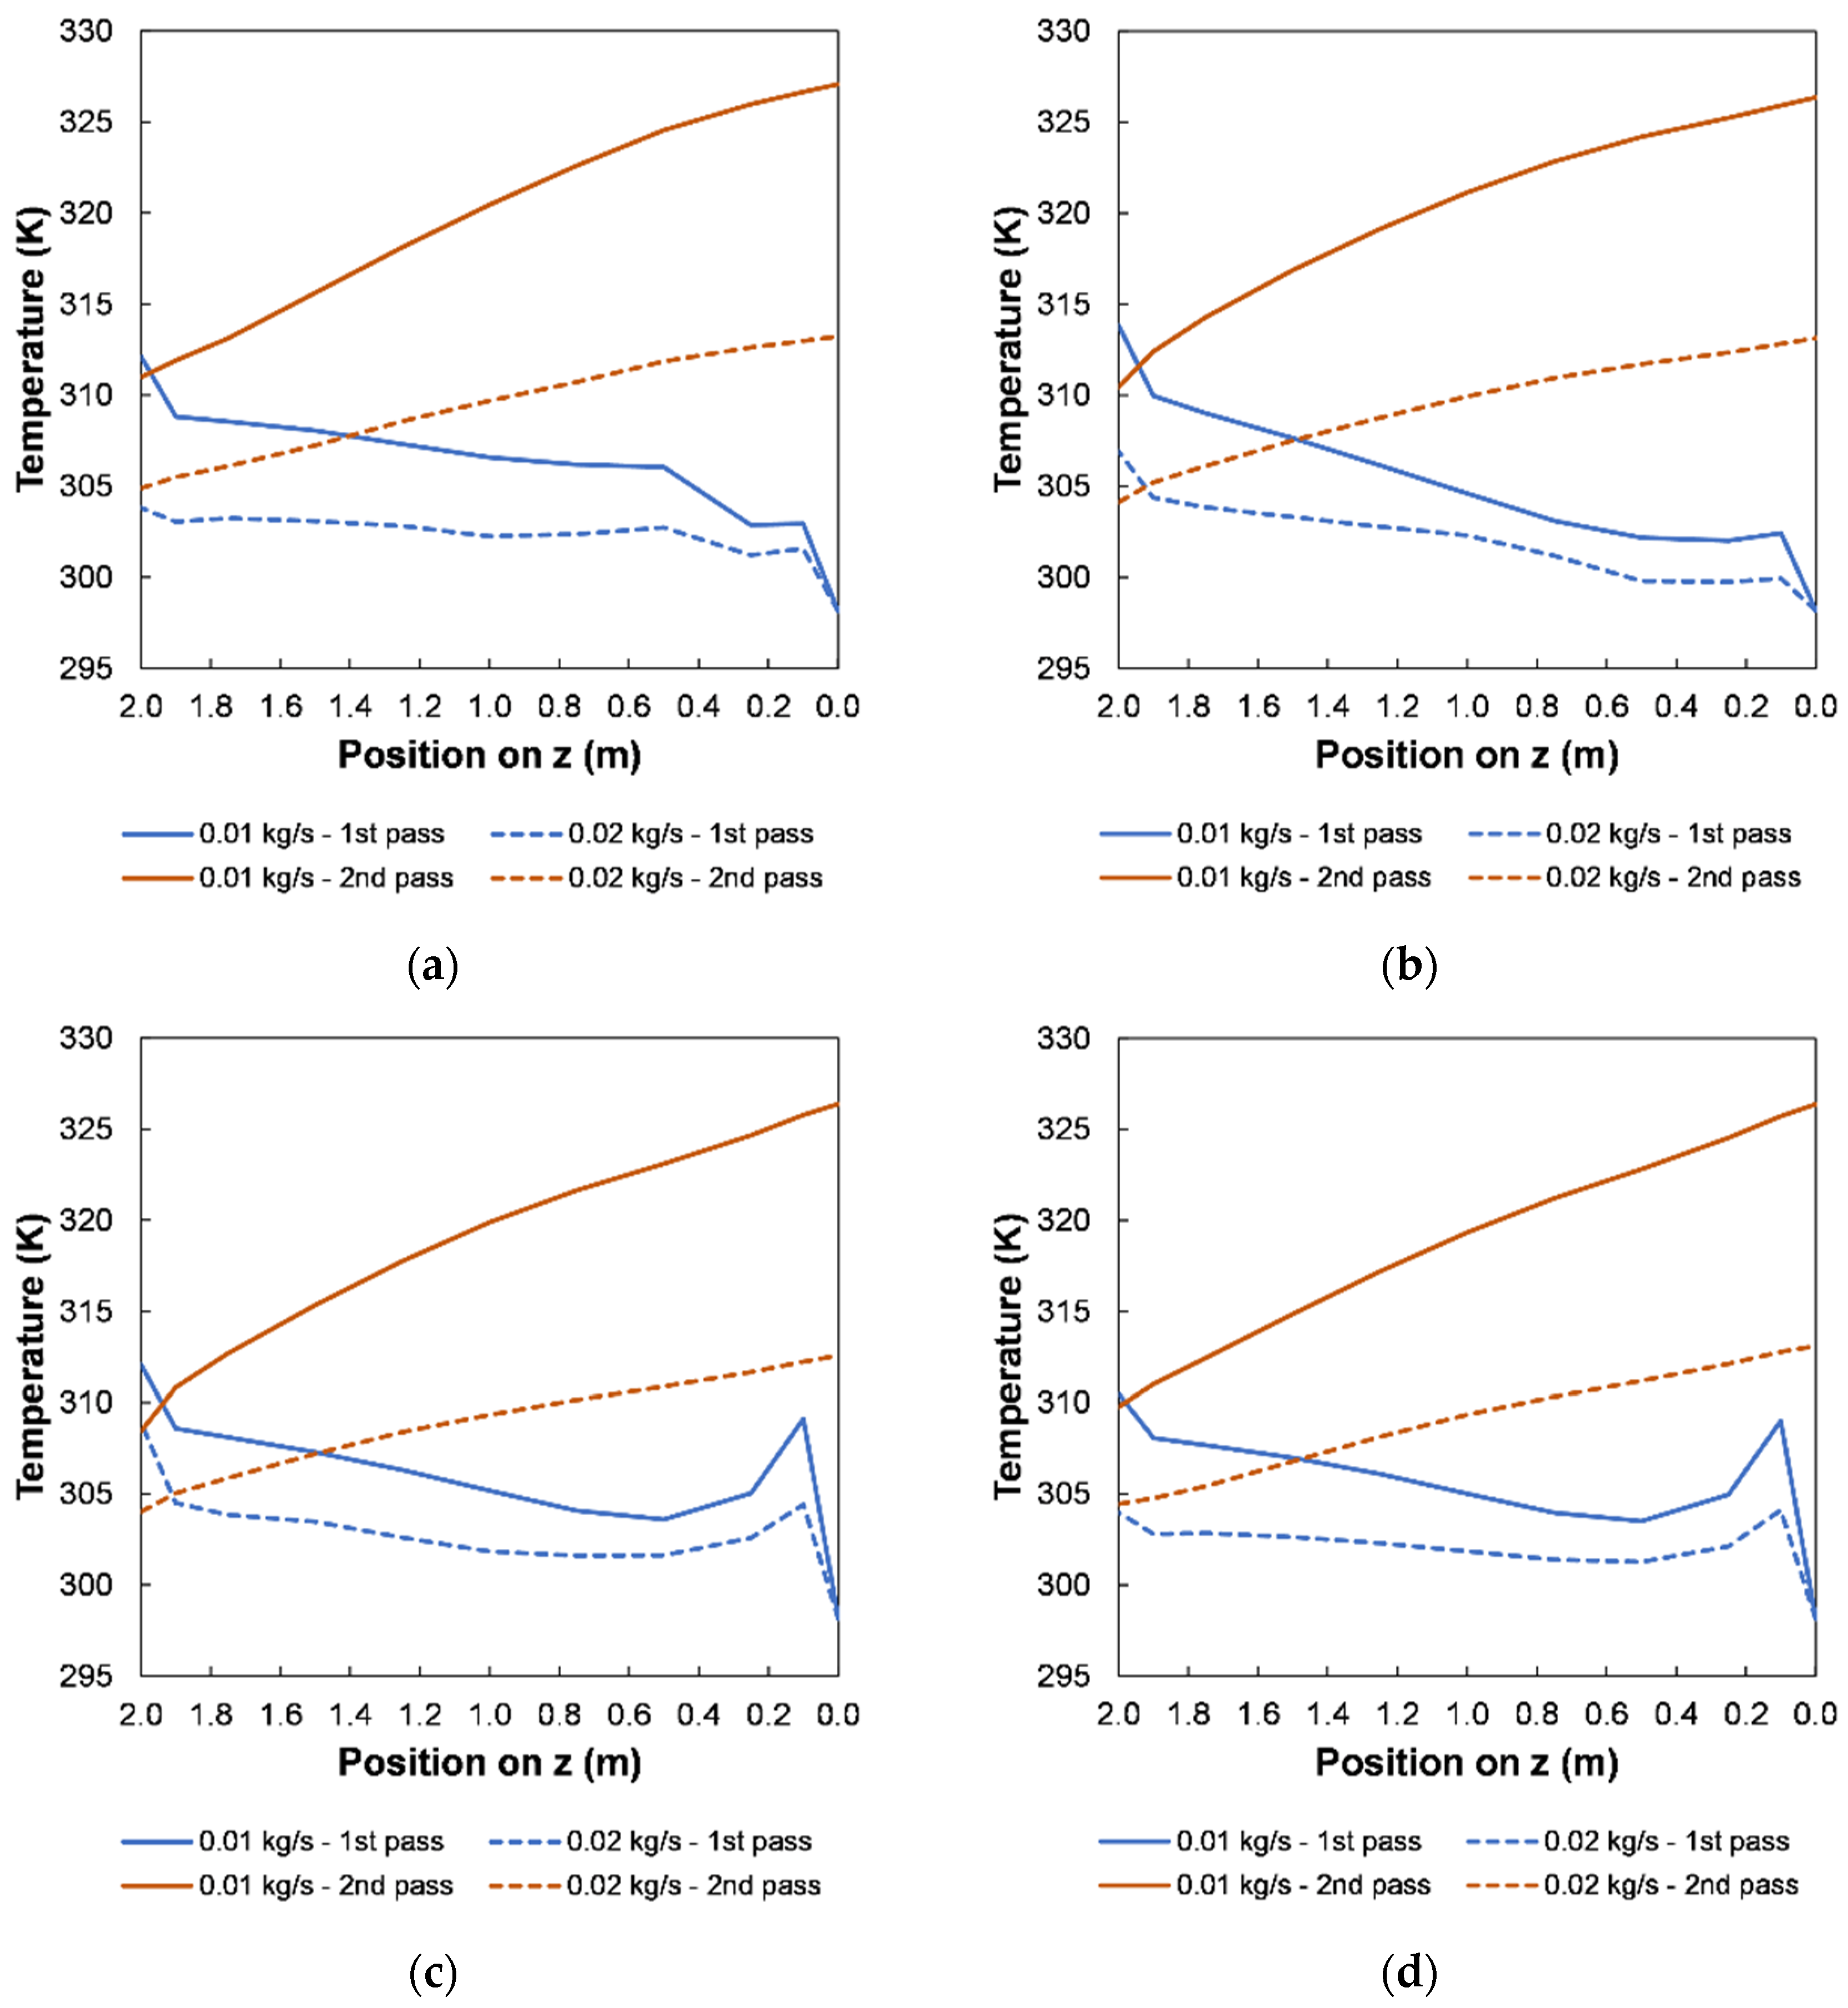
Figure 10 displays the first and second pass air temperature profiles for the four analyzed configurations. The blue line represents the air temperature profile in the first pass, and the red line is the profile of the second pass. In addition, the scale of the horizontal axis of the graphs (z-position) is inverted to facilitate the interpretation of the results since it allows visualizing the air outlet of the collector on the far right.
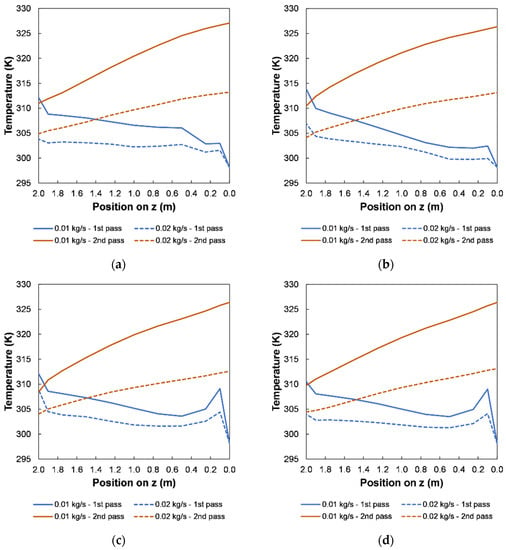
Figure 10.
Air temperature profiles. (a) Down–Down; (b) Down–Up; (c) Up–Up; (d) Up–Down.
In the first pass for the configurations with the inlet from the bottom, (a) Down–Down and (b) Down–Up, the temperature profile has a slight increase near the entrance (z = 0.1 m), then it continues to increase until near the end of the cavity (z = 1.9 m) where it has another sharp increase. In the configurations that have an entrance to the cavity from the top, (c) Up–Up and (d) Up–Down, it is observed that in the first pass, there is a sudden increase in temperature in the section close to the entrance of the cavity (z = 0.1 m). In addition, all the temperature profiles are smooth for both flow rates; nevertheless, the temperature profiles have a less pronounced slope for configurations (a), (c), and (d).
Furthermore, in the second pass of all configurations, the temperature profile is smooth, with a sustained increase in temperature, reaching similar outlet temperatures of 327 K for flow 1 and 313 K for flow 2.
In the second pass for all the studied configurations, the temperature profile steadily increases from z = 2.0 m to z = 0.0 m, where it is observed that the temperature profiles are smooth for both flow rates. The differences in the behavior among the configurations in the second pass are only slight differences in the temperatures at the inlet and outlet, where the lowest inlet temperature is found in configuration (c) Up–Up, and the highest in (a) Down–Down.
On the other hand, the configurations that have an outlet from above, (b) Down–Up and (c) Up–Up, present a higher temperature at the outlet end of the cavity (end of the first pass) than at the entrance to the duct (beginning of the second pass). The phenomenon is caused by stratification in the cavity, so the air enters the connecting elbow at a temperature lower than that shown in Figure 10 (See Table 6). This occurs with both flows but is more significant with 0.01 kg/s due to the greater air stagnation in the cavity.

Table 6.
Air temperatures in the elbow inlet and outlet of the U-shape double-pass CPC.
Table 6 shows the elbow inlet and outlet temperatures for both air flow rates. The presented elbow inlet temperature refers to the average temperature at the outlet of the cavity (z = 2.0 m) in positions y = 0.1255 m to y = 0.1645 m, where the height of the elbow is 0.036 m. As expected, the temperatures corresponding to flow 1 (0.01 kg/s) are higher than flow 2 (0.02 kg/s). Therefore, all the air temperatures at the elbow inlet are lower than the air temperatures at the outlet of the cavity z = 2.0 m. On the other hand, the elbow outlet air temperatures and the duct inlet air temperatures are the same.
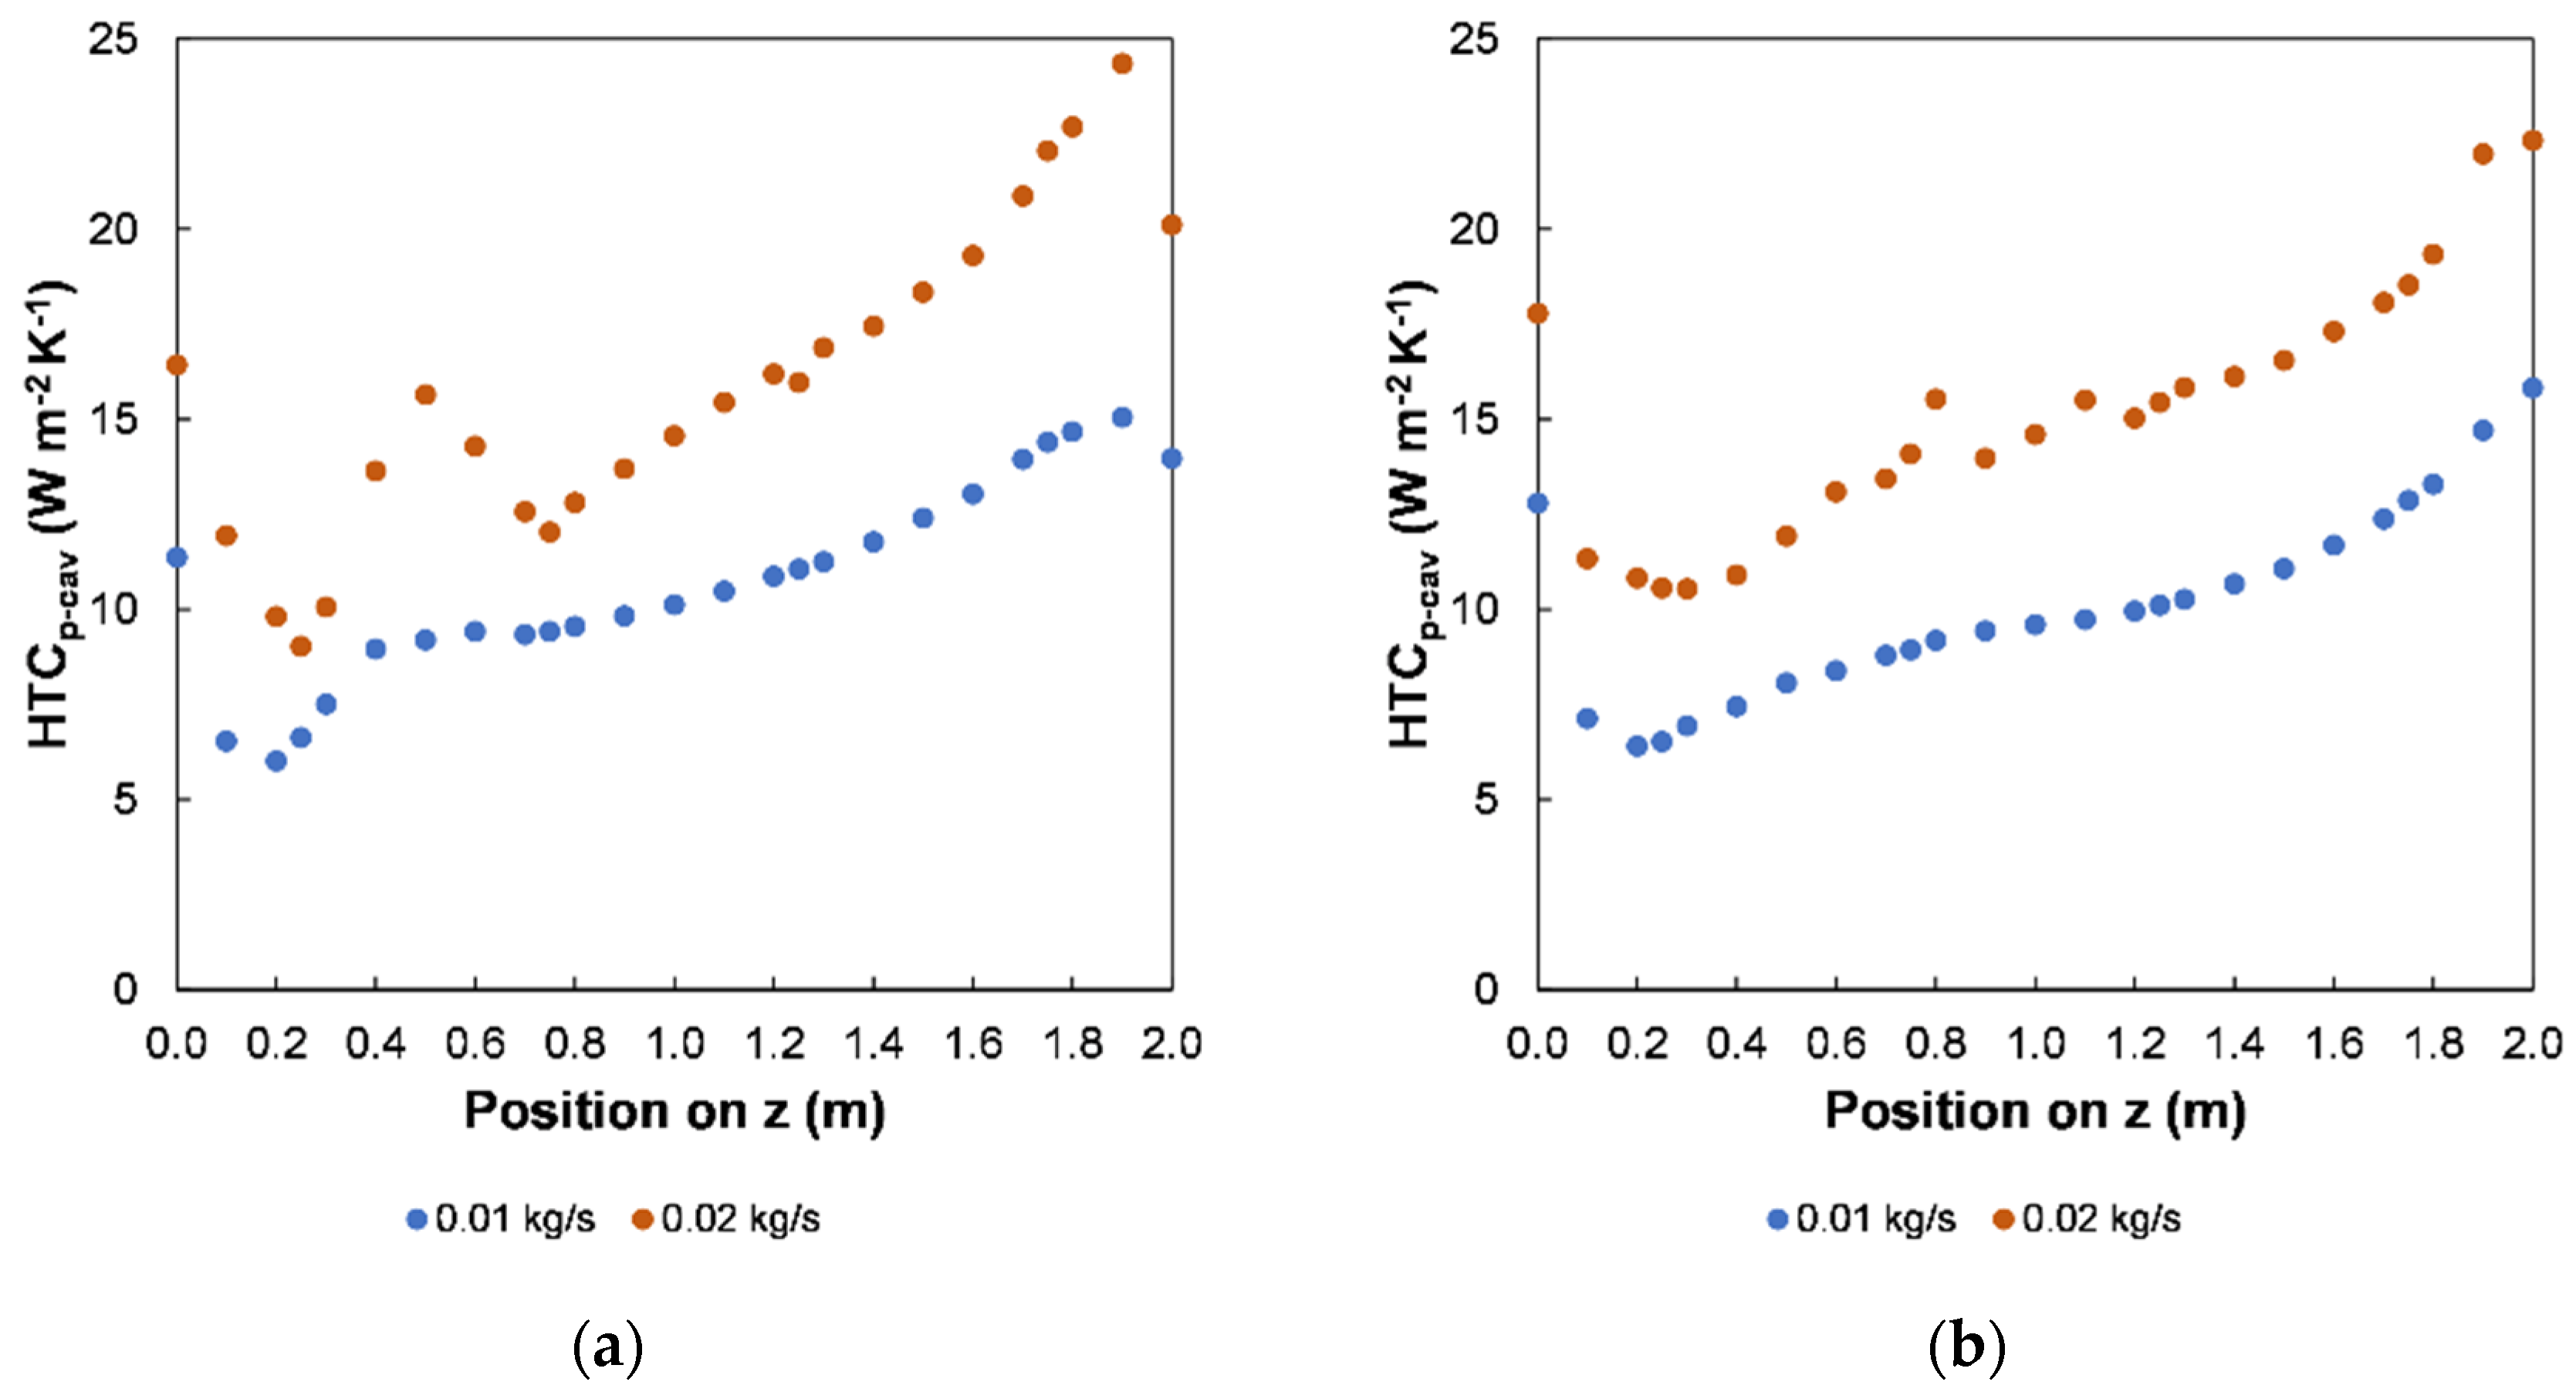
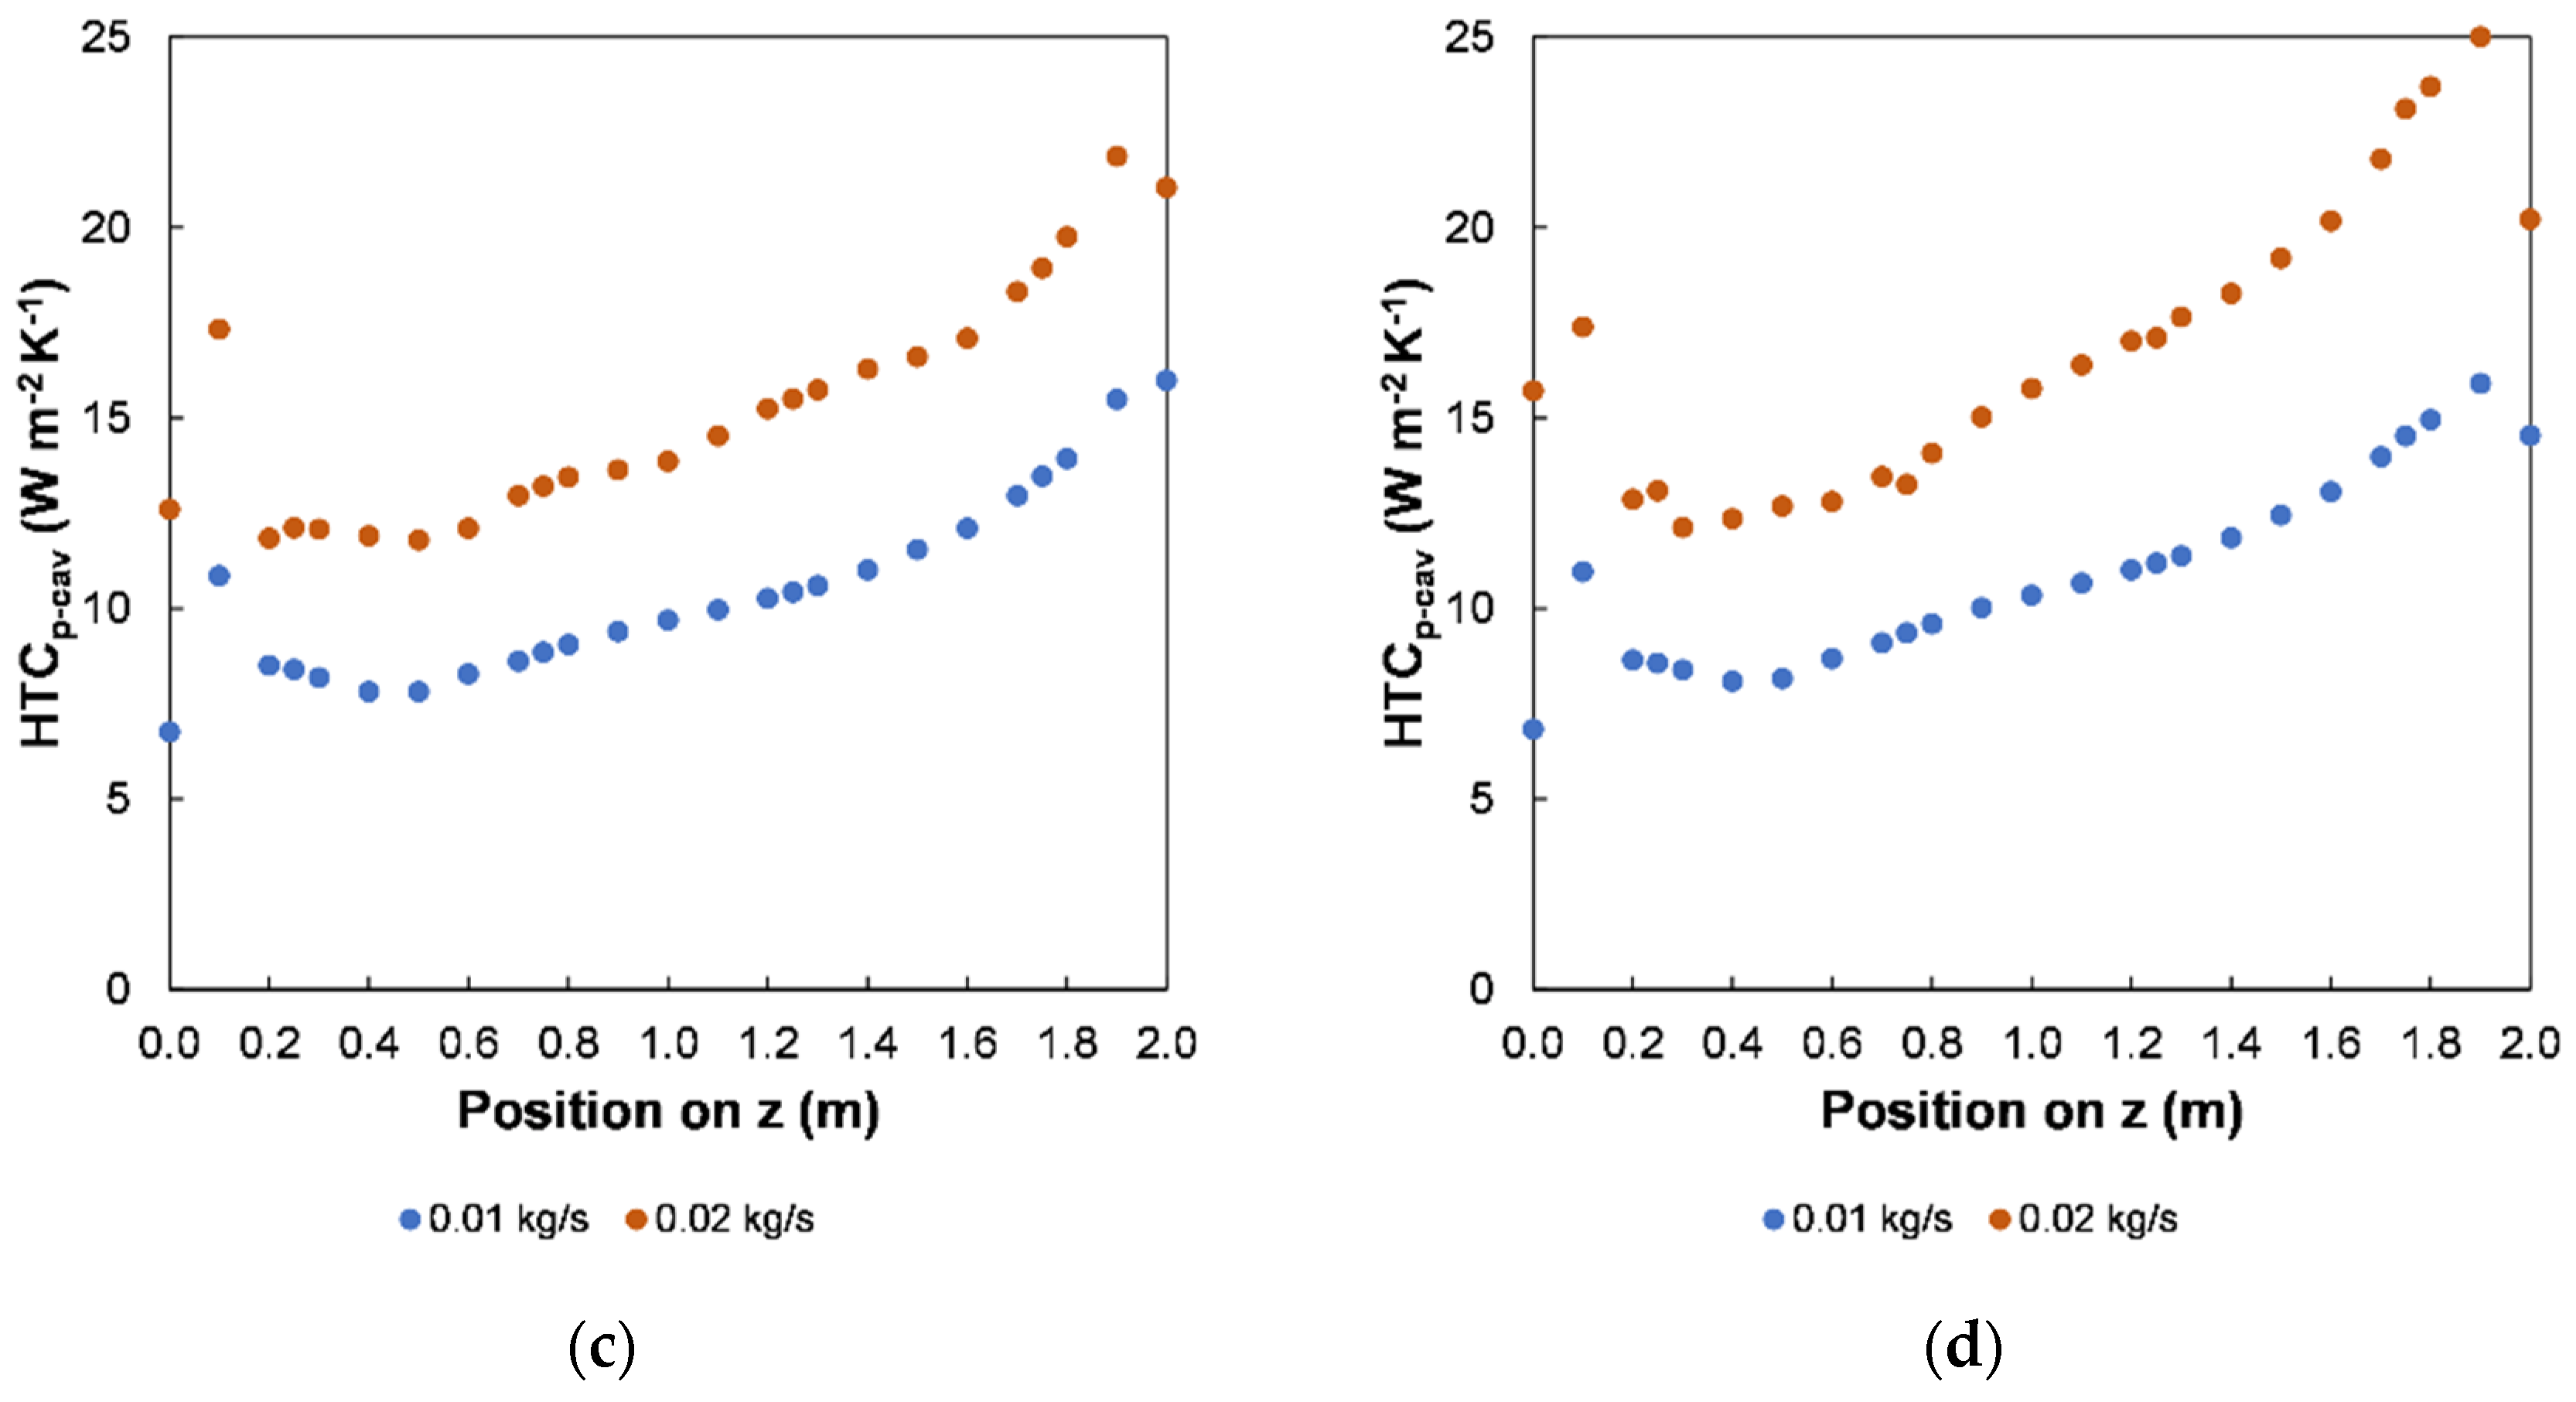
Figure 11 shows the heat transfer coefficients (HTCp-cav) in the cavity for both air flow rates. As expected, the coefficients are lower when the airflow is lower and higher when the air flow rate is higher. Configurations with an inlet from below ((a) and (b)) have a high coefficient at the entry, which decreases to subsequently increase until it reaches a maximum near the outlet for configuration (a) and at the outlet (z = 2.0 m) for configuration (b). It is also noted that configuration (a) has a sharp increase and then a decrease from z = 0.2 m to z = 0.8 m, which is caused by the rise of the jet until it reaches the cover (see Figure 4a and Figure 5a). In contrast, configurations with an inlet from the top (c and d) have an increase in the HTCp-cav in the region near the entry; then, it sharply declines to later gradually increase towards the region near the outlet where it reaches its maximum value. For example, the maximum HTCp-cav values with flow 1 are 15.0 W/(m2 K), 15.8 W/(m2 K), 16.0 W/(m2 K), and 15.9 W/(m2 K), while for flow 2 of 24.4 W/(m2 K), 22.3 W/(m2 K), 21.9 W/(m2 K), and 25.0 W/(m2 K), for configurations (a), (b), (c) and (d).
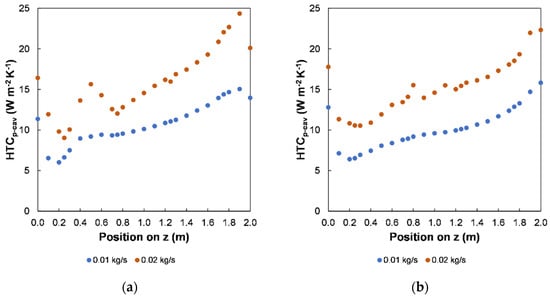
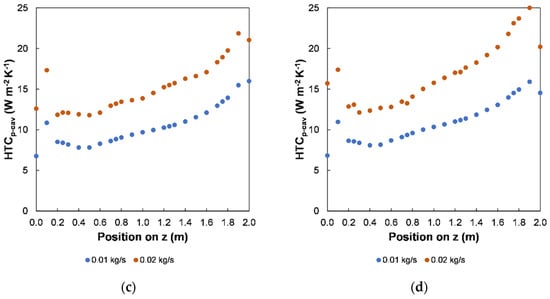
Figure 11.
Flat-plate receiver heat transfer coefficients (HTCp-cav). (a) Down–Down; (b) Down–Up; (c) Up–Up; (d) Up–Down.
In configurations where the air enters from the top ((c) and (d)), there is a high HTCp-cav at z = 0.1 m; nevertheless, all configurations have the maximum HTCp-cav in the region near the outlet. The above observations indicate that the HTC p-cav maximums correspond to the presence of the eddies produced by the sudden expansion at the inlet. While in the region near the outlet, there are also high HTCp-cav at z = 2.0 m in configuration (b), but in configurations (a), (c), and (d), it occurs around z = 1.8 m to z = 1.9 m. For configurations (c) and (d), this occurs because the fluid becomes turbulent in the final region of the cavity as air is forced out of the manifold elbow.
Table 7 shows the pressure drop in each configuration for the two mass flow rates. First, the highest pressure drop is seen in the bottom outlet configurations (a and d). Moreover, the pressure drop increases three to four times with the highest air flow rate.

Table 7.
Pressure drop in the system.
3.3. Efficiency
Table 8 shows the temperature increments in the first and second passes and the outlet temperature for each configuration. The temperature increase resulting from the first pass (∆Tps1) and the second pass (∆Tps2) are more significant with flow 1. Moreover, for each flow, the U-shape double-pass CPC collector outlet temperature (Tps2,out) of all the configurations is very similar, with differences between 0.7 K and less.

Table 8.
U-shape double-pass CPC temperature increments and outlet temperature (Tf1,in = 298.15 K).
Table 9 shows the contribution of the first pass (cavity) and second pass (receiver duct) to the useful energy gain inside the U-shape double-pass CPC collector and the efficiency for each configuration applying Equations (16) and (17). For instance, in configurations (a) and (b), between 40% and 45% of the total heat is extracted in the first pass with both flows. While in configurations (c) and (d), the heat recovery depends on the operating flow and is between 36% and 42% in the first pass.

Table 9.
U-shape double-pass CPC useful energy gain percentage and thermal efficiency (Tf1,in = 298.15 K).
Moreover, the efficiencies are higher with flow 2 due to the better heat transfer and lower heat losses to the ambient. In addition, it is observed that configuration (a) Down–Down is the most efficient, while configuration (c) Up–Up provides the lower efficiency of the cases analyzed at flow 2.
Configuration (a) has the highest efficiency because the air flows predominantly through the bottom section of the cavity, which is closest to the receiver plate. This surface has the highest temperature, thus is where heat recovery is desired. In addition, as the air descends, the final part of the cavity recovers heat since the fluid is forced to exit from the bottom.
4. Conclusions
This work investigates a compound parabolic concentrator (CPC) design for air heating with a double U-pass configuration. The double pass is incorporated to recover part of the heat lost by the flat plate receiver inside the CPC cavity. Overall, four configurations have been studied, and they are differentiated by the position of the air inlet into the cavity and the position of the air outlet of the cavity towards the receiving duct that constitutes the second pass of the collector.
In general, adding the first pass through the CPC cavity significantly increases the air temperature. Hence, by making the air circulate first through the CPC cavity, instead of a conventional manner where it only circulates through the duct, an increase in temperature is accomplished before entering the receiving duct. As a result, an average increase in air temperature of 11.8 K at a mass flow rate of 0.01 kg/s and 6.2 K at a mass flow rate of 0.02 kg/s was achieved. This represents a minimum temperature rise of 36% (0.01 kg/s) and 40% (0.02 kg/s) when only the first pass is used.
In addition, the analysis showed that the positions of the air inlet and outlet in the cavity do not influence the outlet temperature of the U-shape double pass CPC solar heater due to an efficiency difference of up to 3.5% being achieved. The Down–Down configuration is the one that provides slight outlet temperature and thermal efficiency increases. With this configuration, an air temperature increase from the U-shape double-pass CPC inlet to the outlet of 28.9 K and an efficiency of 77.3% are obtained when the airflow rate is 0.01 kg/s, and 15.1 K and 80.5% when the flow rate is 0.02 kg/s. This is because the air heated in the cavity is transported more effectively, as it is a more homogeneous flow and the heat transfer coefficient in the flat-plate receiver is high.
The first pass allows an extraction between 36% and 45% of the total heat, justifying its inclusion into the solar collector. Although configuration (a) Down–Down presents a slightly higher efficiency with both studied flows, the difference between the values of configurations (b), (c), and (d) seems irrelevant. Therefore, the decision of the configuration should be based on other aspects such as the manufacture of the collector, air pumping requirements, and the design of the collectors’ array, which are highly dependent on the application conditions and needs.
In the case of the (a) Down–Down configuration, including elements that restrict air circulation from the cavity to the area near the flat-plate receiver could be explored to encourage contact with the hot surface. Strategies to accomplish this are to add a second cover close to the receiver inside the cavity or to increase the truncation of the collector reflectors. Finally, the structural design and financial analysis remain as future work to determine the potential application of this technology.
Author Contributions
Conceptualization, I.A.C.-B., E.V.-R. and N.O.-A.; Data curation, I.A.C.-B.; Formal analysis, I.A.C.-B., N.A.R.-M., L.V. and N.O.-A.; Funding acquisition, N.O.-A.; Investigation, I.A.C.-B.; Methodology, I.A.C.-B. and N.A.R.-M.; Project administration, N.O.-A.; Resources, N.A.R.-M. and L.V.; Software, I.A.C.-B.; Supervision, N.A.R.-M., E.V.-R. and N.O.-A.; Validation, I.A.C.-B., L.V. and N.A.R.-M.; Visualization, I.A.C.-B., N.A.R.-M. and N.O.-A.; Writing—original draft, I.A.C.-B., N.A.R.-M. and N.O.-A.; Writing—review & editing, I.A.C.-B., N.A.R.-M., E.V.-R., L.V. and N.O.-A. All authors have read and agreed to the published version of the manuscript.
Funding
The APC was funded by the Centro de Investigacion en Materiales Avanzados (CIMAV) through project number PI-22-24/2022.
Institutional Review Board Statement
Not applicable.
Informed Consent Statement
Not applicable.
Data Availability Statement
Not applicable.
Acknowledgments
The authors wish to thank the Mexican National Science Council (CONACYT) for the financial support through scholarship 698432. To Durango Science and Technology Council (COCYTED) for the financing of the annual ANSYS software license. Also, to the Laboratorio de Computo Cientifico of FCQ-UJED and the Academic Group UJEDCA129 for the use of software and computational facilities.
Conflicts of Interest
The authors declare no conflict of interest. The funders had no role in the design of the study; in the collection, analyses, or interpretation of data; in the writing of the manuscript; or in the decision to publish the results.
Nomenclature
| <n> | Average reflections number, dimensionless |
| A | Area, m2 |
| C | Constant |
| Cp | Specific heat, J/(kg K) |
| Dh | Hydraulic diameter, m |
| E | Relaminarization source |
| F | Empirical correlation of length of the transition region, m |
| Force vector, N | |
| Gravitational acceleration, m/s2 | |
| Gk | Generation of turbulence kinetic energy due to mean velocity gradients, J/kg |
| Gw | Generation of specific dissipation rate, 1/s |
| h | Height, m |
| h′ | Species enthalpy, J/kg |
| I | Solar irradiance, W/m2 |
| J | Mass flux, kg/m2 |
| k | Turbulent kinetic energy, J |
| L | Length, m |
| ṁ | Mass flow rate, kg/s |
| Nu | Nusselt number, dimensionless |
| P | Pressure, Pa |
| Pg | Gap loss factor, dimensionless |
| q | Heat generation, W/m3 |
| Qu | Useful heat gain, W |
| Re | Reynolds number, dimensionless |
| S | Strain rate magnitude |
| t | Time, s |
| T | Temperature, K |
| Velocity magnitude, m/s | |
| U | Local velocity, m/s |
| uT | Friction velocity, m/s |
| V | Free-stream speed, m/s |
| v | Wind velocity above cover, m/s |
| w | Width, m |
| x | Velocity field coordinate |
| y | Wall-normal distance, m |
| Y | Destruction term of SST turbulence model, m2/s3 |
| y+ | Dimensionless distance in wall coordinates |
| Greek letters | |
| α | Absorptance, dimensionless |
| γ | Intermittency |
| Γ | Effective diffusivity, dimensionless |
| ε | Emittance, dimensionless |
| η | Thermal efficiency, dimensionless |
| μ | Molecular viscosity of air, kg/(m s) |
| ρ | Air density, kg/m3 |
| ρ | Reflectance, dimensionless |
| τ | Transmittance, dimensionless |
| Stress tensor, Pa | |
| υ | Eddy viscosity, m2/s |
| Ω | Vorticity magnitude, 1/s |
| Subscripts | |
| a | Ambient |
| a1, a2 | Turbulence damping constants |
| ap | Aperture |
| avg | Average |
| b | Bottom duct |
| c | Cover |
| cav | Cavity |
| collector | Collector |
| duct | Duct |
| elb | Elbow |
| e1, e2 | Dissipation |
| h | Hydrodynamic |
| i, j | Orthogonal coordinate |
| in | Inlet |
| k | Turbulence kinetic energy |
| length | Length |
| out | Outlet |
| p | Flat plate receiver |
| ps1 | Pass 1 (Through the cavity) |
| ps2 | Pass 2 (Through the duct) |
| r | Reflectors |
| s | Sky |
| turb | Turbulent |
| γ1, γ2 | Intermittence |
| Acronyms | |
| CFD | Computational fluid dynamics |
| CPC | Compound parabolic concentrator |
| EPS | Expanded polystyrene |
| ETFE | Ethylene tetrafluoroethylene (fluorine-based plastic) |
| HTC | Heat transfer coefficient, W/(m2 K) |
| PV/T | Photovoltaic/Thermal |
References
- Weiss, W.; Spörk-Dür, M. Solar Heat World 2022. Global Market Development and Trends 2021. Detailed Market Figures 2020. 2022. Available online: https://www.iea-shc.org/Data/Sites/1/publications/Solar-Heat-Worldwide-2022.pdf (accessed on 21 September 2022).
- Bhusal, Y.; Hassanzadeh, A.; Jiang, L.; Winston, R. Technical and Economic Analysis of a Novel Low-Cost Concentrated Medium-Temperature Solar Collector. Renew. Energy 2020, 146, 968–985. [Google Scholar] [CrossRef]
- Buttinger, F.; Beikircher, T.; Pröll, M.; Schölkopf, W. Development of a New Flat Stationary Evacuated CPC-Collector for Process Heat Applications. Sol. Energy 2010, 84, 1166–1174. [Google Scholar] [CrossRef]
- Horta, P.; Henriques, J.C.C.; Collares-Pereira, M. Impact of Different Internal Convection Control Strategies in a Non-Evacuated CPC Collector Performance. Sol. Energy 2012, 86, 1232–1244. [Google Scholar] [CrossRef]
- Zheng, W.; Yang, L.; Zhang, H.; You, S.; Zhu, C. Numerical and Experimental Investigation on a New Type of Compound Parabolic Concentrator Solar Collector. Energy Convers. Manag. 2016, 129, 11–22. [Google Scholar] [CrossRef]
- Nkwetta, D.N.; Smyth, M. Performance Analysis and Comparison of Concentrated Evacuated Tube Heat Pipe Solar Collectors. Appl. Energy 2012, 98, 22–32. [Google Scholar] [CrossRef]
- Alam, T.; Kim, M.-H. A Critical Review on Artificial Roughness Provided in Rectangular Solar Air Heater Duct. Renew. Sustain. Energy Rev. 2017, 69, 387–400. [Google Scholar] [CrossRef]
- Othman, M.Y.; Yatim, B.; Sopian, K.; Abu Bakar, M.N. Performance Analysis of a Double-Pass Photovoltaic/Thermal (PV/T) Solar Collector with CPC and Fins. Renew. Energy 2005, 30, 2005–2017. [Google Scholar] [CrossRef]
- Mekahlia, A.; Boumaraf, L.; Abid, C. CFD Analysis of the Thermal Losses on the Upper Part of a Flat Solar Collector. Heat Transf. 2020, 49, 2921–2942. [Google Scholar] [CrossRef]
- Pawar, V.R.; Sobhansarbandi, S. CFD Modeling of a Thermal Energy Storage Based Heat Pipe Evacuated Tube Solar Collector. J. Energy Storage 2020, 30, 101528. [Google Scholar] [CrossRef]
- Singla, M.; Hans, V.S.; Singh, S. CFD Analysis of Rib Roughened Solar Evacuated Tube Collector for Air Heating. Renew. Energy 2022, 183, 78–89. [Google Scholar] [CrossRef]
- Ammar, M.; Mokni, A.; Mhiri, H.; Bournot, P. Numerical Analysis of Solar Air Collector Provided with Rows of Rectangular Fins. Energy Rep. 2020, 6, 3412–3424. [Google Scholar] [CrossRef]
- Li, X.; Dai, Y.J.; Li, Y.; Wang, R.Z. Performance Investigation on a Novel Single-Pass Evacuated Tube with a Symmetrical Compound Parabolic Concentrator. Sol. Energy 2013, 98, 275–289. [Google Scholar] [CrossRef]
- Barrón-Díaz, J.E.; Flores-Johnson, E.A.; Chan-Colli, D.G.; Koh-Dzul, J.F.; Bassam, A.; Patiño-Lopez, L.D.; Carrillo, J.G. FEM-CFD Simulation and Experimental Study of Compound Parabolic Concentrator (CPC) Solar Collectors with and without Fins for Residential Applications. Appl. Sci. 2021, 11, 3704. [Google Scholar] [CrossRef]
- Yuan, G.; Fan, J.; Kong, W.; Furbo, S.; Perers, B.; Sallaberry, F. Experimental and Computational Fluid Dynamics Investigations of Tracking CPC Solar Collectors. Sol. Energy 2020, 199, 26–38. [Google Scholar] [CrossRef]
- Antonelli, M.; Francesconi, M.; Di Marco, P.; Desideri, U. Analysis of Heat Transfer in Different CPC Solar Collectors: A CFD Approach. Appl. Therm. Eng. 2016, 101, 479–489. [Google Scholar] [CrossRef]
- Francesconi, M.; Antonelli, M. A CFD Analysis to Investigate Thermal Losses in a Panel Composed of Several CPC Concentrators. Therm. Sci. Eng. Prog. 2018, 5, 278–288. [Google Scholar] [CrossRef]
- Reddy, K.S.; Parthiban, A.; Mallick, T.K. Numerical Modeling of Heat Losses in a Line Focusing Solar Compound Parabolic Concentrator with Planar Absorber. Appl. Therm. Eng. 2020, 181, 115938. [Google Scholar] [CrossRef]
- Al-Damook, M.; Obaid, Z.A.H.; Al Qubeissi, M.; Dixon-Hardy, D.; Cottom, J.; Heggs, P.J. CFD Modeling and Performance Evaluation of Multipass Solar Air Heaters. Numer. Heat Transf. Part A Appl. 2019, 76, 438–464. [Google Scholar] [CrossRef]
- Tuncer, A.D.; Sözen, A.; Khanlari, A.; Amini, A.; Şirin, C. Thermal Performance Analysis of a Quadruple-Pass Solar Air Collector Assisted Pilot-Scale Greenhouse Dryer. Sol. Energy 2020, 203, 304–316. [Google Scholar] [CrossRef]
- Mutabilwa, P.X.; Nwaigwe, K.N. Experimental Evaluation of Drying of Banana Using a Double-Pass Solar Collector (DPSC) and Theoretical Analysis Using a CFD Model. Cogent Eng. 2020, 7, 1789363. [Google Scholar] [CrossRef]
- Desisa, D.G.; Shekata, G.D. Performance Analysis of Flat-Plate and V-Groove Solar Air Collector through CFD Simulation. Int. J. Renew. Energy Dev. 2020, 9, 369–381. [Google Scholar] [CrossRef]
- Singh, S. Thermohydraulic Performance of Double Pass Solar Thermal Collector with Inline, Staggered and Hybrid Fin Configurations. J. Energy Storage 2020, 27, 101080. [Google Scholar] [CrossRef]
- Kumar, A.; Singh, A.P.; Akshayveer; Singh, O.P. Performance Characteristics of a New Curved Double-Pass Counter Flow Solar Air Heater. Energy 2022, 239, 121886. [Google Scholar] [CrossRef]
- Cengel, Y.A.; Ghajar, A.J. Heat and Mass Transfer: Fundamentals and Applications, 5th ed.; McGraw Hill: New York, NY, USA, 2014; ISBN 978-0073398181. [Google Scholar]
- ANSYS Fluent User’s Guide; 2020R1; ANSYS: Canonsburg, PA, USA, 2020.
- Langtry, R.B.; Menter, F.R. Correlation-Based Transition Modeling for Unstructured Parallelized Computational Fluid Dynamics Codes. AIAA J. 2009, 47, 2894–2906. [Google Scholar] [CrossRef]
- Menter, F.R.; Langtry, R.B.; Likki, S.R.; Suzen, Y.B.; Huang, P.G.; Völker, S. A Correlation-Based Transition Model Using Local Variables—Part I: Model Formulation. J. Turbomach. 2006, 128, 413. [Google Scholar] [CrossRef]
- Chávez-Bermúdez, I.A.; Ortega-Avila, N.; Venegas-Reyes, E. A Thermal Model for a CPC-Type Double-Pass Solar Air Heater. AIP Conf. Proc. 2022, 2445, 120007. [Google Scholar]
- Santos-González, I.; García-Valladares, O.; Ortega, N.; Gómez, V.H. Numerical Modeling and Experimental Analysis of the Thermal Performance of a Compound Parabolic Concentrator. Appl. Therm. Eng. 2017, 114, 1152–1160. [Google Scholar] [CrossRef]
- Rabl, A. Optical and Thermal Properties of Compound Parabolic Concentrators. Sol. Energy 1976, 18, 497–511. [Google Scholar] [CrossRef]
- Duffie, J.A.; Beckman, W.A. Solar Engineering of Thermal Processes; John Wiley & Sons, Inc.: Hoboken, NJ, USA, 2013; ISBN 9781118671603. [Google Scholar]
Publisher’s Note: MDPI stays neutral with regard to jurisdictional claims in published maps and institutional affiliations. |
© 2022 by the authors. Licensee MDPI, Basel, Switzerland. This article is an open access article distributed under the terms and conditions of the Creative Commons Attribution (CC BY) license (https://creativecommons.org/licenses/by/4.0/).

