Abstract
Ants are known as nature’s master builders, constructing a wide range of nests, from simple nests with a single channel linking several chambers to ‘underground palaces’ that are several metres wide. However, there is a lack of understanding of the mechanical performance of underground ant nest structures. In this paper, two underground ant nest structures are obtained and digitally modelled by means of liquid paraffin wax infusion shaping, manual excavation and industrial CT scanning, and a finite element model of the underground ant nest structure is established by means of numerical simulation. By simulating people of different weights standing above the nests, the stress distribution characteristics of each chamber in the nests under different pressures are obtained, and the mechanical properties of the underground ant nest structures under static loads are investigated.
1. Introduction
Ants are insects belonging to Insecta, Hymenoptera, Formicidae. They are the dominant group of insects and the most widely distributed and numerous social insects on earth [1]. They are extremely adaptable to the environment and can be found in all corners of the world, whether in arid deserts, wet river beaches, high-temperature tropical regions or cold arctic regions. As excellent architects of nature, they can build all kinds of nests, including above-ground ant nests, underground ant nests, tree ant nests and above-ground and underground compound ant nests, for the purposes of living, breeding and storing food. After hundreds of millions of years of selection by nature, each ant nest structure has the most reasonable structural form, providing the most comfortable living environment for the ants [2]. Among them, the underground ant nest is a nest dug out by the ants in the soil that usually has two basic units: a nest chamber and a channel. The distribution of underground nests is very extensive, and such nests can be seen in woods, field paths, along roads and even in deserts. Depending on the number of individuals in the ant colony and the degree of growth of the ant nest, the size of the underground ant nest is also different. Small nests have only a few chambers and a channel leading to the ground, whereas large ant nests can extend several meters underground, and thousands of chambers are connected to each other to form an ant kingdom. Natural underground ant nests generally have good air circulation, suitable temperature and relative humidity, and they are surrounded by trees and natural barriers. At the same time, they also have good physical structures, compression resistance, water resistance, heat preservation and moisture resistance [3]. For underground nests built on embankments, the chambers and channels are usually reinforced with ’mud-retaining walls’. The mud-retaining walls are made by mixing the saliva of ants with the soil. After drying, they have higher strength and stability than ordinary soil, which can ensure that the ant nest channel and the soil inside the nest chamber do not collapse [4].
At present, there are only a handful of people who study the structure of underground ant nests in China. Most of the reports on underground ant nests are from foreign researchers on the structure of underground ant colonies, mostly on the form of the ant nest structure [5,6] and mainly in terms of the site selection of the ant nest, the size of the nest, the depth of the nest, the number of chambers, the interaction between the chambers and the number of entrances. By excavating and casting underground ant nests with liquid metal, paraffin wax, etc., measuring the size of the casting model, counting the number of chambers and describing the distribution and respective functions of various chambers, the channels and detailed structures in the ant nest. Jesovnik et al. studied Mycetagroicus inflatus and their nests and found that the nest generally consists of only three chambers; each spherical chamber is connected by a vertical downward channel, and there is no connection between chambers [7]. Kushwaha et al. found that computerized tomography and finite element models can be used to study complex anthill structures, and the results showed a high degree of consistency [8].
Researchers have also found that the nest structure is not exactly the same for the same type of nest and that the size and depth of nests, the diameter of the channels and the number of entrances can change depending on the existence time of the ant nest, the local climatic environment and soil conditions [9], with the number of nest chambers becoming larger and more numerous as the colony grows and the diameter of the channels often related to the size of the ants. However, little consideration has been given to the mechanical analysis of these underground exquisite ant nest structures. The rapid growth of the construction industry is now leading to the depletion of primary natural resources [10], and more and more people are turning to the study of underground structures. It is therefore extremely important to study the mechanical properties of underground ant nest structures. In 2018, Qu et al. [11] obtained two-dimensional and three-dimensional models of the underground ant nest structure of Iridomyrmex anceps by a combination of manual cutting and frozen CNC milling. Static and dynamic analyses were performed on the models using the finite element analysis software ABAQUS. However, frozen CNC milling requires transporting large volumes of soil blocks, making lateral cuts at 1 mm intervals, taking photographs after cutting with the nest entrance as the centre and synthesising the 3D structure of the nest by computer. In comparison with industrial CT scanning, which directly obtains accurate 3D structure models without destroying the nest structure, frozen CNC milling has a large margin of error, complex operation and large preliminary workload, and it is only suitable for small ant nests. In addition, the underground nest structures of ants are diverse in form and size, with complex nests often having channels several metres long and wide, a large number of chambers and different nest shapes for different nests, which may lead to differences in the nests’ mechanical properties. The nest structure obtained by Qu et al. was Iridomyrmex anceps, a relatively common ant species in Shanghai, China, whose nests are relatively simple, small in size and less applicable.
Therefore, this paper further investigates and compares the static performance of two larger underground ant nests of Camponotus japonicus Mayr and Messor aciculatus from a structural point of view using industrial CT scanning methods. The main research contents are as follows.
1. The acquisition and digitisation of structural models of underground ant nests are developed. Based on the summary of previous methods to obtain the structure of subterranean ant colony nests, a three-dimensional digital model of the underground ant nest structure is obtained using Camponotus japonicus Mayr and Messor aciculatus, which are common in China, as examples, through paraffin wax infusion, manual excavation and industrial CT scanning.
2. A static analysis of the underground ant nest structure is performed. Based on the digitisation of the underground ant nest structure, a finite element model of the underground ant nest structure is established, and the stress distribution characteristics of each chamber in the nest under different pressures are obtained by simulating a person of different weight standing above the nest.
2. Materials and Methods
2.1. Selection of Underground Ant Nests
In this paper, Camponotus Japonicus Mayr and Messor aciculatus subterranean colony nest structures are selected for the study. Camponotus japonicus Mayr, 1866 is a formicine ant species found throughout East Asia [12]. The main food items of Camponotus japonicus Mayr include Aphidoidea, Niphanda fusca Bremer and Grey larvae, and it has a strong ability to capture juvenile Dendrolimus punctatus Walker. Most Camponotus japonicus Mayr nest underground, often in sparse woodland, field paths or vegetated land, with nests 0.36–1.40 m deep and chambers like inverted funnels, with a cross-sectional area of 606–2117 mm2; each nest has 2–5 nest entrances, which can be rectangular, round and oval in shape, surrounded by a fan-shaped mound of soil grains around them; the channel runs vertically downwards and is connected to the various layers of nest chambers. Messor aciculatus is a species of the harvester ant, mainly found in the Yellow River basin of China and in Japan, whose main food items are seeds of Setaria viridis (L.) Beauv. and Cyperaceae [13,14]. The main structure of the Messor aciculatus nest is made up of a single main channel and a number of chambers of varying shapes, which are connected to each other by intricate horizontal or inclined channels. Most of the nest chambers are flattened and divided into many layers from top to bottom. With the increase in depth, the spacing between the layers gradually increases, and the height of the nest of each layer also increases. The surface of the ant nest wall is smooth and hard; the nest entrance is round, with a diameter of 1–5 cm, and is accompanied by nesting soil particles and weeds to ensure the concealment of the nest entrance.
2.2. Collection of Underground Ant Nests
Because the underground ant nest is below the ground, it is difficult to directly observe and predict the distribution of the ant nest in the soil, and it is difficult to obtain a real and complete underground ant nest model. In this paper, the ant nest model was obtained by a comprehensive method of No. 58 fully refined industrial paraffin wax infusion stereotypes, manual excavation and industrial CT scanning. Compared with pouring with gypsum slurry, pouring with paraffin wax is simpler and requires a shorter waiting time for solidification. However, after the paraffin wax is solidified, due to its high brittleness, it is easy to cause the ant channel to break in the later excavation, and it needs to be spliced in the later stage.
After understanding the distribution characteristics of Camponotus japonicus Mayr and Messor aciculatus, a small park in Xinxiang, Henan Province was selected to collect underground ant nests. There are trees, small lawns and some low shrubs, which provide abundant food for the Camponotus japonicus Mayr. Messor aciculatus also finds abundant grass seeds here. Due to the limitations of the experimental conditions, only two nests were taken in this study. The specific process is divided into the following four steps: (1). Position the nest entrance. According to the habit of ants, search for places in which there may be ants. After finding the ants, follow the ant’s trajectory to find the entrance of the ant nest. (2). Pour in liquid paraffin wax. Use a syringe to inject the heated and melted paraffin wax from the entrance of the ant nest into the inside of the ant nest and inject liquid paraffin wax rapidly and continuously until the entrance of the nest overflows. (3). Manual excavation. After pouring, wait 20 min to ensure that the paraffin wax in the nest is completely solidified, and then start digging. First, take the ant nest entrance as the centre, dig a circle with a depth of more than 50 cm at a radius of about 70 cm, and then use a small shovel to carefully peel off the soil in the direction of the ant nest entrance to expose the paraffin wax. Because the channel of the ant nest is very thin, the diameter of the paraffin-cast ant nest model at the channel is very small, usually only about 1 cm, and paraffin wax is a brittle material, so the ant nest model broke during the excavation process, and the excavated model is divided into several blocks, as shown in Figure 1a. (4). Model cleaning and recording. Soak the excavated ant nest model blocks in water, and after the soil outside is loosened, wash off the soil to obtain paraffin model blocks. In order to obtain a complete ant nest model, we numbered the broken model blocks according to the original connection sequence of the ant nest, as shown in Figure 1b, which is convenient for subsequent assembling work.
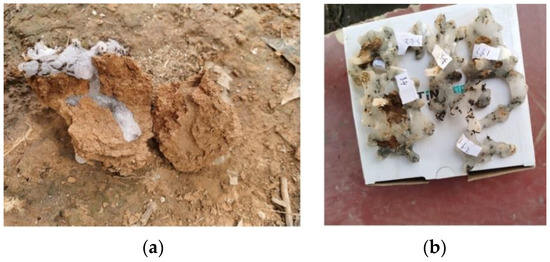
Figure 1.
(a) Soil blocks containing ant nests; (b) numbering of model blocks of ant nests.
2.3. 3D Modelling of Underground Ant Nests
In order to obtain a more accurate digital model of the nest structure, this paper used Industrial Computerized Tomography to scan a paraffin-cast nest model, because industrial CT is nowadays an important application for 3D digital scanning [15]. Industrial CT is a radiographic detection technology, the basic principle of which is to obtain a two-dimensional tomographic image of the subject through the attenuation law of the radioactive rays passing through the subject. After scanning multiple sections repeatedly to obtain enough tomographic images, a three-dimensional image can be reconstructed according to a certain algorithm. This scan uses the high-resolution YXLON FF35 CT equipment developed by YXLON, as shown in Figure 2. In the laboratory, the high-resolution industrial computed tomography system YXLON FF 35 CT was used for larger soil samples [16].
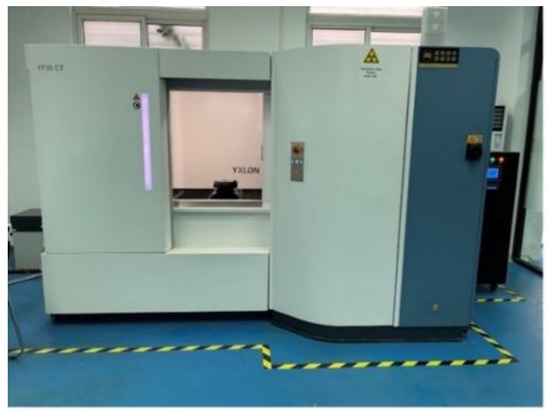
Figure 2.
YXLON FF35 CT.
The YXLON FF35 CT is a high-precision scanning device with micron-level accuracy [17]. The scanning resolution of the underground ant nest structure was set to 60 μm, which saves the scanning time while ensuring the resolution. The paraffin model of the ant nest was scanned by CT to obtain the STL file of each ant nest block, as shown in Figure 3a, and the complete model of the ant nest after splicing is shown in Figure 3b,c. STL is a file format that describes the shape of a collection of surfaces of three-dimensional objects. The surfaces of the objects are displayed as unstructured triangular mesh and can only be used to represent closed two-dimensional or three-dimensional shapes.

Figure 3.
STL model of (a) an ant nest block, (b) Camponotus japonicus Mayr nest after assembling and (c) Messor aciculatus nest after assembling.
After high-precision CT scanning, some irregular shapes on the paraffin ant nest surface caused by grass roots, soil particles, small stones and other debris were truly reflected, as shown in Figure 3a. Such a structure is difficult to use for finite element simulation, and the STL file must be idealised to remove impurities on the surface, so that the structure of the ant nest model will not change much compared with the paraffin model, and it can be used for finite element simulation. Firstly, the STL file of CT scan was imported into Rhino software, and the individual ant channels that were broken due to excavation were stitched together through Boolean operations to form a complete ant nest structure, then imported to the reverse engineering software Geomagic Studio to simplify and repair the model. Using Geomagic Studio to first remove the nails on the surface of the model, we repaired some defects such as bulges, sharp corners, holes, etc. by manual removal or sewing to obtain a smooth ant nest mesh model. Finally, the idealised ant nest structure as obtained by inverse modelling with Geomagic Studio, fitting the smooth ant nest structure to the surface, as shown in Figure 4, and saving it in STP format for easy import into the finite element software ABAQUS.
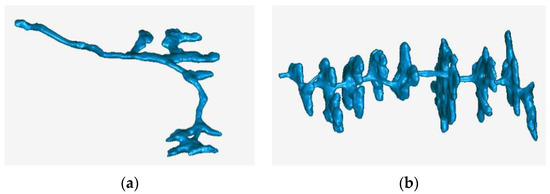
Figure 4.
STL model of nest after idealized treatment: (a) Camponotus japonicus Mayr; (b) Messor aciculatus.
2.4. Numerical Simulation of Underground Ant Nests
The finite element method is a numerical simulation method commonly used in the engineering field. It can solve various mechanical problems through processes such as discretization, element analysis and overall analysis and provide solutions that meet the requirements of engineering accuracy. The basic idea of the finite element method can be traced back to 1943, when Courant [18] simplified the warping function into a linear function on a series of triangular elements when solving the St. Venant torsion problem and obtained the approximate solution of the problem. In 1956, Turner et al. [19] extended the displacement method in rigid frame analysis to the plane problem of elastic mechanics when analysing aircraft structure. By discretising the continuous geometric model, the plane stress problem was successfully solved by the finite element method for the first time. This is the first successful attempt of the modern finite element method. Since then, computer technology and the finite element method have become two powerful tools for solving complex elastic mechanics problems. In 1960, Clough [20] further solved the plane elasticity problem and published a paper entitled “The Finite Element in plane stress analysis”, which first proposed the term Finite Element, which was subsequently accepted by scholars and widely used. The finite element analysis software ABAQUS has been widely used in the industry and research fields in many countries due to its excellent analytical capabilities and reliability in simulating complex systems [11].
In this paper, a 3D model of an underground ant nest was developed using ABAQUS. The 3D digital model files of the underground nests of Camponotus japonicus Mayr and Messor aciculatus in STP format were opened in Rhino software, and two nest models with dimensions of 1000 × 1000 × 400 mm (Camponotus japonicus Mayr) and 800 × 800 × 500 mm (Messor aciculatus) were created, as shown in Figure 5. The processed models were then saved as SAT files and imported into ABAQUS for analysis and calculation.
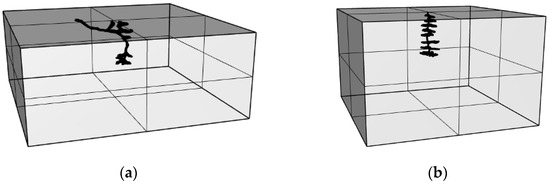
Figure 5.
(a) Camponotus japonicus Mayr nest model; (b) Messor aciculatus nest model.
After the model was imported into ABAQUS, the tetrahedral element with strong adaptability waws used for mesh division. The element type was C3D10, and the ten-node quadratic tetrahedral element used for mesh division and the mesh of the ant nest is shown in Figure 6. The soil parameters used in this simulation were identified and tested by the local geological exploration department, and the results are shown in Table 1. Ants usually build their nests in parkland or next to roads, and the maximum static load that they generally need to withstand is the pressure on the soil caused by a person standing above or near the nest. For this reason, this analysis simulates an adult standing above the nest. The load was applied by applying a uniform load in a square area of 250 × 250 mm directly above the nest, and the weight of the adult was set to 60 kg, 70 kg, 80 kg, 90 kg and 100 kg, respectively, considering different loads, corresponding to the loads shown in Table 2 below.
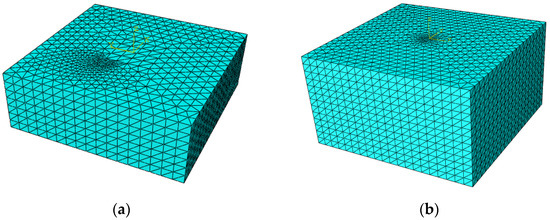
Figure 6.
Nest meshing: (a) Camponotus japonicus Mayr; (b) Messor aciculatus.

Table 1.
Parameters of the soil.

Table 2.
Static loads.
In addition, this analysis also considers the stress and deformation of the soil under the action of gravity and takes the stress state under the action of gravity as the initial stress state, and the initial stress state after applying gravity is shown in Figure 7.
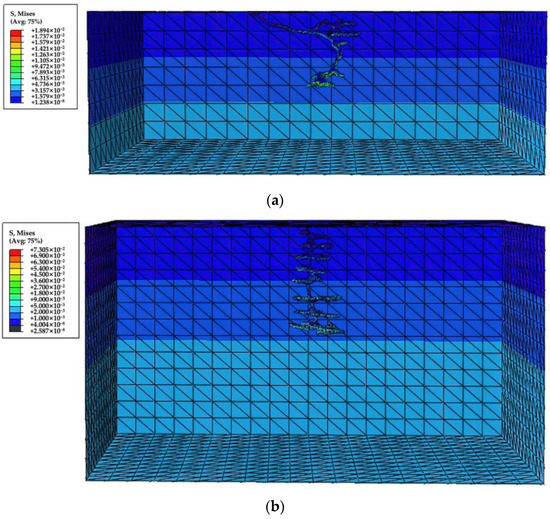
Figure 7.
The stress distribution of the nest under the action of gravity: (a) Camponotus japonicus Mayr; (b) Messor aciculatus.
3. Results
Stress Distribution Characteristics
After simulation analysis, the stress distribution in the Camponotus japonicus Mayr nest structure under weight pressure from adults of different weights is shown in Figure 8 below.
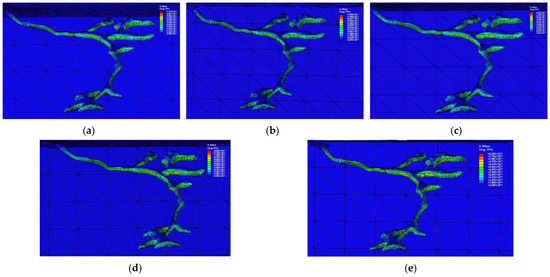
Figure 8.
Stress nephogram of Camponotus japonicus Mayr nest structure under different weights: (a) 60 kg; (b) 70 kg; (c) 80 kg; (d) 90 kg; (e) 100 kg.
The stress distribution in the underground nest structure of Messor aciculatus under weight pressure from adults of different weights is shown in Figure 9 below.
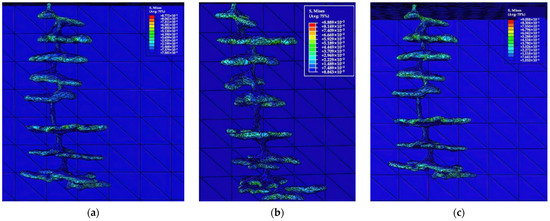
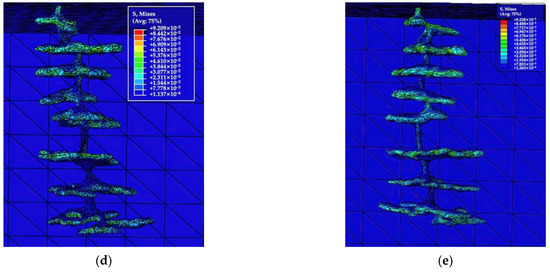
Figure 9.
Stress nephogram of Messor aciculatus nest structure under different weights: (a) 60 kg; (b) 70 kg; (c) 80 kg; (d) 90 kg; (e) 100 kg.
From the stress nephograms of the underground ant nest structure of Camponotus japonicus Mayr and Messor aciculatus under different pressures, it can be seen that the stress distribution in the ant nest has the following characteristics:
1. It can be seen from Figure 8 and Figure 9 that for the chambers, the stress distribution of each chamber can be divided into three layers: the top, the side wall and the bottom, which show obvious colour differences on the stress nephograms. The stress at the bottom is small, and the stress on the side walls is large. The stress of the side walls is about 2–3 times that of the top and bottom. It can be seen that in the ant nest structure, the side walls mainly bear the pressure from the ground, and the side walls act as load-bearing walls in human architecture.
2. It can be seen from Figure 10 that for the channel, the stress distribution in the horizontal and inclined channels is similar to that of the chambers, the stress at the top and bottom is small, the stress on the side walls on both sides is large, and the stress nephogram is strip-shaped. Meanwhile, the stress distribution in the vertical channel is different from the horizontal and inclined channels; it is not in the shape of a strip, but in a small section of the channel close to the chamber. The stress is large in some areas and small in others, and there is less stress in a section of the channel far away from the chamber.

Figure 10.
Stress distribution in channels: (a) horizontal channel; (b) vertical channel; (c) inclined channel.
3. As shown in the X-axis section of the nest structure (Figure 11), the stress in the soil within a certain area around the nest is greater than the stress in the soil near the top and bottom of the nest chamber. This is because the area of the nest chamber is relatively small. In this model, the area of the nest chamber of Camponotus japonicus Mayr does not exceed 3000 mm2, and the area of the nest chamber of Messor aciculatus is relatively large but does not exceed 9000 mm2, which is relatively small compared to the area of the nest that is normally subjected to surface pressure. Therefore, the surface pressure is shared between the nest and the soil within a certain area around the nest. As the stiffness of the nest is less than the stiffness of the surrounding soil, more pressure is allocated to the surrounding soil than the nest, so the stress at the top and bottom of the nest chamber is lower, and the stress in the soil around the nest is higher.
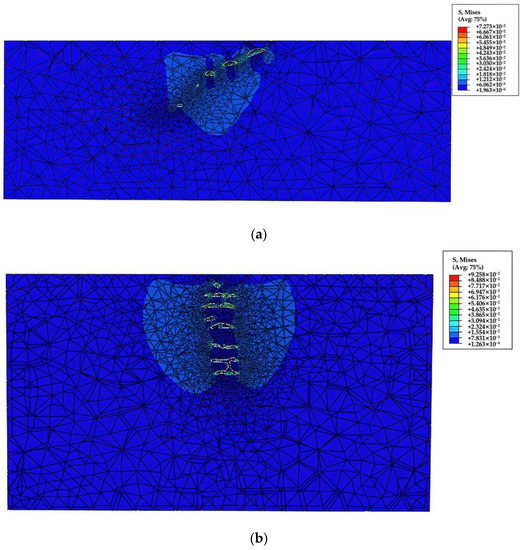
Figure 11.
X-axis stress section of the nest: (a) Camponotus japonicus May; (b) Messor aciculatus.
4. From the perspective of the whole model, except for the ‘pillars’ where stress concentration occurs in the nest, the area near the side wall of the ant nest is the area with the greatest stress, and the maximum stress point of the Camponotus japonicus Mayr nest also appears in these areas. Therefore, the stress distribution in the model has the following rules: except for the ‘pillar’, the stress near the side wall is the greatest, the soil stress within a certain range around the ant nest is second greatest, and the stress near the top and bottom of the ant nest is the smallest.
5. There are some places in the ant nest in which stress concentration occurs, as shown in Figure 12. The stress concentration phenomenon in Messor aciculatus nests appeared in the second, sixth, seventh and eighth layers, and the stress concentration phenomenon in Camponotus japonicus Mayr nests appeared in the first layer. These chambers with a stress concentration phenomenon are larger in the horizontal dimension, smaller in stiffness and relatively weak. The places in which the stress is concentrated are mostly located in the areas in which there are ‘pillars’ in the chambers and the areas in which there are large corners in the recessed side walls of the chambers. This is because the ‘pillars’ in the middle of the chamber and the corner recesses in the side walls of the chamber are not surrounded by other soil bodies to share the pressure, so they bear greater pressure, and therefore, the nearby stress is greater.
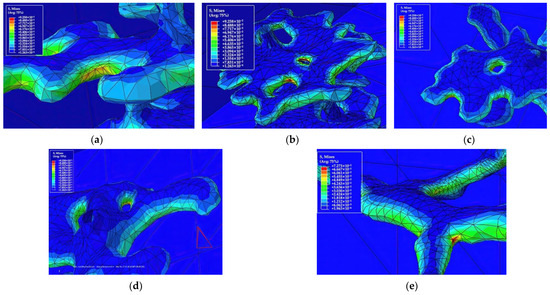
Figure 12.
Stress concentration in (a) layer 2 of Messor aciculatus; (b) layer 6 of Messor aciculatus; (c) layer 7 of Messor aciculatus; (d) layer 8 of Messor aciculatus; (e) layer 1 of Camponotus japonicus Mayr.
6. The chambers in the nest are stratified in the depth direction. The maximum stress values of the chambers at each depth of the nest are extracted, and the maximum stress curves for each layer of the nest under different loads can be obtained, as shown in Figure 13.
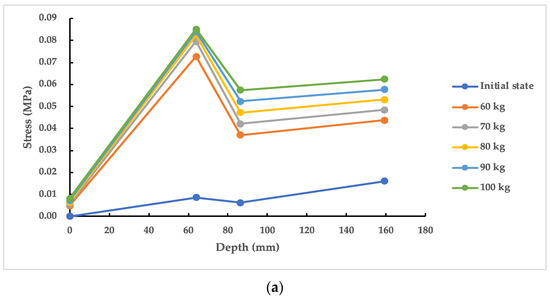
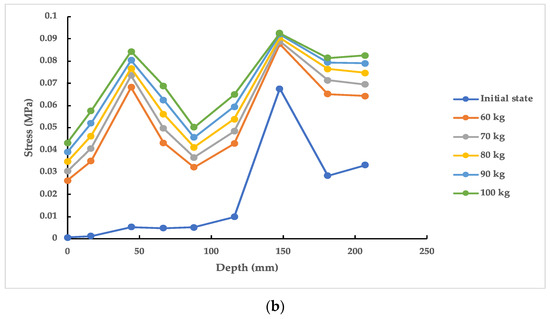
Figure 13.
Plots of maximum nest chamber stresses at various depths for (a) Camponotus japonicus Mayr nests and (b) Messor aciculatus nests under different static loads.
As can be seen from Figure 13, in the initial state, there is only the self-weight stress of the soil in the nest, and at this point, the maximum stress in the nest chambers of each layer gradually increases with depth. In Camponotus japonicus Mayr nests, stress concentrations occur in layer 1, resulting in high maximum stress values, but the concentrations are not severe, and in Messor aciculatus nests, stress concentrations occur in layers 2, 6, 7 and 8, with slightly higher stresses in layer 2 and more pronounced stress concentrations in layer 6. Stress concentrations in the nest are slightly higher in layer 2 and more pronounced in layer 6, where stress values are severely overestimated, as well as in layers 7 and 8, where stress values are also overestimated, but not as severely as in layer 6. The stress concentration in the nest becomes more pronounced after the addition of external loads, with the maximum stress in nest chamber 1 of Camponotus japonicus Mayr’s nest significantly exceeding that in nest chambers 2 and 3, and the stress in nest chamber 2 of Messor aciculatus’s nest significantly increasing compared to its initial state, due to the proximity of nest chamber 2 to the ground and its sensitivity to ground pressure. This is due to the fact that nest chamber 2 is close to the surface and is sensitive to ground pressure, whereas nest chambers 7 and 8 are located deeper in the soil, and the pressure at the surface has a reduced effect on these chambers due to the dispersion of the soil, so the increase in stress values is not significant compared to the initial state.
As the load increases, the maximum stress in the chambers of each layer of the nest increases gradually, but the stress at the point of higher stress is not significantly increased by the large increase in load. The maximum stress in the nest of Camponotus japonicus Mayr occurs in the chamber of layer 1, at a depth of about 64 mm, and is due to a concentration of stress in the side wall corner, as shown in the horizontal section in Figure 14a. There are two stress crests in the Messor aciculatus nest, one in the second chamber at a depth of approximately 44 mm and the other in the sixth chamber at a depth of approximately 150 mm, with the maximum stress being the crest stress in the sixth chamber, in which the tiny ‘pillars’ show a concentration of stress, as shown in the horizontal section in Figure 14b.
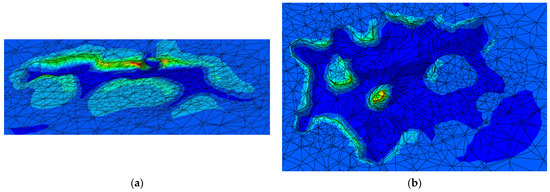
Figure 14.
Horizontal sections of (a) Camponotus japonicus Mayr nests and (b) Messor aciculatus nests at maximum stress.
In Messor aciculatus nests, the second and sixth nest chambers are the two layers with the more pronounced stress concentrations. Under external loads, the second nest chamber is subject to high surface loads due to its large horizontal dimensions and shallow depth of burial, with peak stresses, and the sixth nest chamber is subject to high external loads, because it is a large spanning flat circular chamber with only three ‘pillars’ in the middle to support the top of the chamber, as shown in Figure 14b. The stress in the ‘columns’ is very high under external loading. The seventh and eighth layers also have stress concentrations, but they are far less severe than the sixth layer, as the seventh and eighth layers have a smaller span and cleverly use the surrounding soil to carry the pressure and avoid large concentrations of stress in the ‘columns’.
7. The maximum stress concentrations in the nest are counted in the Table 3.

Table 3.
Maximum stress concentrations in the nest for each load.
A graph of the maximum stress as a function of the load is shown in Figure 15.

Figure 15.
Plots of maximum stress concentrations with load for (a) Camponotus japonicus Mayr nests and (b) Messor aciculatus nests.
From Figure 15, it can be seen that as the load increases, the stress gradually increases, but the slope of the curve gradually decreases, i.e., the amount of stress increase becomes smaller, which shows that the load is shared by the soil near the maximum stress point, and the load distributed to the maximum stress point gradually decreases.
4. Conclusions
This paper investigates the mechanical properties of the nest structure of underground nests of Camponotus japonicus Mayr and Messor aciculatus as examples. Based on the summary of the previous methods of studying the underground nests of Camponotus japonicus Mayr and Messor aciculatus, a 3D digital model is obtained by paraffin infusion and industrial CT scanning. After processing the model, a finite element model of the nest structure is established; based on ABAQUS finite element software, the nests are simulated and analysed under different weights of human gravity, revealing the stress distribution characteristics of the subterranean ant nests of Camponotus japonicus Mayr and Messor aciculatus under human pressure. The following conclusions can be drawn from the research in this paper.
1. For the nest chamber, the stress distribution can be divided into three layers: top, side wall and bottom. The stress in the side wall is significantly greater than that in the top and bottom, about two to three times the stress value in the bottom and top.
2. For the channels, the stress distribution is related to the degree of inclination. The stress distribution of horizontal and inclined channels is striped, whereas the stress distribution of vertical channels shows that there are some areas with greater stress near the nest chamber and less stress away from the nest chamber.
3. The stress concentrations in the nest model, with the exception of the ‘pillars’, are related as follows: stress near the side walls > stress in the soil around the nest within a certain area > stress near the top and bottom of the nest chamber.
4. There is some stress concentration phenomenon in the ant nest, and it appears in several layers of chambers with larger horizontal dimensions, which leads to relatively weak chambers in these layers. The stress concentration points are mainly distributed in the places in which there are ‘pillars’ in the nest and in the places with large concave corners on the side walls of the nest. The stress concentration in the nest of Messor aciculatus is more serious than that of Camponotus japonicus Mayr.
5. As the weight of the body increases, the maximum stress in the chambers at various depths increases gradually, but the stress at the higher stress points does not increase significantly with a large increase in load, due to the redistribution of internal forces that occurs.
Author Contributions
Conceptualization, W.Z. and J.X.; methodology, G.Y.; software, M.Z.; validation, J.X. and M.Z.; formal analysis, G.Y.; investigation, G.Y.; resources, G.Y.; data curation, W.Z.; writing—original draft preparation, G.Y.; writing—review and editing, J.X., A.A.K. and M.Z.; supervision, W.Z.; project administration, W.Z.; funding acquisition, W.Z. All authors have read and agreed to the published version of the manuscript.
Funding
This research was funded by the China Postdoctoral Science Foundation, grant number 2020M671216.
Institutional Review Board Statement
Not applicable.
Informed Consent Statement
Not applicable.
Data Availability Statement
Not applicable.
Conflicts of Interest
The authors declare no conflict of interest.
References
- Zhang, K. Diversity of Microbes in the Infrabuccal Pocket of Camponotus Japonicus Mayr. Master’s Thesis, Northwest A&F University, Xianyang, China, 2018. [Google Scholar]
- Sudd, J.H. The Excavation of Soil by Ants. Z. Für Tierpsychol. 1969, 26, 257–276. [Google Scholar] [CrossRef]
- Zhou, W.; Zhu, P.; Qu, W. Basic Properties of calcined underground ant nest materials and its influence on the compressive strength of concrete. Materials 2019, 12, 1191. [Google Scholar] [CrossRef] [PubMed]
- Gao, J.; Liu, X.; Gan, X. Research On Structure of Ant-nest System in Dam-boby and its Strength and Stability. J. Univ. South China (Sci. Technol.) 2003, 4, 21–24+28. [Google Scholar]
- Autuori, M. Contribuição para o conhecimento da saúva (Atta spp.-Hymenoptera-Formicidae). III. Escavação de um sauveiro (Atta sexdens rubropilosa Forel, 1908). Arq. Do Inst. Biológico 1942, 13, 137–148. [Google Scholar]
- Talbot, M.; Kennedy, C.H. The slave-making ant, Formica sanguinea subintegra Emery, its raids, nuptual flights and nest structure. Ann. Entomol. Soc. Am. 1940, 33, 560–577. [Google Scholar] [CrossRef]
- Jesovnik, A.; Sosa-Calvo, J.; Lopes, C.; Vasconcelos, H.; Schultz, T. Nest architecture, fungus gardens, queen, males and larvae of the fungus-growing ant Mycetagroicus inflatus Brandão & Mayhé-Nunes. Insectes Sociaux 2013, 60, 531–542. [Google Scholar] [PubMed]
- Kushwaha, B.; Kumar, A.; Ambekar, R.S.; Arya, V.; Negedu, S.D.; Bakshi, D.; Olu, F.E.; Sastri Ayyagari, R.; Pal, V.; Sadasivuni, K.K. Understanding the mechanics of complex topology of the 3D printed Anthill architecture. Oxf. Open Mater. Sci. 2022, 2, itac003. [Google Scholar] [CrossRef]
- Lapointe, S.L.; Serrano, M.S.; Jones, P.G. Microgeographic and vertical distribution of Acromynnex landolti (Hymenoptera: Formicidae) nests in a Neotropical Savanna. Environ. Entomol. 1998, 27, 636–641. [Google Scholar] [CrossRef]
- Wang, X.; Xu, J.; Wang, Z.; Yao, W. Use of recycled concrete aggregates as carriers for self-healing of concrete cracks by bacteria with high urease activity. Constr. Build. Mater. 2022, 337, 127581. [Google Scholar] [CrossRef]
- Qu, W.; Zhou, W.; Zhu, P.; Zhang, Z. Model of Underground Ant Nest Structure Using Static and Dynamic Finite Element Analysis. Acta Mech. Solida Sin. 2018, 31, 717–730. [Google Scholar] [CrossRef]
- Shen, S.; Li, W. Phylogenetic relationship and characterization of the complete mitochondrial genome of Camponotus japonicus (Hymenoptera: Formicoidea: Formicidae). Mitochondrial DNA Part B 2022, 7, 686–688. [Google Scholar] [CrossRef] [PubMed]
- Crist, T.O.; MacMahon, J.A. Harvester ant foraging and shrub-steppe seeds: Interactions of seed resources and seed use. Ecology 1992, 73, 1768–1779. [Google Scholar] [CrossRef]
- Tevis, L. Interrelations between the harvester ant Veromessor pergandei (Mayr) and some desert ephemerals. Ecology 1958, 39, 695–704. [Google Scholar] [CrossRef]
- Flisch, A.; Wirth, J.; Zanini, R.; Breitenstein, M.; Rudin, A.; Wendt, F.; Mnich, F.; Golz, R. Industrial computed tomography in reverse engineering applications. DGZ-Fp-Proc. BB 1999, 4, 45–53. [Google Scholar]
- Krebstein, K.; Tõnutare, T.; Vennik, K.; Virro, I.; Tõnutare, T.; Kõlli, R.; Soobik, L. Usage of computed tomography for investigation of the soil porosity in disturbed grassland. In Proceedings of the EGU General Assembly Conference Abstracts, Online, 19–30 April 2021; p. EGU21-13023. [Google Scholar]
- Liang, H.; Yang, Y.; Xie, D.; Li, L.; Mao, N.; Wang, C.; Tian, Z.; Jiang, Q.; Shen, L. Trabecular-like Ti-6Al-4V scaffolds for orthopedic: Fabrication by selective laser melting and in vitro biocompatibility. J. Mater. Sci. Technol. 2019, 35, 1284–1297. [Google Scholar] [CrossRef]
- Courant, R. Variational methods for the solution of problems of equilibrium and vibrations. Bull. Am. Math. Soc. 1943, 49, 1–23. [Google Scholar] [CrossRef]
- Turner, M.J.; Clough, R.W.; Martin, H.C.; Topp, L. Stiffness and deflection analysis of complex structures. J. Aeronaut. Sci. 1956, 23, 805–823. [Google Scholar] [CrossRef]
- Clough, R.W. The finite element method in plane stress analysis. In Proceedings of the 2nd ASCE Conference on Electronic Computation, Pittsburg, PA, USA, 8–9 September 1960. [Google Scholar]
Publisher’s Note: MDPI stays neutral with regard to jurisdictional claims in published maps and institutional affiliations. |
© 2022 by the authors. Licensee MDPI, Basel, Switzerland. This article is an open access article distributed under the terms and conditions of the Creative Commons Attribution (CC BY) license (https://creativecommons.org/licenses/by/4.0/).