
Classification of Malicious URLs by CNN Model Based on Genetic Algorithm

Abstract
:1. Introduction
2. Materials and Methods
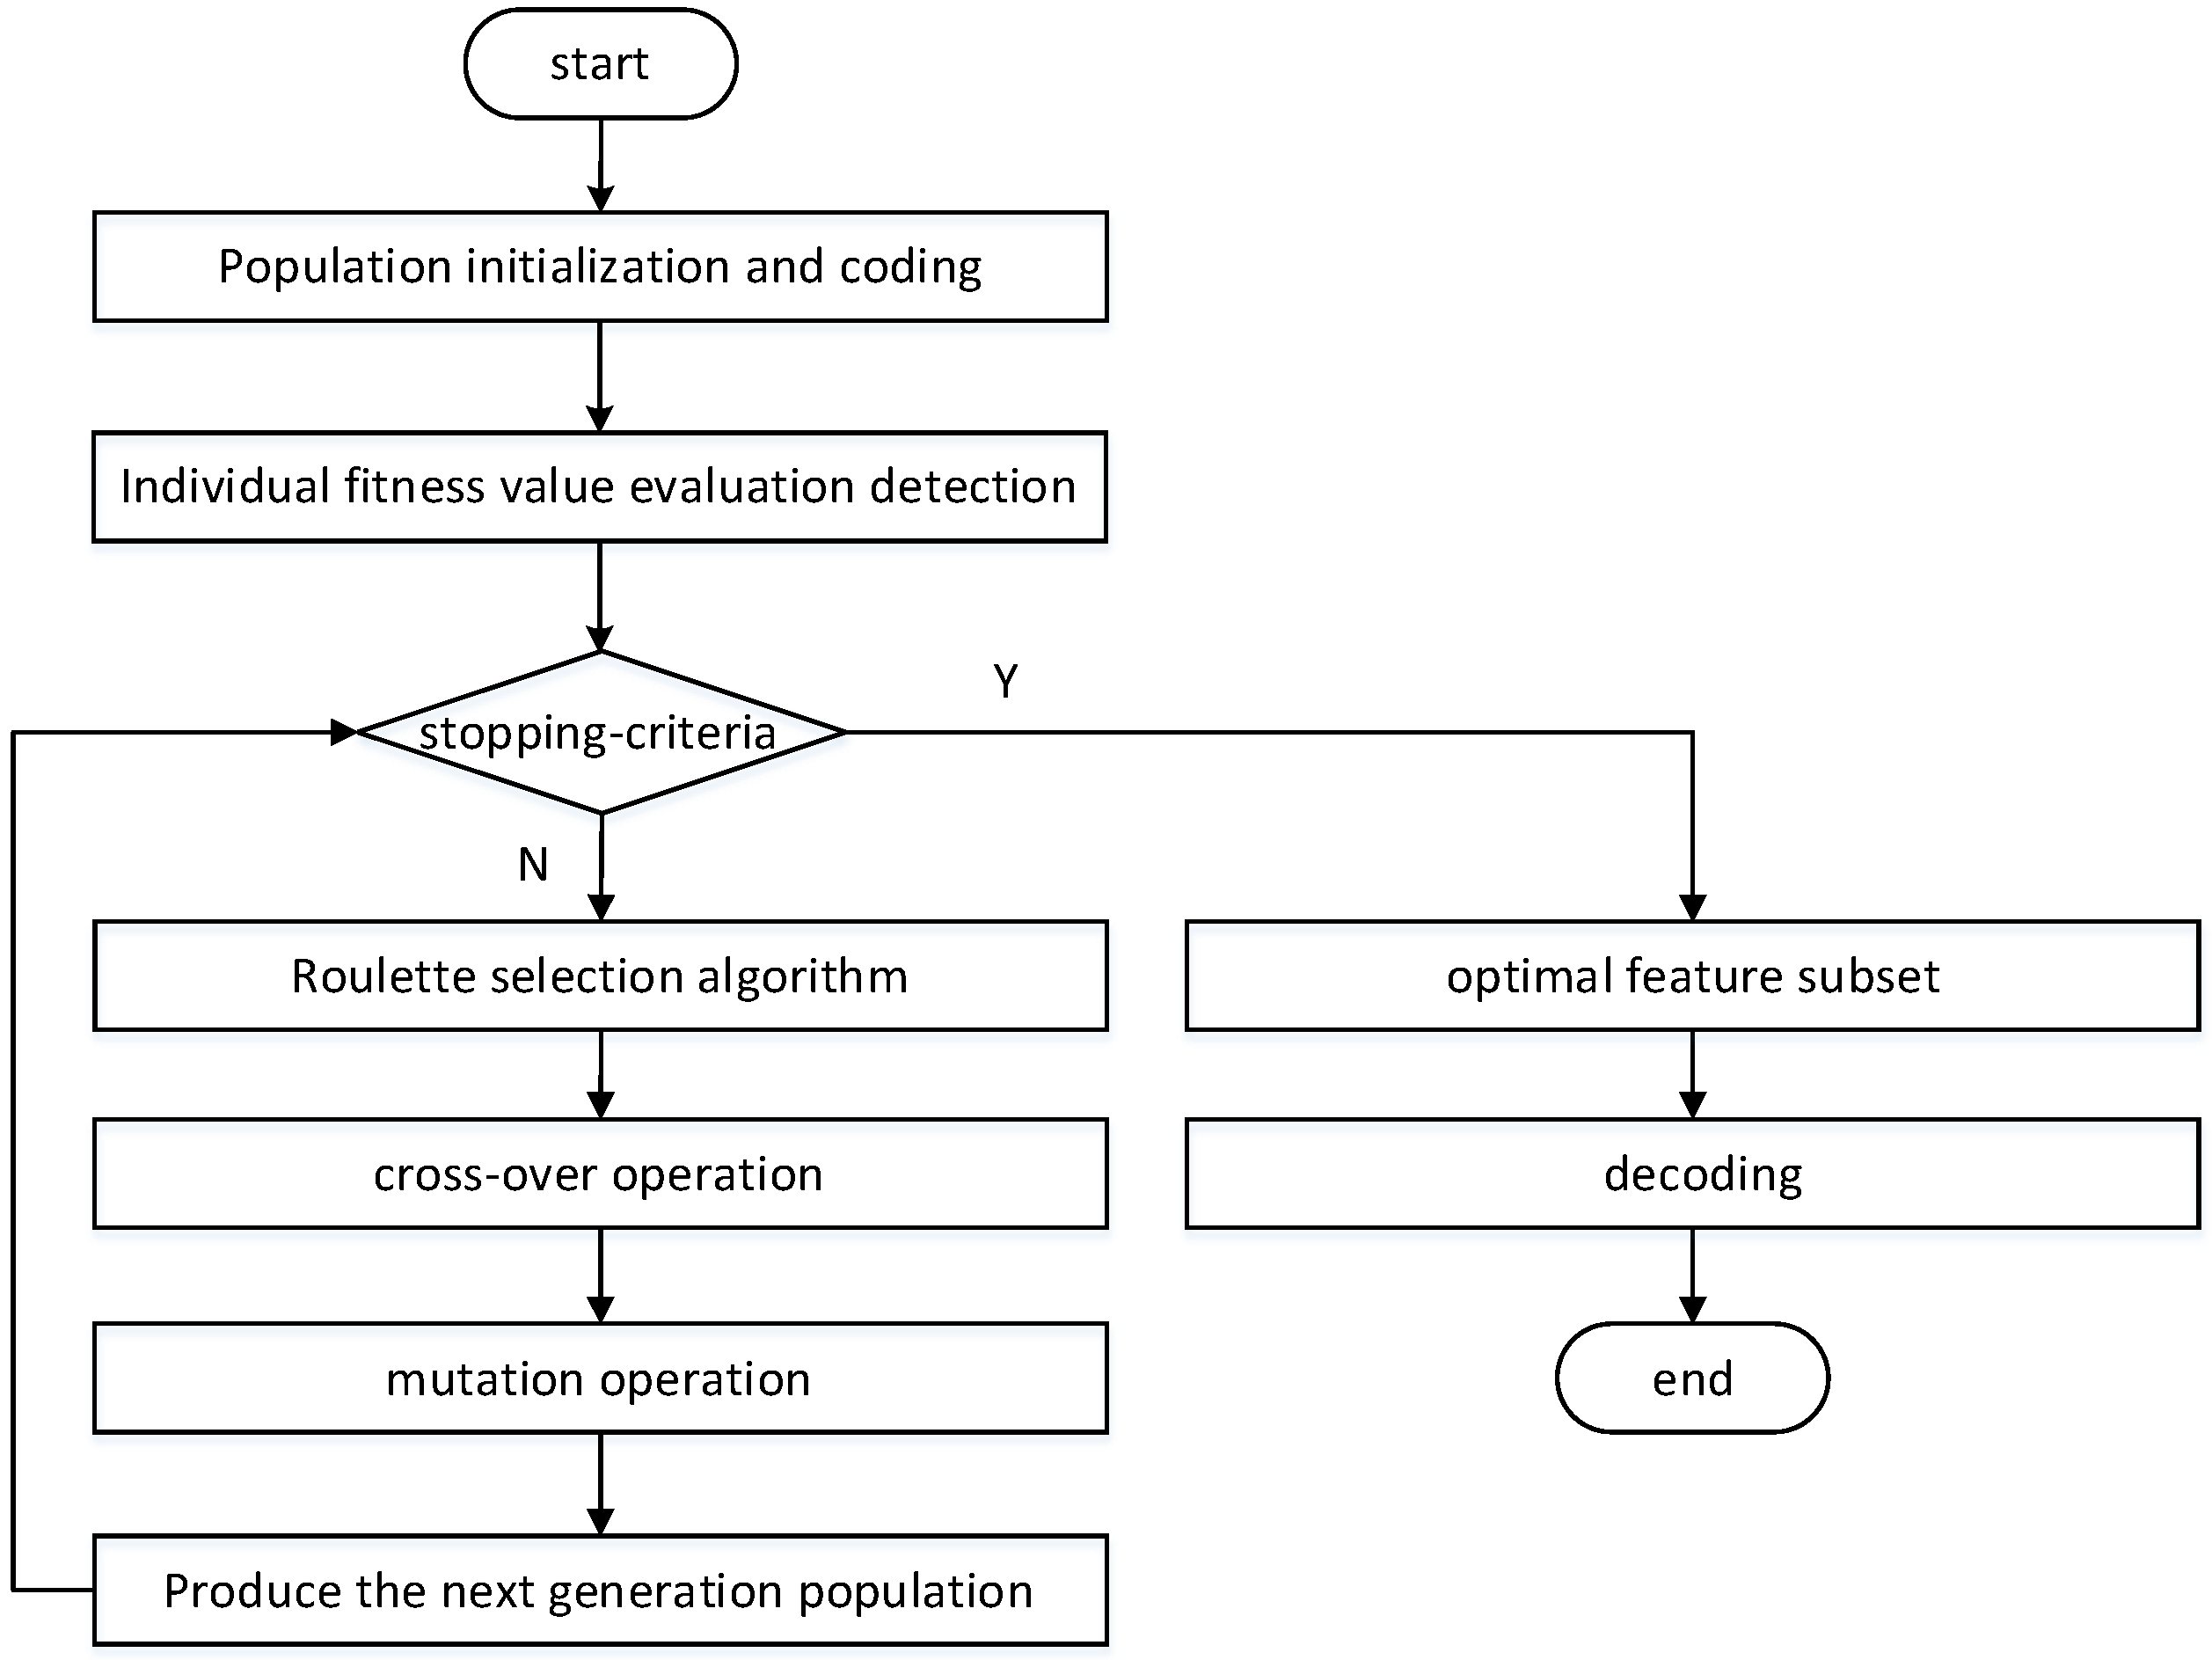
2.1. Feature Extraction
2.1.1. Population Individual Coding
2.1.2. Calculation of Fitness Function
2.1.3. Selection Operator
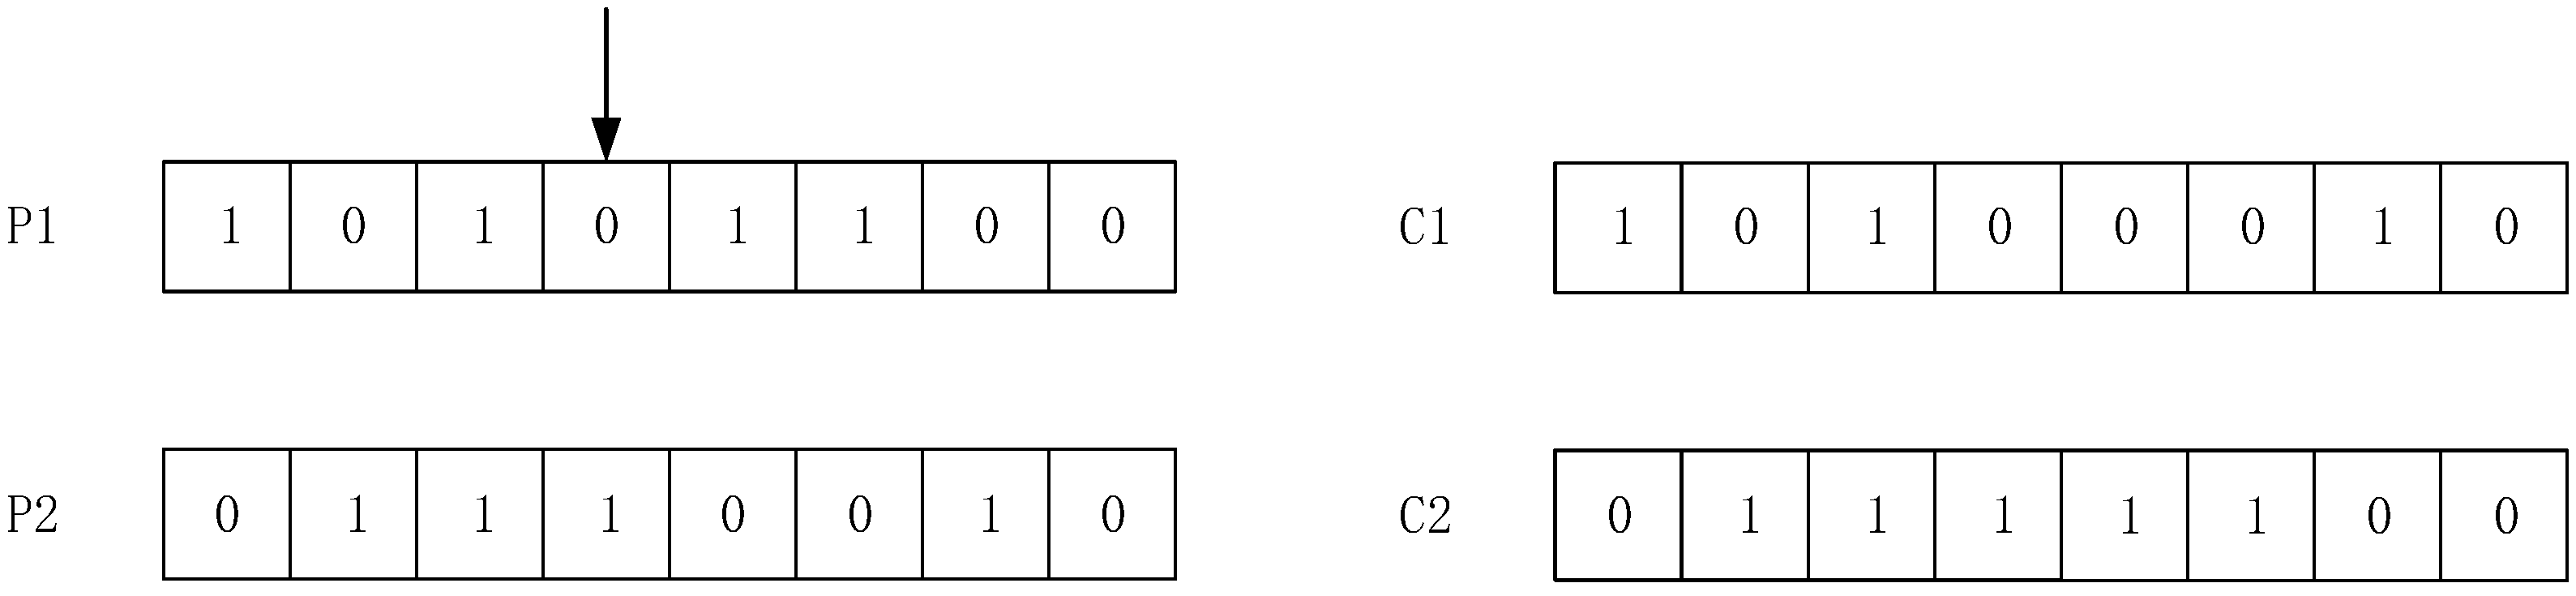
2.1.4. Crossover Operator and Mutation Operator
2.1.5. Algorithm Termination Condition
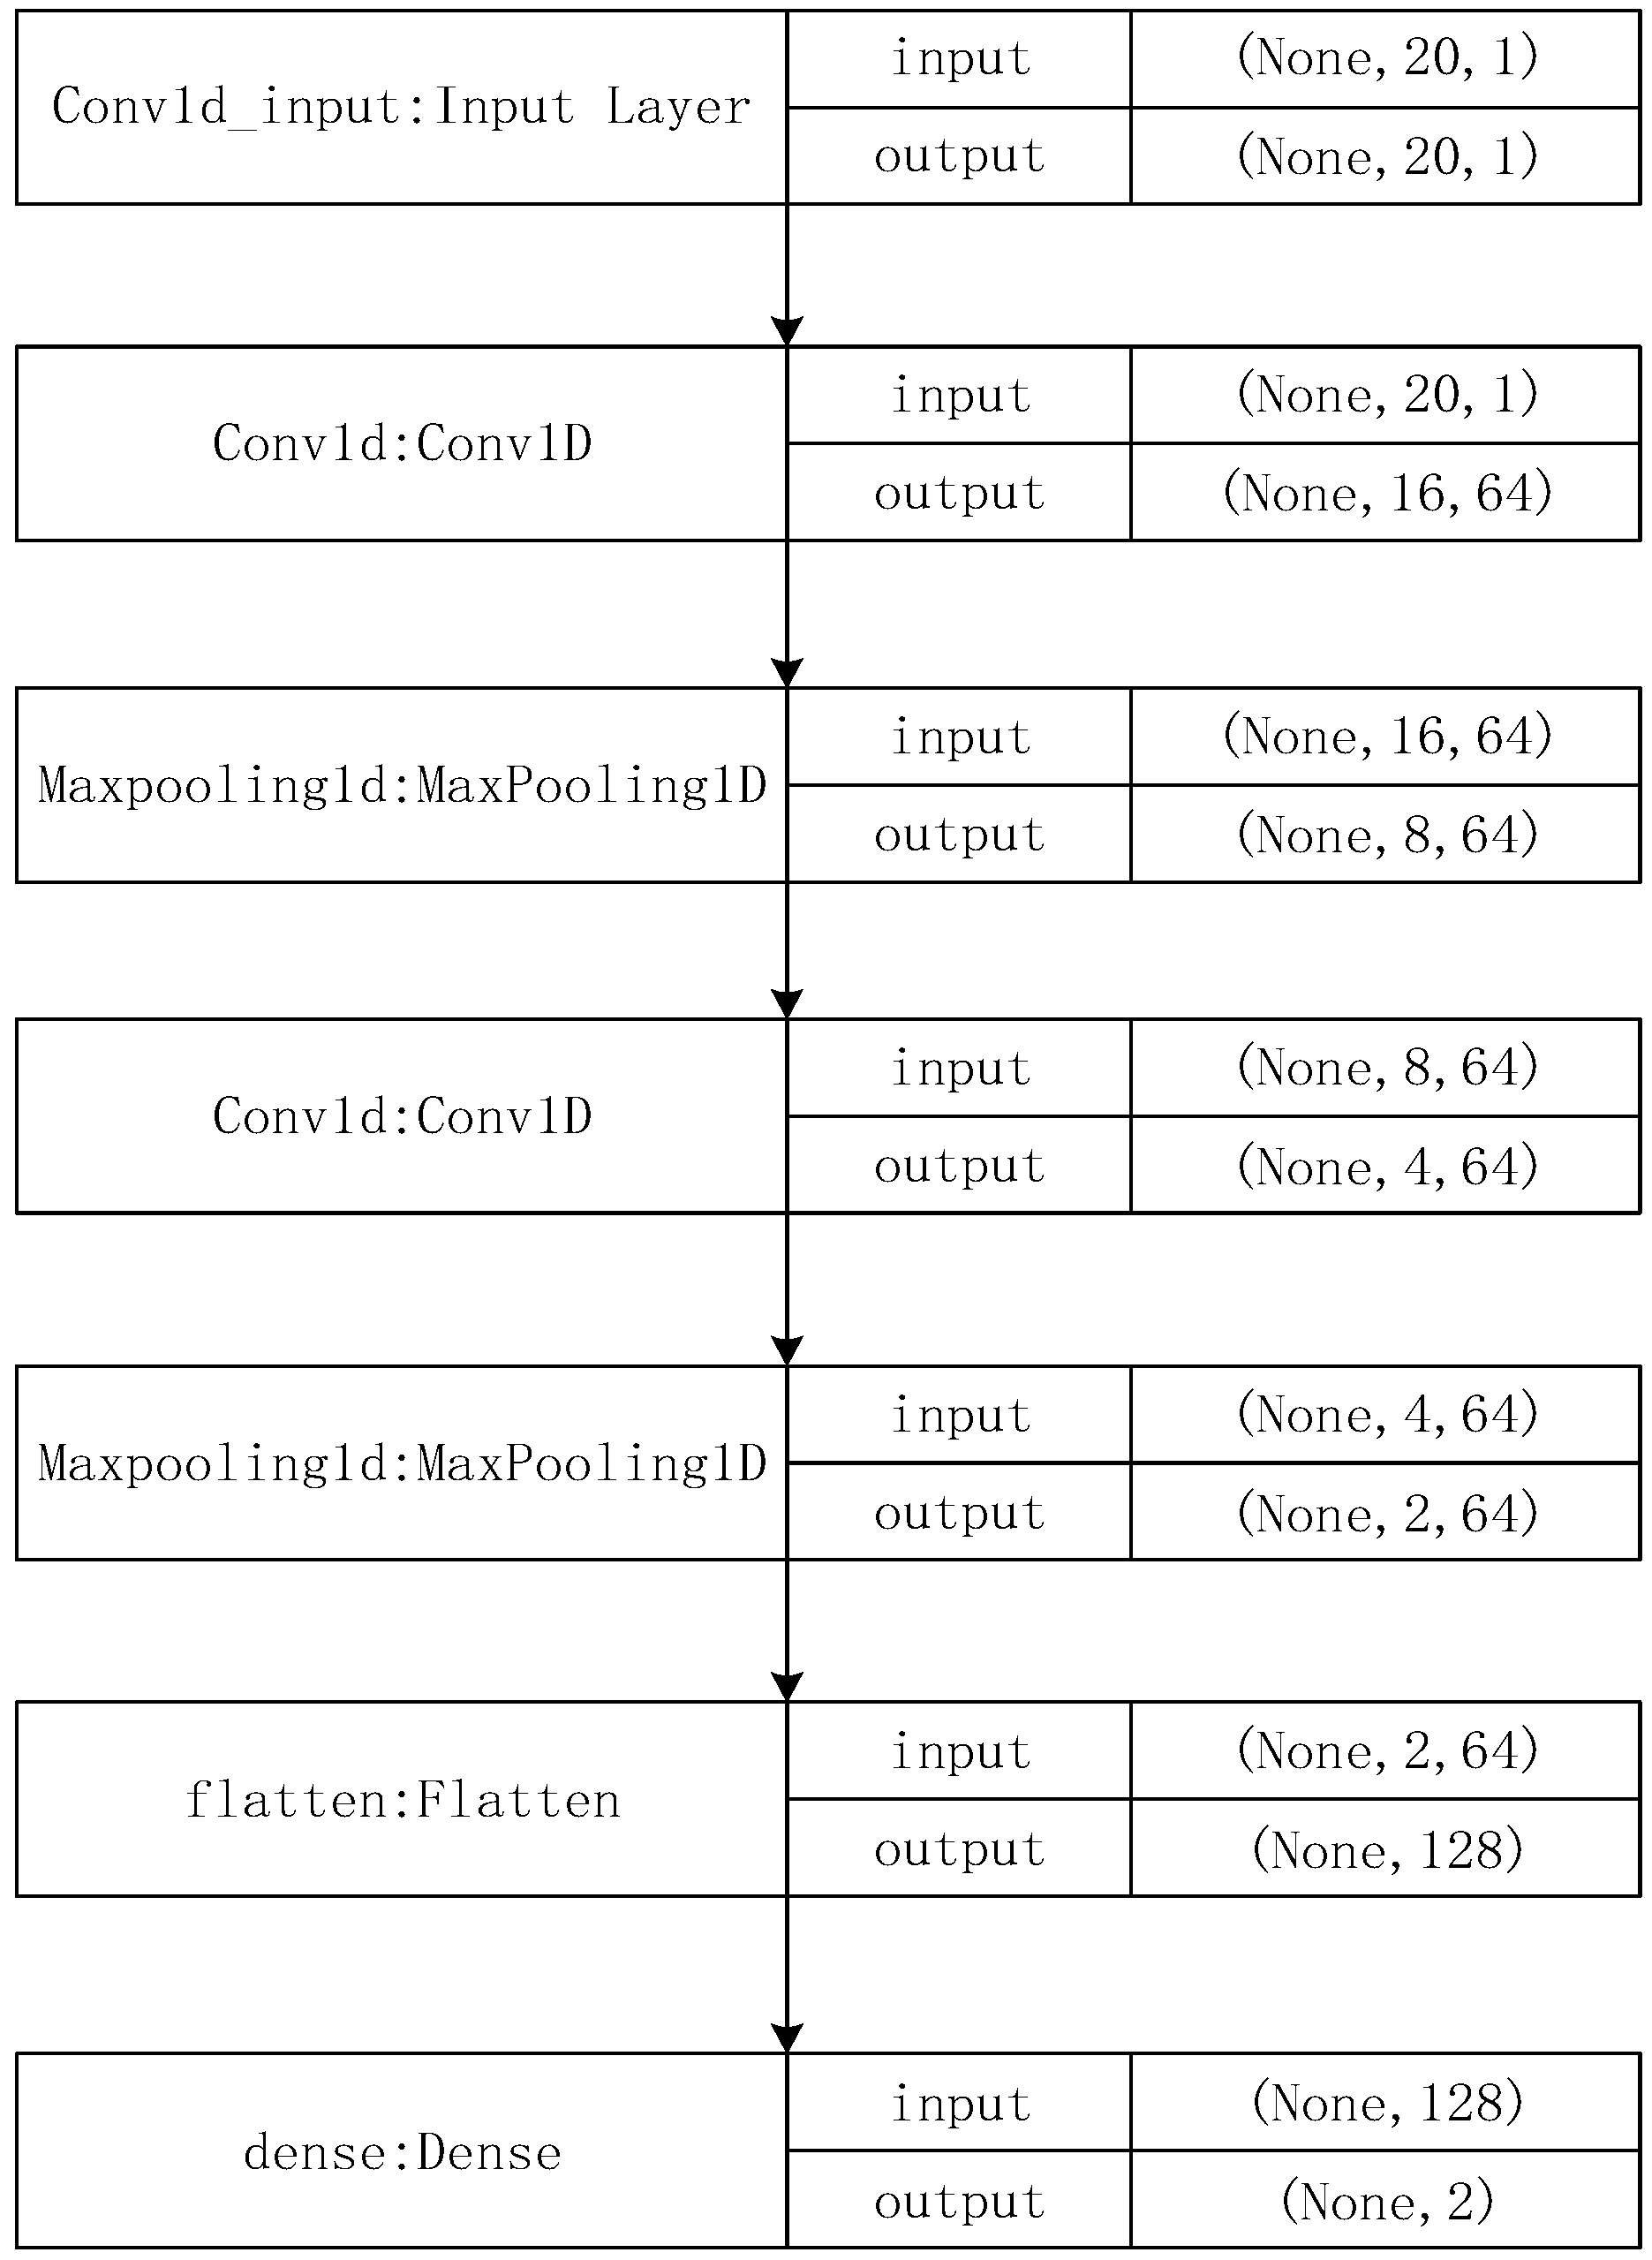
2.2. Convolutional Neural Network
2.2.1. Convolution Layer
2.2.2. Pooling Layer
2.2.3. Fully Connected Layer
3. Results
3.1. Data Set
3.2. Feature Extraction
3.2.1. Initialization Population and Coding
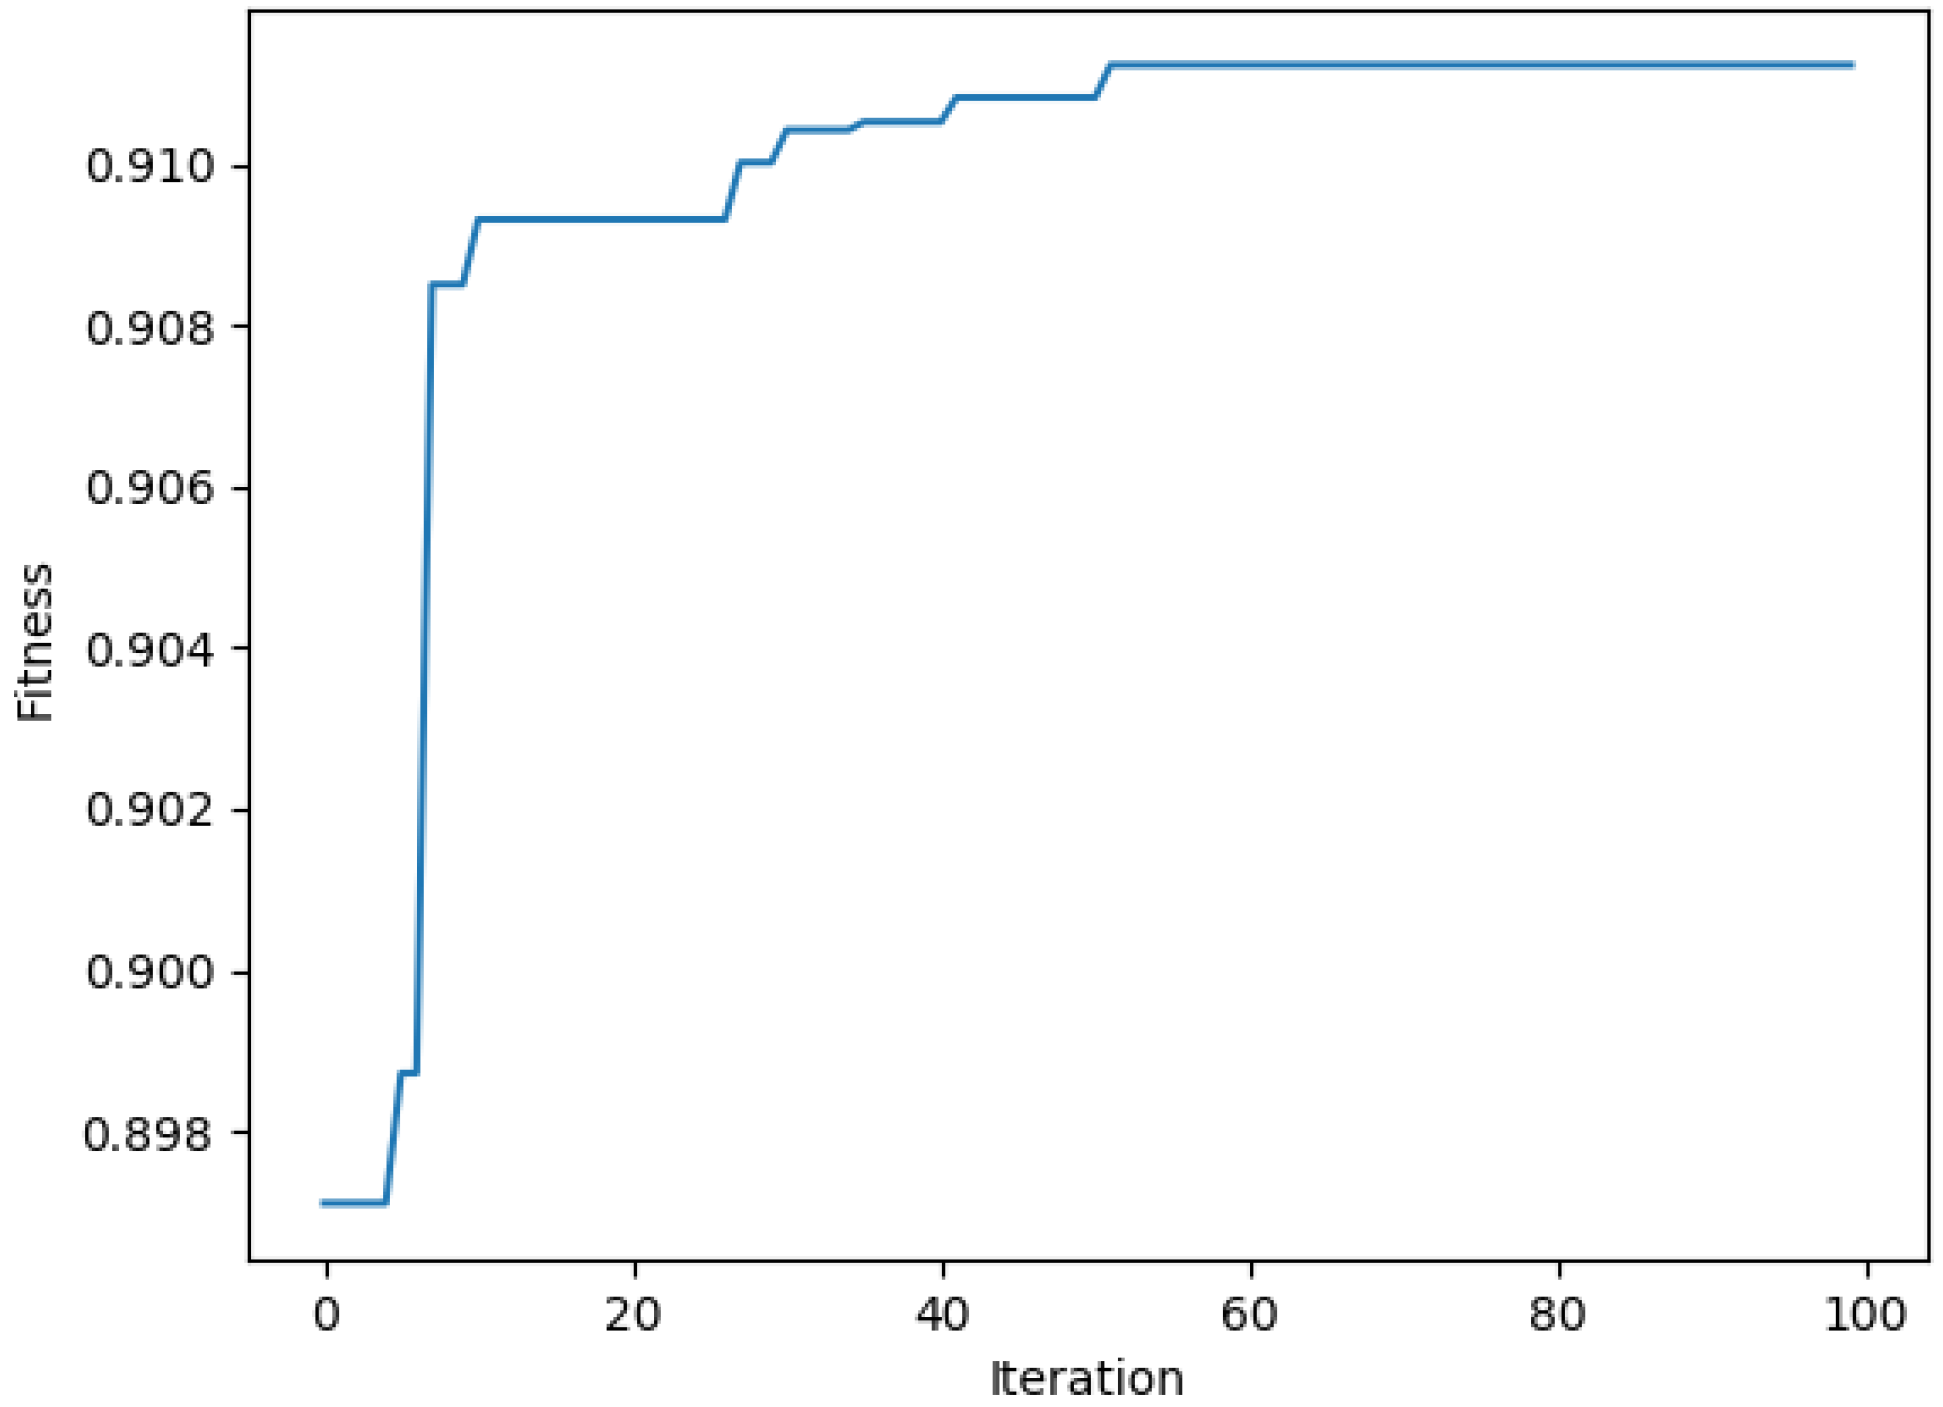
3.2.2. Calculation of Fitness Function
3.2.3. Choice Operation
3.2.4. Crossover and Mutation Operation
3.2.5. Algorithm Termination Operation
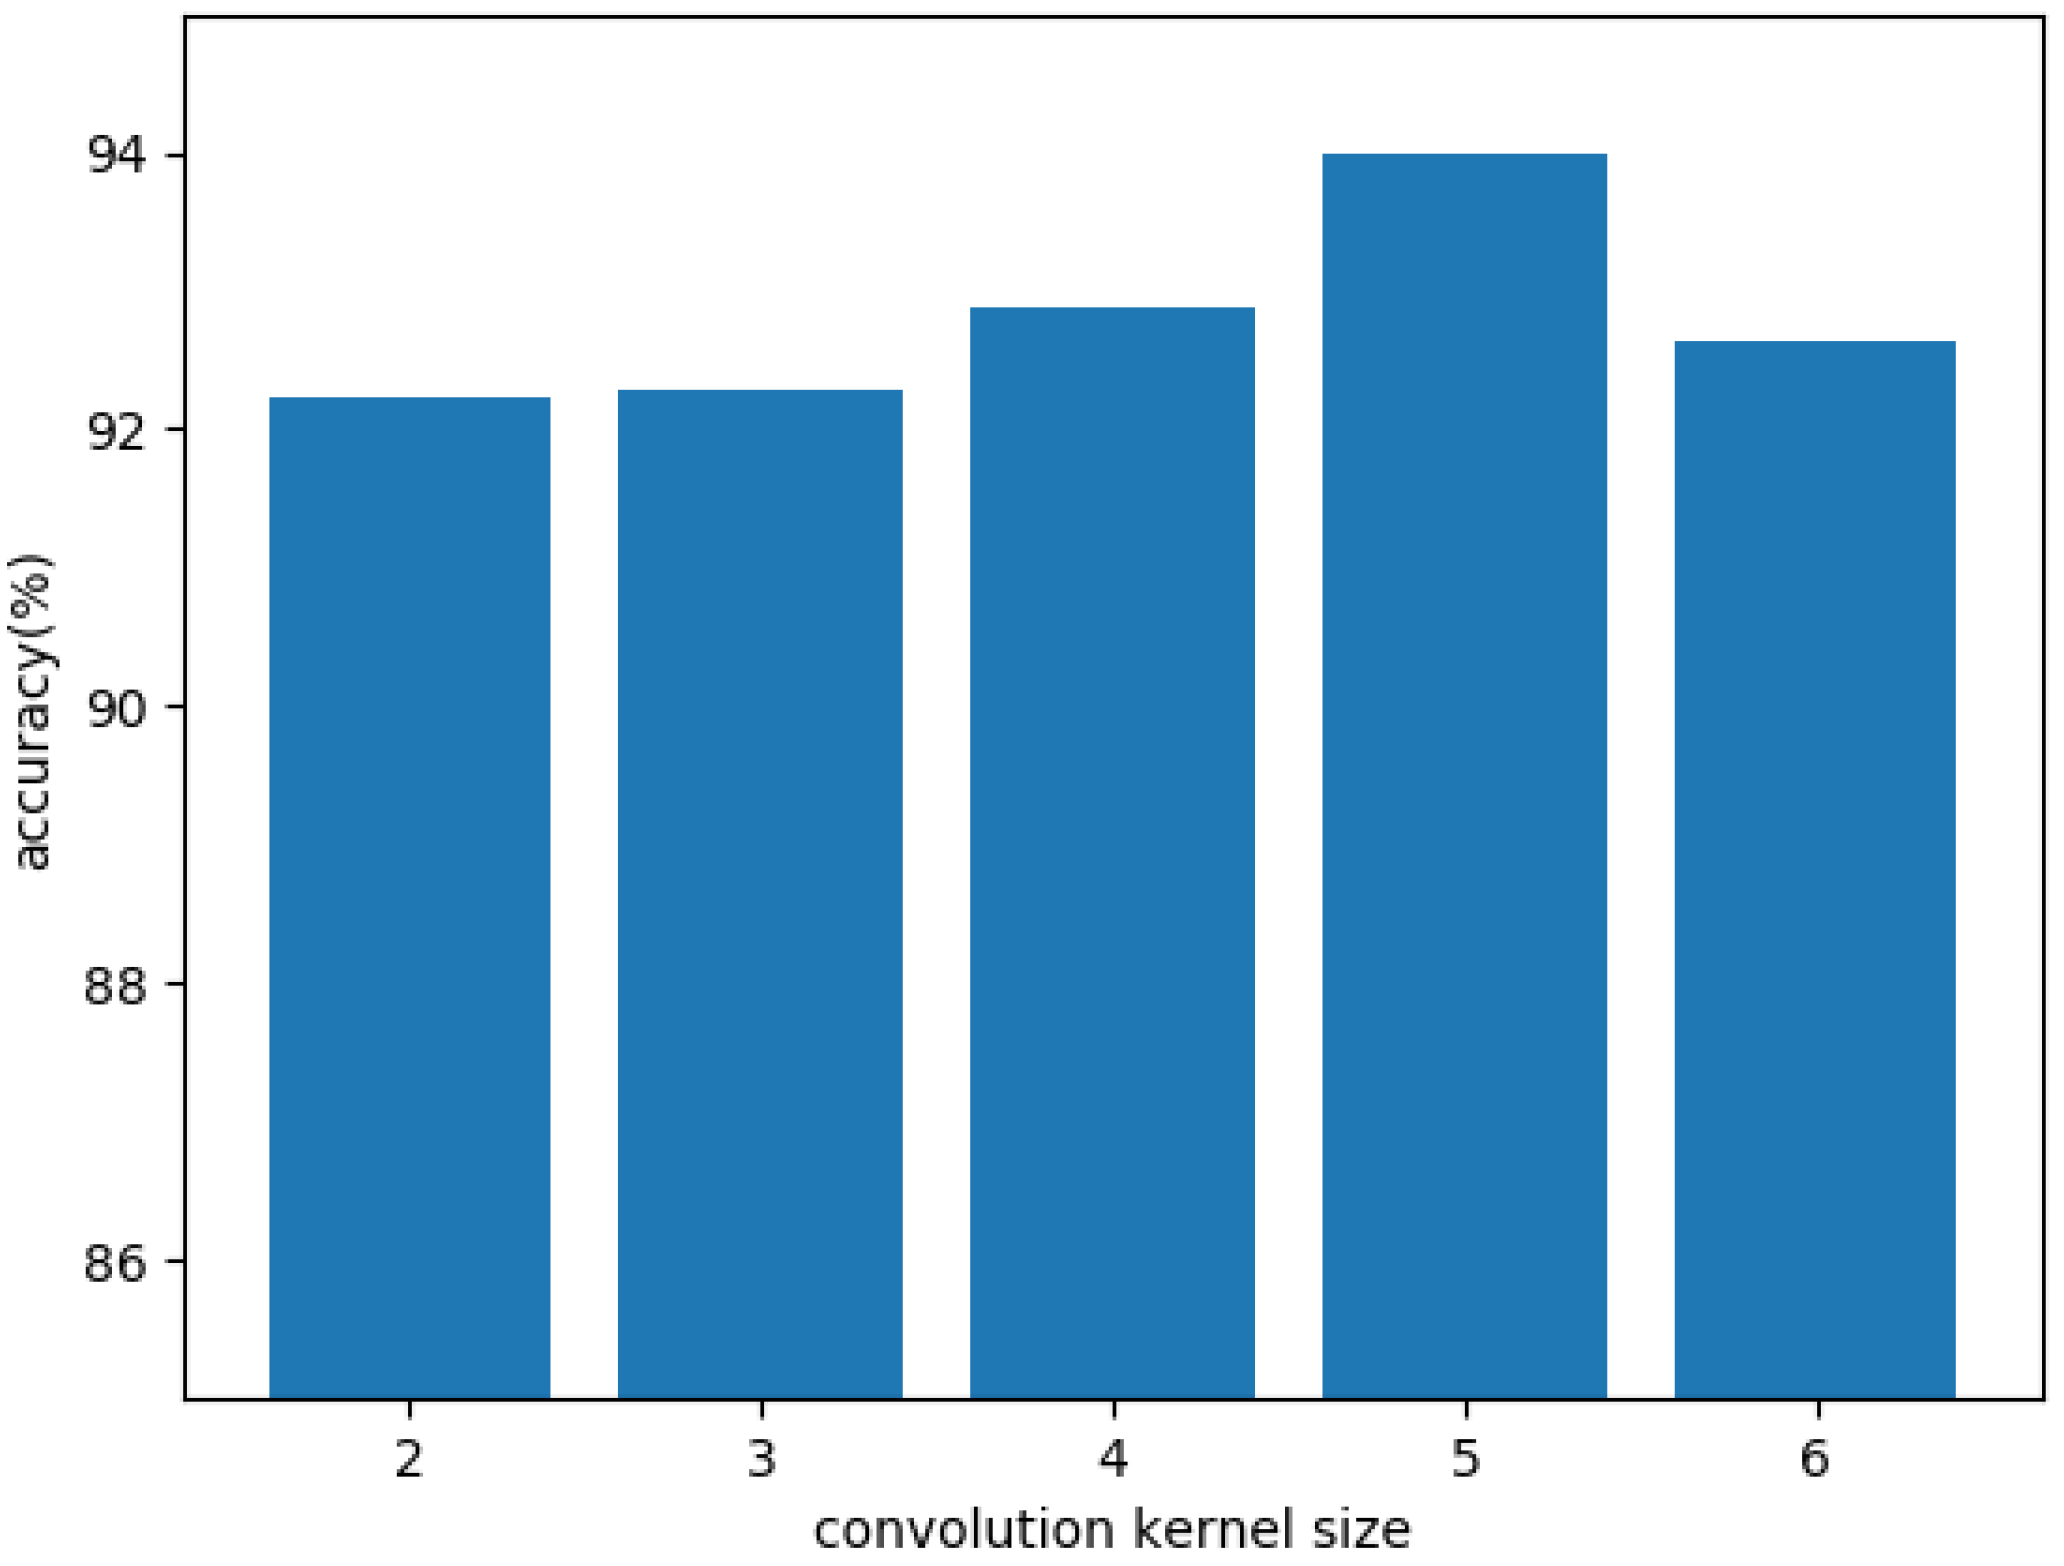
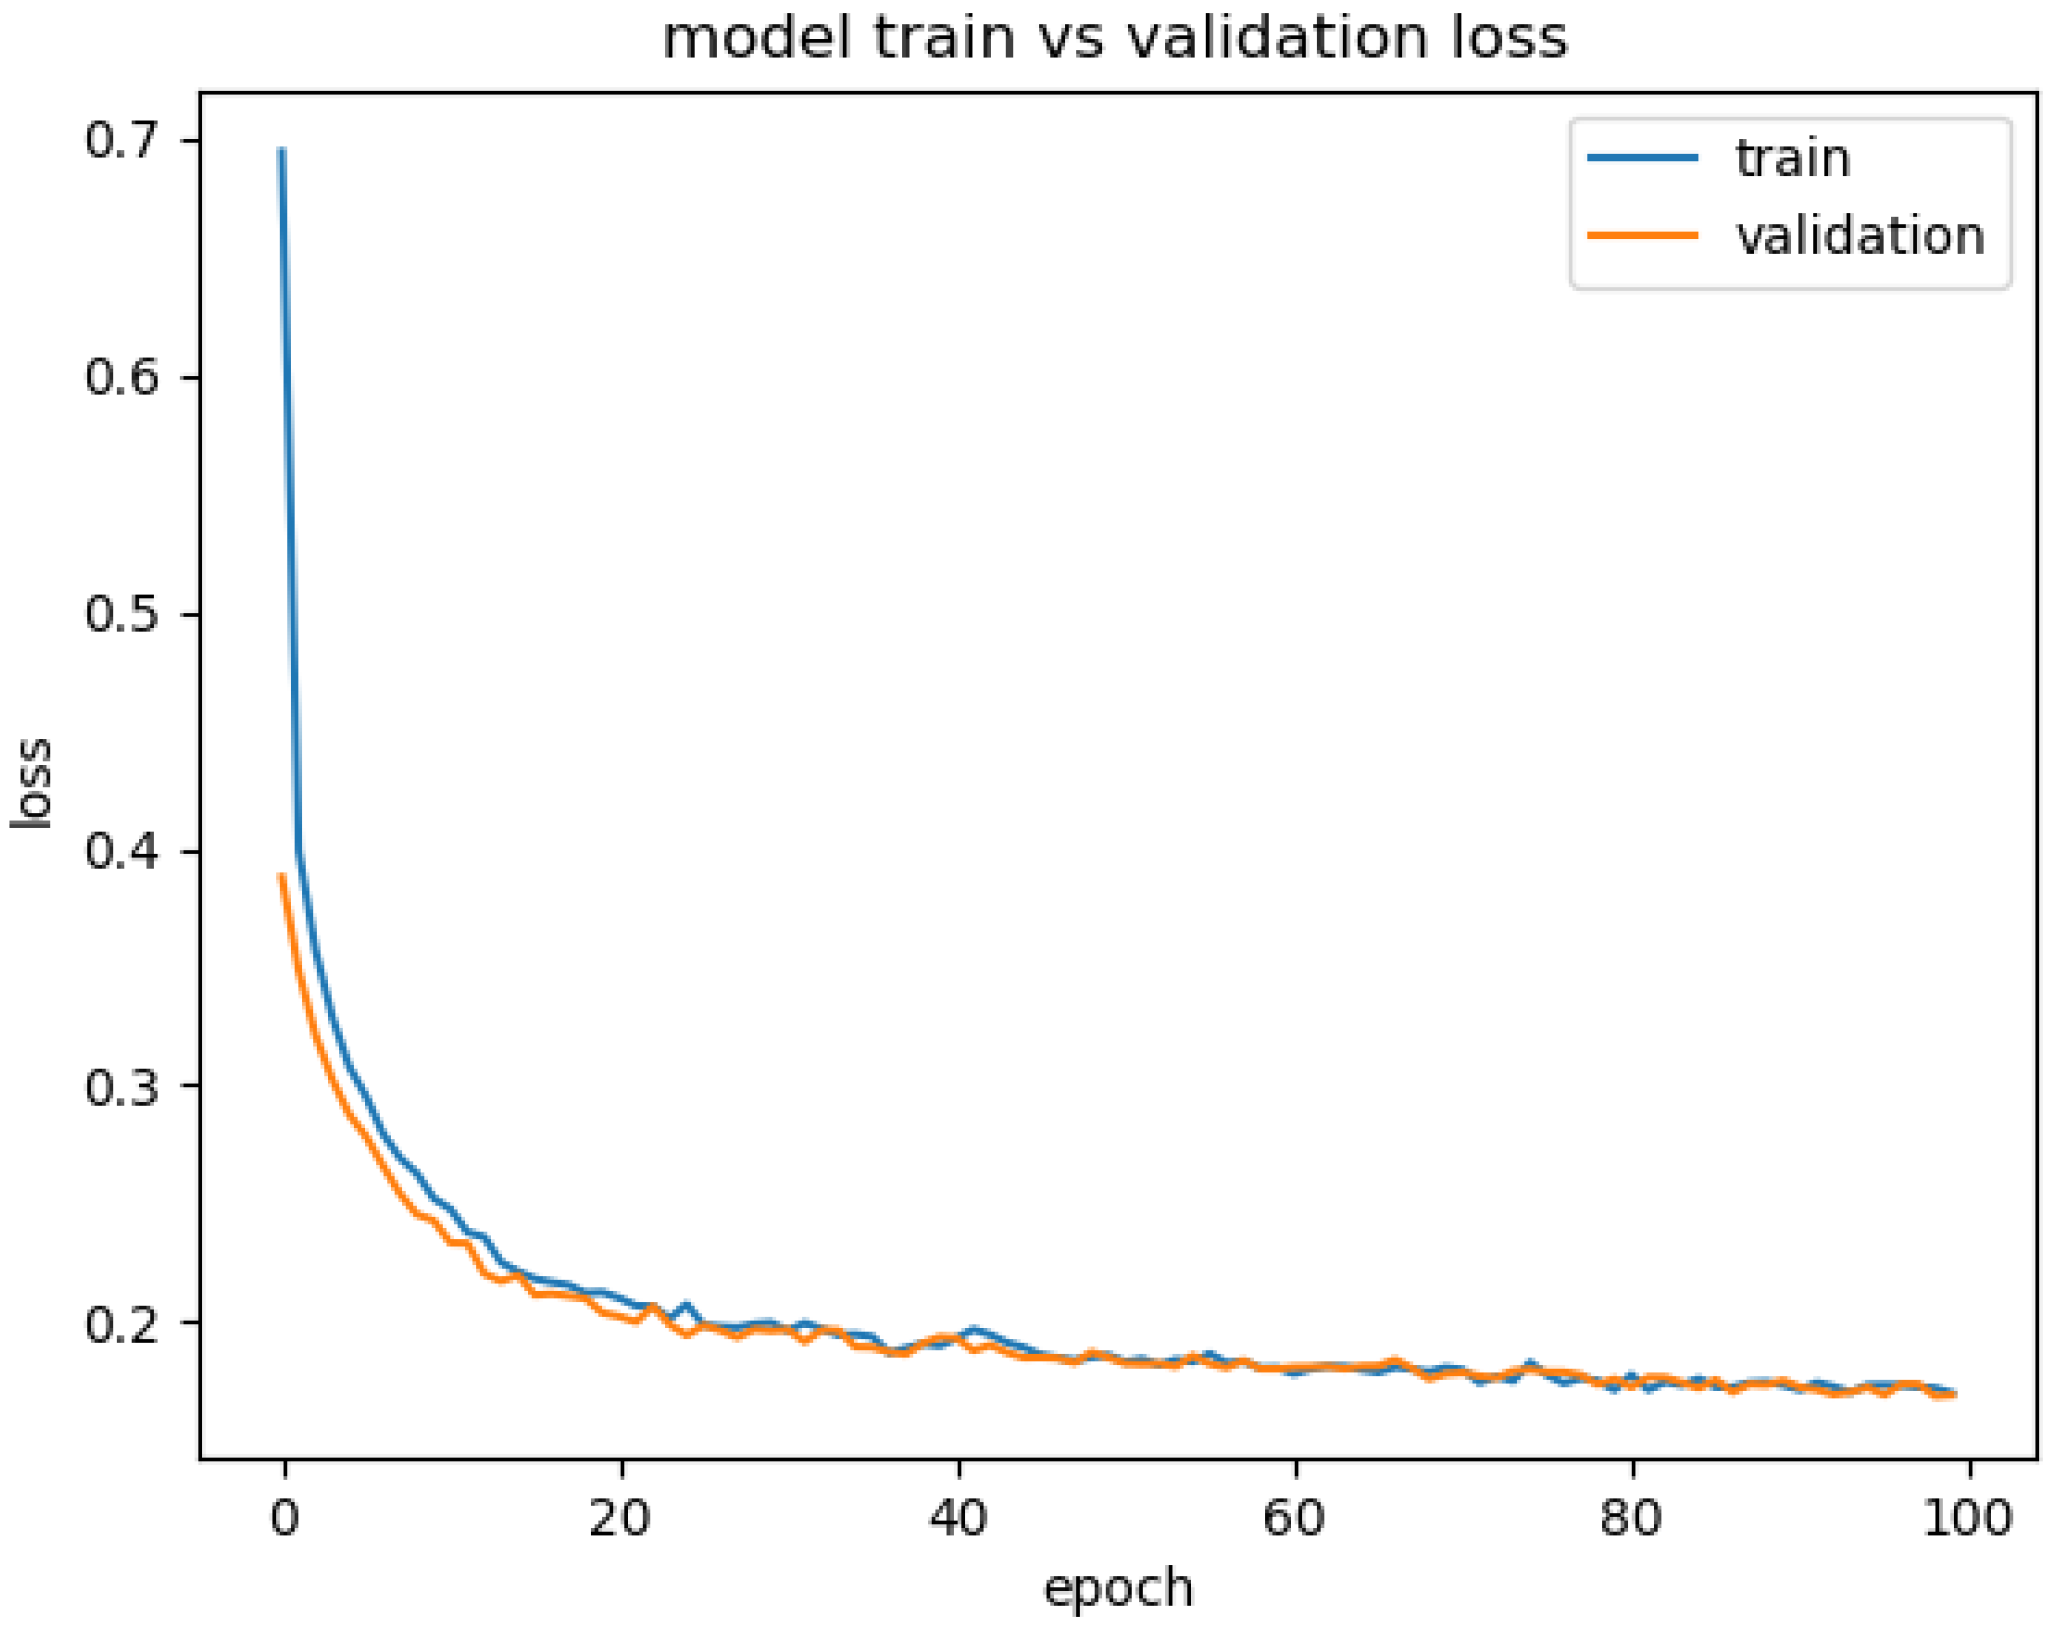
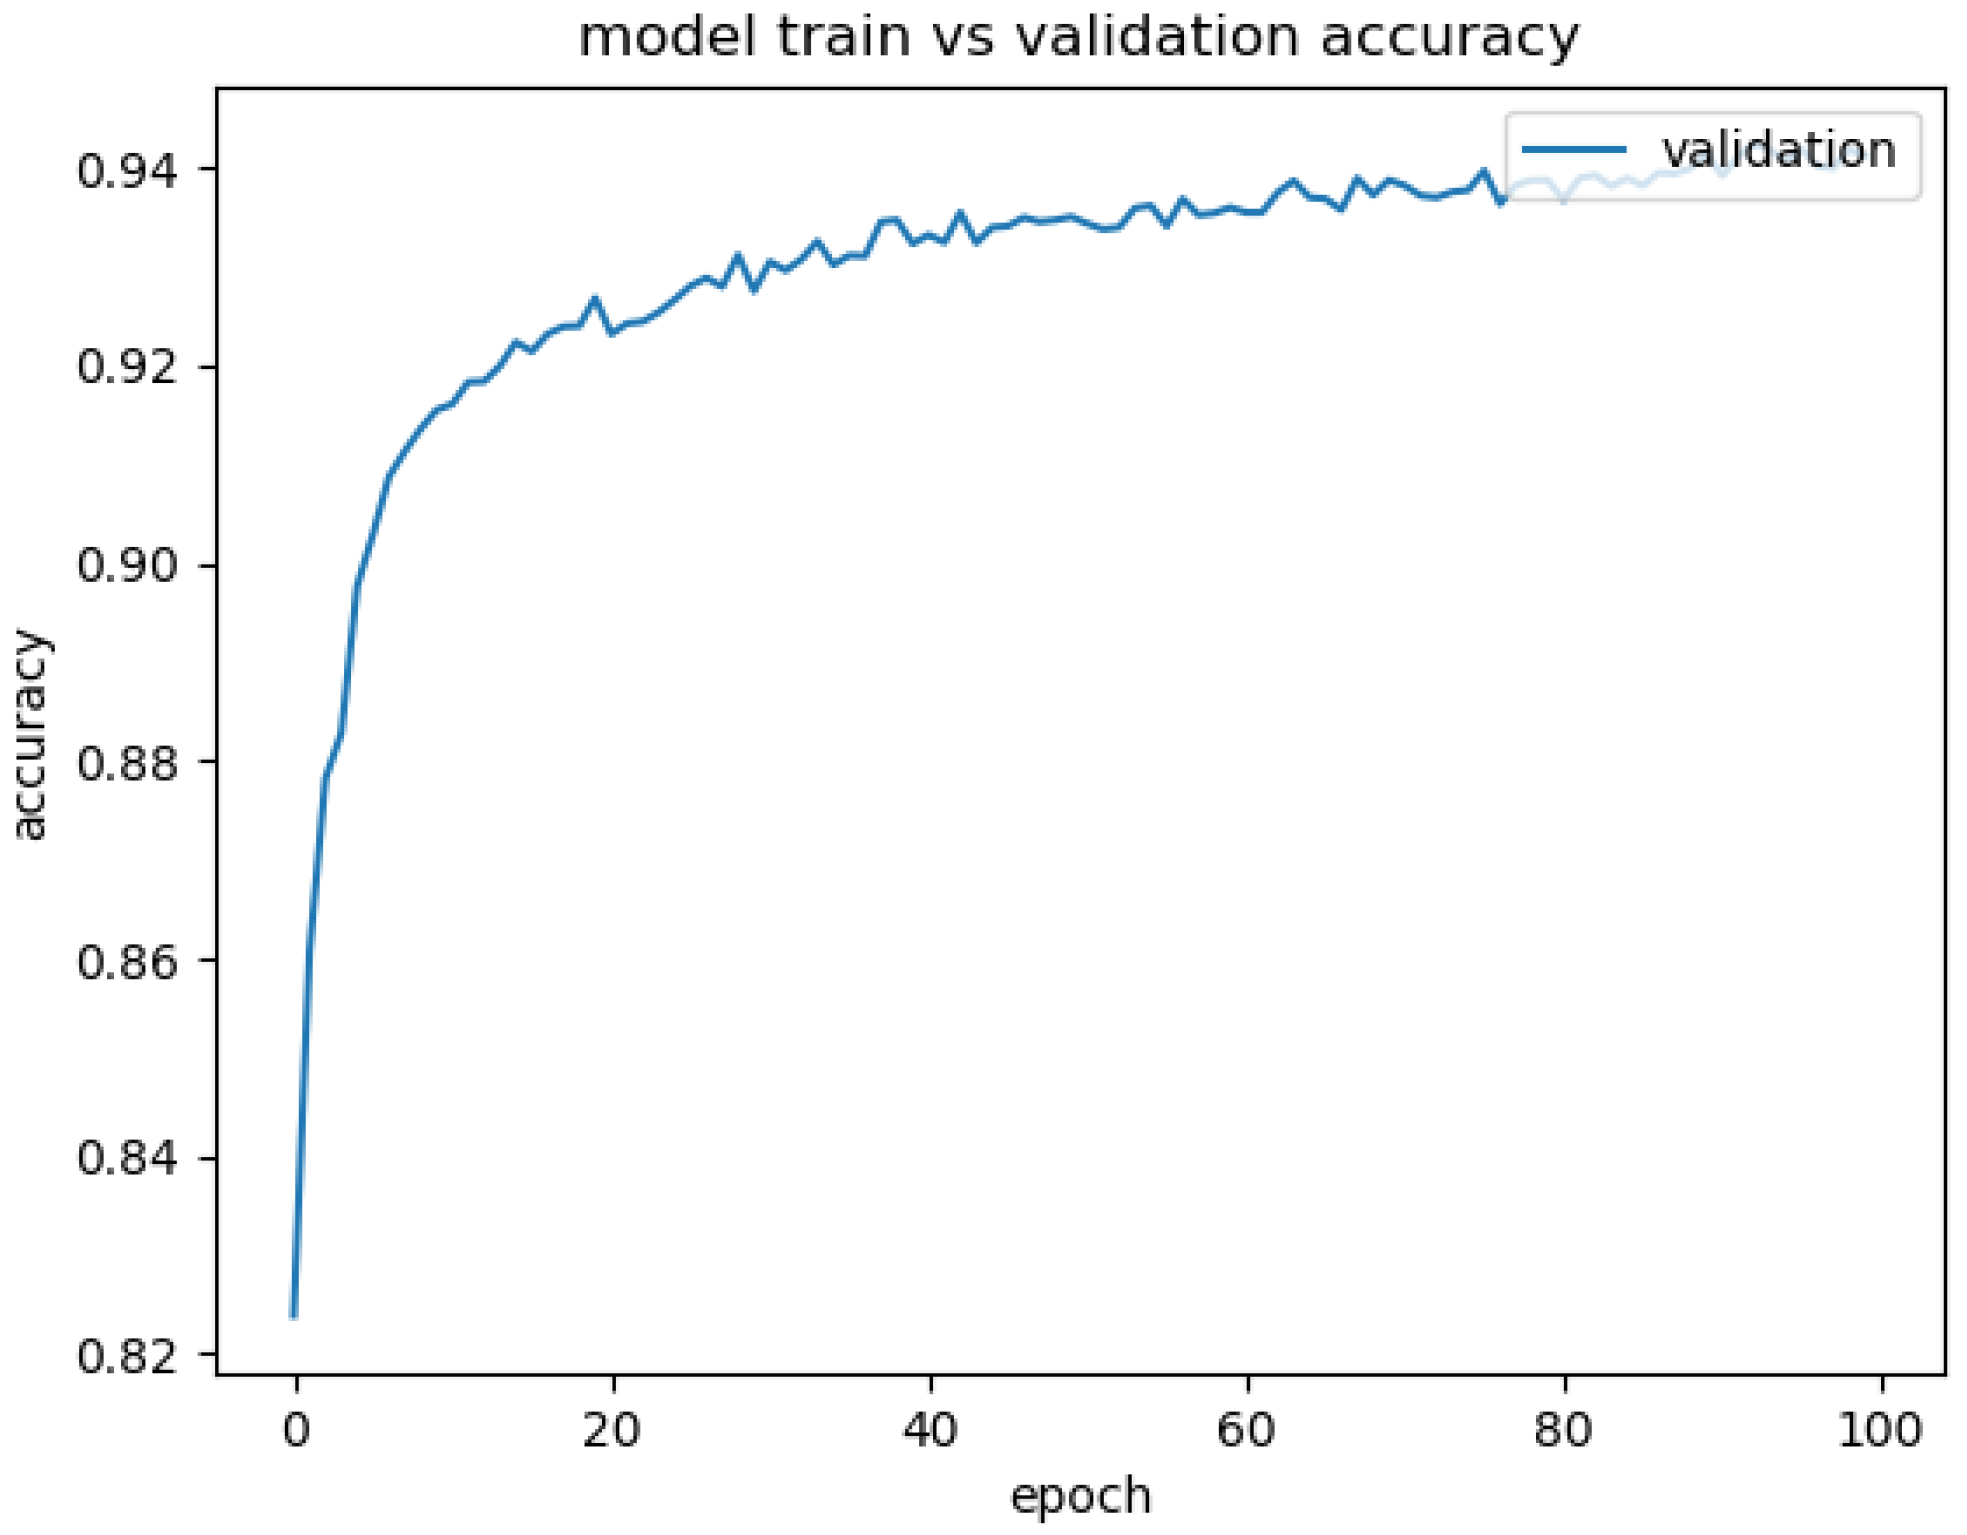
3.3. Convolutional Neural Network
4. Conclusions and Future Research
Author Contributions
Funding
Institutional Review Board Statement
Informed Consent Statement
Data Availability Statement
Conflicts of Interest
References
- Subasi, A.; Balfaqih, M.; Balfagih, Z.; Alfawwaz, K. A comparative evaluation of ensemble classifiers for malicious webpage detection. Procedia Comput. Sci. 2021, 194, 272–279. [Google Scholar] [CrossRef]
- Sayamber, A.B.; Dixit, A.M. Malicious URL detection and identification. Int. J. Comput. Appl. 2014, 99, 17–23. [Google Scholar]
- Jian, L.; Gang, Z.; Yunpeng, Z. Design and implementation of malicious URL multi-layer filtering detection model. Inf. Netw. Secur. 2016, 1, 6. [Google Scholar]
- Vundavalli, V.; Barsha, F.; Masum, M.; Shahriar, H.; Haddad, H. Malicious URL detection using supervised machine learning techniques. In Proceedings of the 13th International Conference on Security of Information and Networks, Merkez, Turkey, 4–7 November 2020; pp. 1–6. [Google Scholar]
- Rahman SS, M.M.; Islam, T.; Jabiullah, M.I. PhishStack: Evaluation of stacked generalization in phishing URLs detection. Procedia Comput. Sci. 2020, 167, 2410–2418. [Google Scholar] [CrossRef]
- Zeyu, L.; Yong, S.; Zhi, X. Malicious URL recognition based on machine learning. Commun. Technol. 2020, 53, 5. (In Chinese) [Google Scholar]
- Pham TT, T.; Hoang, V.N.; Ha, T.N. Exploring efficiency of character-level convolution neuron network and long short term memory on malicious URL detection. In Proceedings of the 2018 VII International Conference on Network, Communication and Computing, Taipei City, Taiwan, 14–16 December 2018; pp. 82–86. [Google Scholar]
- Chen, Z.; Liu, Y.; Chen, C.; Lu, M.; Zhang, X. Malicious URL detection based on improved multilayer recurrent convolutional neural network model. Secur. Commun. Netw. 2021, 2021, 9994127. [Google Scholar] [CrossRef]
- Li, T.; Kou, G.; Peng, Y. Improving malicious URLs detection via feature engineering: Linear and nonlinear space transformation methods. Inf. Syst. 2020, 91, 101494. [Google Scholar] [CrossRef]
- Kumi, S.; Lim, C.H.; Lee, S.G. Malicious URL detection based on associative classification. Entropy 2021, 23, 182. [Google Scholar] [CrossRef]
- Raja, A.S.; Vinodini, R.; Kavitha, A. Lexical features based malicious URL detection using machine learning techniques. Mater. Today: Proc. 2021, 47 Pt 1, 163–166. [Google Scholar]
- Joshi, A.; Lloyd, L.; Westin, P.; Seethapathy, S. Using lexical features for malicious URL detection—A machine learning approach. arXiv 2019, arXiv:1910.06277. [Google Scholar]
- Kang, C.; Huazheng, F.; Yong, X. Malicious URL identification based on deep learning. Comput. Syst. Appl. 2018, 27, 27–33. [Google Scholar]
- Yuan, J.T.; Liu, Y.P.; Yu, L. A novel approach for malicious URL detection based on the joint model. Secur. Commun. Netw. 2021, 2021, 4917016. [Google Scholar] [CrossRef]
- Le, H.; Pham, Q.; Sahoo, D.; Hoi, S.C. URLNet: Learning a URL representation with deep learning for malicious URL detection. arXiv 2018, arXiv:1802.03162. [Google Scholar]
- Yuan, J.; Chen, G.; Tian, S.; Pei, X. Malicious URL detection based on a parallel neural joint model. IEEE Access 2021, 9, 9464–9472. [Google Scholar] [CrossRef]
- Zhao, G.; Wang, P.; Wang, X.; Jin, W.; Wu, X. Two-dimensional code malicious URL detection method based on decision tree. Inf. Secur. Technol. 2014, 5, 36–39. (In Chinese) [Google Scholar]
- Liu, C.; Wang, L.; Lang, B.; Zhou, Y. Finding effective classifier for malicious URL detection. In Proceedings of the 2018 2nd International Conference on Management Engineering, Software Engineering and Service Sciences, Wuhan, China, 13–15 January 2018; pp. 240–244. [Google Scholar]
- Lin, H.L.; Li, Y.; Wang, W.P.; Yue, Y.L.; Lin, Z. Efficient malicious URL detection method based on segment pattern. Commun. J. 2015, 36, 141–148. (In Chinese) [Google Scholar]
- Gabriel, A.D.; Gavrilut, D.T.; Alexandru, B.I.; Stefan, P.A. Detecting malicious URLs: A semi-supervised machine learning system approach. In Proceedings of the 2016 18th International Symposium on Symbolic and Numeric Algorithms for Scientific Computing (SYNASC), Timisoara, Romania, 24–27 September 2016; IEEE: New York, NY, USA, 2016; pp. 233–239. [Google Scholar]

| Equipment | Version |
|---|---|
| Hardware | Windows10, Intel® Core™ i5-8250U CPU @ 1.60 GHz |
| Python | 3.7.0 |
| Tensorflow | 2.9.1 |
| Sklearn | 1.0 |
| Pycharm | 11.0.2 |
| Id | Url | Flag |
|---|---|---|
| 1 | http://www.gregorty.net/r4ff/ | p |
| 2 | http://www.charliedonutsstevens.com/npaf/uazh/old/np/mil/NFOAA_Auth/login/jsp | p |
| 3 | http://www.charliedonutsstevens.com/live/tmp/old/np/mil/NFOAA_Auth/login/jsp/ | p |
| 4 | https://secure.lcs-card.net/login | p |
| 5 | https://sotly.me/WaI/qr | p |
| 6 | https://olx-my.xyz | p |
| 7 | https://sotly.me/WaI | p |
| 8 | https://jaccs.co.jp.bjjygd.com/ | p |
| 9 | http://elongiveway.com | p |
| … | … | … |
| Reservechar | Otherchar | Digitcount | LongSubLetter | LongSubDigit | … | Flag |
|---|---|---|---|---|---|---|
| 5 | 4 | 12 | 11 | 9 | 0 | |
| 7 | 3 | 2 | 14 | 2 | 0 | |
| 6 | 3 | 9 | 8 | 6 | 0 | |
| 6 | 2 | 0 | 7 | 0 | 0 | |
| 12 | 4 | 6 | 5 | 2 | 0 | |
| 5 | 1 | 7 | 4 | 7 | 0 | |
| 5 | 3 | 6 | 5 | 6 | 0 | |
| 5 | 3 | 4 | 9 | 4 | 0 | |
| …… | …… | …… | …… | …… | … | …… |
| 7 | 4 | 9 | 9 | 7 | 1 | |
| 7 | 4 | 14 | 7 | 3 | 1 | |
| 6 | 2 | 5 | 6 | 3 | 1 | |
| 7 | 3 | 7 | 6 | 7 | 1 | |
| 3 | 1 | 0 | 9 | 0 | 1 |
| Model | Convolution Kernel | Pooling Kernel | Stride | Channel Size |
|---|---|---|---|---|
| Model A | 1 × 5 | 1 × 2 | 1 | 32 |
| Model B | 1 × 5, 1 × 5 | 1 × 2, 1 × 2 | 1 | 32, 32 |
| Model C | 1 × 5, 1 × 5 | 1 × 2, 1 × 2 | 1 | 64, 64 |
| Model | Model A | Model B | Model C |
|---|---|---|---|
| Accuracy | 93.64 | 93.72 | 93.99 |
| Loss | 0.191 | 0.180 | 0.169 |
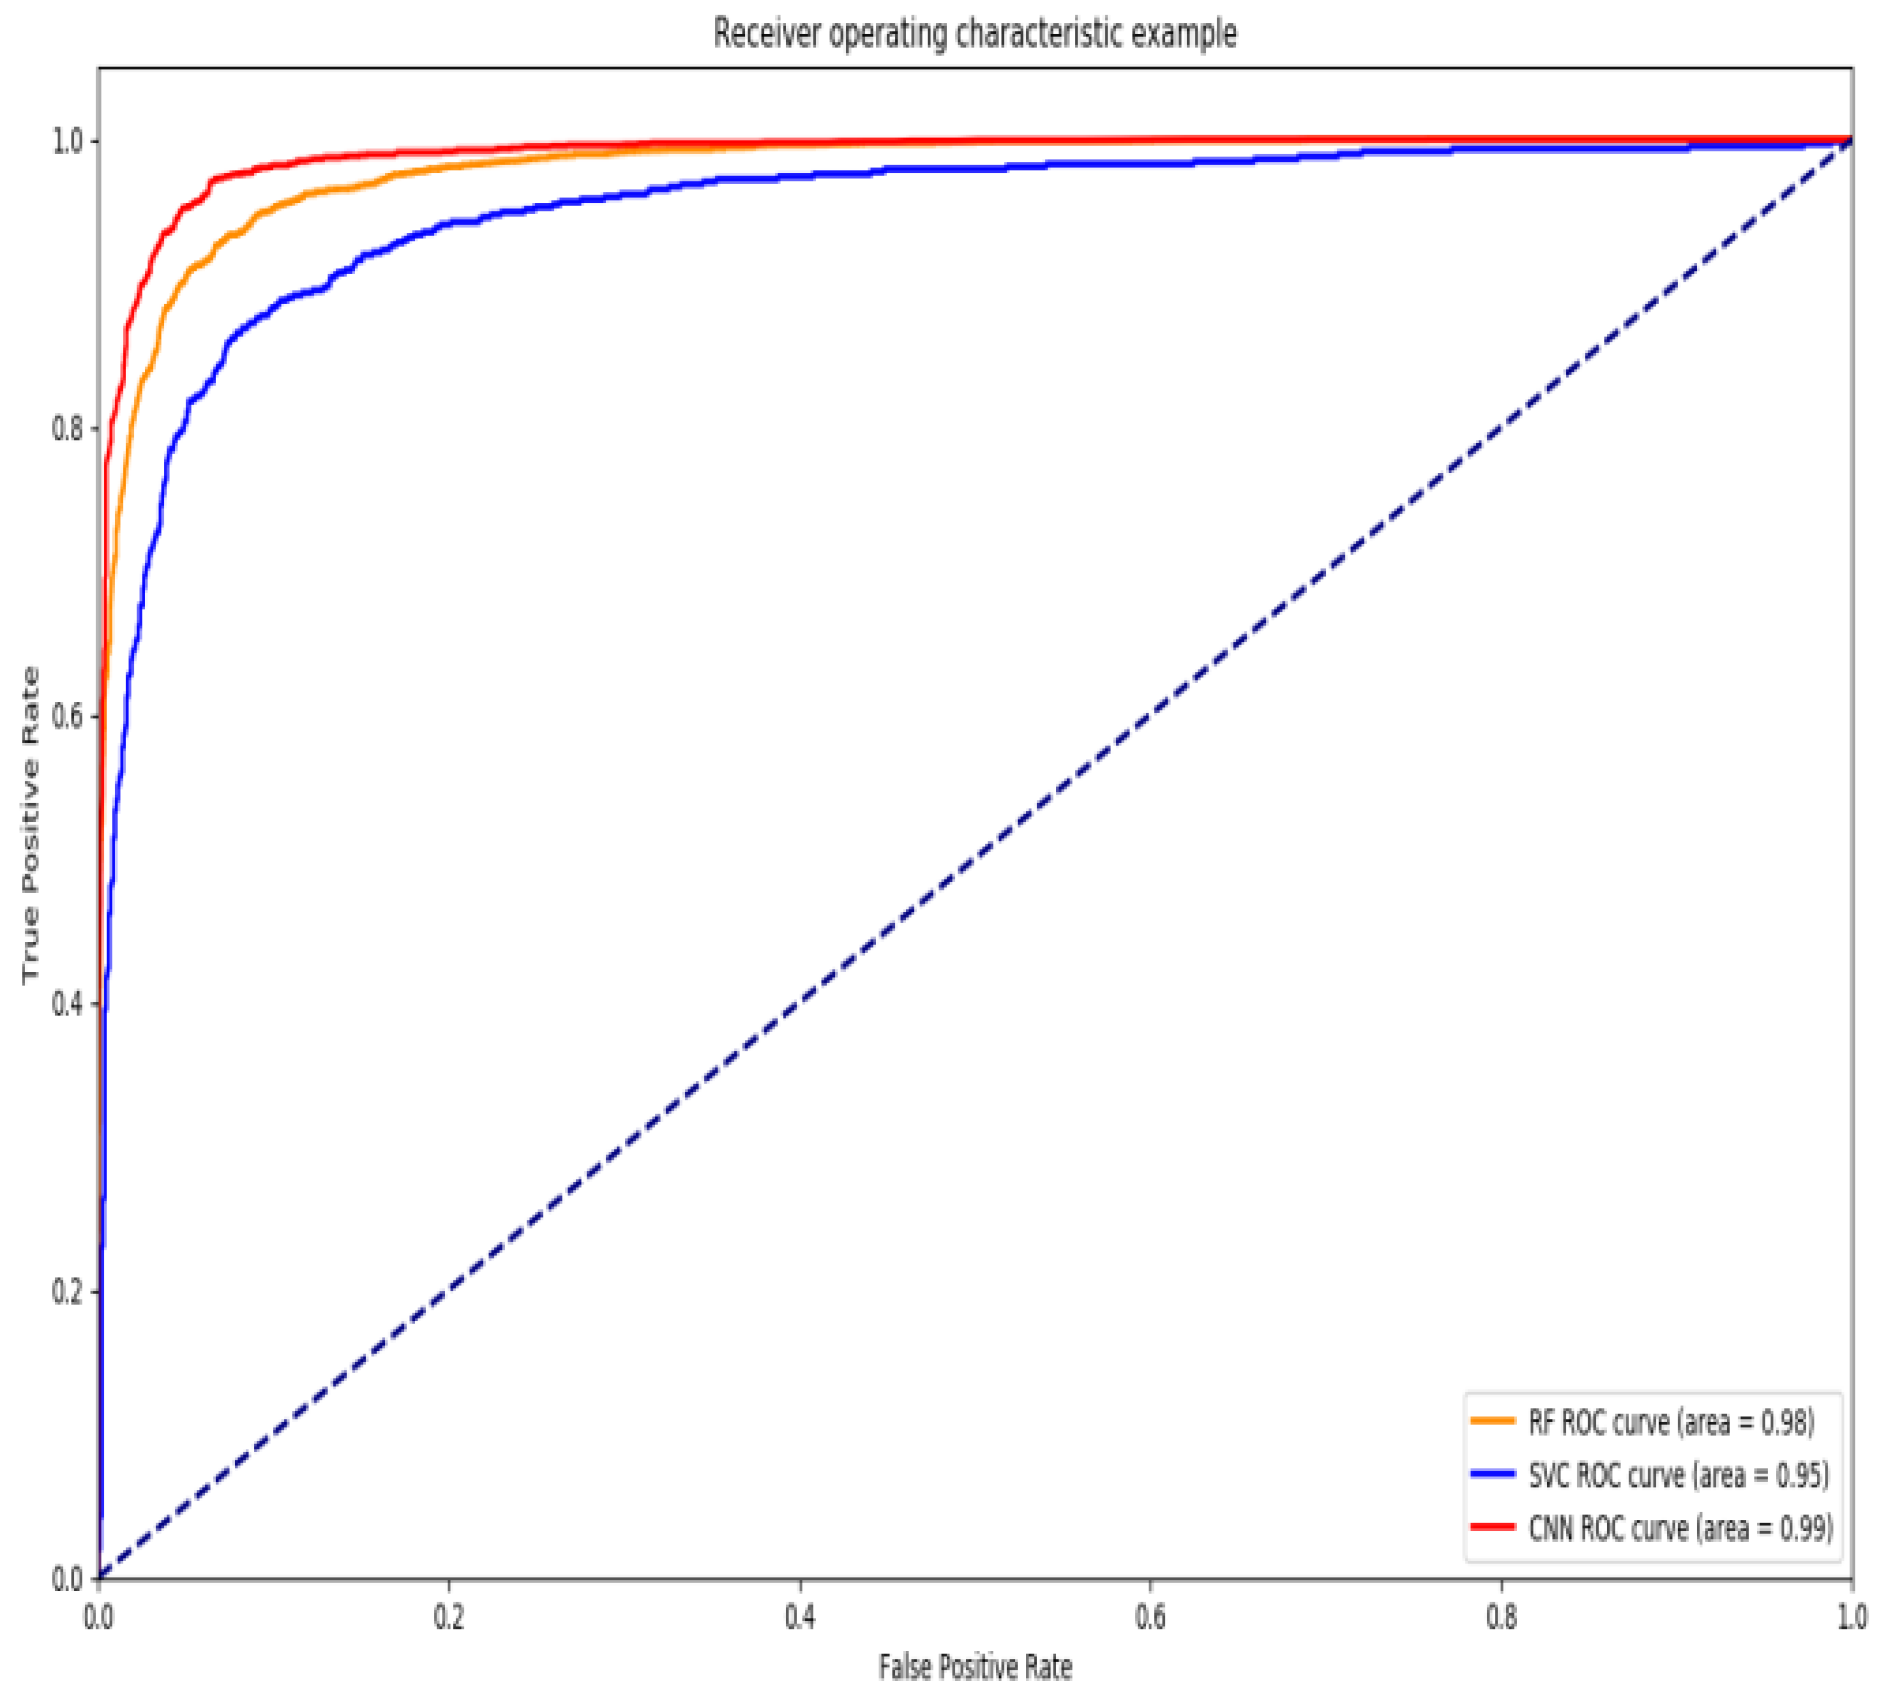
| Model | KNN | GaussianNB | LogisticRegression | SVC | CNN | CNN (GA) |
|---|---|---|---|---|---|---|
| Accuracy | 0.921 | 0.715 | 0.896 | 0.915 | 0.932 | 0.940 |
Publisher’s Note: MDPI stays neutral with regard to jurisdictional claims in published maps and institutional affiliations. |
© 2022 by the authors. Licensee MDPI, Basel, Switzerland. This article is an open access article distributed under the terms and conditions of the Creative Commons Attribution (CC BY) license (https://creativecommons.org/licenses/by/4.0/).
Share and Cite
Wu, T.; Xi, Y.; Wang, M.; Zhao, Z. Classification of Malicious URLs by CNN Model Based on Genetic Algorithm. Appl. Sci. 2022, 12, 12030. https://doi.org/10.3390/app122312030
Wu T, Xi Y, Wang M, Zhao Z. Classification of Malicious URLs by CNN Model Based on Genetic Algorithm. Applied Sciences. 2022; 12(23):12030. https://doi.org/10.3390/app122312030
Chicago/Turabian StyleWu, Tiefeng, Yunfang Xi, Miao Wang, and Zhichao Zhao. 2022. "Classification of Malicious URLs by CNN Model Based on Genetic Algorithm" Applied Sciences 12, no. 23: 12030. https://doi.org/10.3390/app122312030
APA StyleWu, T., Xi, Y., Wang, M., & Zhao, Z. (2022). Classification of Malicious URLs by CNN Model Based on Genetic Algorithm. Applied Sciences, 12(23), 12030. https://doi.org/10.3390/app122312030