Review

Thermal Characterization of Phase Change Materials by Differential Scanning Calorimetry: A Review

1
Mechanical Engineering Department, Université de Sherbrooke, Sherbrooke, QC J1K 2R1, Canada
2
Chemistry Department, Université de Sherbrooke, Sherbrooke, QC J1K 2R1, Canada
*
Author to whom correspondence should be addressed.
Appl. Sci. 2022, 12(23), 12019; https://doi.org/10.3390/app122312019
Submission received: 5 November 2022 / Revised: 21 November 2022 / Accepted: 22 November 2022 / Published: 24 November 2022

Abstract

:
The use of phase change materials (PCMs) in thermal energy storage (TES) applications as a system that can fill the gap between the energy supply and demand has sharply increased over recent years. Due to the dependence of the storage capacity in a TES on the transition (mostly solid/liquid) of PCMs, knowing the thermal properties of PCMs is of high importance. Calorimetric methods have an inevitable role in PCMs’ characterization methods. The most important properties of PCMs that lead us to integrate them in a specific application can be determined by the calorimetric method. These properties are transition temperatures, the enthalpy of transition and the heat capacity. Among the calorimetric methods, differential scanning calorimetry (DSC) is widely available and accurate results can be obtained at a reasonable cost. Furthermore, the thermal stability of PCMs can be determined after a hundred cycles of melting and solidification. The present work proposes an extensive and comprehensive review on calorimetric measurements of PCMs via the DSC method. The objective is to highlight the relevant research with a focus on DSC characterization of PCMs. This review includes studies from 1999 to 2022 and provides a summary of the methods, results and recommendations for future measurements.

1. Introduction

Presently, due to the remarkable increase in the world’s population, balancing energy supply and demand is becoming more important. A vast amount of the energy we use is in the form of heating and cooling [1]. Furthermore, around 90% of main energy sources are consumed and wasted in the form of thermal energy [2]. Thus, to avoid an unbalanced situation that may lead to irregular fossil fuel consumption and its catastrophic environmental impacts, energy has to be stored when available to use it later when the demand is high. Today, the knowledge of harvesting energy from renewable resources excites the scientific community and related technology is being developed. However, the main issue that remains challenging is how to store energy. Thermal energy storage has the potential to mitigate the gap between energy supply and demand and flatten the fluctuations in heat sources [3]. Furthermore, there is high potential for Industrial Waste Heat (IWH) recovery in the world, and waste heat is usually associated with CO2 emissions. For example, Canada and Turkey are among the highest in terms of wasted energy consumed in industrial sectors at over 26% and 17%, respectively [4]. By benefiting from latent heat thermal energy storages (LHTES) working with phase change material (PCM), one can tackle the mentioned energy problem and avoid millions of tons of CO2 emissions simultaneously. However, the selection of the appropriate PCM remains crucial to properly design a PCM-based thermal storage system. There are many factors to consider in selecting a PCM, such as safety for humans and the environment, economics and technical aspects related to its thermophysical properties (transition temperature, enthalpy, thermal conductivity and dynamic viscosity). The mentioned properties can be obtained by conventional or unconventional methods. In the current review paper, we focus on the studies on calorimetric measurement techniques for PCMs. The technical properties obtained by calorimetric methods are transition temperature, enthalpy and specific heat. A correct measurement of these parameters is one of the primary steps before considering PCMs [5] in real-life situations. Therefore, regardless of the final PCM application (for storing heat or controlling temperature), its calorimetric evaluation is required to achieve its maximum capacity [6]. Calorimetric measurements using different methods and instruments are currently conducted to evaluate the ability of a material to store and release energy as a function of temperature [6]. Differential scanning calorimetry (DSC) is a standard widely used technique to select PCMs for a particular application by evaluation of their thermal properties, including transition temperature, enthalpy and specific heat [7,8]. DSC is also used to study the thermal stability of PCMs by monitoring their thermal performance during cycles of melting and solidification. However, there is a limitation regarding DSC technique for PCM characterization, which is the dependency of the results on the type of DSC machine and test conditions. To address this problem, different methods and standards are defined and each suggests some recommendations to produce reliable results. This study reviews the literature that establishes a method or recommends a protocol to measure PCMs’ properties by DSC and discusses the limitations and advantages of each method. The focus of this review is more on DSC characterization methods of PCMs and the related challenges, rather than reporting the measurement results. The Engineering Village platform (Elsevier) provides access to all related articles from different databases such as Science Direct, Springer, etc. The main keywords to find the articles were (PCM, DSC, TES, enthalpy, melting point and heat capacity). In the references, there are articles from 1990 to 2022. However, due to the novelty of PCM thermal characterization, most articles referred to have been published within the last ten years. The interested reader can refer to the different reviews on phase transition enthalpies of salt hydrates [9], on the T-history method to characterize the properties of PCMs [10], on the synthesis and characterization of nanoencapsulated PCMs [11], on thermal properties of inorganic PCMs (MnCl2·4H2O) using DSC and a heat flow meter [12], and on the calibration and introduction of new reference materials [6].

2. Phase Change Materials and Base Concepts

PCMs are materials that can store and release a significant amount of heat during their phase transition [6]. For example, water (ice) can be considered as a PCM, as 1 kg of ice needs around 333 kJ of heat to melt at around 0 °C [13]. A phase change occurs between different states of a material such as solid/solid, solid/liquid, solid/gas or liquid/gas, in which the solid/liquid transition is more promising compared to others due to the ability to store a high amount of energy in a small volume. Thermal energy is stored mainly by three types of storage systems, including sensible, latent and thermochemical heat storage [14]. Each of these technologies has its own advantages and disadvantages. For example, latent thermal energy storages have larger energy density compared to sensible storages, and lower development complexity compared to thermochemical storages. PCMs can be categorized into three groups: organic, inorganic and metallic. They can also be obtained by a eutectic combination of the mentioned groups [13]. When the technical properties of PCMs, including the operating temperature and the latent heat, overlap, among the following types of PCMs the preferred option would be organic ones, as they are often less hazardous and less corrosive [15]. According to the unique thermal storage capacity of PCMs, they are already applied in two categories of thermal storage and thermal control systems at low temperatures. Furthermore, the PCMs have high potential at higher temperature applications (100–400 °C). Several examples for each application are listed in Table 1. More information about PCMs’ applications can be found in the review proposed by Lone and Jilte [16]. In the present one, the focus is on the determination of some thermophysical properties of PCMs during their solid–liquid phase change. PCMs provide a high amount of energy in a narrow temperature range. In order to integrate a PCM in a given application, one has to select a suitable PCM based on the application’s requirements considering the technical, economic and environmental aspects [17]. Table 1 displays the properties of a suitable PCM. As can be seen in Figure 1, the dashed line shows a phase change characteristic for an ideal PCM, while the phase change phenomenon occurs over a temperature range instead of a single temperature point for most of the PCMs (continuous line). Equation (1) describes the contribution of each sensible heat of solid and liquid, as well as the latent heat to the total stored thermal energy.
Q = m [ T 1 T m C p , s o l i d · d T + Δ h + T m T 2 C p , l i q u i d · d T ]
where Q represents the thermal energy (J), h the enthalpy (J), Cp the specific heat capacity (J·g−1·°C−1), m the mass (kg), T the temperature (K).

3. Calorimetric Characterization

Calorimetric measurements play an important role in characterizing PCMs. The main property of a PCM for a potential application is indeed its thermal storage capacity. Generally, as stated by Mehling and Cabeza [18], methods that determine the change of heat in different processes and different materials are called calorimetric methods. Thus, the heat flow into or out of a sample and the related temperature change can be determined with a calorimetric measurement. A calorimeter supplies heat to the sample via an electrical or thermal resistance heater [18]. In this section, we introduce the various calorimetric methods and the corresponding measurement conditions, such as calibration, temperature program, challenges of PCM characterization and calorimetric data communications.

3.1. Calorimetric Methods

In order to study PCMs from a calorimetric point of view, there are several methods and types of equipment, as listed in Table 2. These methods are different in terms of measurement principle, sample size and calibration process, leading to different result accuracy levels. A key parameter remains the size of the tested sample, which has to be large enough to be representative of the PCM. Furthermore, kinetic properties such as crystal growth, phase separation and subcooling are size dependent properties. Thus, in order to measure a sample with different size scales, one should use different methods such as DSC for milligram size samples, T-history at the gram scale and pilot plants in the case of testing kilograms of PCMs. According to the measuring principles, DSC machines are divided into heat–flux DSC (hf-DSC) (measurement of exchanged heat between sample and environment) and power compensation (the heat to be measured is compensated by electrical energy) [19]. In the hf-DSC method, a sample and a reference are subjected to a controlled environment (air, nitrogen, helium, etc.) and a temperature program (heating, cooling and holding isothermally), that lead to a change in both the sample and reference temperatures [20]. The difference in the heat flow rate to a sample and to a reference, as a result of the sample temperature change, is measured by sensors embedded in the DSC machine [19]. In another definition, a DSC machine measures the energy change occurring in the sample while it is heated, cooled or held isothermally [21]. This energy change is connected to a chemical reaction or physical transition, which consumes or generates heat. Thus, measuring this energy change enables us to quantitatively measure the reactions and transitions occurring in the sample [19,21]. An operator of a DSC machine should always consider some parameters such as DSC calibration, atmospheric conditions, sample mass and properties, and temperature program. The theoretical principle of hf-DSC will be explained in the following section.
As mentioned earlier, in the DSC method one is limited to testing a few milligrams of a sample, which might be not representative for an inhomogeneous material. Larger samples can be measured with the T-history method. The T-history is a method used to determine the stored heat as a function of temperature for larger samples using self-built equipment [22]. This method was firstly proposed by Zhang et al. [23] (Figure 2a). Both sample and reference are symmetrically placed in a controlled environment that is subjected to an abrupt temperature change. From the response of the known reference to the temperature change, the heat flow is determined. The heat flow to the sample and subsequent enthalpy curve can be calculated. This method was then modified by Marín et al. [24] and Lázaro et al. [25]. They modified the heat transfer between (sample/reference) and the ambient by using insulated test tubes for sample and reference in order to establish a more isothermal condition. From Figure 2b, one can see a modified version of the T-history set-up equipped with a fan and heat exchanger to maintain the ambient temperature under isothermal conditions [18]. As stated by Mehling and Cabeza [18] and Solé et al. [10], the main advantages of the T-history method can be listed as follows:
The most important one is the ability to measure large samples.
Note that in the following, small samples contain typically tens of milligrams while large samples are of the order of tens of grams;
Due to the fast heating up/cooling down process, less time is consumed in the range where little heat is stored;
The obtained signal is not dependent on the heating rate, so the signal/noise ratio is always high.
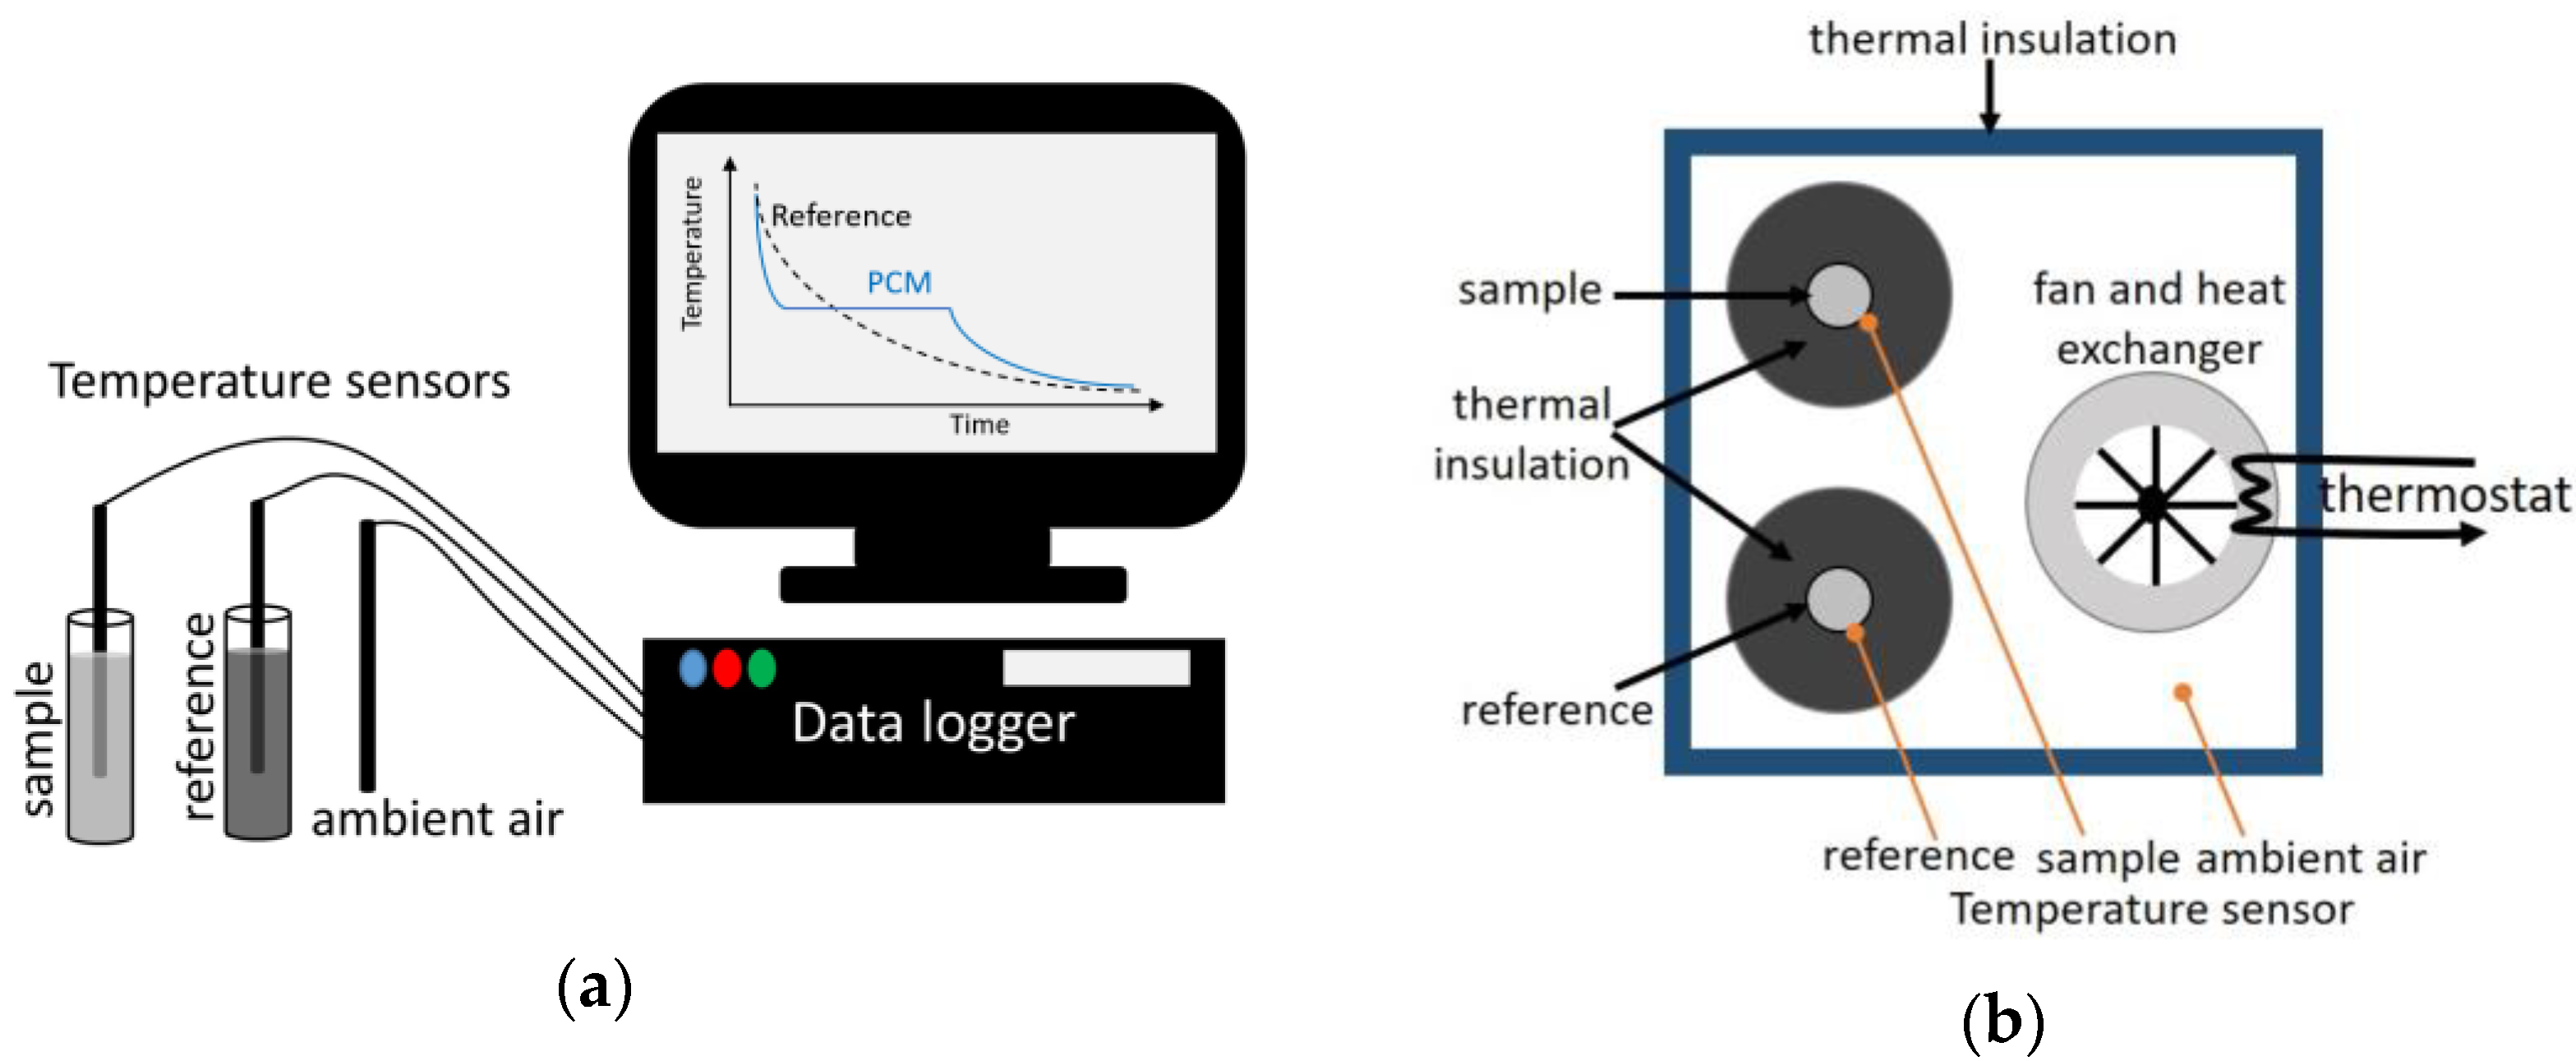
Figure 2. Schematic of T-history set-up adapted from [18]: (a) early T-history set-up from 1999; (b) the modified set-up from 2006 fabricated at the Bavarian Center for Applied Energy Research (ZAE Bayern).
Applsci 12 12019 g002
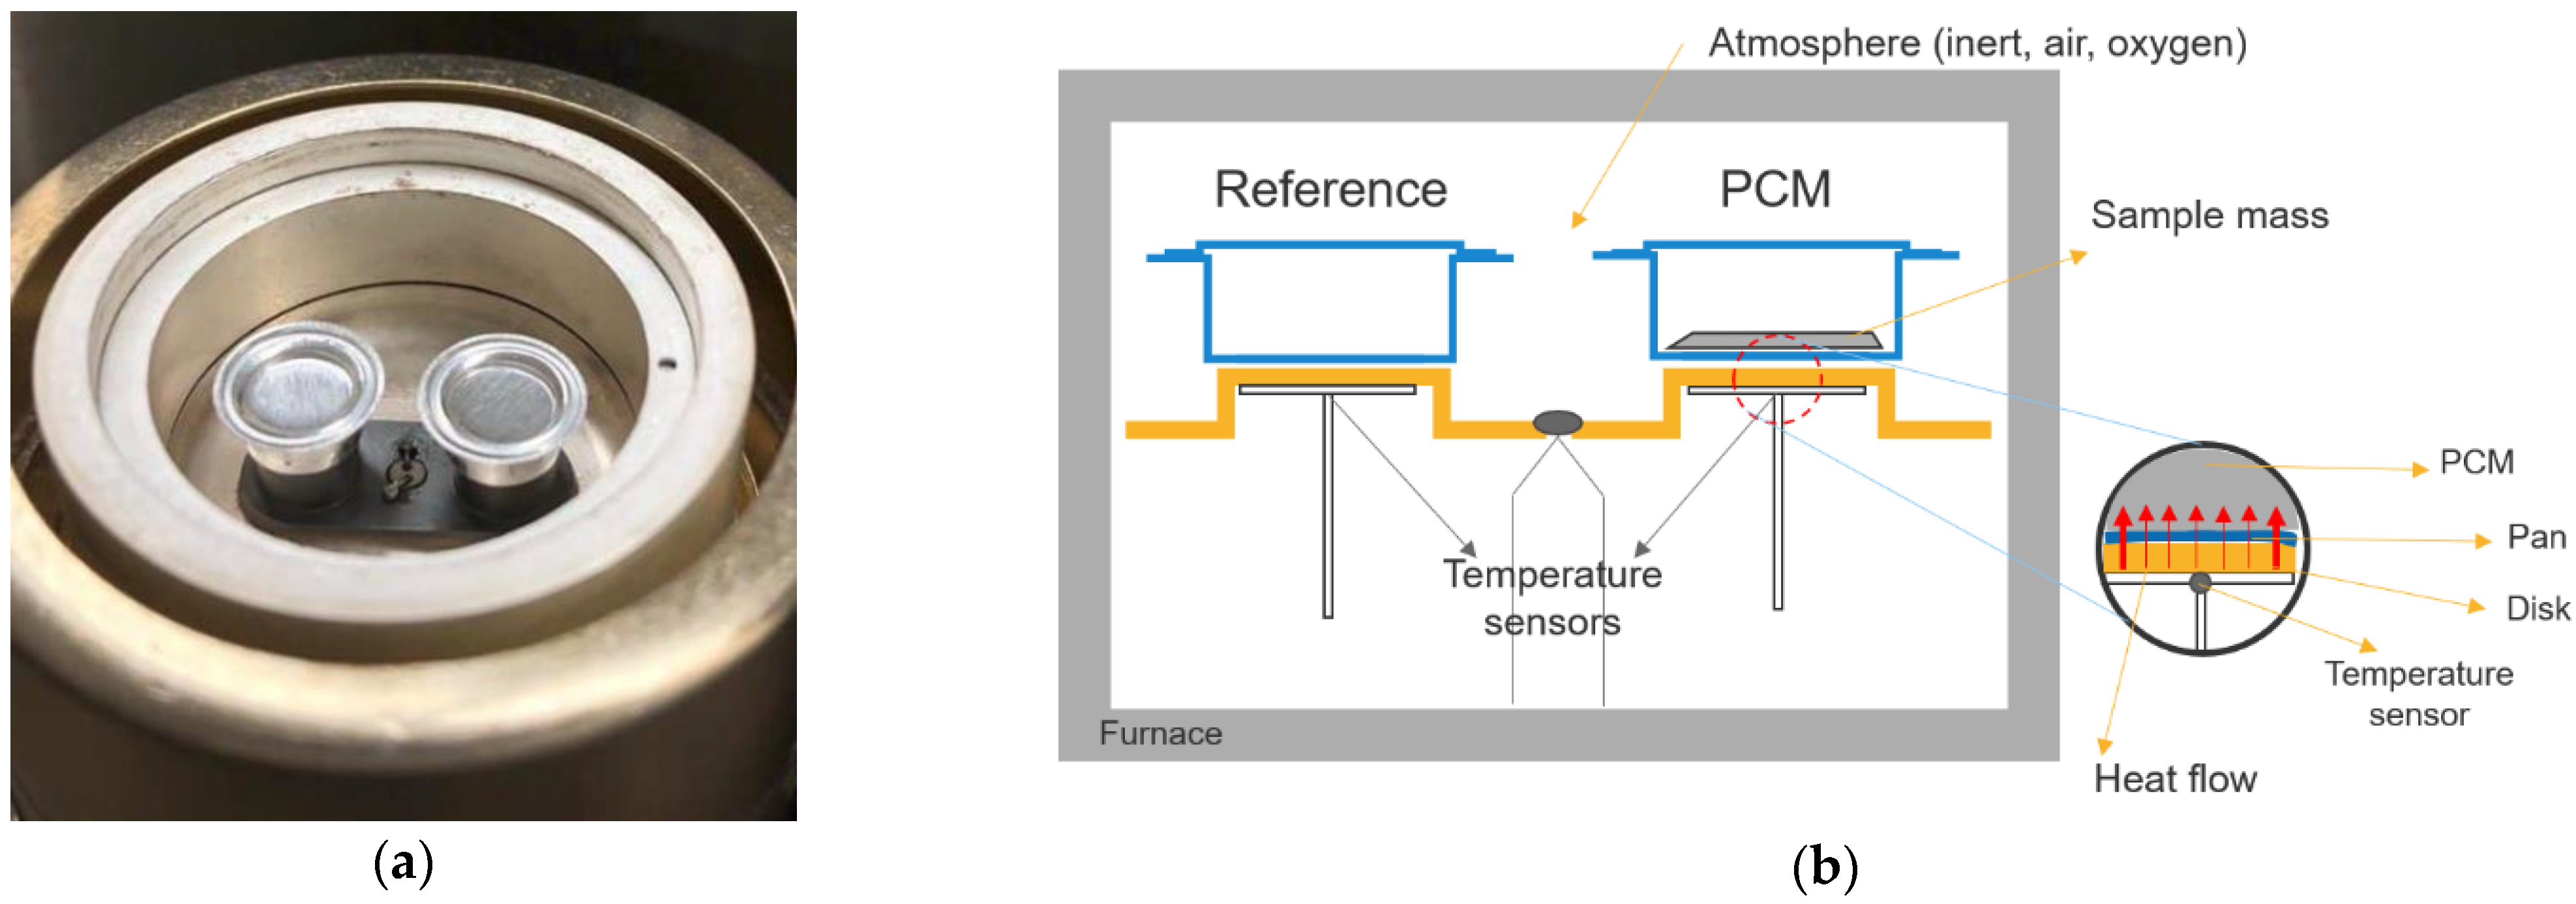
The three layer calorimeter (3LC) is an instrument specially built to measure heat capacity, melting enthalpy and phase transition of PCMs [6]. In this method, 100 g of a PCM can be tested in a box-shaped container. Thus, the measurement condition is close to the actual application [26]. In DSC, T-history and 3LC, heat is supplied by a thermal resistance. In this review, according to the widespread use of heat-flux DSC (Figure 3), we focus more on the research carried out by the mentioned DSC. The other calorimetric method relies on the supply of heat Q ˙   (W) to the sample by electrical heating:
Q ˙ = Δ h = P e l ·   Δ t = U · I · Δ t
where Pel is the electric power (W), t the time (s), U the voltage difference (V) and I electrical current (A).
In this method, there is no heat exchange between the sample and the ambient. Thus, the calorimeters that measure based on this principle are known as Adiabatic Calorimeters (AC), and the heat flow calibration is not needed [6]. In this method, the finite heat pulse is applied to give finite ΔQ. It appears highly time-consuming and requires preparation, but it is essential for measuring the heat capacity of reference materials such as sapphire or copper. Thanks to the near-equilibrium condition, the adiabatic calorimetry is mostly used for exact measurement of reference materials [27]. In 1970, the Adiabatic Scanning Calorimetry (ASC) was introduced and the heat was supplied using a constant electrical power (constant rate) instead of a finite pulse. This constant rate leads to continuous curves of enthalpy and heat capacity. Both AC and ASC require careful training to operate. The modern type of adiabatic calorimeter is equipped with a sensitive temperature detector that establishes a temperature equality between sample and adiabatic shield and is known as Peltier-element-based ASC (pASC) [6]. Finally, thermal conductivity measurement methods were updated for calorimetry of large samples, PCM composite and encapsulated PCM [6]. A summary of calorimetric methods is proposed in Table 2.
Table 2. Summary of the different calorimetric methods.
Test Type Sample SizeCalibrationAdvantagesDisadvantagesReferences
Heat-flux DSC(10–100 µL)All reference materials for melting point and enthalpy, and sapphire for heat capacityWidely available, wide temperature range from sub-ambient to hundreds of degreesSmall sample size
Unsuitable for PCM composite and PCM with subcooling
[6]
T-history(10–20 mL)Water (Cp),
Copper (Cp), Indium (T, Δh) [28]
Self-built, can cover large samples
Suitable for heterogenous material, volume dependent behavior
Fast heating up/cooling down
High signal to noise ratio
Time-consuming (one heating/cooling cycle can be done within a day)
Narrow temperature range compared to DSC
[6,10,22,28,29]
3-layer calorimeter (3LC)(100 mL)Only by the manufacturer with (water and hexadecane) Uniquely built for large samples of PCMOnly available from a single company
Temperature range (-20 to 100 °C)
Time-consuming
[6,26]
Adiabatic calorimetry
Adiabatic scanning calorimetry (1970)
Peltier-element-based ASC (pASC)
Tens of mg in pASC Do not need calibrationHeat flow calibration is not neededCan only measure during heating cycle, not during cooling[30,31,32,33,34]
Heat flow meter (HFM), guarded hot plate (GHP), and longitudinal guarded comparative calorimeterLarge samplesASTM C1784-14 [35] was developed for HFM method
Stainless steel [36]
Large samples, PCM composite or encapsulated PCM Non-conventional method[36]
As mentioned earlier, a calorimeter can supply heat into the sample by electrical or thermal resistance [17]. In heat-flux DSCs, heat is supplied to the sample through a thermal resistance (Rth in K·W−1) and the differences between the ambient of the furnace and the sample Q ˙ a s , and the ambient of the furnace and the reference Q ˙ a r , are measured using Equations (3) and (4). Therefore, the difference between the heat flow into the sample and the reference is given by Equation (5).
Q ˙ a s = 1 R t h ( T a T s )
Q ˙ a r = 1 R t h ( T a T r )
Q ˙ = Q ˙ a s Q ˙ a r = 1 R t h ( T r T s )
where the indexes a, r and s stand for the ambient, reference and sample, respectively.
It can be observed in Equation (5) that the heat flow difference Q ˙ is not dependent on the ambient temperature [17]. Considering the isothermal condition for the sample and reference, one gets:
Q ˙ a s = Q s ˙ = C s d T s d t
Q ˙ a r = Q r ˙ = C r d T r d t
where C is the mass heat capacity (J·K−1).
Assuming the same heating rate (β in °C·min−1) in DSC’s furnace (sample, reference and ambient), Equation (9) is obtained:
β = d T s d t = d T r d t = d T a d t
Q ˙ a s Q ˙ a r = d T s d t C s d T r d t C r = β ( C s C r )
The proportionality of the temperature difference ΔT between the sample and the reference to their heat capacities can be noticed by combining Equations (5) and (9):
β ( C s C r ) = 1 R t h ( T r T s )
Δ T = ( T r T s ) = R t h β ( C s C r )
The value of the thermal resistance (Rth) is determined by calibration with a reference material, such as indium, tin, etc [18]. In order to represent enthalpy, the first step is to determine the specific heat capacity using Equation (13). The heat flow difference is measured by the DSC and the sample mass and heating rate are known.
Q ˙ ( T ) = m c p d T d t
c p = Q ( T ) ˙ m β
By multipling the specific heat capacity and the temperature difference, the value of enthalpy at each point is obtained. Thus, by adding the enthalpy value at each point, one gets the total enthalpy over the temperature range. That is the most important plot in PCM’s studies.
Δ h ( T n ) = T n T n + 1 c p ( T ) d T

3.2. Calibration Step and Measurement Accuracy

Calibration is a crucial part of a DSC measurement and its purpose is to link the measured properties to the actual values [19,27]. A reference material with a certified value is measured by a calorimetric method. There is a difference between the known value and the signal received by a sensor; this relation is called signal–value function [6]. The establishment of the signal–value function is called calibration. There are some uncertainties in every measurement due to the different sources of errors, such as the operator, the machine and test conditions. Achieving a high precision in calorimetric experiments means higher cost and longer time. Therefore, there should be always a balance between the acceptable uncertainty of each measurement and the devoted time and costs [22]. The temperature and amount of heat are the properties that must be calibrated in calorimetric measurements with a reference material. Furthermore, reference materials can be used to compare the measurements and for validation of instrument and method. Measuring materials with known values from the literature (not certified value) can be useful to ensure the validity of test conditions, especially when the suitable reference materials are not available. As mentioned earlier, the DSC machines, which supply heat electrically, do not need to be calibrated. However, these DSCs are not widely available and they cannot be used for cooling. Thus, this section is focused on the DSC operated by thermal resistance heating. The value of thermal resistance should be known to assess the measurements. This value is usually determined by calibration using standard materials with known values. The test conditions, such as atmosphere conditions, heating rate and type of crucible, should be exactly the same during the calibration and sample measurement [37]. The procedure of calibration is different for each DSC from different manufacturers. Hence, the instructions in the manual of the machine have to be considered. Most calibrants used in DSC measurements are metals due to the sharp transition peak around the melting point and enthalpies measured by AC. Indium is one of the most frequently used metals for temperature and enthalpy calibration, and it can be used many times [27,38]. Charsley et al. [27] experimentally studied the calibration of a DSC machine by comparing a metallic reference (indium) with an organic compound. In order to have a better assessment, both materials are selected from the same temperature range (indium, 156.61 °C) and (diphenylacetic acid, 147.19 °C). The measurements were conducted for both operating modes (dynamic and stepwise). Furthermore, the influence of the sample form (solid or powder) and the pre-melting option on the measurement were studied. In the case of pre-melting, it was found that if the sample pellet is not thin or flat inside the crucible, the melting temperature decreases from the first cycle to the second one. Therefore, pre-melting the sample would increase the reliability of the measurements [27]. Regarding the form and state of calibrants, due to different storage conditions and the presence of oxygen, it is recommended to use solid samples. Charsley et al. [27] concluded that by calibrating DSC with indium, one can obtain accurate results on organic compounds in the same temperature range. Furthermore, indium can be re-melted at least twenty times without a considerable change in its properties and, due to the smaller heat capacity, leads to less uncertainty compared to diphenylacetic acid [27]. Su et al. [39] calibrated a DSC by high purity metals, including gallium, indium, and tin, considering various regression models from 0th-order (single calibrant) to 2nd-order (three calibrants). The temperature and enthalpy of paraffin (n-eicosane) as a PCM was measured to evaluate the accuracy after each calibration. They concluded that multipoint calibration with three reference materials is much better than a two or single point calibration, because it could minimize the temperature inaccuracy over a wide temperature range. In the case of a single point calibration, a good accuracy can still be achieved if the reference is selected according to the target temperature [39]. Moreover, even in multipoint calibration, selecting the reference materials while considering the temperature range of interest leads to more accurate results. Furthermore, different heating rates (1, 2, 5 and 10 °C/min) were considered in measurements of reference materials, and it was observed that the temperature range becomes broader by increasing the heating rate. Overall, low heating rates lead to more uniform results in terms of melting temperature. Regarding DSC’s temperature calibration, it is recommended to perform it with at least three reference materials in the temperature range of interest (one at lower temperature, one close to the PCM transition range and one at upper temperature range). However, Mehling et al. [6] concluded that the number of existing reference materials is insufficient to cover the expanding temperature range of PCMs (−40 to 400 °C). Furthermore, the existing metallic calibrants are too expensive for large-scale calibration in methods such as T-history. Therefore, they conducted a study to introduce and recommend new reference materials [6]. In the range from −10 to 30 °C, water at 0 °C and n-alkanes including C12 at −10 °C, C14 at 6 °C, C16 at 18 °C and C18 at 28 °C could be used for temperature and enthalpy calibration. Biphenyl might be used in the range lower than indium temperature at 68.9 °C. For Cp calibration, mixtures of water–salt, water–alcohol and n-alkanes in liquid state might be used. However, one has to consider that these materials are not certified references, but detailed and accurate information on them could be found. Several DSC calibrants at different temperatures can be seen in Table 3. Price [38] studied the crystal–crystal transition point of ammonium salts to calibrate DSC temperature. It was concluded that ammonium dihydrogen phosphate (−121.4 °C) and ammonium sulphate (−48.8 °C) can be considered for subambient temperature calibration.
Pishchur and Drebushchak [40] investigated the influence of crucible position on the value of enthalpy with two different measurement procedures: procedure A, without replacing the crucible sample inside the DSC, and procedure B with replacing the crucible at each measurement. The standard deviations for enthalpy obtained for procedures A and B are 0.04 and 0.5 %, respectively. Höhne et al. [19] also recommended ensuring the best symmetry possible between sample and reference crucibles. A summary of the related studies on DSC calibration can be observed in Table 4.
Table 3. Reference materials for DSC calibration.
MaterialMelting Point (°C)Enthalpy Remarks References
Mercury −38.8344 °C11.443 ± 0.004 J/gShort shelf-life
Unsafe
[41]
Water0.01 °C335 ± 0.6 J/gLiquid water is suitable for Cp measurement, especially for large-scale measurement[6,41]
Gallium 29.8 °C80.097 ± 0.032 J/g [34]Incompatible with Al crucibles[34,39]
Biphenyl 68.97 ± 0.01 °C122.5 ± 0.4 J/gSuitable for large sample calibration[33]
Benzoic acid122.37 °C147.4 ± 0.1 J/g [19,41,42]
Diphenylacetic acid147.19 ± 0.03 °C146.8 ± 0.6 J/gShould be used in hermetic crucibles due to mass losses[27]
Indium156.61 ± 0.02 °C28.71 ± 0.08 J/gPromising reference to calibrate temperature and heat of fusion
Can be re-melted up to ten times
[27]
Tin 231.928 °C60.6 ± 0.2 J/g [41]
Bismuth 271.44253.07 ± 0.58 J/g [38,41]
Zinc419.527 °C108 ± 0.6 J/gAmalgam with aluminum at 450 °C[41]
Solid copper1084.62 °C205.4 ± 6.6 J/gOxidizes easily and reacts with alumina[6]
Solid alumina (Sapphire)Not precise Not precise Suitable for heat flow calibration in Cp measurement[19,43,44]

3.3. Temperature Program (Heating Mode)

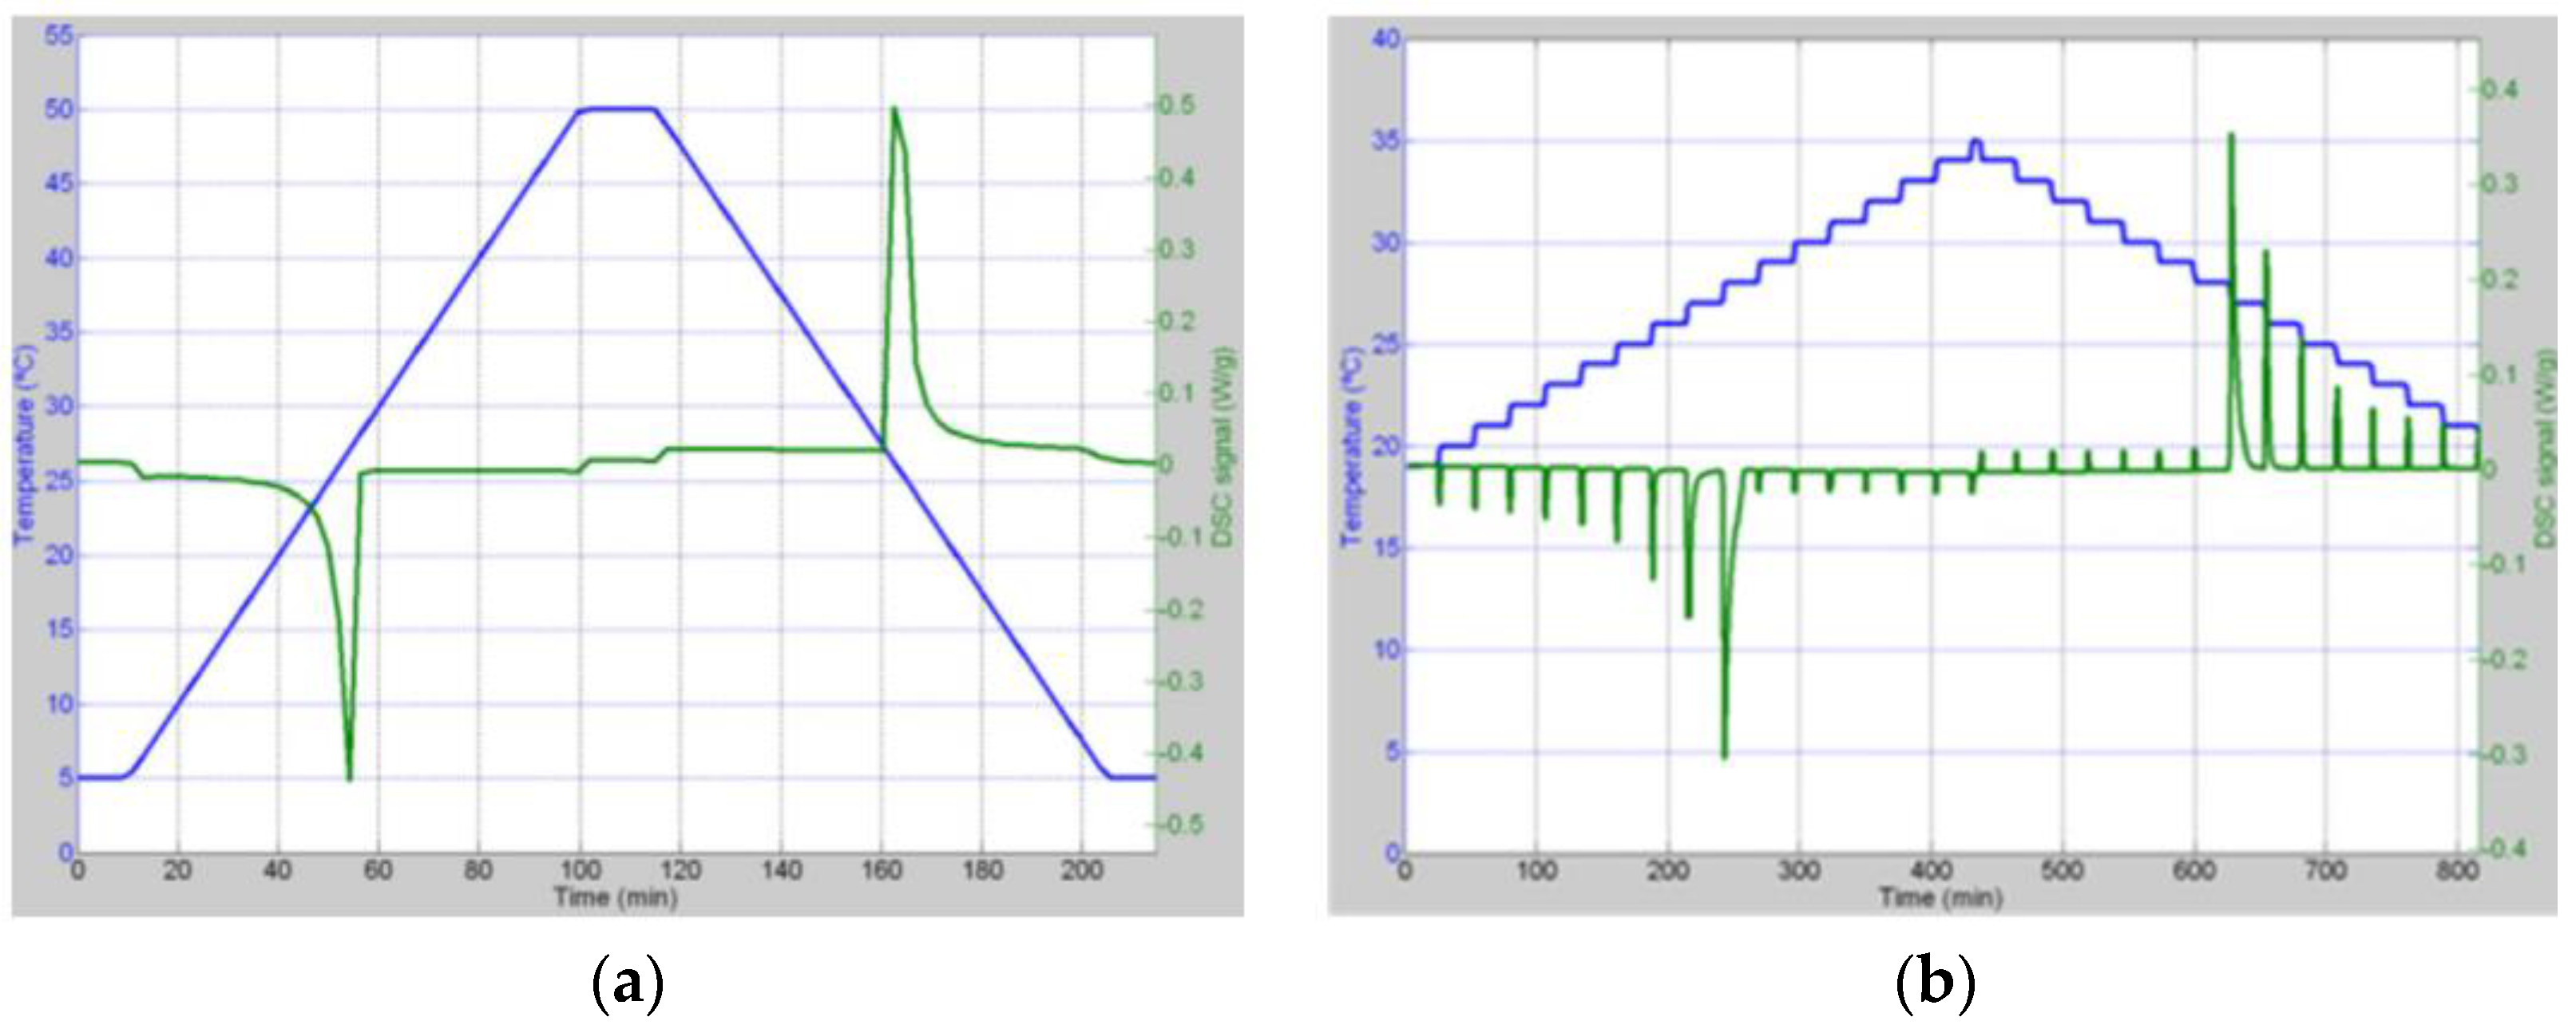
The heating mode can be decomposed into the dynamic and isothermal modes. Dynamic methods are the most common heating modes used in DSC measurements [22]. The dynamic temperature program and the corresponding heat flow curve can be seen in Figure 4a. Generally, it is accompanied with two isothermal periods at the starting and ending temperatures with a heating ramp in between. The difference between the two temperatures could be up to 150 °C. One can adjust the isothermal period and heating rate according to the test. In the dynamic mode, the enthalpy is determined by integrating the area under the heat flow curve. Isostep or stepwise method is a combination of short dynamic stages and short isothermal stages. Generally, the temperature increase between two heating stages is small (1–3 °C) and the heating rate is about 1–2 °C/min. Thus, the sample has more time to reach a certain temperature compared to the dynamic mode. When the signal goes back to zero, the sample is in an isothermal state. After an isothermal period, the sample experiences a heating ramp. The temperature evolution in the step mode and the corresponding heat flow curve can be seen in Figure 4b. In the step mode, the storage capacity is calculated by adding the value of each step. Ferrer et al. [43] introduced another heating mode suitable for measuring the heat capacity of PCM, named areas method, that consists of consecutive isothermal periods without a heating segment in between. Castellon et al. [45] found that the heating or cooling rate has little influence on the step mode contrary to what is found for the dynamic mode. Therefore, by using the step mode, more accurate results can be obtained. The size of the steps should be long enough to ensure thermal equilibrium within the sample (when the signal goes back to the baseline). Moreover, the authors found out that the results obtained with slow heating rates (0.2 or 0.5 °C/min) are in good agreement with the step mode. Commonly, measurements under the step mode conditions lead to less uncertainty compared to the dynamic mode. However, measuring in the dynamic mode is much closer to the real application of a PCM [46]. Barreneche et al. [1] conducted DSC measurements on two types of common PCMs to determine a suitable operating mode for organic and inorganic PCMs characterization. The drawback of the step mode is the complexity of programming and measurement, plus time-consuming analysis [22,47]. However, in the step mode heating, results dependency to heating rate and sample mass is far lower than that of dynamic mode. In both heating modes, a better temperature resolution can be achieved by lowering heating rate in the dynamic mode and decreasing the step size in the step mode. However, by doing so, the signal to noise ratio increases and affects the accuracy of enthalpy measurement.

3.4. DSC Tests for PCMs

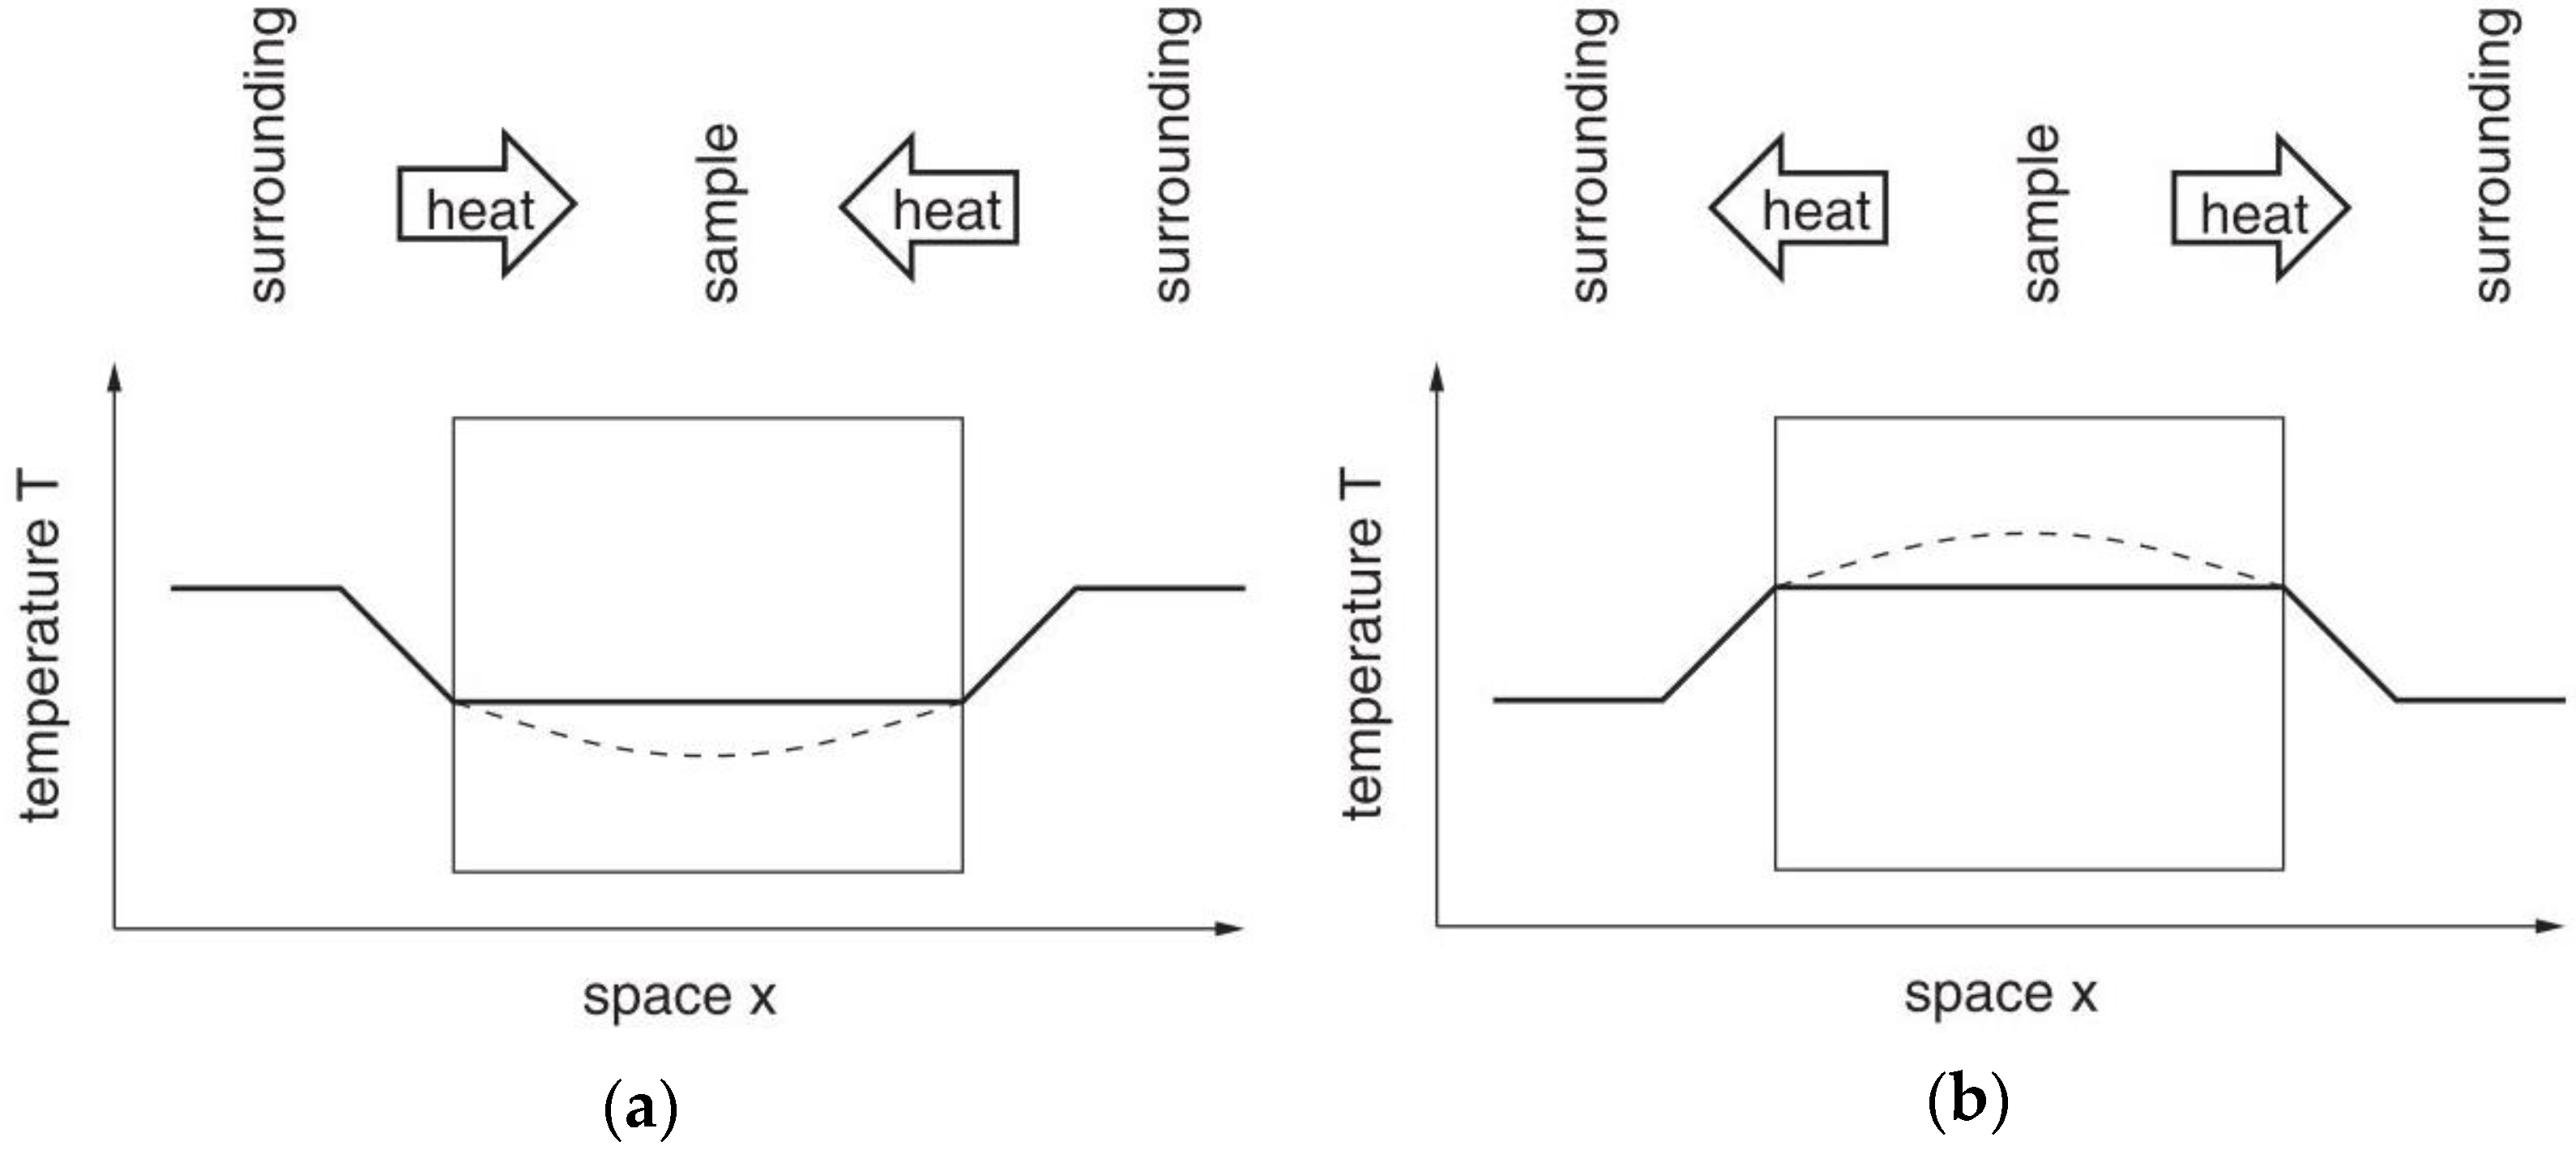
There are several considerations during a DSC test that should be applied to any materials, such as sample size, calibration, and letting the sample be in a thermal equilibrium state by customizing the temperature program and sample mass. However, one faces additional challenges in calorimetry of PCMs, such as subcooling, high enthalpy and low thermal conductivity. PCMs usually show a phase change temperature range instead of a phase change temperature point [46]. Therefore, it is more challenging to describe their state and related thermal properties. It is also difficult to achieve a thermodynamic equilibrium in the sample due to subcooling during solidification. Furthermore, the internal thermal gradient in PCMs is larger than for any other materials due to the high enthalpy during the phase change and low thermal conductivity. This thermal gradient reaches its maximum near the phase change temperature, where a high precision is needed [22]. Thus, it is time-consuming to get the sample under isothermal conditions. Heat enters the sample from outside of the pan and the sample temperature is measured at the surface of the pan, so the real sample temperature, especially during the phase transition, is always overestimated in heating and underestimated in cooling (Figure 5a,b). Therefore, different results during the heating and cooling processes could be obtained, giving rise to a so-called hysteresis loop. Mehling and Cabeza [18] distinguished two definitions of hysteresis: the hysteresis caused by a material property such as subcooling (supercooling or undercooling), called real hysteresis, and the hysteresis caused by measurement conditions, referred to as apparent hysteresis. One can see the subcooling hysteresis of adipic acid (equal to 5 °C) in Figure 6a. Haillot et al. [48] observed the same degree of subcooling for adipic acid of 99% purity. Generally, the real hysteresis cannot be avoided while the apparent hysteresis can be minimized by considering small size samples, low heating and cooling rates, and using instruments with higher reliability. However, it should be mentioned that small size samples might not be good representatives of PCMs and real hysteresis caused by subcooling is larger in small volumes [49]. Thus, DSC might not be a suitable method to find the actual subcooling of a PCM. For example, the subcooling of erythritol (sugar alcohols family) can increase from 14 °C for a sample mass of 200 g to 54–82 °C for few milligrams [26]. In a larger volume, there is more chance for nucleation which leads to a lower subcooling. In addition, low heating rates lead to low signal to noise ratios. Thus, there is always a balance when choosing between the suitable mass of PCM and the heating rate. Subcooling causes problems in recovering stored heat in the next thermal cycles. It can be controlled by adding nucleating agent into the PCM. Detailed information about nucleation and subcooling can be found in the review article published by Zhao et al. [50]. Recently, methods like the one developed by IEA provide guidance to select a suitable heating rate.
Sometimes, PCMs are not pure and they are mixtures of several constituents. Each constituent might melt/solidify at different temperature ranges that lead to the formation of multiple transition peaks, especially during solidification. For example, commercial PCMs, such as paraffin waxes, are made of various kinds of alkanes, and paraffins mostly show congruent transition process because the molecular interactions between constituents overcome the molecular weight. However, if the molecular weights of various constituents are significantly different, peak separation will appear [46]. Scanning these kinds of PCMs with large heating rates results in disappearing peaks or the merging of small peaks into a greater one. As stated by Li et al. [46], incomplete phase change processes of PCMs (partly melting/partly freezing) are inevitable in building applications, and might occur in other applications due to the non-continuous load of energy. These authors explained that in the case of commercial PCMs, in which they include various kinds of constituents, the constituents that do not melt will obviously affect the melting process of other parts. Furthermore, the un-melted parts will act as a nucleating agent that improve the solidification process during cooling. Therefore, when a PCM is incompletely melted/solidified, different behavior in terms of heat flow and enthalpy curves (versus temperature) can be observed compared to a complete phase change process. An example of incomplete phase change process can be seen in Figure 6b. In the case of mixture of PCMs, studying the phase diagram and eutectic composition of the mixture beside the DSC experiments is important [8]. The required performance for eutectic PCMs is to experience the transition at the eutectic composition. Otherwise, the phase inhomogeneity caused by the mixture composition affects the transition temperature range and application of the PCM [51]. A summary of the mentioned challenges in calorimetry of PCMs is listed in Table 5.

3.5. Data Communication

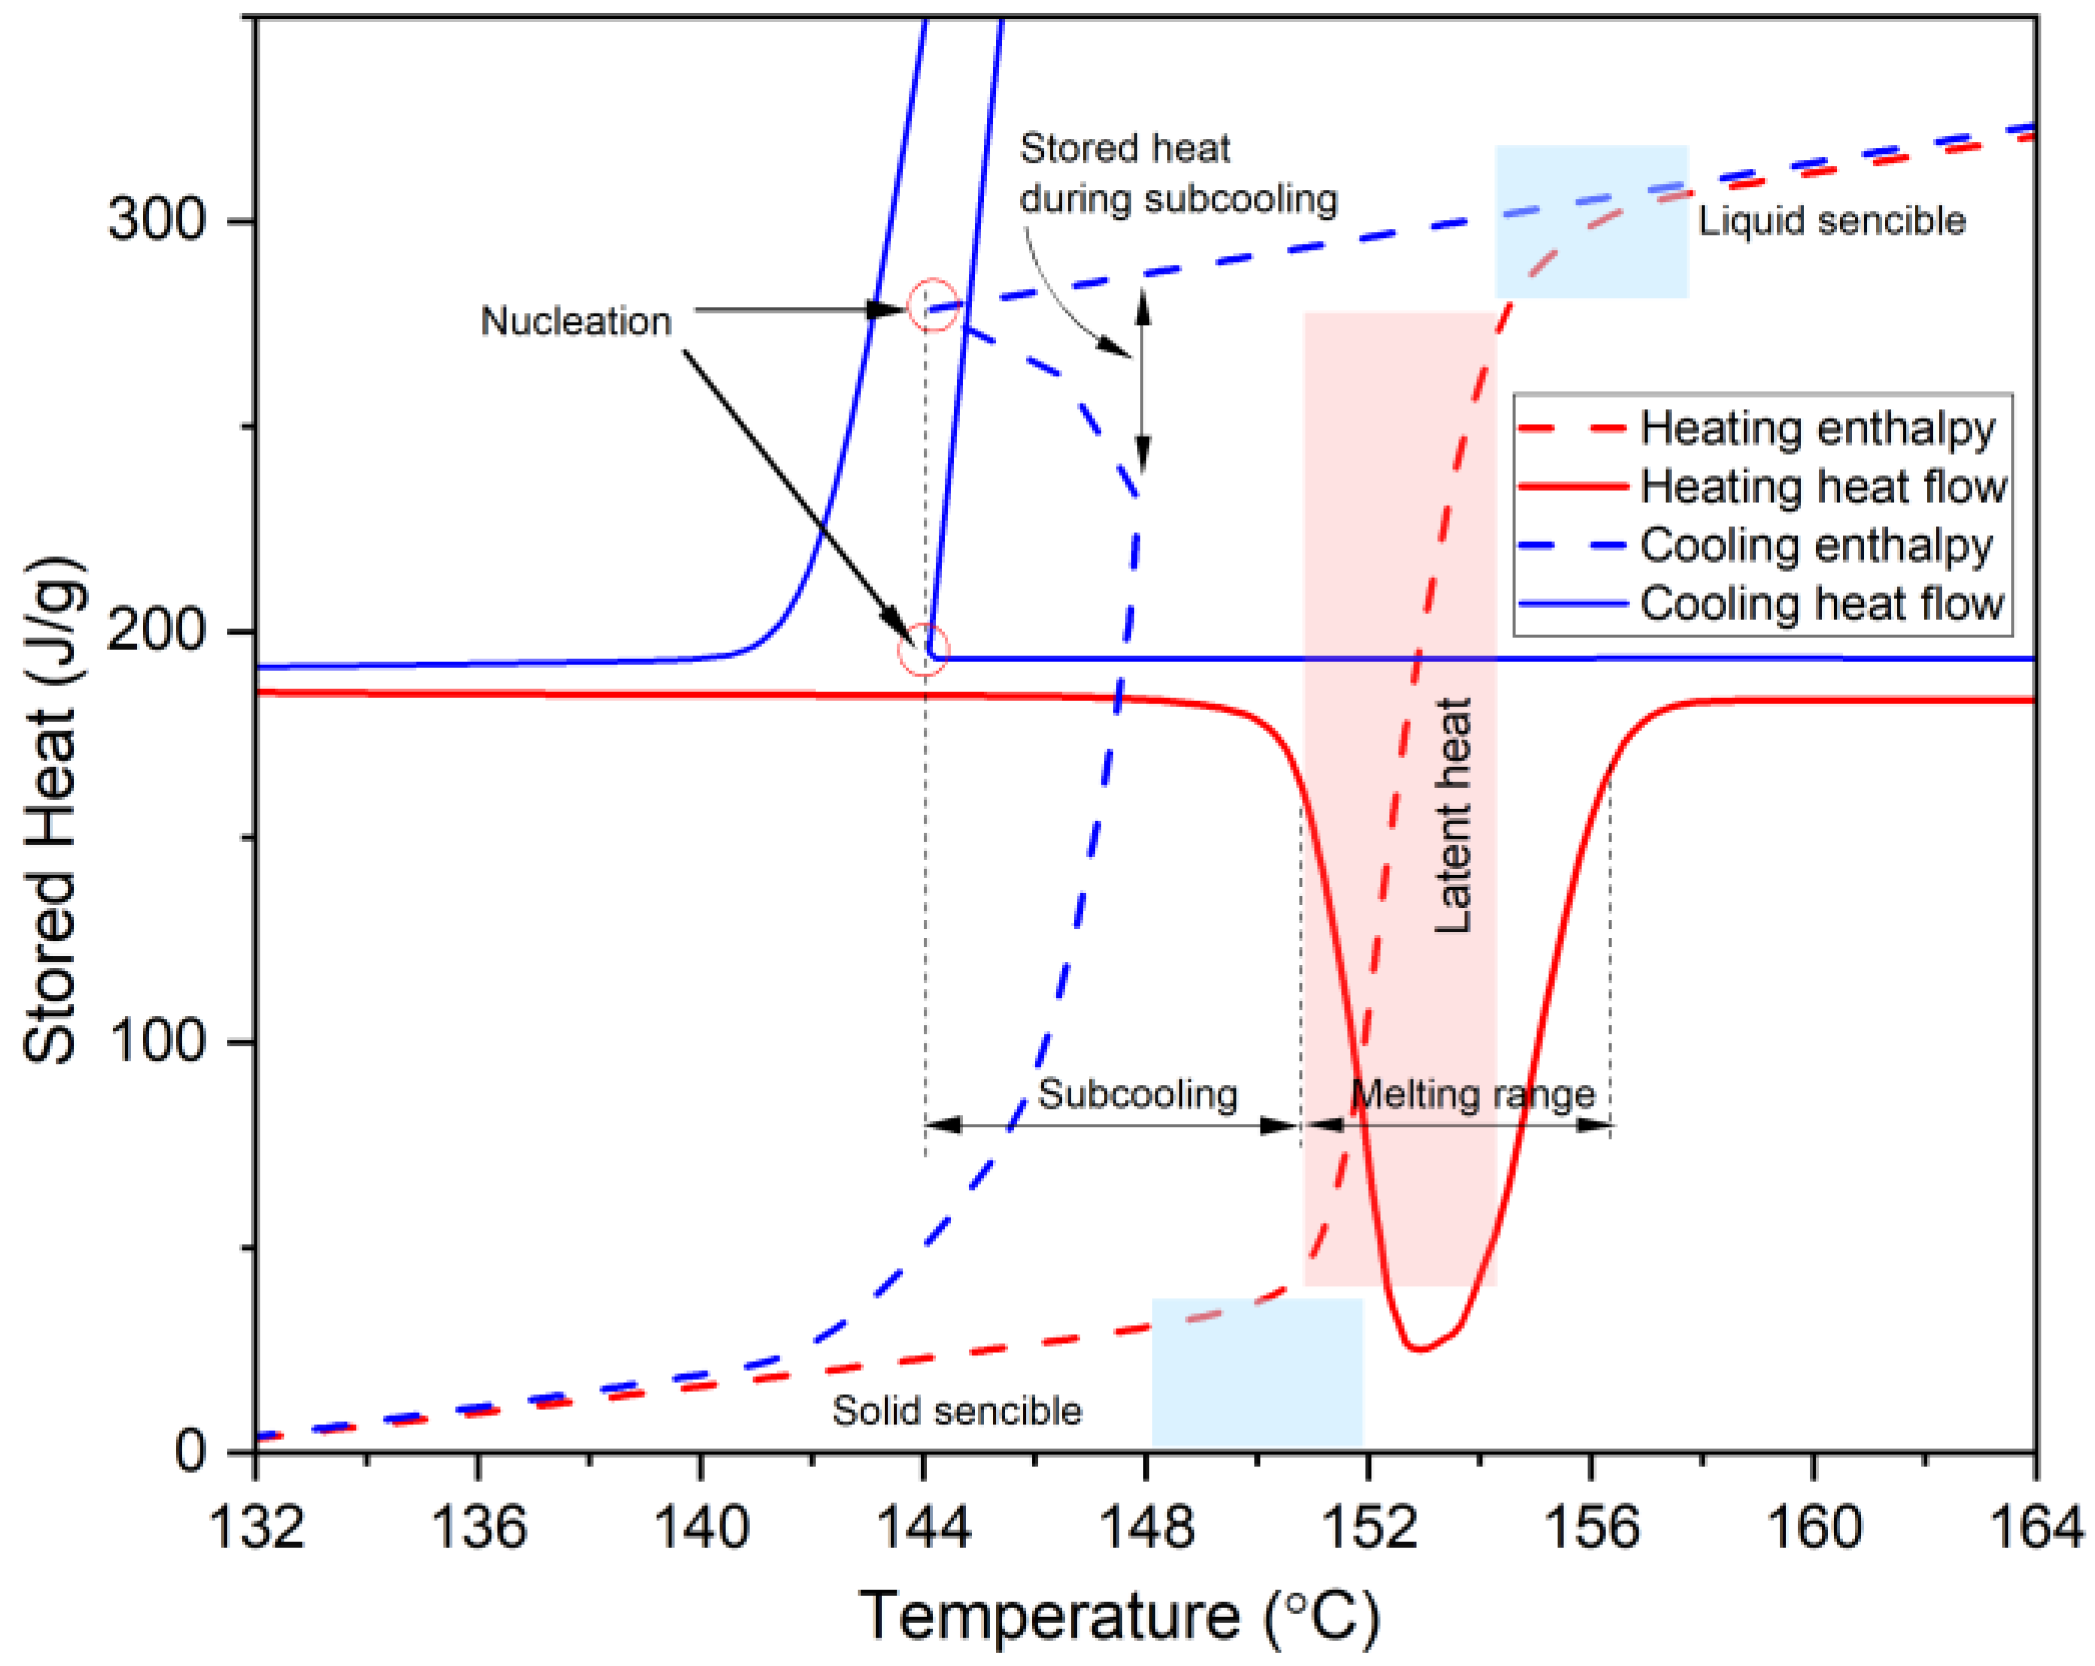
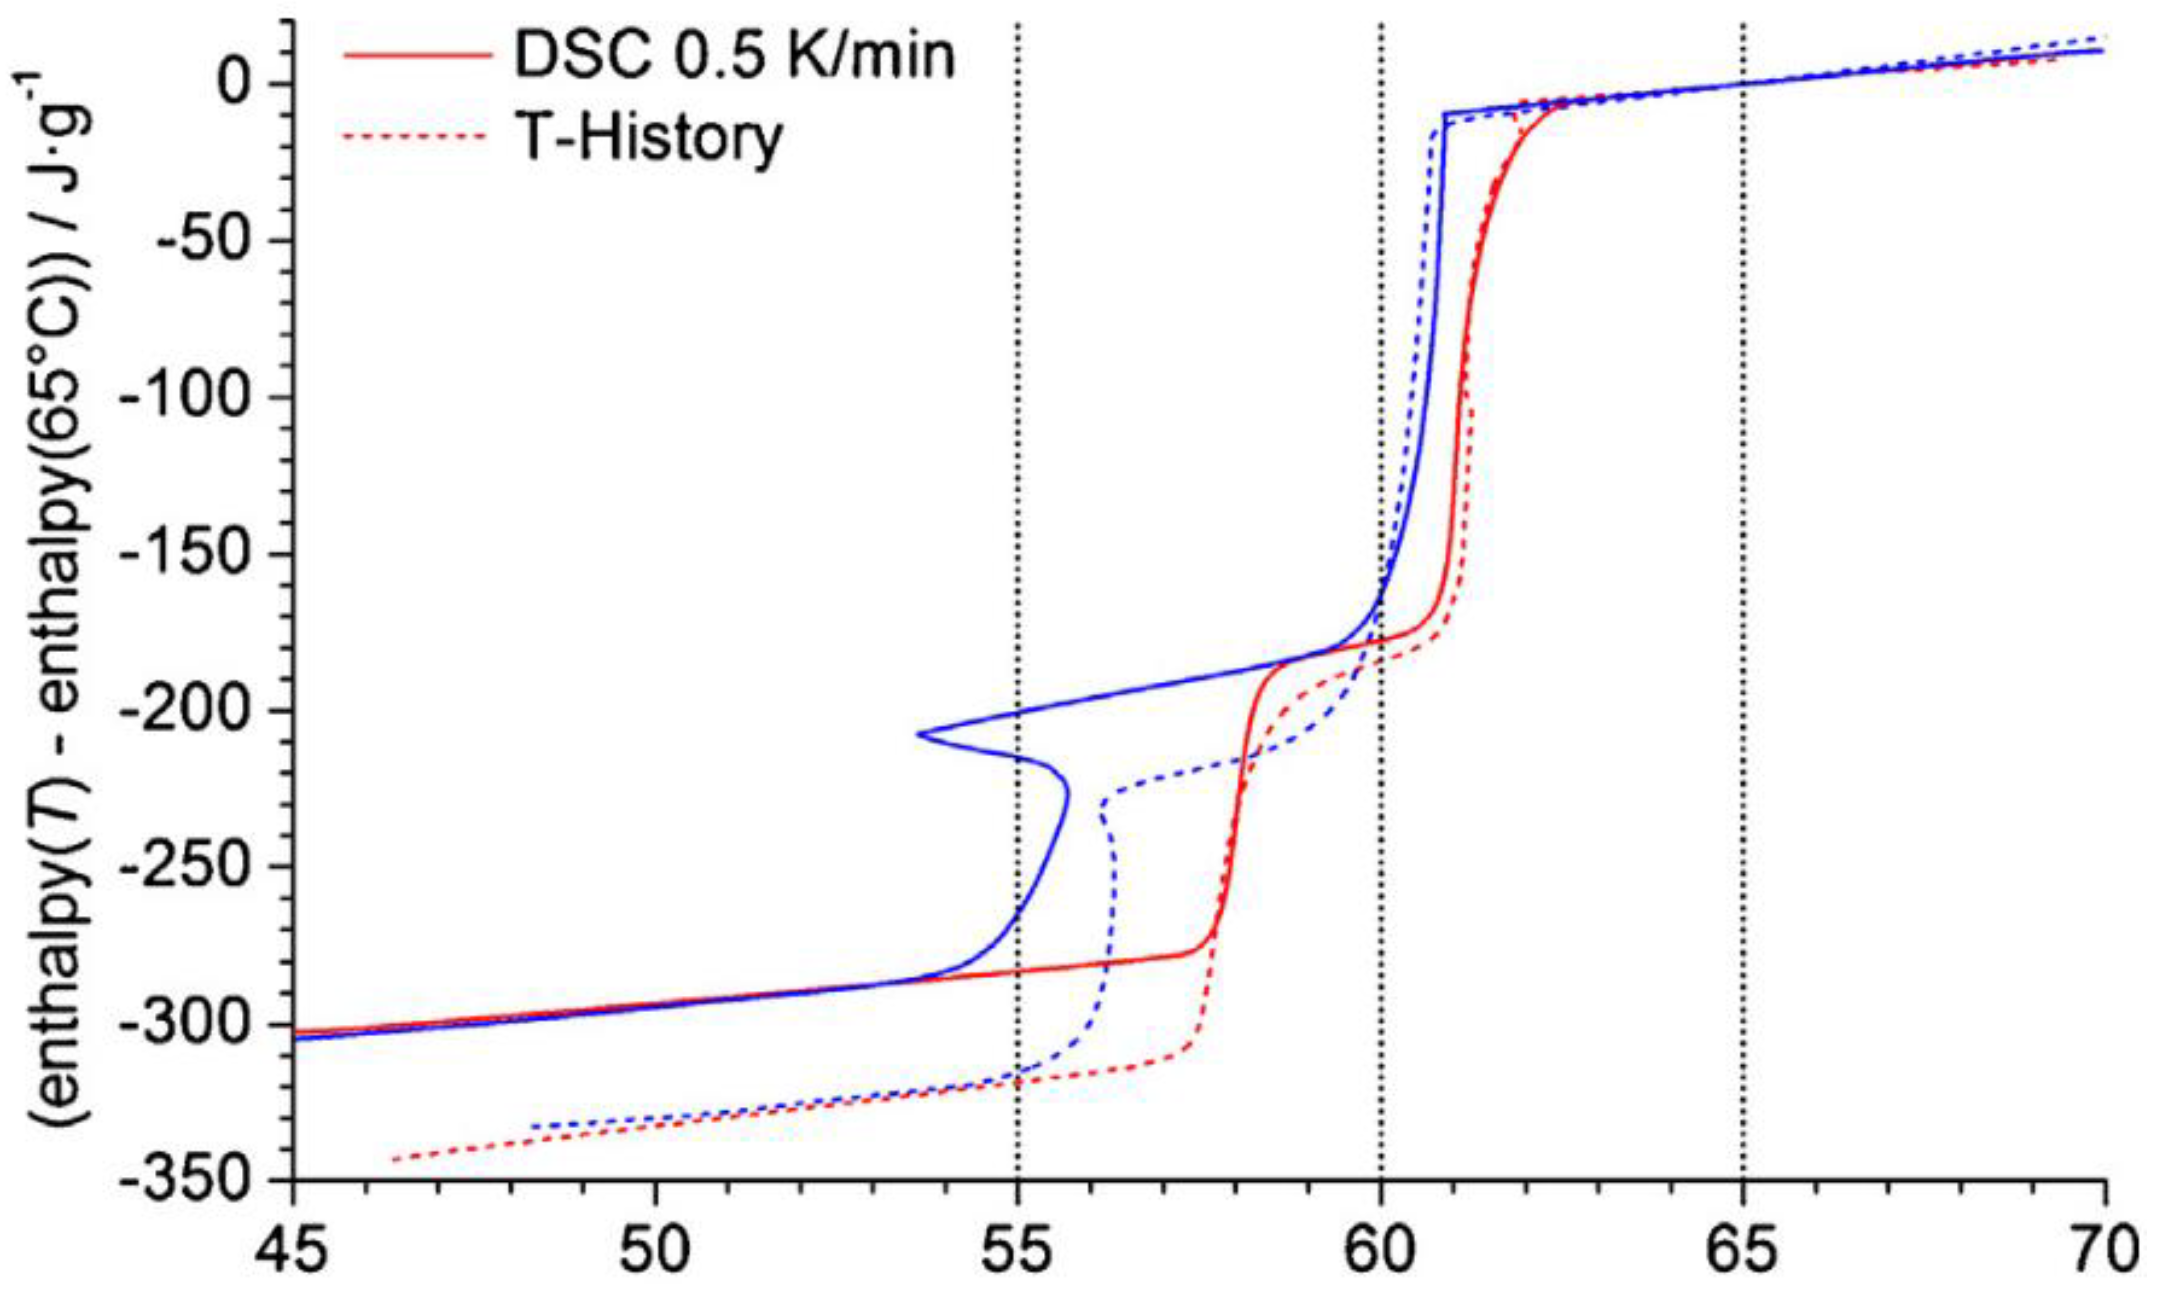
A phase change phenomenon in a PCM is described by four values, including phase change temperatures, phase change enthalpy, and heat capacities in the solid and liquid states [18]. Due to the mentioned challenges with PCMs for DSC characterization, such as showing melting range and subcooling, reporting just a single value for each parameter is not enough and a suitable way of data presentation is needed. Mehling et al. [6] concluded that the tabulation of stored heat in a temperature interval or the representation of the enthalpy curve as a function of temperature are accurate methods of data presentation. Plotting the graph of h(T) is of high importance compared to Cp(T), since it includes information on stored heat as a function of temperature, while Cp(T) tends to infinity at the phase change temperatures, and thus lacks enough data points for representing the Cp curve. The stored heat as a function of temperature during the melting and solidification is shown in Figure 7.
Since the hysteresis or subcooling are common in PCMs, the stored heat over a temperature interval or enthalpy temperature plot should be represented for both heating and cooling. The effect of subcooling can then be removed from the enthalpy curve. In case of subcooling, the nucleation temperature, the degree of subcooling, and testing conditions such as sample mass have to be represented in addition to the other properties (Figure 7).

4. PCM Properties Achieved by DSC

The potential of a PCM to store and release thermal energy for a specific application can be defined by transition temperatures or transition range, phase change enthalpy, and heat capacities in solid and liquid states. All these parameters are obtained by the DSC method. DSC is a fast-thermal characterization technique and depends on test conditions, including calibration, measurement procedures, DSC machine and operator. It provides measurements within a reasonable uncertainty. In the following sections, the properties of a PCM that can be measured by DSC method are discussed in detail.

4.1. Transition Temperatures

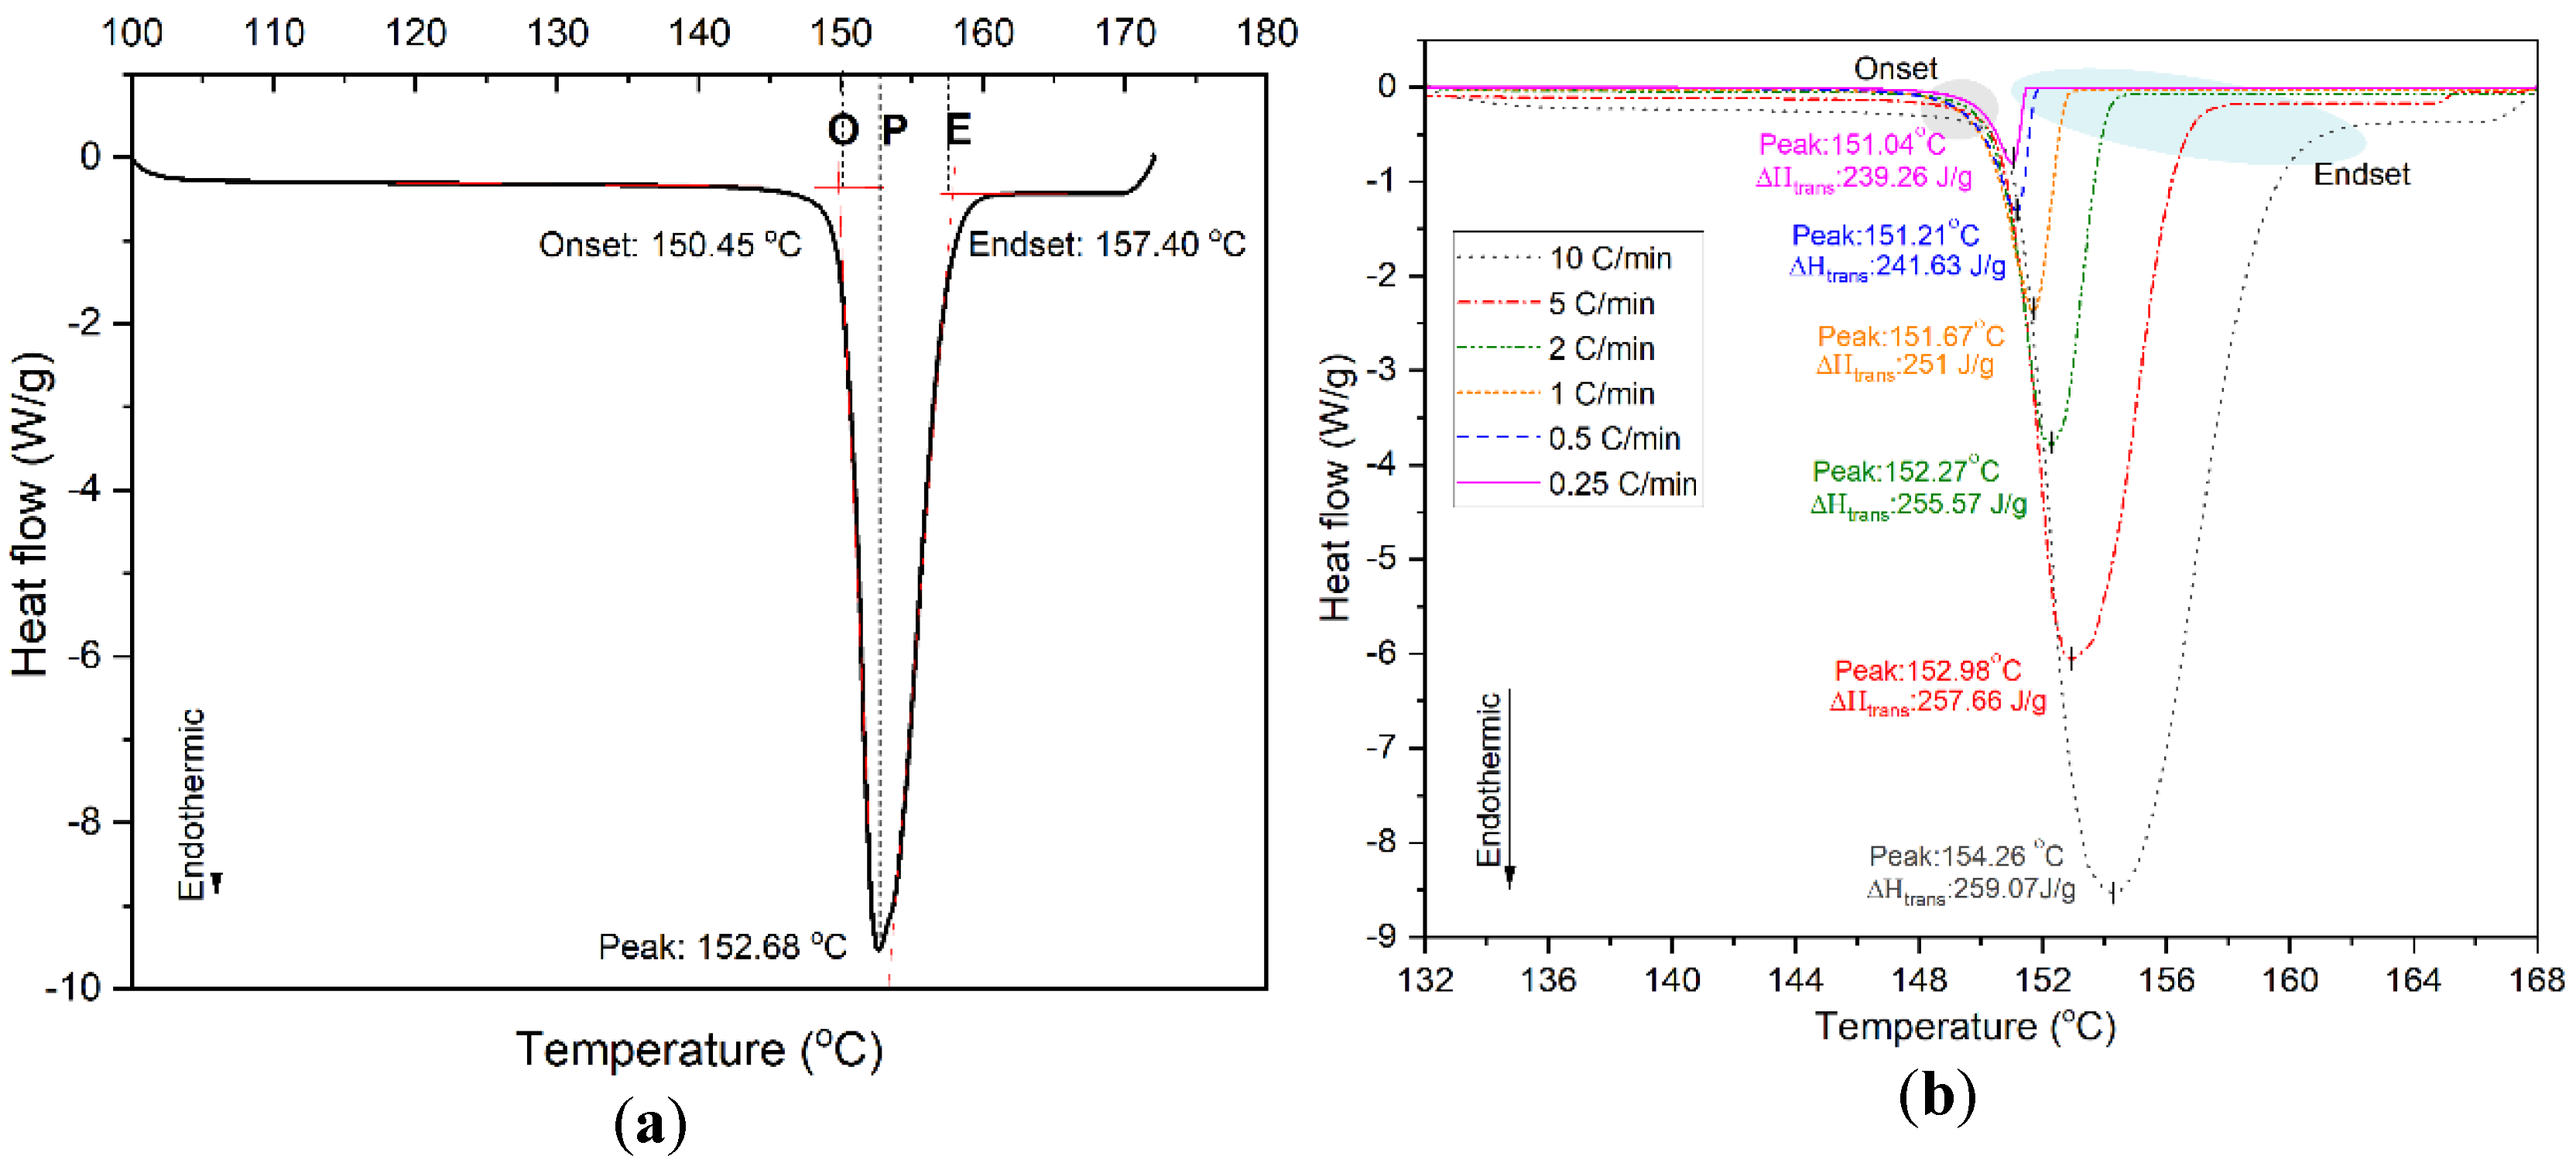
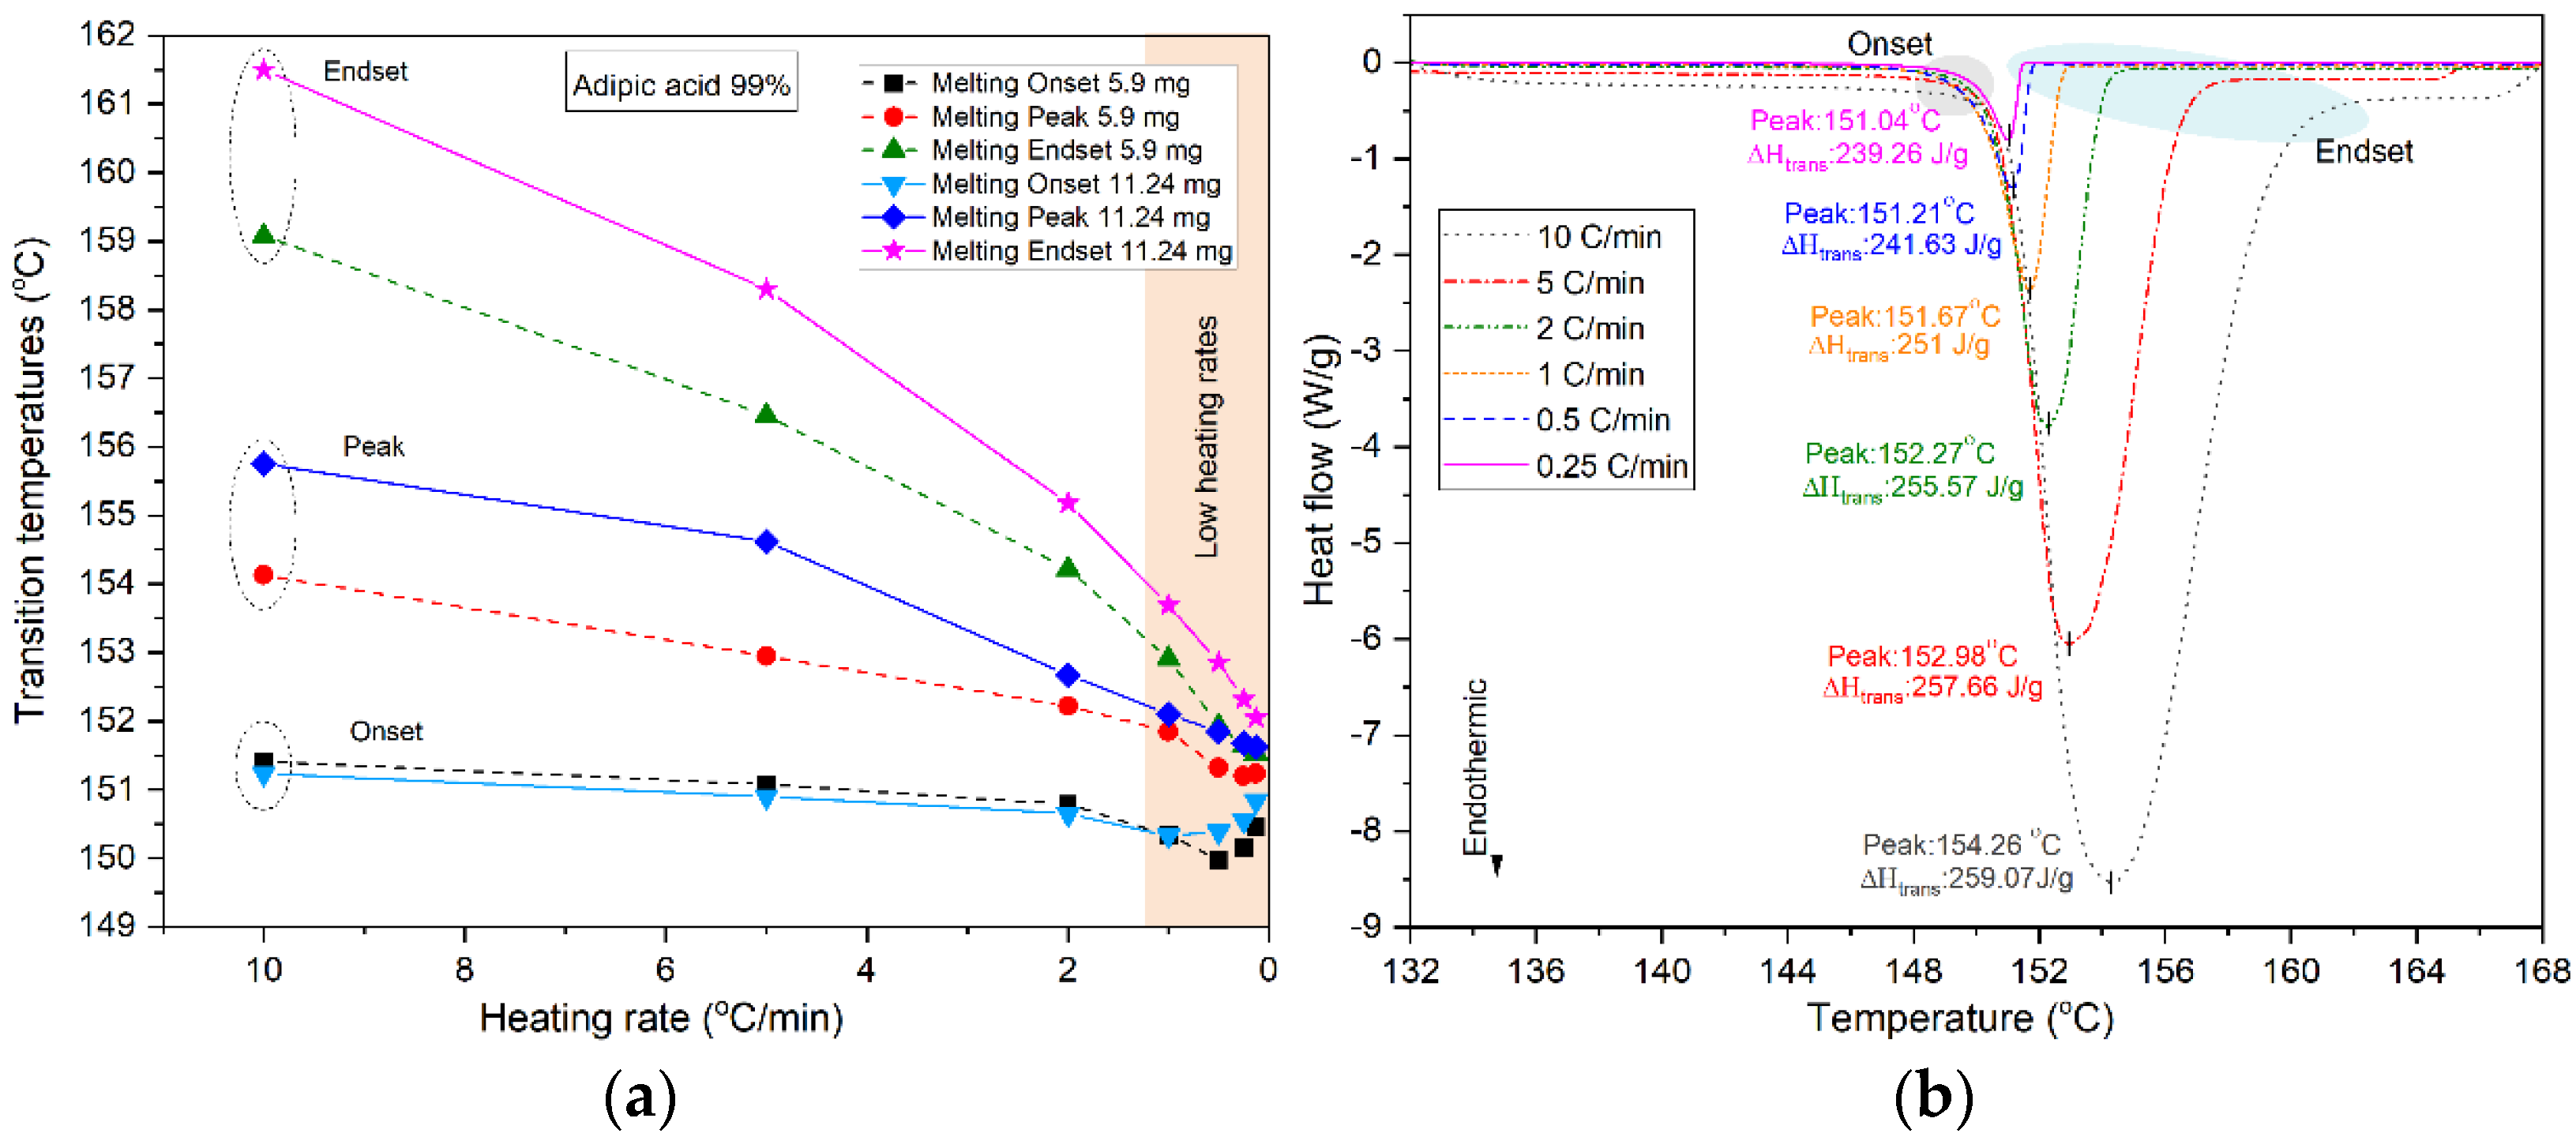
The most important property of a PCM for a thermal storage application is the phase change temperature [22,54]. Transition temperatures of PCMs are mostly determined by DSC. When a PCM goes through a phase transition from solid to liquid or vice versa, one can observe an endothermic or exothermic peak for melting and solidification, respectively. This peak (heat flow graph) provides us with important information regarding the PCM’s thermal properties (before, during and after the transition), such as transition temperatures, enthalpy and heat capacities (mostly outside the transition range). In this section, we specifically look at the transition temperatures. As shown in Figure 8a for adipic acid, the transition peak (melting or solidification) can provide the transition temperatures, namely, transition onset (beginning of the peak), peak temperature (maximum of the peak) and endset temperature (end of the transition). Haillot et al. [48] report the transition enthalpy of adipic acid 254 J/g, which agrees with the values obtained for a heating rate over 1 °C/min in Figure 8b. Among these temperatures, melting onset is the most important one. In the literature, wide temperature ranges are reported on PCM’s melting point [54] and sometimes the procedure behind the measurement is not mentioned. Thus, one does not know the reason behind this wide temperature range. For example, there is about 7 °C range in the reported melting point of myristic acid from the family of fatty acid [55]. As shown in Figure 8b, among the transition temperatures, transition onset is less affected by mass and heating rate, so it can be considered as a melting point of the material. However, the peak and endset temperatures (transition range) shift to higher temperatures by increasing heating rate and sample mass [22,56,57]. The onset temperature is the intersection of a flat baseline and tangent of the melting peak in the heat flow curve (extrapolation of onset temperature) [54,58].
The shift to higher temperatures is due to the thermal resistance of the sample that causes nonuniform temperatures. This means that the inner temperature of the sample is lower than the surface temperature where the DSC temperature sensor is placed. By increasing the heating rate, this temperature difference increases and the real temperature of the sample is always lagging behind the surface temperature. Therefore, the sample is still in the transition state and adsorbs heat while the surface temperature shows the end of transition. The measurement parameters such as sample mass, thermal contact between the sample and the crucible, thermal contact between crucible and sensor, sample thermal conductivity and the heating rate affect the difference between the measured and the real temperature of the sample. For PCMs, this temperature difference is higher compared to other materials due to their very low thermal conductivity and large heat capacity, especially during the phase change. Thus, the large amount of heat in narrow phase change temperature and low thermal conductivity leads to a thermal gradient inside the sample. As the heating rate and sample mass increases, this gradient also increases [22]. Therefore, the peak and endset temperatures shift to higher values by increasing the heating rate, and this leads to an increase of the temperature range for the transition, as already observed by [22,42]. In order to measure the transition temperature accurately, scanning the sample with low heating/cooling rate is recommended [8,54,59]. However, selecting a heating/cooling rate is always a compromise between accuracy in terms of enthalpy and temperature and representativity. After measuring the sample with a low heating rate, it is recommended to conduct an experiment with a higher heating rate (lower signal to noise ratio) to check the value of enthalpy.
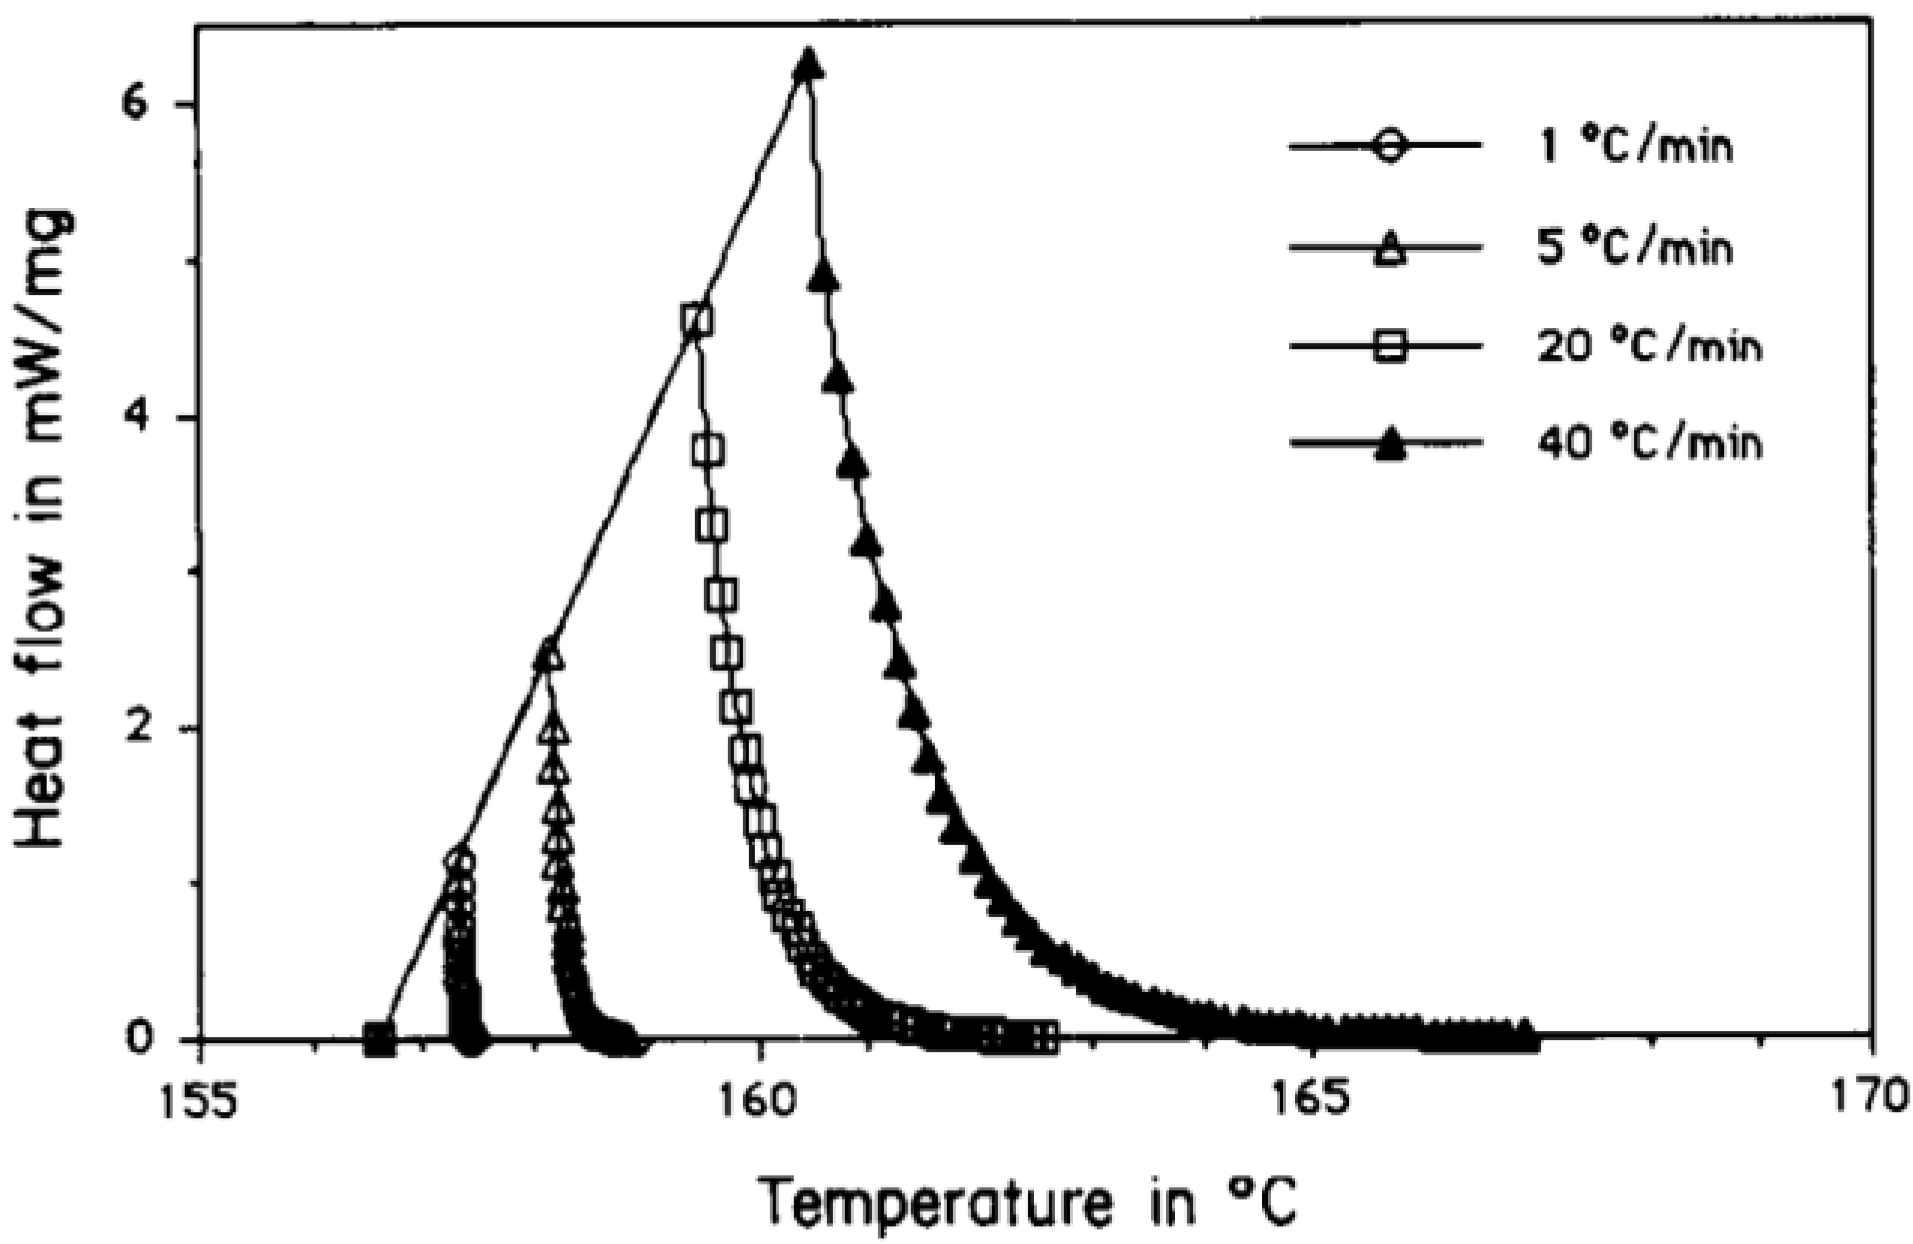
Dolado et al. [60] carried out a study on the different sources of uncertainty (PCM, air conditions and geometric parameters) in an air-PCM thermal energy storage. They concluded that improving the determination of melting temperature range from ±1 °C to ±0.25 °C enhances the determination of air–heat exchange rate by 25%. He et al. [8] used a combination of phase diagram and DSC curves to study the phase transition and related enthalpy of a binary mixture of paraffin-based tetradecane and hexadecane for a cooling application. It was concluded that the phase transition temperature range is a function of mixture composition. The lack of phase equilibrium, including thermal and chemical equilibria, is the reason why DSC measurements with high scanning rates could not provide correct information. They strongly recommend conducting a phase equilibrium study alongside the DSC measurement, especially in the case of binary mixtures of PCMs, and using low scanning rates in DSC tests. They also concluded that thermal relaxation takes longer for melting than solidification, leading to a larger temperature range during melting. Furthermore, with a higher heating rate, the endset temperature shifts to a higher value and the temperature range increases. The reason for this is heat transfer during the phase transition. During melting, the process transition starts by conduction and continues by natural convection, but during the solidification, it is the contrary. Thus, because the thermal conductivity is higher in the solid phase than in the liquid phase, solidification is faster than melting and transition occurs for a narrower temperature range. Apart from all approximations that should be considered, one should also minimize all resistance effects to be as close as possible to the true heat flow rate by subtracting baseline and improving the calibration constant. The temperature gradient inside the sample has an influence on the peak shape. When a transition takes place in the sample, there is no longer a steady state, and the temperature difference between the sample and the reference is delayed with time. Höhne et al. [19] carried out a numerical simulation based on the finite element method and observed the dependence of the peak shape on the heating rate, heat of transition and thermal conductivity of the sample. They concluded that only the onset of peak is independent of the test parameters. In Figure 9, Wang and Harrison [61] numerically simulated heat flow curve of pure indium versus temperature and observed widening of the melting peak by increasing the heating rate. This finding agrees with the experimental results shown in Figure 10a,b, which are discussed in the next paragraph.
Sun et al. [57] studied the phase transition temperatures of paraffin and hydrated salt with two different masses and three different heating rates. They considered a constant temperature for melting onset and observed the change in peak and endset temperatures. For each PCM, both peak and endset temperatures shift to higher temperatures because of temperature gradient. This temperature gradient increases by increasing either the sample mass or the heating rate. For the hydrated salt, they observed a step-like behavior, especially at lower heating rates and smaller masses, caused by phase separation. The same behavior was observed also by He et al. [8], who were not able to detect solid-solid transition of paraffin when measuring with high scanning rates. Nazari Sam et al. [62] considered three paraffin-based PCMs and one bio-based PCM with different heating rates and masses. They chose the maximum peak of the Cp curve as a melting temperature and observed a shift of the melting point to lower temperatures by decreasing the heating rate. This study is among the few ones based on the IEA (International Energy Agency) protocol for DSC measurements. Figure 10a,b displays an example of the influence of the mass sample and heating rate on the transition temperature and heat flow curve of adipic acid. The IEA method helps to determine the appropriate heating rate, which minimizes the heating rate effect on the DSC results, and finally, represents the enthalpy curve versus temperature for each PCM. Kousksou et al. [63] performed a combined experimental and theoretical analysis of the heat transfer characteristics of a PCM inside an emulsion. They considered three PCMs, namely, hexadecane (Tm = 18.0 °C), heptadecane (Tm = 21.8 °C), and octadecane (Tm = 28 °C), all mixed in an emulsifying medium. In their physical model, some parameters were measured experimentally, such as heat capacity and thermal conductivity, and several heat exchange coefficients were found by a genetic algorithm. The liquid fraction of the PCM sample could be deduced at any time, leading to the determination of the transition temperatures. The authors concluded that the peak temperature is only the plate temperature when the energy exchange is maximum and it does not highlight experimentally the end of transition. On the contrary, according to the maximum value of liquid fraction (one by convention), the end of transition could be found more accurately. Furthermore, they quantified the influence of the heating rate both numerically and experimentally and concluded that by increasing the heating rate, the thermal gradients inside the DSC cell increase, so the peak temperature shifts to a higher value and the melting range becomes broader. They also showed that in the case of a mixture of PCMs, high heating rates hide essential information about the kinetics of melting. Jin et al. [64] proposed a new methodology to determine the melting range of a PCM with a focus on finding the actual endset temperature of melting, namely, the partially melted DSC measurement. They heated the sample from a starting temperature below the melting point to the maximum heating temperature according to the melting range of the PCM. For RT 27, the heating started from 20 °C to a range between 25 °C and 32 °C, with a temperature interval of 0.5 °C. By calculating the enthalpy of melting and solidification for each ending temperatures and considering the PCM latent heat, they determined a temperature in which PCM could adsorb and release all of its latent heat. The endset temperature was found to be independent of the heating rate for this method. However, applying this method for PCMs with supercooling effect and the DSC without cooling accessories would be more challenging. According to Jin et al. [64], the actual ending temperature determined by partially melted DSC measurement is almost the same as the temperature achieved by low heating rate measurements. The summary of all these works concerning the transition temperature of PCMs by DSC method can be seen in Table 6. The DSC calibration is an important step toward reliable data. Regarding the temperature calibration, multipoint calibration, including a calibrant with a melting point close to that of the sample, is recommended [39,54]. The same conditions for both the sample measurement and the regular calibration should be imposed. Unfortunately, in PCM studies, the calibration procedure is not generally mentioned [54]. Furthermore, as stated by Kahwaji et al. [54], reporting the details of the DSC experiments, such as uncertainty of the measurement and test conditions, is deemed necessary to distinguish between the different values for a given PCM.

4.2. Enthalpy

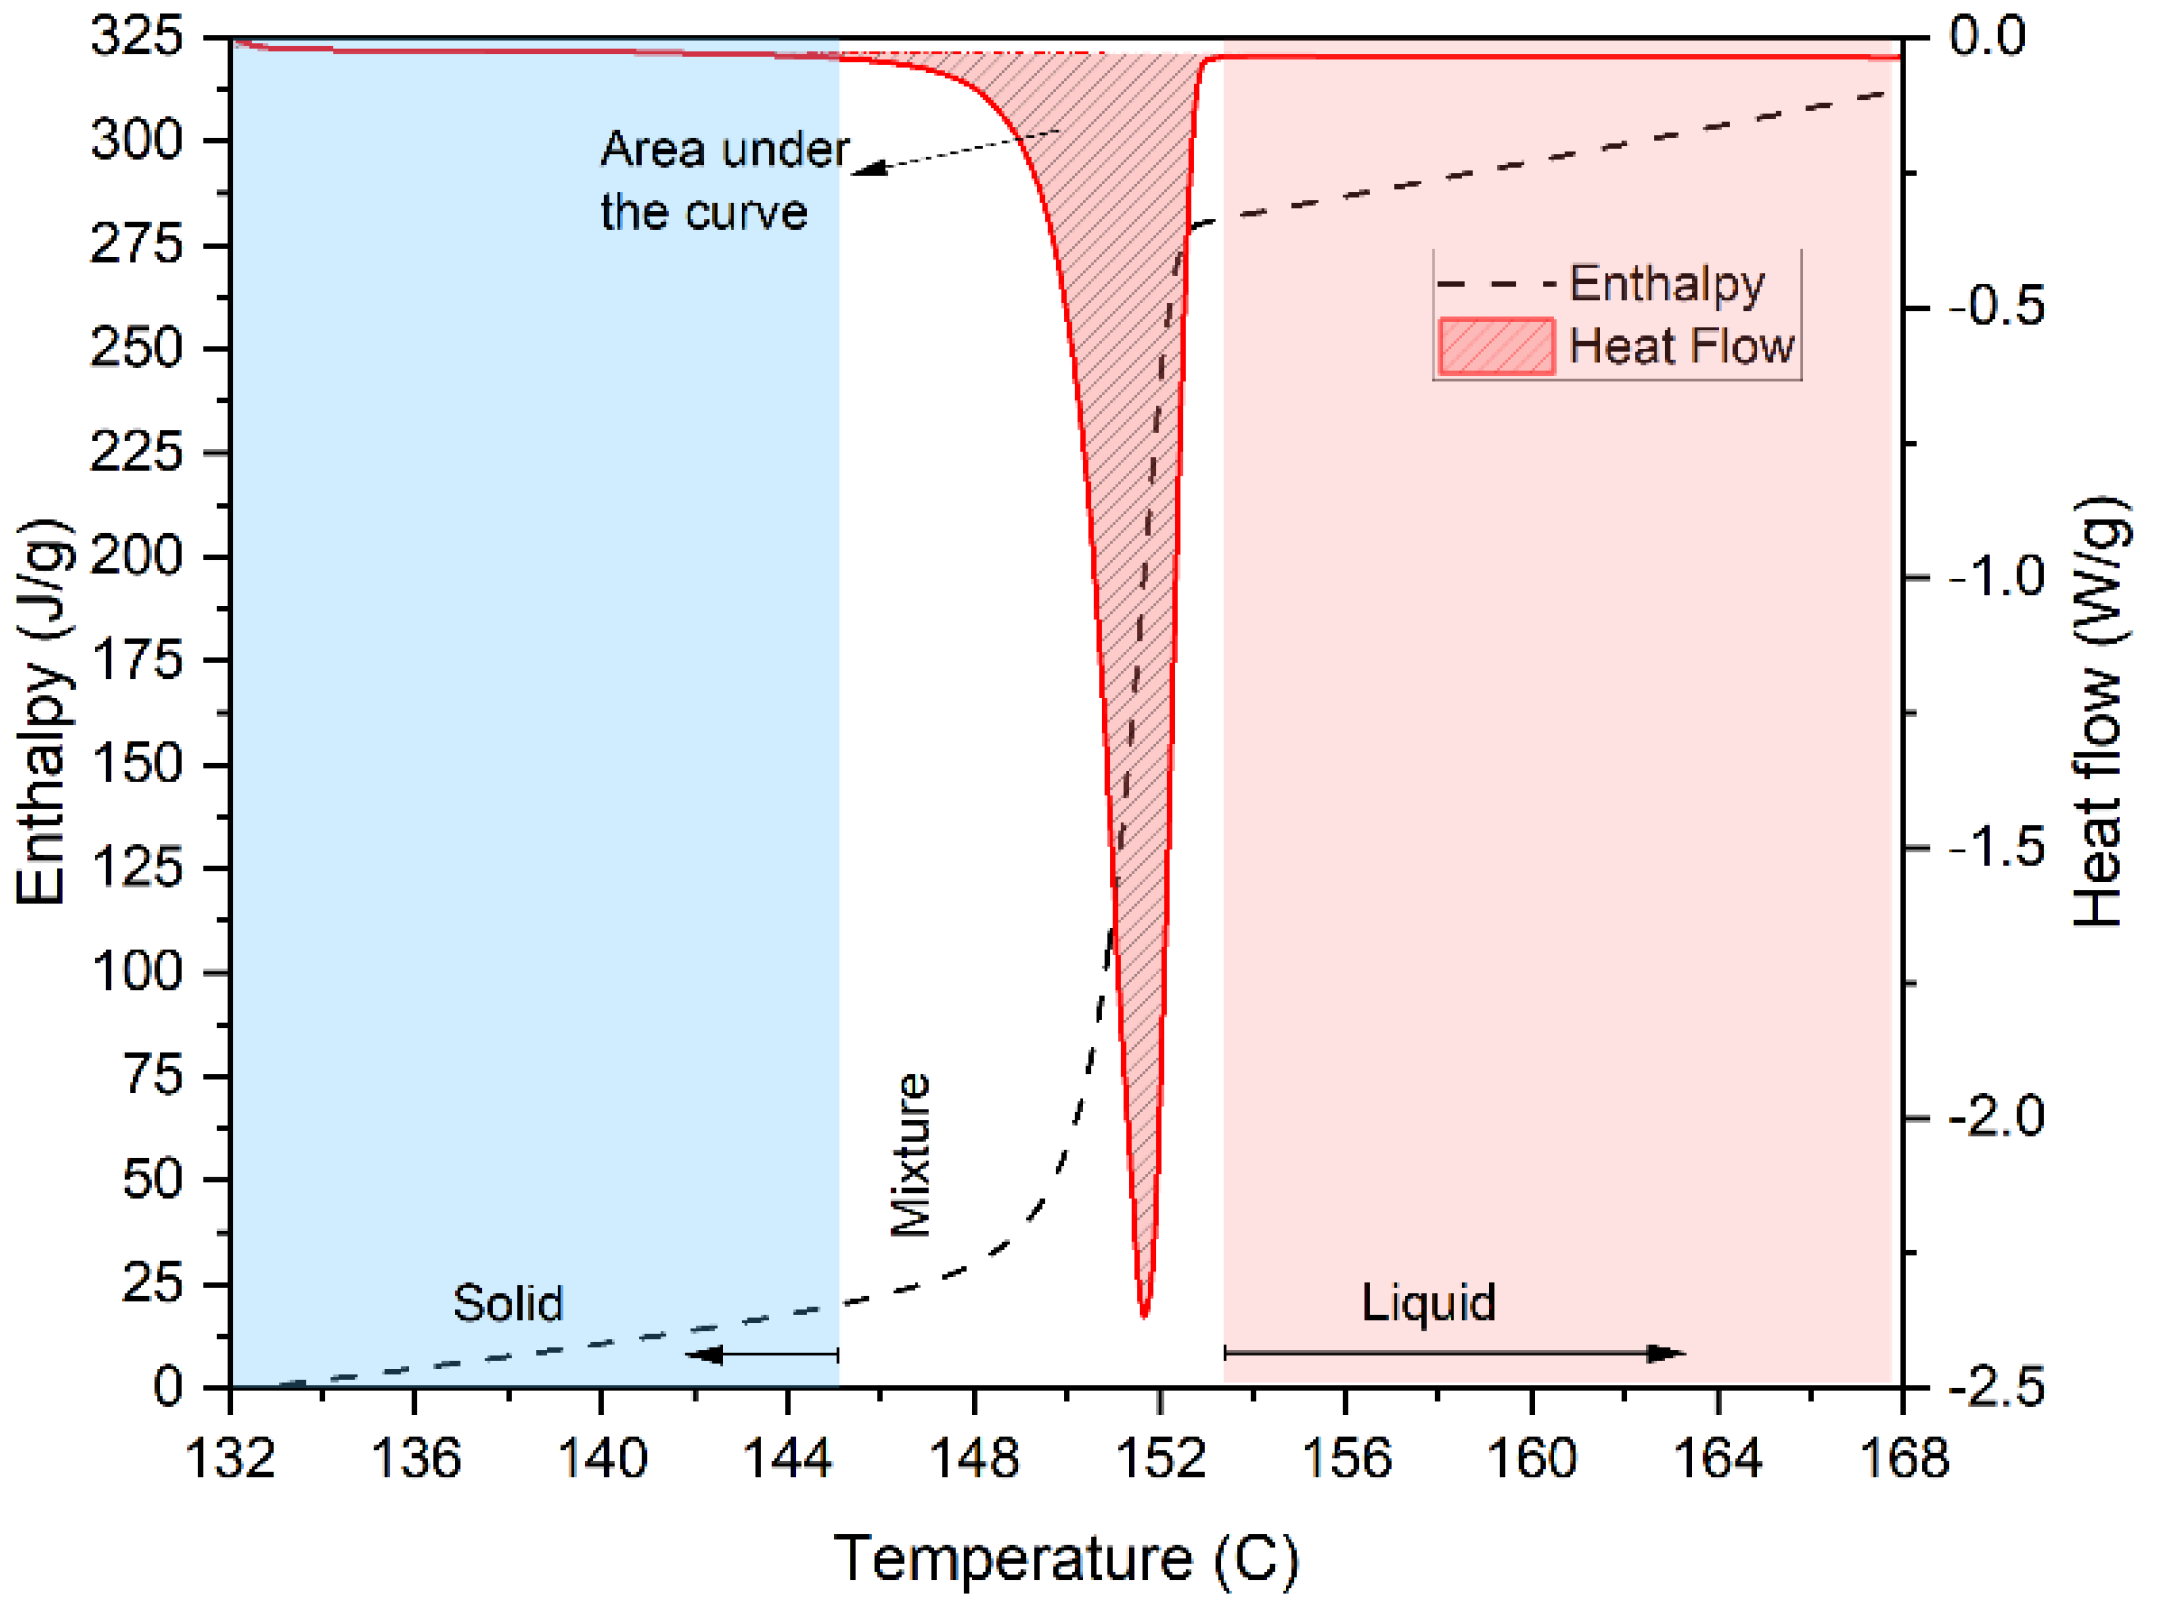
When talking about a PCM-based thermal energy storage, this refers to the fact that thermal energy is stored as latent heat during mostly solid–liquid transition. It is possible to use other kinds of transition, such as solid-gas and liquid-gas, to store energy. However, solid–liquid transition is the most popular due to the low volume change and independence of melting point from pressure [45]. The most relevant parameter in PCM applications is their enthalpy change in a specified temperature range because it shows the amount of energy that can be stored or released to or from a PCM. In order to design thermal storage systems and commercial products based on PCM, studying the enthalpy–temperature relationship of the PCM is important. The mentioned relationship and the other properties are determined using calorimetric analysis, mostly differential scanning calorimetry (DSC). As shown in Figure 11, in order to calculate transition enthalpy, one can integrate the area under the heat flow curve (red region) over the temperature range and consider a calibration constant derived from the DSC software. To represent the total enthalpy (black curve), the heat capacity can be calculated from the heat flow data, then multiplied by the temperature difference, Equations (15) and (16). Kahwaji et al. [54] mentioned that there is a large range reported for transition enthalpy of PCMs in the literature. Schmit et al. [9] also reported that, for salt hydrates, there are few papers that indicate the measurement uncertainties, while it is important to signify the related uncertainty in reporting the enthalpy value. Therefore, in their study, they reported the average values and related uncertainty.
H = T 1 T 2 C p ( T ) · d T = T 1 T 2 d φ d t d T d t · d T = T 1 T 2 d φ d T · d T
H s u m ( T i ) = k = 0 i 1 H ( T k ) + H ( T i )
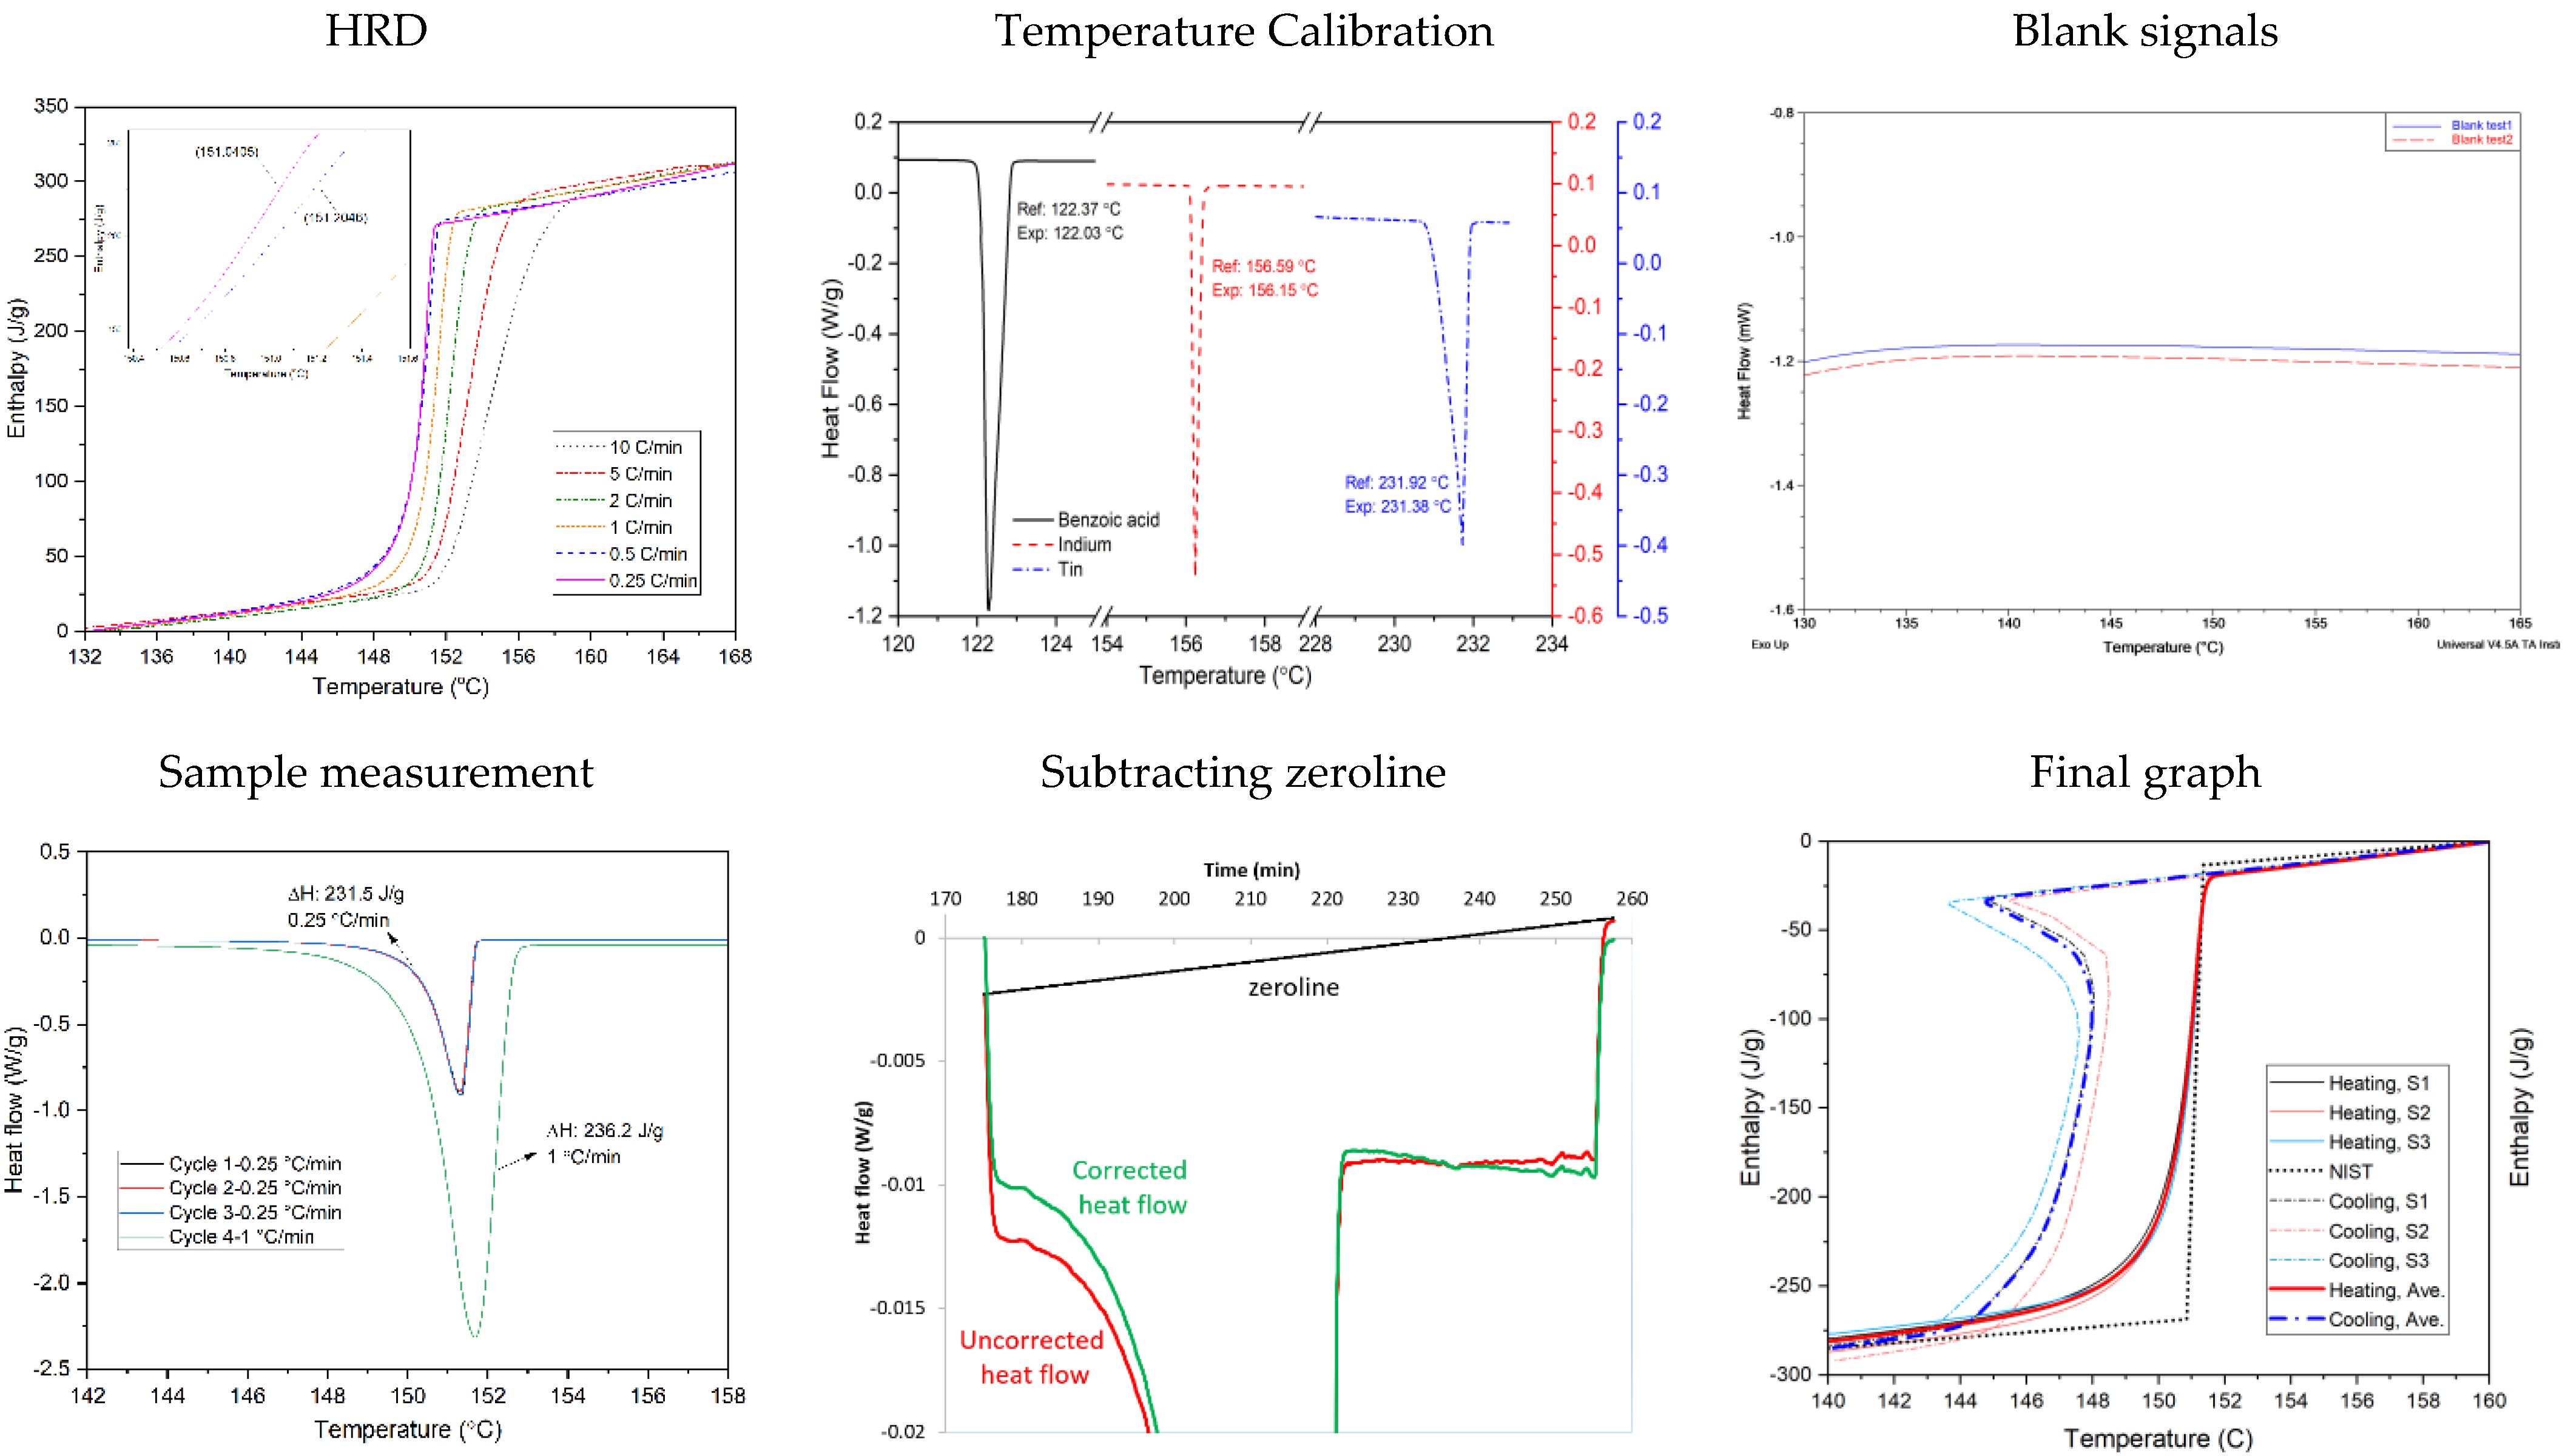
As mentioned previously, the enthalpy of fusion is obtained from the area under the fusion peak and principally, it should be independent of the heating rate. However, in practice, the peak of fusion extends over a temperature range and is accompanied with enthalpy and heat capacity contribution. The extension of the peak width is limited for metals, but for organic compounds, it could be significant [27,39,42]. Kahwaji et al. [54] studied the influence of the scan rate on the transition enthalpy of PT37 (PureTemp), and the measured values were 203 ± 20 J/g and 211 ± 20 J/g for heating rates of 1 K/min and 10 K/min, respectively. It was mentioned that the latter value was in good agreement with the supplier’s report (210 J/g). The enthalpy of eicosane (99% purity) was also measured, and the following values related to different heating rates were reported: 241 ± 24 J/g at 1 K/min, 237 ± 24 J/g at 2 K/min, 245 ± 25 J/g at 5 K/min and 239 ± 24 J/g at 10 K/min. There is, then, no clear trend for the transition enthalpy as a function of the heating rate [54]. The average value (241 ± 16 J/g) matches well with their five replication experiments on the same PCM with 10 K/min heating rate (246 ± 13 J/g). The DSC literature values range from (236 to 247) J/g, and the value obtained by adiabatic calorimetry is 247 J/g. Thus, it was concluded that the very low heating rate (less than 1 K/min) might undervalue the transition enthalpy. Therefore, it is recommended to use a heating rate within the range [1,2,3,4,5,6,7,8,9,10] K/min [54]. Sun et al. [57] studied the fusion heat of two paraffin-based and hydrated salt-based PCMs and observed that it is affected by both the heating rate and sample mass. However, this effect is greater for paraffin-based PCM than the hydrated salt-based one. For paraffin-based PCM, the fusion heat is changed by maximum 15% (with the same heating rate and different sample masses) and 24% (with the same sample mass and different heating rates). Furthermore, the start of the melting process was not apparent clearly on the enthalpy curve for paraffin-based PCM. Castellon et al. [45] investigated the effect of two modes of heating (dynamic and step methods) with six different heating rates from 0.2 to 10 K/min, and three masses on the enthalpy-temperature relationship of a commercial PCM named Rubitherm 27 (RT 27). They considered 10% uncertainty in enthalpy (δh <10%) and 0.5 K uncertainty in temperature (δT < 0.5 K) between a heating and cooling curve. They did not observe the mentioned criteria in dynamic mode of operation even for the lowest heating rates. Moreover, they observed a larger temperature uncertainty for larger sample but the enthalpy uncertainty was smaller. They concluded that by the increasing heating/cooling rates, the enthalpy determination gets more accurate. However, it increases the uncertainty on the temperature. For the step mode of heating, the amount of uncertainty is less than the limit of (δh <10%; δT < 0.5 K) considered by the authors. Therefore, the step method is less sensitive to measurement parameters. Günther et al. [22] mentioned that ±10 °C around the phase change can be considered an appropriate temperature range for PCM applications. Thus, a reasonable design can be made if the uncertainty remains below 10% for enthalpy and ±1 °C for temperature. Arkar and Medved [20] conducted an experimental and numerical study on the cylindrical latent heat thermal energy storage (LHTES) containing spheres filled with paraffin RT20 that melts around 17 °C. The potential application for the LHTES was a storage for accumulating low-energy daily heat and cold in buildings. The apparent heat capacity is considered in the numerical model, and it was based on DSC method in dynamic mode of operation under heating rates of 5, 1 and 0.1 °C/min. Apparent heat capacity is considered as a parameter that shows evolving latent heat over the temperature range. It was found that the rate of phase change temperature changes rarely exceeds 0.2 °C/min. Therefore, the numerical results obtained with the lowest heating rate (0.1 °C/min) showed a good agreement with the experiments. However, they concluded that the heating rates of 5 and 1 °C/min are not suitable for determining the heat stored as a function of temperature. Arkar and Medved [20] emphasized on the importance of determining thermal properties of PCMs considering different heating and cooling rates. Lazaro et al. [59] with a collaboration of different laboratories and two international organizations performed three types of round robin tests (RRT) to determine the melting enthalpy of n-octadecane. The first RRT was carried out without any defined procedure, the second RRT with a procedure only for measurement, and the last RRT with a defined procedure for all steps, such as measurement, calibration and data analysis. They did not reach a repeatable data in the first round. This can be also considered as evidence of the data discrepancy we observed in the literature. When all the participants ran the DSC tests according to a predefined procedure, they reached a comparable result within ±25 kJ/kg. During the third round of tests, they also applied a procedure for calibration, such as constructing a stable baseline. As a result, all participants reached accurate results for enthalpy and temperature, especially during heating. Unlike Kahwaji et al. [54], Lazaro et al. [59] underlined the need for a low heating rate (below 1 °C/min) to get accurate results. Thus, all the tests were conducted under the heating rate of 0.2 °C/min with 5 min isothermal before and after each ramp. It was also recommended to run a baseline test (empty pan) before each sample measurement with the same conditions (such as same heating rate and pan). In the frame of the same organizations and groups (IEA-SHC Task 42 and IEA-ECES Annex 42), researchers from different universities and centers such as Fraunhofer ISE, ZAE Bayern, Germany, Universität de Lleida, University of the Basque Country, University of Zaragoza, Spain, and Austrian Institute of Technology continued their experiments on developing a standard method for determining enthalpy curves of PCMs. The summary of this procedure can be seen in Table 7 and Figure 12. They started their measurements by following a procedure defined by German quality label PCM-RAL for determining heating rates [66]. In this procedure (IEA), one should apply several cycles of heating and cooling and the heating and cooling rates should be reduced to half of the previous rate. Whenever the difference between the two inflection points (peak temperatures of the heat flow curves) for two consecutive heating rates reaches less than 0.2°C between two consecutive heating rates or 0.5 °C between heating and cooling of the same rate, the suitable heating rate is found. Measurements with the determined heating rate decrease the deviation and avoid unnecessary use of very low heating rates. However, the deviation in terms of total enthalpy may remain quite large. Further improvement is reached by measuring the same sample mass and applying a uniform calibration in all DSC machines. Furthermore, mathematically correcting the baseline can lead to a better convergence of the enthalpy curves at the end (Figure 13a,b). The overall procedure developed by the mentioned groups can be observed in Table 7 and graphically in Figure 12.
For a mixture of different PCMs, the combination of phase equilibrium study with DSC results provides one with a robust method for determining the fusion heat and phase transition range by understanding the solid–liquid fraction at any temperature and related storage capacity in order to have a better system storage design. The storage density in any temperature range is a function of mixture and temperature range [8]. Thus, representing the phase diagram and eutectic composition is essential for eutectic mixture of PCMs [51]. Rathgeber et al. [29] represented the enthalpy–temperature plot for four PCMs, namely, (RT58, bischofite, D-mannitol and hydroquinone) using three different calorimetric methods. The applied methods were DSC, T-history and pilot plant set-up. DSC, T-history and pilot plant set-up require a few milligrams, grams and kilograms, respectively. They observed that representing enthalpy–temperature plots in a temperature range is advantageous compared to reporting a single value of enthalpy for a given temperature. They did recommend to compare the resulting enthalpy curves, as different methods at different scales lead to different results. In the case of PCMs experiencing multi transition (solid–solid then solid–liquid), such as the one in Figure 14, both DSC modes of dynamic and T-history are more suitable than step mode [14]. Gunther et al. [22] compared enthalpy-temperature plots obtained by DSC in dynamic, step, and T-history modes. They concluded that the results obtained by DSC in step mode and T-history show less uncertainty compared to dynamic DSC, but at the cost of considerable time consumption. A summary of the main studies concerning the enthalpy of PCMs by DSC method is proposed in Table 8.

4.3. Specific Heat Capacity

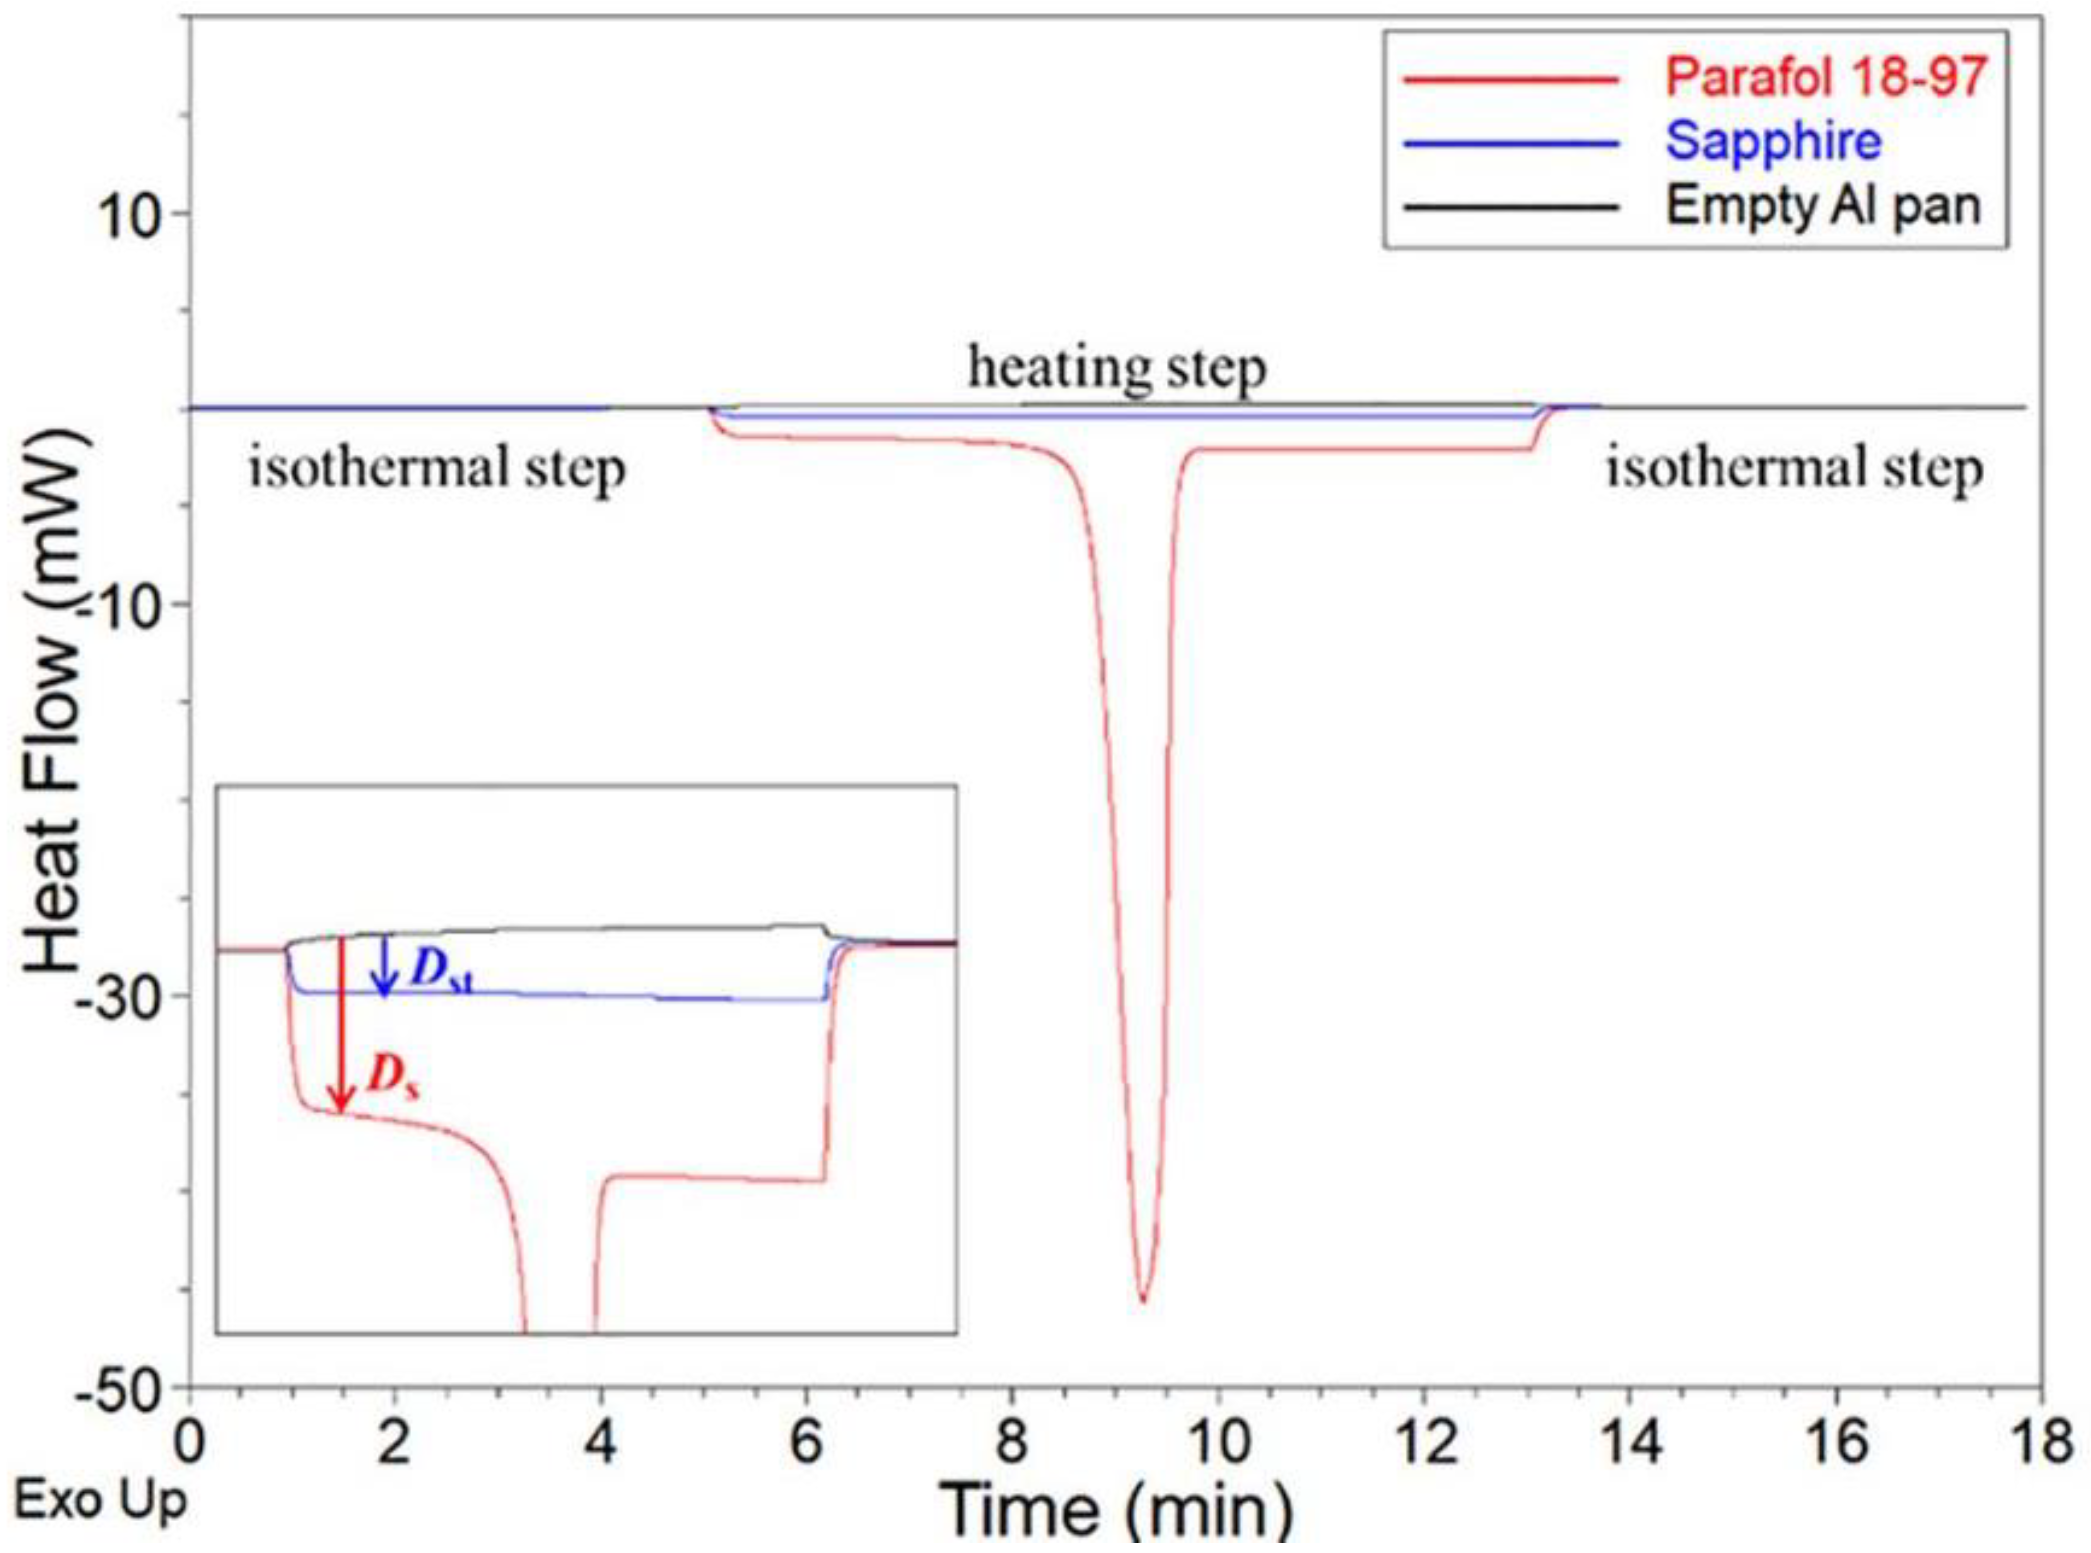
Measuring accurately the heat capacity of PCMs is of prime importance for (i) understanding the sensible contribution of a PCM to its thermal energy storage capability; (ii) having accurate data for modelling purposes and (iii) indirectly calculating the thermal conductivity [54]. Adiabatic calorimetry is the most reliable method to measure heat capacity [6]. However, these instruments are not regularly used for PCMs, because they are not commercialized like the regular DSCs and it remains an expensive method. The usual method to measure heat capacity is the one established by the American Society for Testing and Materials (ASTM), which includes three steps despite the DSC machine. First, the heat flow signal to the empty pan is measured. Then, the heat flow to a reference material, which is a high purity synthetic sapphire, is measured. Finally, an actual material is measured. All these three steps should be done under the same conditions, such as same pan/lid, heating rate and atmosphere conditions. The three-step method is represented schematically on Figure 15. Using the same pan reduces the uncertainty caused by the difference in the pan mass. However, the mass of the pans does not vary significantly and their specific heat capacity remains quite similar. Each heating program for heat capacity measurements consists of three segments: two isothermal steps at the starting temperature and at the end (for example, 5 min) and heating segments with a specific heating rate. The ASTM standard recommends a fast heating rate of 20 °C/min but researchers found that the 10 °C/min rate is suitable to determine the heat capacity. Another way to find the suitable heating rate and mass for heat capacity measurement is considering that the maximum deflection needed for sapphire is about 5 mW. Thus, one can adjust the mass and heating rate in order to achieve the signal close to 5 mW. Consequently, the test condition (sample mass and heating rate) for the sample should be the same as that of sapphire [43]. It is recommended, before each heat capacity measurement, to perform an indium test to check if the cell constant of the DSC is close to one. If the cell constant is not close to one, one needs to check the DSC cell for any contaminations. In order to analyze the data, one should subtract the empty crucible signal from the reference and sample. According to ASTM E1269-11 [44] and the work conducted by Kahwaji et al. [54], the sample heat capacity Cp(s) can be calculated through Equation (17), where Cpst is the heat capacity of sapphire, Cpan is the heat capacity of empty Al crucible, Ds is the vertical distance between empty crucible and sample signal, Dst is the vertical distance between empty crucible and sapphire signal, Wst is the mass of sapphire, Wpan is the mass of crucible and Ws is the mass of sample. Ferrer et al. [43] calculated the heat capacity using Equation (18), where ϕm is the material heat flow signal, ϕs is the sapphire heat flow signal, ms is the material mass and mst is the sapphire mass:
C p ( s ) = C p ( s t ) D s D s t W s t W s + C p ( p a n ) ( D s D s t ( W s t W p a n ) W s ( W s W p a n ) W s )
C p m = φ m · C p , s a p p h i r e ·   m s t m s · φ s t
By using the TA Q200 DSC and applying ASTM method [44], Kahwaji et al. [54] achieved 1.7% and 2.5% deviations in heat capacity of indium and magnesium, respectively. However, in case of PCM (paraffin-based Parafol 18–97), the deviation increased to 11.5% for solid state and 7% for liquid state. The determination of the Cp value from the heat flow curve obtained by DSC measurements is only possible over the flat region of the curve. One has to consider a margin before and after the transition to avoid even very small changes in the peak slope. More care has to be taken for PCMs exhibiting multiple peaks due to the phase transformation [67].
Rolka et al. [17] experimentally studied the effects of heating rate and sample mass on thermal properties of two commercially available PCMs, namely, RT15 and RT22 HC by DSC. These PCMs can be utilized for low temperature applications such as air conditioning systems. Their study is focused on heat capacity as a primary step to calculate the latent heat rather than an absolute value. The heat capacity is represented as a function of temperature based on heat flow measurements, and the strong dependency of heat flow curve on heating rates is observed. This means that by increasing the heating rate, the phase transition takes place over a wider temperature range. Therefore, to calculate latent heat, the specific phase transition range is determined for each heating rate and sample mass. For this purpose, a baseline (where there is no change in the sample properties) is defined based on heat capacity, and the point showing more than 2% change in heat capacity was considered as the starting point of transition. In order to determine the latent heat related to each heating rate, the enthalpy is calculated in the previously defined range for each PCM in a separate 1K temperature range. It was also observed that samples with a lower mass were less influenced by heating rate.
Saeed et al. [68] characterized octadecanoic acid among some organic PCMs in the temperature range of 70 °C to 90 °C as a promising candidate for nuclear safety applications. They emphasized the need for a modulated DSC for measuring the heat capacity in the overlap and phase transition regions. Generally, the heat capacity in solid and liquid states can be measured by the conventional heat-flux DSC following the ASTM three-step method (measuring baseline, calibration with sapphire and sample measurement). However, during the thermal events such as solid–liquid phase transition, it would be impossible to predict the correct baseline due to the large curvature, slope and offset of the baseline. In a conventional heat-flux DSC, the difference in terms of heat transferred between the furnace environment and the sample and between the furnace environment and the reference is measured over the thermal resistance (R) of conducting connections (heating disk) as a temperature difference. The model used in conventional DSC only considers the first term of Equation (19), which is an over-simplified model compared to the actual thermal events in the DSC. In order to evaluate the measurement based on the conventional model, the value of the thermal resistance should be determined by a calibration. Upon calibration, this model is acceptable to measure transition temperatures and the area under the curve. However, it would not be adequate to measure heat capacity, especially during the thermal event and overlap of the phases, with high precision.
q = Δ T R r + Δ T 0 ( 1 R s 1 R r ) + ( C r C s ) d T s d t C r d Δ T d t
The modulated DSC used by Saeed et al. [69] and commercialized by TA Instruments can account for the thermal resistance between the pan and the heating disk (due to imperfect surfaces) and the thermal capacitance of the pans (due to the heat capacities of the sample and reference pan). It can also eliminate the effect of baseline fluctuations, measure the imbalance between sample and reference (due to the sample mass and heating rate), and separate the thermal events utilizing a four-term equation. Considering the imbalance between the sample and the reference, Equation (19) becomes:
q = Δ T 0 R s C s d T s d t [ Δ T 0 Δ T R r C r ( d T s d t d Δ T d t ) ] · m p s m p r d T p s / d t d T p r / d t
where mp is the mass of DSC pan and Tp is the measured temperature difference between the reference pan or sample pan (Tpr or Tps). This temperature difference is calculated using the thermal contact resistance (Rp) between each calorimeter and its pan using the following equations [68]:
T p s = T s [ T 0 T s R s C s d T s d t ] R p s
T p r = T r [ T 0 T r R r C r d T r d t ] R p r
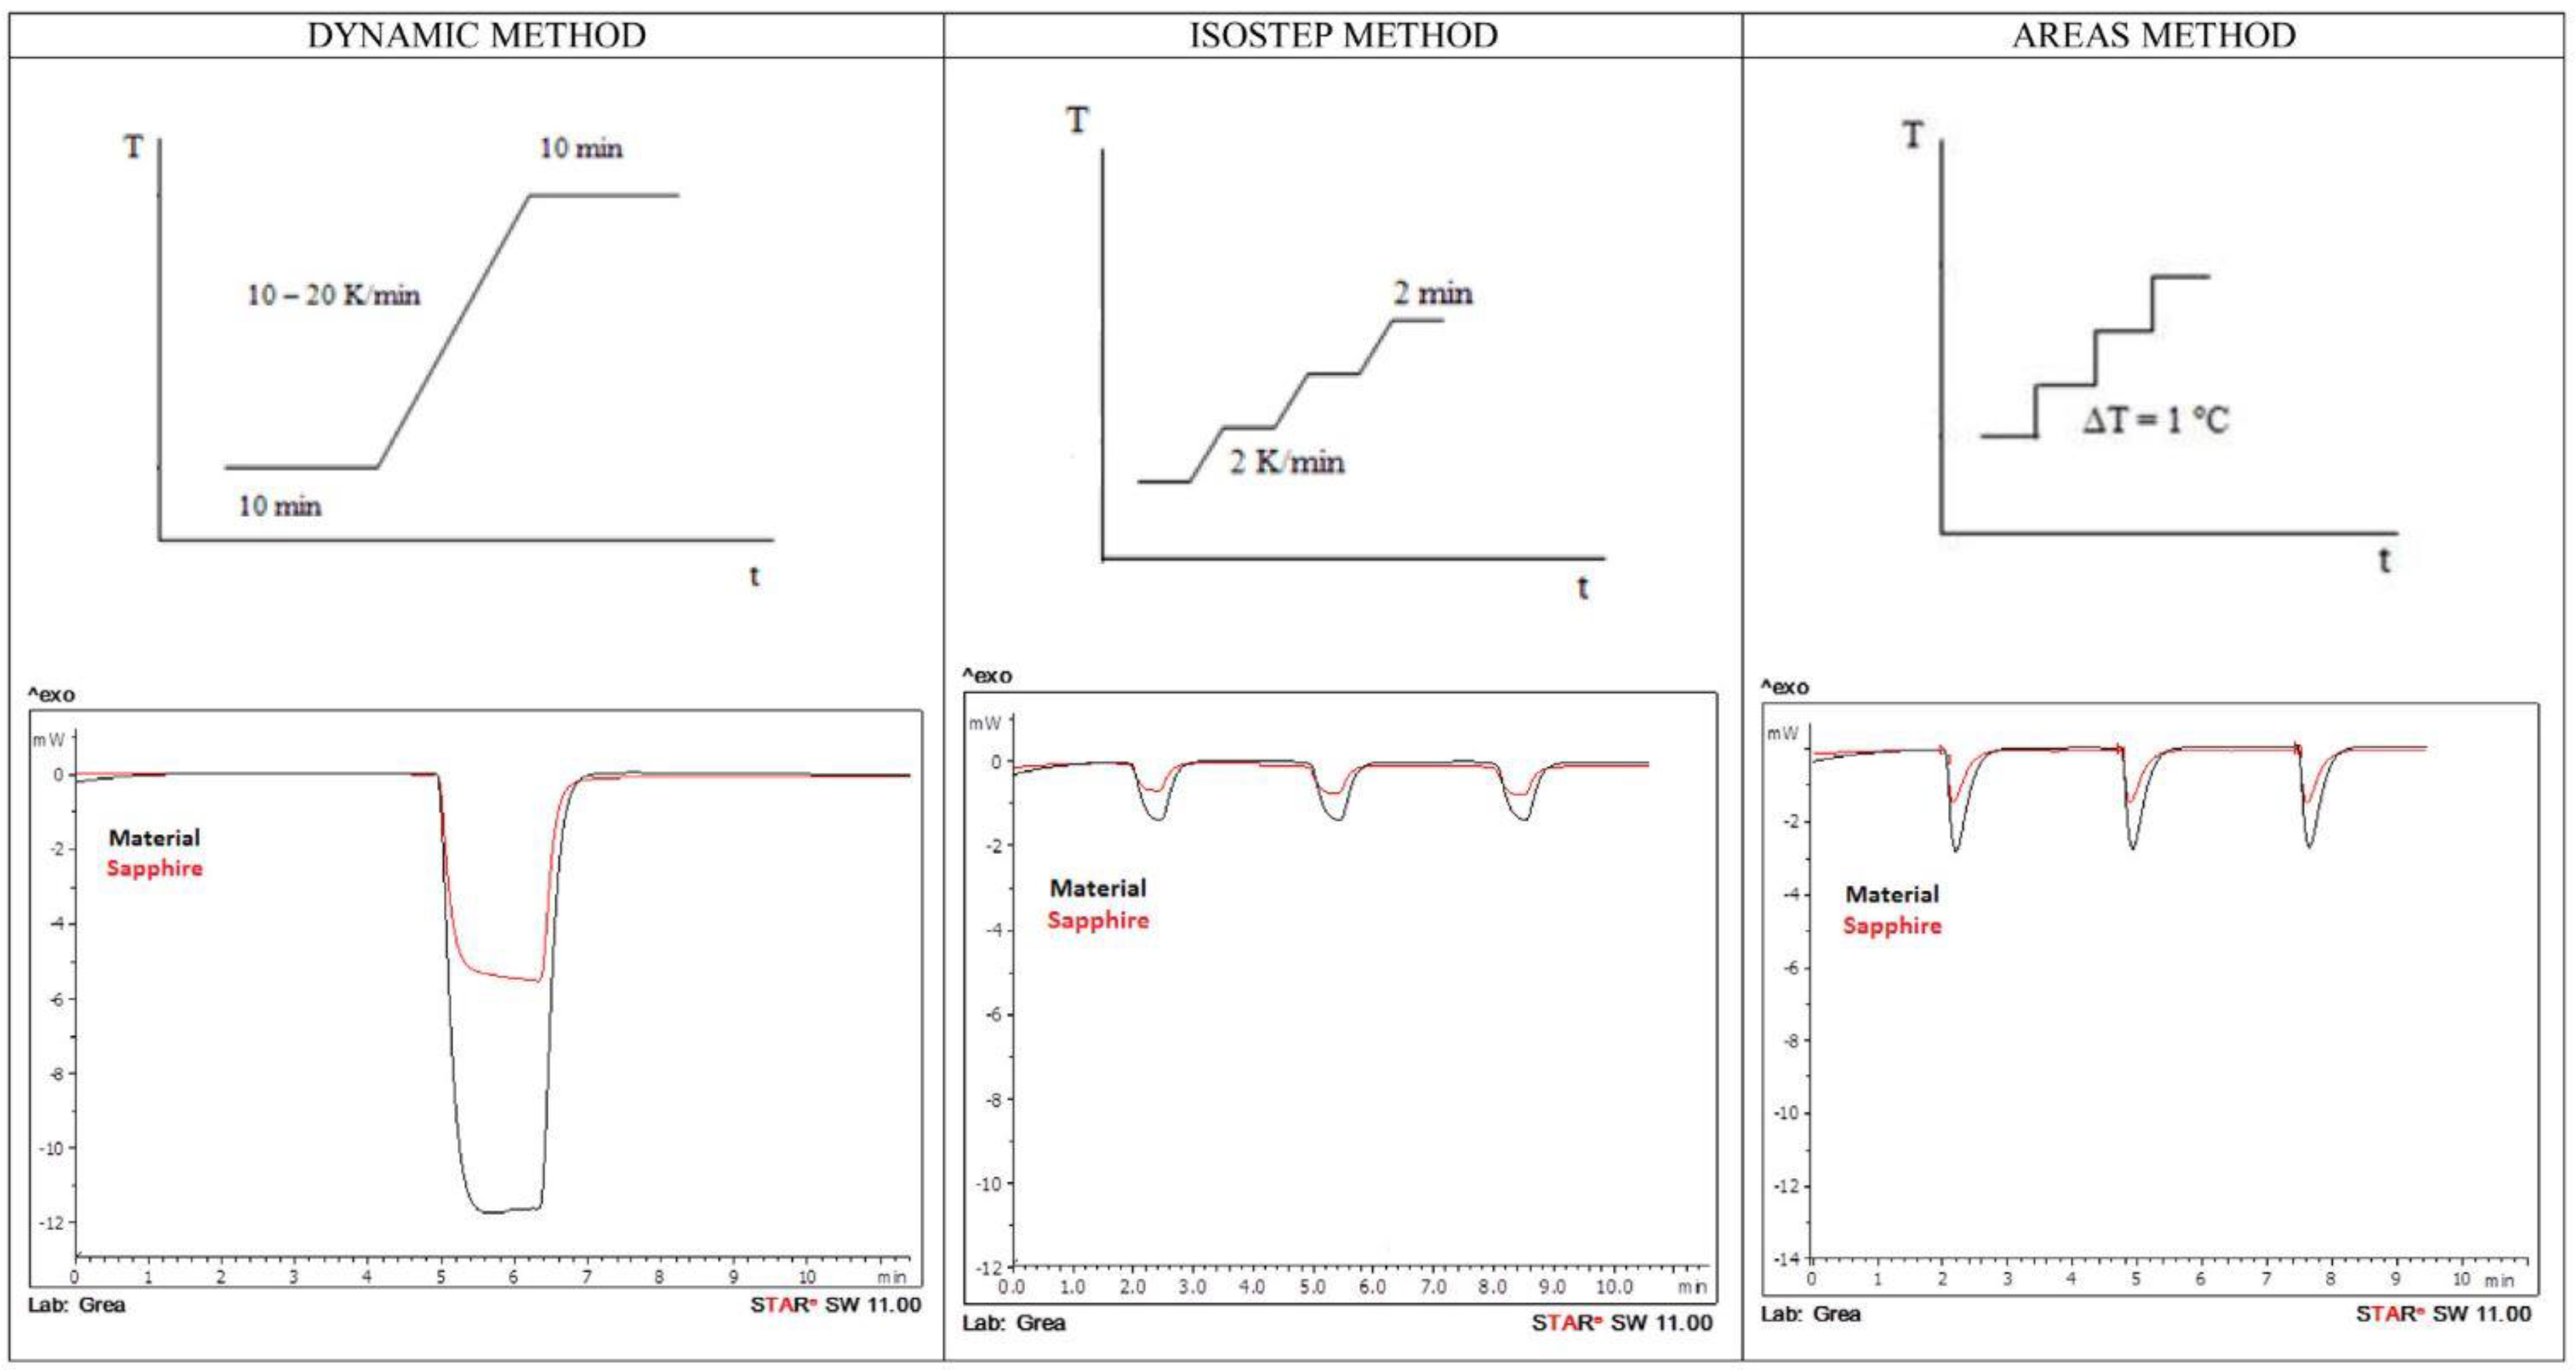
Zeng et al. [69] measured the heat capacity of (E)-3-phenylbut-2-enoic acid, which melts at around 95 °C and can be integrated in a solar energy absorption cooling system. This PCM is a suitable candidate for such a system that can store a large amount of thermal energy obtained by solar irradiation to power the adsorption chiller. This compound is also applied as a substrate in catalyzed organic chemistry. They measured the specific heat capacity of this PCM by a temperature modulated DSC within the overall uncertainty of 5% and calculated the thermodynamic properties such as enthalpy and entropy. They observed a monotonic increase in heat capacity for both solid and liquid states as functions of temperature. Sam et al. [62] investigated the thermal properties of four organic low temperature PCMs suitable for building applications namely RT24, RT25, RT26 and PT25. Regarding the heat capacity measurements, they used a combination of two high and low heating rates: high heating rate (10 °C/min) for scanning the regions before and after the thermal transition (sensible regions), and low heating rates of 0.25 and 0.125 °C/min for scanning the transition region. The high heating rate is proposed by the calorimetry standards such as ASTM-E1269-11 and DIN 51007 to minimize the signal to noise ratio, and the low heating rate is proposed by IEA standards to decrease the influence of the heating rate in the transition region. Sun et al. [57] studied the heat capacity of paraffin-based n-octadecane and hydrated salt calcium chloride hexahydrate at different heating rates of 0.5, 1 and 2 °C/min with two (low and high) masses. They observed that the peak height of the heat capacity curve decreases by increasing the heating rate and sample mass. The peak is also stretched to a higher temperature. Generally, the heat capacity in the liquid state is higher than in the solid state due to the higher molecular motion and the higher ability of the material to absorb heat. However, Sun et al. [57] observed a higher heat capacity in the solid state for paraffin that is attributed to the amorphous state in the solid paraffin. Ferrer et al. [43] measured the heat capacity of three materials used in sensible thermal energy storage systems with three different heating methods. These three methods include dynamic heating mode (consisting of two isothermal segments at the start and end temperatures and a heating ramp segment between the isothermals), isostep mode (consisting of short heating ramp stages with short isothermals before and after the ramp), and the areas method (consisting of isothermal segments with no heating ramp), as shown in Figure 16. It was reported that the isostep method failed to measure heat capacity, mostly due to a sensitivity problem caused by applying high heating rates to the sample [43]. The dynamic method showed a better performance compared to isostep. However, it also suffers from sensitivity problem at the beginning and end of the heating ramp. In both isostep and dynamic methods, the DSC temperature sensor cannot react to the abrupt temperature change and consequently, the obtained results at the beginning and end of the ramp cannot be trusted. This problem can be mitigated in dynamic mode, because there is only one continuous ramp to program the temperature over a wider range of interest. However, isostep method consists of consecutive heating segments. Ferrer et al. [43] concluded that the performance of the areas method is higher than that of the dynamic and isostep methods, as its deviation from the theoretical value remains below 3%. A summary of the studies concerning the specific heat capacity of PCMs by DSC method is shown in Table 9.

4.4. Thermal Stability

One of the important properties of PCMs is their thermal stability, which indicates how the enthalpy and the melting point of PCMs change undergoing multiple cycles of melting and solidification. Using a DSC machine, by customizing the test conditions (atmosphere of the test, open or sealed crucibles), the thermal cycling experiments from several to hundreds of cycles can be conducted [42,69]. During thermal cycling experiments, the transition temperatures and enthalpies of subsequent cycles are compared with the first cycle. Höhlein et al. [26] conducted a long-term thermal stability test (500 cycles) of MgCl2·6H2O as a PCM using DSC thermal cycling experiments. The weight of the MgCl2·6H2O sample was 10 mg under a heating rate of 10 °C/min. It was observed that the melting temperature shifts to a higher temperature by 0.3 °C. The melting enthalpy experienced an increase in the first cycle and decreased afterward by about 99% of the starting value. Fatahi et al. [42] investigated the thermal stability of two organic PCMs (adipic acid and PT151®) having a melting point of 150 °C. Good thermal stability for both PCMs was observed (less than 10% decrease in enthalpy after 50 cycles). Moreover, adipic acid exhibits a better performance compared to PT151®, while it is available at a lower price. Han et al. [70] investigated the thermal stability of oxalic acid dihydrate (OAD) and blends of OAD/polyethylene glycol (PEG) under 100 cycles of melting/solidification by DSC with different pan types. In a standard aluminum pan, OAD loses above 85% of its initial enthalpy due to the non-hermetically sealed crucibles, and the reaction of OAD with the aluminum pan leads to the corrosion of the crucible. The lower enthalpy loss (around 56%) was observed when they used a sealed, corrosion-resistant crucible (high-pressure gold-plated pan). Han et al. [70] also concluded that adding 2.5% of PEG 6000 can improve the thermal stability of OAD without considerable enthalpy reduction. Thermal stability of a PCM can be verified with an unconventional set-up or a conventional method like DSC. Salyan and Suresh [71] investigated the thermal performance of D-mannitol (DM) and DM with 0.1% and 0.5% weight percentage of Gallium (Ga) under 350 thermal cycles by a hot plate heater set-up (unconventional). The samples were taken after thermal cycling for further analysis, such as TGA (thermogravimetric analysis), DSC, and thermal conductivity, and were compared with the pure samples. They concluded that DM/Ga composite is stable in the temperature range between 50 °C and 150 °C and can be used as a TES material. However, they did not mention if the tested samples in TGA experiments were in closed or open crucibles. Conducting thermal stability experiments with a DSC machine is quite a bit faster than the other methods, such as T-history. However, DSC sample scale is limited to a few milligrams. Zeng et al. [69] carried out 50 cyclic DSC experiments on (E)-3-phenylbut-2-enoic acid. According to their results, they concluded that single and similar endothermic/exothermic peaks mean that the PCM underwent a one-step melting and solidification during thermal cycles, which is a desired property for PCMs. The other method to carry out thermal stability experiments is to perform thermal analysis by the simultaneous DSC/TGA, which has a sensible balance to detect the mass loss during the measurements and allows one to conduct an experiment under the desired conditions (temperature range, heating rate and atmosphere) [48,72]. Gasia et al. [72] conducted the thermal cycling test in an oven using around 150 g of PCM. After a certain number of cycles, a sample of 10 mg was tested in a DSC.

5. Conclusions

The current paper reviews studies that are focused on establishing a method or a protocol for DSC measurements of PCMs. This paper provides an introduction on calorimetric methods, calibration, and challenges in the characterization of PCMs’ properties by DSC. The main limitation of calorimetry measurements based on DSC is the small sample size, especially for composite and heterogenous PCMs. However, using a proper method that addresses determining suitable heating rate, proper calibration and repetitions can yield reliable results. Following, the main conclusions for each property including the transition temperature, enthalpy, heat capacity, and thermal stability are summarized.
Any improvement on the determination of the transition range improves the performance of PCM-based TES. Among the transition temperatures, the melting onset is less affected by the mass of PCM and the heating rate. Thus, it can be considered as the PCM melting point. It was observed that the shape of the transition peak is dependent on the heating rate, the heat of transition and thermal conductivity of the sample. Thus, in order to minimize the thermal gradient within the sample, using low heating rates is recommended. Multipoint calibration of the DSC machine, including a calibrant with a close melting point to the PCM, can improve accuracy in determining temperature. In case of salt hydrates and mixtures of PCMs, high heating rates hide more information about the melting kinetics. Depending on the application, the transition temperature of a PCM should be determined with an uncertainty of ±0.5–1°C.
Low heating rate might underestimate enthalpy due to the high signal to noise ratio. Thus, it is recommended, after a first measure using a low heating rate, to measure the heat flow with a higher heating rate to check the value of enthalpy. In case of a step mode heating, values with a very low uncertainty could be obtained but at the cost of consuming a large amount of time. However, a dynamic heating program is closer to the actual situation of a PCM in a realistic application. For heterogeneous PCMs, other calorimetric methods allowing larger samples, such as the T-history method, are recommended. Enthalpy–temperature graphs for both melting and solidification provide useful information for PCMs, though they are not widely interpreted in PCMs studies. It is also discussed that the IEA method is a reliable method to determine the enthalpy of PCMs. The maximum uncertainty on that quantity should be less than 10%.
In PCMs characterization, measuring heat capacity is crucial for understanding the contribution of sensible heat in thermal storage and for indirect calculation of thermal conductivity. In DSC experiments, the three steps method can be used in the dynamic or area heating methods. The most important point is to apply exactly the same test conditions for blank, sapphire and sample measurements. The sample size for both sapphire and sample should remain in the same range.
With the help of DSC experiments, one can estimate the thermal stability of a PCM faster than any other method. However, the sample is limited to a few milligrams. One can observe the change in the enthalpy value and in the peak shape during multiple cycles of melting and solidification. One can also conduct the thermal cycling of larger samples in a temperature-programmable oven, then test the sample in a DSC.
According to the increasing demand for energy and environmental concerns, thermal energy storage is a promising technology to address these needs. This review paper highlights the important role of calorimetric characterization, especially DSC, in integrating PCMs in TES applications. This study summarizes the research on thermal characterization of PCMs by DSC with a focus on methods, approaches and recommendations to improve the accuracy of measurements for future studies. Furthermore, this review encourages researchers in the fields of PCM to report complete DSC test conditions, including calibration, type of crucible, temperature program, uncertainty, etc. Finally, expanding the temperate range of PCM studies is recommended due to the increasing interest in integrating PCMs in different applications, from sub ambient and thermal comfort to industrial waste heat recovery.

Author Contributions

Conceptualization, H.F., J.C. and S.P.; methodology, H.F.; formal analysis, H.F.; investigation, H.F.; data curation, H.F.; writing—original draft preparation, H.F.; writing—review and editing, H.F., J.C. and S.P.; supervision, J.C. and S.P.; project administration, S.P.; funding acquisition, S.P. All authors have read and agreed to the published version of the manuscript.

Funding

This research was funded by the Canadian Foundation for Innovation through the John R. Evans Leaders fund (grant 34582).

Institutional Review Board Statement

Not applicable.

Informed Consent Statement

Not applicable.

Data Availability Statement

Not applicable.

Acknowledgments

H.F. and S.P. would like to thank the financial support of the NSERC chair on industrial energy efficiency established in 2019 at Université de Sherbrooke and funded by Hydro-Québec, Natural Resources Canada and Emerson Commercial and Residential Solutions. They also acknowledge the support of the Canadian Foundation for Innovation through the John R. Evans Leaders fund (grant 34582).

Conflicts of Interest

The authors declare no conflict of interest.

Nomenclature

SymbolsAbbreviations
Cp: specific heat capacity (J·g−1·°C−1)
D: distance between empty crucible and sample signal (m)
h: enthalpy (J)
I: electrical current (A)
Kσ: stress constant
P: power (W)
Q: thermal energy (J)
Q ˙ : heat flow difference (J·s−1)
R: thermal resistance (K·W−1)
m: mass (kg)
t: time (s)
T: temperature (K)
U: voltage difference (V)
AC: adiabatic calorimetry
ASC: adiabatic scanning calorimetry
ASTM: American society for testing and materials
CAES: compressed air energy storage
DSC: differential scanning calorimetry
HDR: hear rate determination
Hf-DSC: heat-flux DSC
IEA: international energy agency
IWH: industrial waste heat
LHTES: latent heat thermal energy storage
NIST: National Institute of Standard and Technology
pASC: Peltier based adiabatic scanning calorimetry
PCM: phase change material
RRT: round robin tests
SEM: scanning electron microscopy
TES: thermal energy storage
TGA: thermogravimetric analysis
3LC: three layers calorimeter
Greek SymbolsSubscript
β: heating/cooling rate (°C·min−1)
ϕ: heat flow (mW)
Δ: difference
δ: uncertainty
a: ambient
a–s: between ambient and sample
a–r: between ambient and reference
el: electric
s: sample
r: reference
st: sapphire
1: temperature in point 1
2: temperature in point 2

References

  1. Barreneche, C.; Solé, A.; Miró, L.; Martorell, I.; Fernández, A.I.; Cabeza, L.F. Study on differential scanning calorimetry analysis with two operation modes and organic and inorganic phase change material (PCM). Thermochim. Acta 2013, 553, 23–26. [Google Scholar] [CrossRef]
  2. Feng, P.H.; Zhao, B.C.; Wang, R.Z. Thermophysical heat storage for cooling, heating, and power generation: A review. Appl. Therm. Eng. 2020, 166, 114728. [Google Scholar] [CrossRef]
  3. Li, Z.; Lu, Y.; Huang, R.; Chang, J.; Yu, X.; Jiang, R.; Yu, X.; Roskilly, A.P. Applications and technological challenges for heat recovery, storage and utilisation with latent thermal energy storage. Appl. Energy 2021, 283, 116277. [Google Scholar] [CrossRef]
  4. Miró, L.; Brückner, S.; Cabeza, L.F. Mapping and discussing Industrial Waste Heat (IWH) potentials for different countries. Renew. Sustain. Energy Rev. 2015, 51, 847–855. [Google Scholar] [CrossRef] [Green Version]
  5. Franquet, E.; Gibout, S.; Bédécarrats, J.P.; Haillot, S.; Dumas, J.P. Inverse method for the identification of the enthalpy of phase change materials from calorimetry experiments. Thermochim. Acta 2012, 546, 61–80. [Google Scholar] [CrossRef]
  6. Mehling, H.; Leys, J.; Glorieux, C.; Thoen, J. Potential new reference materials for caloric measurements on PCM. SN Appl. Sci. 2021, 3, 202. [Google Scholar] [CrossRef]
  7. Gschwander, S.; Haussmann, T.; Hagelstein, G.; Sole, A.; Cabeza, L.F.; Diarce, G.; Hohenauer, W.; Lager, D.; Ristic, A.; Rathgeber, C.; et al. Standardization of PCM Characterization Via DSC; Greenstock: Beijing, China, 2015. [Google Scholar]
  8. He, B.; Martin, V.; Setterwall, F. Phase transition temperature ranges and storage density of paraffin wax phase change materials. Energy 2004, 29, 1785–1804. [Google Scholar] [CrossRef]
  9. Schmit, H.; Rathgeber, C.; Hoock, P.; Hiebler, S. Critical review on measured phase transition enthalpies of salt hydrates in the context of solid-liquid phase change materials. Thermochim. Acta 2020, 683, 178477. [Google Scholar] [CrossRef]
  10. Solé, A.; Miró, L.; Barreneche, C.; Martorell, I.; Cabeza, L.F. Review of the T-history method to determine thermophysical properties of phase change materials (PCM). Renew. Sustain. Energy Rev. 2013, 26, 425–436. [Google Scholar] [CrossRef]
  11. Peng, H.; Wang, J.; Zhang, X.; Ma, J.; Shen, T.; Li, S.; Dong, B. A review on synthesis, characterization and application of nanoencapsulated phase change materials for thermal energy storage systems. Appl. Therm. Eng. 2021, 185, 116326. [Google Scholar] [CrossRef]
  12. Min, K.E.; Jang, J.W.; Kim, J.K.; Wern, C.; Yi, S. Thermophysical Properties of Inorganic Phase-Change Materials Based on MnCl2·4H2O. Appl. Sci. 2022, 12, 6338. [Google Scholar] [CrossRef]
  13. Fleischer, A.S. Thermal Energy Storage Using Phase Change Materials: Fundamentals and Applications; Springer: Berlin/Heidelberg, Germany, 2015. [Google Scholar]
  14. Rathgeber, C.; Miró, L.; Cabeza, L.F.; Hiebler, S. Measurement of enthalpy curves of phase change materials via DSC and T-History: When are both methods needed to estimate the behaviour of the bulk material in applications? Thermochim. Acta 2014, 596, 79–88. [Google Scholar] [CrossRef]
  15. Fatahi, H.; Claverie, J.; Poncet, S. Experimental investigation of the rheological and phase change behavior of adipic acid as a phase change material (PCM) for thermal energy storage at 150 °C. Thermochim. Acta 2022, 711, 179206. [Google Scholar] [CrossRef]
  16. Irfan Lone, M.; Jilte, R. A review on phase change materials for different applications. Mater. Today Proc. 2021, 46, 10980–10986. [Google Scholar] [CrossRef]
  17. Rolka, P.; Przybylinski, T.; Kwidzinski, R.; Lackowski, M. The heat capacity of low-temperature phase change materials (PCM) applied in thermal energy storage systems. Renew. Energy 2021, 172, 541–550. [Google Scholar] [CrossRef]
  18. Mehling, H.; Cabeza, L.F. Heat and Cold Storage with PCM An up to Date Introduction into Basics and Applications; Springer: Berlin/Heidelberg, Germany, 2008. [Google Scholar]
  19. Höhne, G.W.H.; Hemminger, W.F.; Flammersheim, H.-J. Differential Scanning Calorimetry, 2nd ed.; Springer: Berlin/Heidelberg, Germany, 2008. [Google Scholar]
  20. Arkar, C.; Medved, S. Influence of accuracy of thermal property data of a phase change material on the result of a numerical model of a packed bed latent heat storage with spheres. Thermochim. Acta 2005, 438, 192–201. [Google Scholar] [CrossRef]
  21. Gabbott, P. Principles and Applications of Thermal Analysis; Blackwell Publishing Ltd.: Oxford, UK, 2008. [Google Scholar]
  22. Günther, E.; Hiebler, S.; Mehling, H.; Redlich, R. Enthalpy of phase change materials as a function of temperature: Required accuracy and suitable measurement methods. Int. J. Thermophys. 2009, 30, 1257–1269. [Google Scholar] [CrossRef]
  23. Yinping, Z.; Yi, J. A simple method, the -history method, of determining the heat of fusion, specific heat and thermal conductivity of phase-change materials. Meas. Sci. Technol. 1999, 10, 201–205. [Google Scholar] [CrossRef]
  24. Marín, J.M.; Zalba, B.; Cabeza, L.F.; Mehling, H. Determination of enthalpy–temperature curves of phase change materials with thetemperature-history method: Improvement to temperature dependentproperties. Meas. Sci. Technol. 2003, 14, 184. [Google Scholar] [CrossRef]
  25. Lázaro, A.; Günther, E.; Mehling, H.; Hiebler, S.; Marín, J.M.; Zalba, B. Verification of a T-history installation to measure enthalpy versus temperature curves of phase change materials. Meas. Sci. Technol. 2006, 17, 2168. [Google Scholar] [CrossRef]
  26. Höhlein, S.; König-Haagen, A.; Brüggemann, D. Thermophysical characterization of MgCl2·6H2O, xylitol and erythritol as phase change materials (PCM) for latent heat thermal energy storage (LHTES). Materials 2017, 10, 444. [Google Scholar] [CrossRef] [Green Version]
  27. Charsley, E.L.; Laye, P.G.; Markham, H.M.; Le Goff, T. Calibration of differential scanning calorimeters: A comparison between indium and diphenylacetic acid. Thermochim. Acta 2010, 497, 72–76. [Google Scholar] [CrossRef]
  28. Rathgeber, C.; Schmit, H.; Hennemann, P.; Hiebler, S. Calibration of a T-History calorimeter to measure enthalpy curves of phase change materials in the temperature range from 40 to 200 °C. Meas. Sci. Technol. 2014, 25, 035011. [Google Scholar] [CrossRef]
  29. Rathgeber, C.; Schmit, H.; Miró, L.; Cabeza, L.F.; Gutierrez, A.; Ushak, S.N.; Hiebler, S. Enthalpy-temperature plots to compare calorimetric measurements of phase change materials at different sample scales. J. Energy Storage 2018, 15, 32–38. [Google Scholar] [CrossRef] [Green Version]
  30. Archer, D.G.; Kirklin, D.R. NIST and standards for calorimetry. Thermochim. Acta 2000, 347, 21–30. [Google Scholar] [CrossRef]
  31. Archer, D.G. New NIST-traceable standards for calibration and validation of DSC. J. Therm. Anal. Calorim. 2006, 85, 131–134. [Google Scholar] [CrossRef]
  32. Leys, J.; Duponchel, B.; Longuemart, S.; Glorieux, C.; Thoen, J. A new calorimetric technique for phase change materials and its application to alkane-based PCMs. Mater. Renew. Sustain. Energy 2016, 5, 4. [Google Scholar] [CrossRef] [Green Version]
  33. Leys, J.; Losada-Pérez, P.; Slenders, E.; Glorieux, C.; Thoen, J. Investigation of the melting behavior of the reference materials biphenyl and phenyl salicylate by a new type adiabatic scanning calorimeter. Thermochim. Acta 2014, 582, 68–76. [Google Scholar] [CrossRef]
  34. Archer, D.G. The Enthalpy of Fusion of Gallium. J. Chem. Eng. Data 2002, 47, 304–309. [Google Scholar] [CrossRef]
  35. Standard Test Method for Using a Heat Flow Meter Apparatus for Measuring Thermal Storage Properties of Phase Change Materials and Products. Available online: https://www.astm.org/c1784-20.html (accessed on 21 March 2022).
  36. Göbel, A.; Vidi, S.; Klinker, F.; Hemberger, F.; Brütting, M.; Ebert, H.P.; Mehling, H. Method for the Thermal Characterization of PCM Systems in the Volume Range from 100 ml to 1000 ml. Int. J. Thermophys. 2017, 38, 67. [Google Scholar] [CrossRef]
  37. Moukhina, E. Enthalpy calibration for wide DSC peaks. Thermochim. Acta 2011, 522, 96–99. [Google Scholar] [CrossRef]
  38. Price, D.M. Temprature calibration of differential scanning calorimeters. J. Therm. Anal. 1995, 45, 1285–1296. [Google Scholar] [CrossRef]
  39. Su, W.; Gao, L.; Wang, L.; Zhi, H. Calibration of differential scanning calorimeter (DSC) for thermal properties analysis of phase change material. J. Therm. Anal. Calorim. 2021, 143, 2995–3002. [Google Scholar] [CrossRef]
  40. Pishchur, D.P.; Drebushchak, V.A. Recommendations on DSC calibration: How to escape the transformation of a random error into the systematic error. J. Therm. Anal. Calorim. 2016, 124, 951–958. [Google Scholar] [CrossRef]
  41. Thermal Analysis & Rheology. Available online: https://www.tainst.com (accessed on 15 March 2022).
  42. Fatahi, H.; Poncet, S.; Claverie, J. Thermal storage properties of organic PCMs with operating temperature of 150 °C by DSC. In Proceedings of the 13th IIR Conference on Phase Change Materials and Slurries for Refrigeration and Air Conditioning, Vicenza, Italy, 1–3 September 2021; pp. 1–8. [Google Scholar]
  43. Ferrer, G.; Barreneche, C.; Solé, A.; Martorell, I.; Cabeza, L.F. New proposed methodology for specific heat capacity determination of materials for thermal energy storage (TES) by DSC. J. Energy Storage 2017, 11, 1–6. [Google Scholar] [CrossRef] [Green Version]
  44. ASTM E1269-11; Standard Test Method for Determining Specific Heat Capacity by Differential Scanning Calorimetry. ASTM International: West Conshohocken, PA, USA, 2018. [CrossRef]
  45. Castellón, C.; Günther, E.; Mehling, H.; Hiebler, S.; Cabeza, L.F. Determination of the enthalpy of PCM as a function of temperature using a heat-flux DSC—A study of different measurement procedures and their accuracy. Int. J. Energy Res. 2008, 32, 1258–1265. [Google Scholar] [CrossRef]
  46. Li, L.; Yu, H.; Wang, X.; Zheng, S. Thermal analysis of melting and freezing processes of phase change materials (PCMs) based on dynamic DSC test. Energy Build. 2016, 130, 388–396. [Google Scholar] [CrossRef]
  47. Del Barrio, E.P.; Dauvergne, J.L. A non-parametric method for estimating enthalpy-temperature functions of shape-stabilized phase change materials. Int. J. Heat Mass Transf. 2011, 54, 1268–1277. [Google Scholar] [CrossRef]
  48. Haillot, D.; Bauer, T.; Kröner, U.; Tamme, R. Thermal analysis of phase change materials in the temperature range 120–150 °C. Thermochim. Acta 2011, 513, 49–59. [Google Scholar] [CrossRef]
  49. Rathgeber, C.; Gutierrez, A. Analysis of supercooling of phase change materials with increased sample size-Comparison of measurements via DSC, T-History and at pilot plant scale Caloric measurements on PCM-collection of key publications and discussion View project MERITS View project. In Proceedings of the 13th International Conference on Energy Storage Greenstock, Beijing, China, 19–21 May 2015. [Google Scholar]
  50. Zhao, Y.; Zhang, X.; Xu, X.; Zhang, S. Research progress in nucleation and supercooling induced by phase change materials. J. Energy Storage 2020, 27, 101156. [Google Scholar] [CrossRef]
  51. Zeng, J.L.; Chen, Y.H.; Shu, L.; Yu, L.P.; Zhu, L.; Bin Song, L.; Cao, Z.; Sun, L.X. Preparation and thermal properties of exfoliated graphite/erythritol/mannitol eutectic composite as form-stable phase change material for thermal energy storage. Sol. Energy Mater. Sol. Cells 2018, 178, 84–90. [Google Scholar] [CrossRef]
  52. Zeng, J.-L.; Zhou, L.; Zhang, Y.-F.; Sun, S.-L.; Chen, Y.-H.; Shu, L.; Yu, L.-P.; Zhu, L.; Song, L.-B.; Cao, Z. Effects of some nucleating agents on the supercooling of erythritol to be applied as phase change material. J. Therm. Anal. Calorim. 2017, 129, 1291–1299. [Google Scholar] [CrossRef]
  53. Jin, X.; Hu, H.; Shi, X.; Zhang, X. Energy asymmetry in melting and solidifying processes of PCM. Energy Convers. Manag. 2015, 106, 608–614. [Google Scholar] [CrossRef]
  54. Kahwaji, S.; Johnson, M.B.; White, M.A. Thermal property determination for phase change materials. J. Chem. Thermodyn. 2021, 160, 106439. [Google Scholar] [CrossRef]
  55. Yuan, Y.; Zhang, N.; Tao, W.; Cao, X.; He, Y. Fatty acids as phase change materials: A review. Renew. Sustain. Energy Rev. 2014, 29, 482–498. [Google Scholar] [CrossRef]
  56. Venkata Krishnan, R.; Nagarajan, K. Evaluation of heat capacity measurements by temperature-modulated differential scanning calorimetry. J. Therm. Anal. Calorim. 2010, 102, 1135–1140. [Google Scholar] [CrossRef]
  57. Sun, X.; Lee, K.O.; Medina, M.A.; Chu, Y.; Li, C. Melting temperature and enthalpy variations of phase change materials (PCMs): A differential scanning calorimetry (DSC) analysis. Phase Transitions 2018, 91, 667–680. [Google Scholar] [CrossRef]
  58. ASTM E967-08; American Society for Testing and Materials (ASTM®), Standard Test Method for Temperature Calibration of Differential Scanning Calorimeters and Differential Thermal Analyzers. ASTM International: West Conshohocken, PA, USA, 2014.
  59. Lazaro, A.; Peñalosa, C.; Solé, A.; Diarce, G.; Haussmann, T.; Fois, M.; Zalba, B.; Gshwander, S.; Cabeza, L.F. Intercomparative tests on phase change materials characterisation with differential scanning calorimeter. Appl. Energy 2013, 109, 415–420. [Google Scholar] [CrossRef]
  60. Dolado, P.; Mazo, J.; Lázaro, A.; Marín, J.M.; Zalba, B. Experimental validation of a theoretical model: Uncertainty propagation analysis to a PCM-air thermal energy storage unit. Energy Build. 2012, 45, 124–131. [Google Scholar] [CrossRef]
  61. Wang, G.; Harrison, I.R. Polymer melting: Heating rate effects on DSC melting peaks. Thermochim. Acta. 1994, 231, 203–213. [Google Scholar] [CrossRef]
  62. Sam, M.N.; Caggiano, A.; Mankel, C.; Koenders, E. A Comparative Study on the Thermal Energy Storage Performance of Bio-Based and Paraffin-Based PCMs Using DSC Procedures. Materials 2020, 13, 1705. [Google Scholar]
  63. Kousksou, T.; El Rhafiki, T.; Jamil, A.; Bruel, P.; Zeraouli, Y. PCMs inside emulsions: Some specific aspects related to DSC (differential scanning calorimeter)-like configurations. Energy 2013, 56, 175–183. [Google Scholar] [CrossRef]
  64. Jin, X.; Xu, X.; Zhang, X.; Yin, Y. Determination of the PCM melting temperature range using DSC. Thermochim. Acta 2014, 595, 17–21. [Google Scholar] [CrossRef]
  65. Müller, L.; Rubio-Pérez, G.; Bach, A.; Muñoz-Rujas, N.; Aguilar, F.; Worlitschek, J. Consistent DSC and TGA Methodology as Basis for the Measurement and Comparison of Thermo-Physical Properties of Phase Change Materials. Materials 2020, 13, 4486. [Google Scholar] [CrossRef] [PubMed]
  66. Phase Change Materials (Phasenwechselmaterial) Gütesicherung Quality Assurance RAL-GZ 896. 2018. Available online: www.mybeuth.de (accessed on 9 March 2022).
  67. Vélez, C.; Ortiz De Zárate, J.M.; Khayet, M. Thermal properties of n-pentadecane, n-heptadecane and n-nonadecane in the solid/liquid phase change region. Int. J. Therm. Sci. 2015, 94, 139–146. [Google Scholar] [CrossRef]
  68. Saeed, R.M.; Schlegel, J.P.; Sawafta, R. Characterization of high-temperature PCMs for enhancing passive safety and heat removal capabilities in nuclear reactor systems. Energy 2019, 189, 116137. [Google Scholar] [CrossRef]
  69. Zeng, J.-L.; Shu, L.; Jiang, L.-M.; Chen, Y.-H.; Zhang, Y.-X.; Xie, T.; Sun, L.-X.; Cao, Z. Thermodynamic and thermal energy storage properties of a new medium-temperature phase change material. J. Therm. Anal. Calorim. 2018, 135, 3171–3179. [Google Scholar] [CrossRef]
  70. Han, L.; Xie, S.; Ma, G.; Sun, J.; Jia, Y.; Jing, Y. Test and improvement of the cyclic stability of oxalic acid dihydrate for thermal energy storage. Thermochim. Acta 2016, 645, 24–30. [Google Scholar] [CrossRef]
  71. Salyan, S.; Suresh, S. Liquid metal gallium laden organic phase change material for energy storage: An experimental study. Int. J. Hydrogen Energy 2018, 43, 2469–2483. [Google Scholar] [CrossRef]
  72. Gasia, J.; Martin, M.; Solé, A.; Barreneche, C.; Cabeza, L.F. Phase change material selection for thermal processes working under partial load operating conditions in the temperature range between 120 and 200 °C. Appl. Sci. 2017, 7, 722. [Google Scholar] [CrossRef]
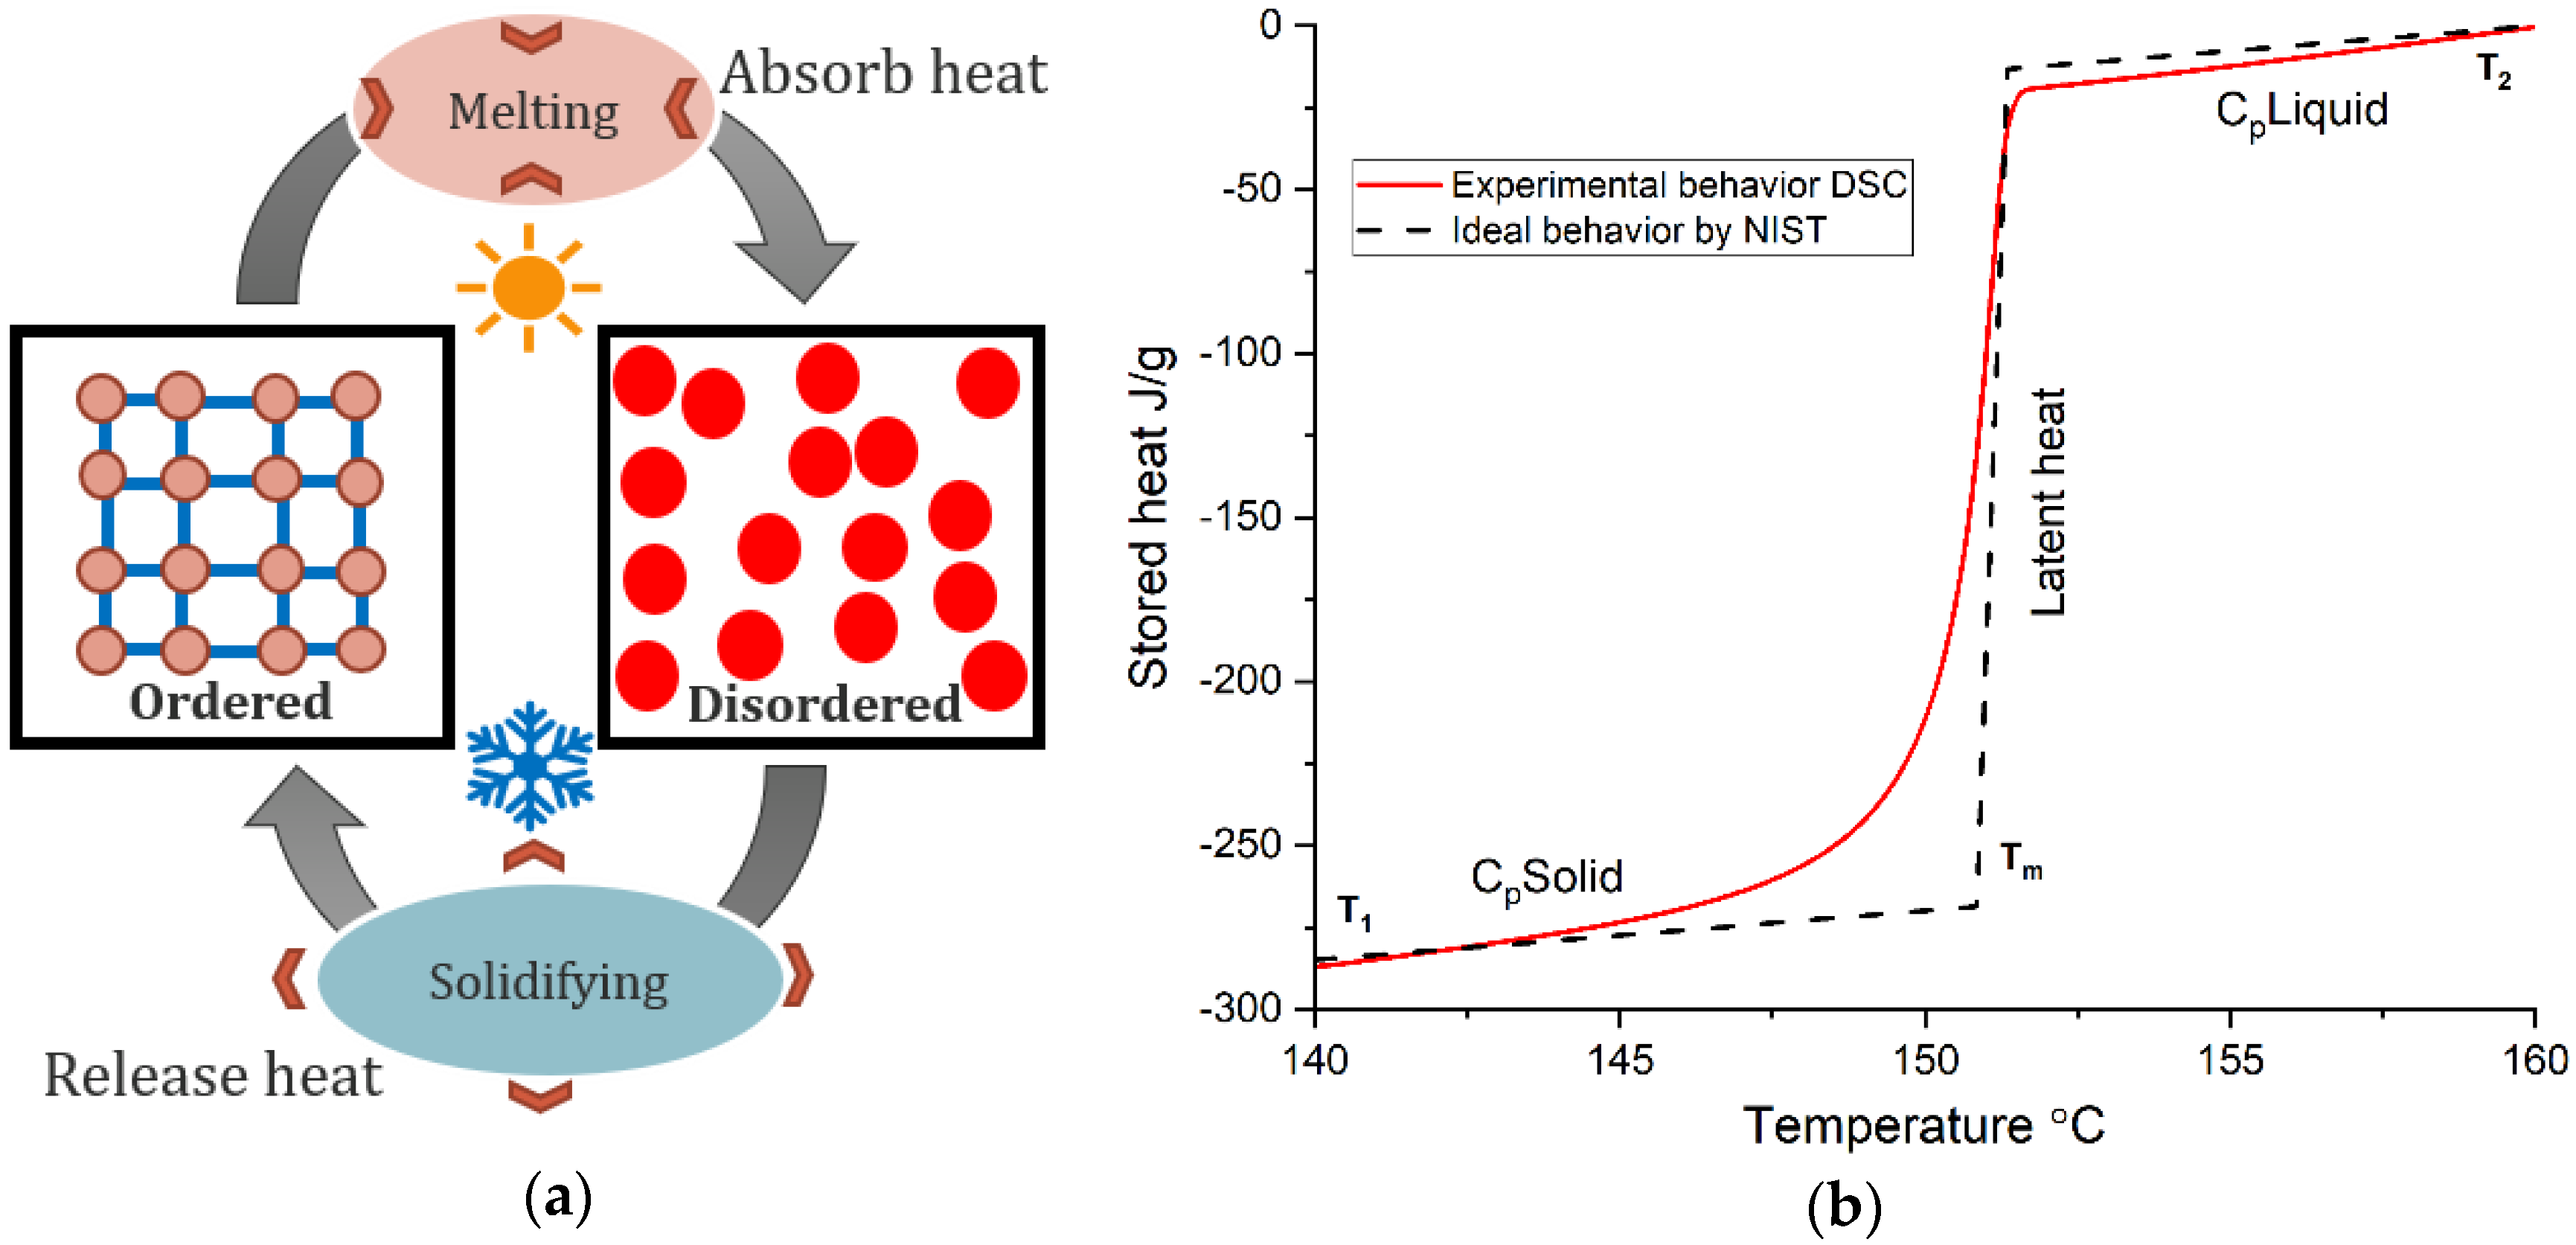
Figure 1. Solid–liquid transition in a PCM: (a) schematic of solid–liquid phase change; (b) stored heat as a function of temperature: ideal phase change of adipic acid by NIST (dashed line), actual phase change (continuous line), (personal data).
Applsci 12 12019 g001
Figure 3. hf-DSC: (a) DSC furnace including sample and reference crucibles; (b) schematic of crucibles and sensors inside a DSC chamber (personal data).
Applsci 12 12019 g003
Figure 4. Modes of heating and the corresponding DSC signals: (a) dynamic mode and (b) step mode after [1].
Applsci 12 12019 g004
Figure 5. Schematic of the heat flow (a) into and (b) out of the sample crucible, after [45].
Applsci 12 12019 g005
Figure 6. PCMs heat flow curves: (a) subcooling hysteresis (personal data); (b) partially melted PCM (micro encapsulated paraffin wax), after [46].
Applsci 12 12019 g006
Figure 7. PCMs representing stored heat as a function of temperature during the melting phase and solidification with subcooling (personal data for adipic acid).
Applsci 12 12019 g007
Figure 8. PCM’s transition peak: (a) transition temperatures, (b) shifting the end of transition toward a higher temperature. (Personal data for adipic acid).
Applsci 12 12019 g008
Figure 9. The effect of heating rate on peak shape for indium, after [61].
Applsci 12 12019 g009
Figure 10. The effect of (a) heating rates and sample mass on the transition temperature; (b) increasing the melting range with increasing heating rates for adipic acid (personal data).
Applsci 12 12019 g010
Figure 11. Heat flow and enthalpy plot of adipic acid as a function of temperature (personal data).
Applsci 12 12019 g011
Figure 12. Schematic of the IEA method using personal data with adipic acid (personal data).
Applsci 12 12019 g012
Figure 13. Baseline correction: (a) base-line construction (zeroline); (b) Effect of baseline correction on the enthalpy curve (personal data).
Applsci 12 12019 g013
Figure 14. Enthalpy curve obtained by DSC and T-history method for octacosane PCM, after [14].
Applsci 12 12019 g014
Figure 15. Three steps in Cp measurements for Parafol 18–97, after [54].
Applsci 12 12019 g015
Figure 16. Different temperature programs for Cp measurements, after [43].
Applsci 12 12019 g016
Table 1. PCM applications and their targeted optimal properties [2,13,16,17].
ApplicationClassificationIdeal Properties
Thermal storage:
Direct steam generation in concentrating solar power plant
Industrial waste heat recovery coupled with compressed air energy storage system
Domestic applications
Thermal control:
Automotive (interior air conditioning, thermal management of batteries)
Thermal management of electronic devices (small available space)
Textiles (human comfort in outdoor work and for sport)
Medical (warming and cooling of body parts)
Transportation (maintain goods at the desired temperature)
Buildings (construction materials, ventilation)
Organic (Paraffin and non-Paraffin)
Available
Inexpensive
Stable
Compatible
High latent heat
Low thermal conductivity
Inorganic (Salt and salt hydrate)
Smaller density change
Nonflammable
Corrosive
Unstable
Metallic (In and Al)
Stability
High thermal conductivity
High melt temperature
High density
Low latent heat
Eutectic
Desired transition point
Characterization challenges
Technical properties
Phase change temperature in the range of operating temperature
High phase transition enthalpy
Suitable thermal conductivity based on the application
Physical properties
High density
Small density change
Kinetic properties
No supercooling
Chemical properties
No corrosivity
Non-flammable
Non-explosive
Non-toxic
Low hygroscopicity
Environmental properties
Non-harmful for environment and water resources
Economic
Low cost
Available at large scale
Available worldwide
Table 4. Studies on DSC calibration.
Ref.References Test ConditionsObjectives Remarks
[27] Diphenylacetic acid
Indium
Dynamic mode
Stepwise
1, 2.5, 5, 7.5 and 10 °C/min
2.5 and 10
Comparison between organic and metallic
Solid or powder
Pre-melting or not
Pre-melting the reference will improve the reliability of measurement;
Solid shape reference would be preferred compared to powder or granular
[40]Indium 3, 9 and 15 °C/minMelting enthalpy of indium was measuredPlacing the sample crucible leads to 0.5 error in enthalpy
[39]Gallium
Indium
Tin
1, 2, 5 and 10 °C/minInfluence of various calibration method on the accuracy of temperature and enthalpy of n-eicosaneThe accuracy of calibration could be improved by multipoint calibration
[6]Not precise Not precise Introducing new reference material for DSC calibrationn-alkanes (C12, C14, C16 and C18) for temperature and enthalpy (-10 °C–30 °C);
there is demand for sub-ambient references
Table 5. Challenges in calorimetry measurements of PCMs.
ChallengesExplanationsSuggestionsReferences
High heat capacity
Low thermal conductivity
Phase change over a narrow temperature range
Thermal gradient inside a PCM sample is larger compared to other materials.
Difference between apparent and real temperatures of the sample.
Smaller sample sizes, and lower heating and cooling rates, reduce the temperature shift. However, both of them lead to a weaker signal and a decreased accuracy in enthalpy.
Using a method like IEA can help us to determine the suitable heating rate.
[45]
SubcoolingSubcooling deforms the cooling curve and gets stronger for smaller samples.
External effects such as container or crucible wall.
Small and moderate subcooling can be up to 5 and 10 °C, respectively.
Subcooling is a highly volume dependent phenomenon. So, at the DSC scale, PCMs show larger subcooling.
Adding nucleating agents is a useful method to reduce subcooling.
Using a DSC equipped with a cooling system provides one with better temperature control over the solidification cycle.
For samples showing subcooling, DSC in medium to slow dynamic mode (under 2 °C/min) is recommended.
Combining DSC and T-history helps distinguish between real properties of a PCM and effects from test conditions.
Adding nucleating agents is a useful method to reduce subcooling.
[14,26,48,52]
Impure PCMs (enhancers, nucleating agents)SamplingSmall sample might not be representative of bulk material.
Repeating DSC tests by taking different samples.
Using methods such as T-history allows testing of a larger sample size.
[22]
Impure PCMs
(mixture of several constituents)
Peak separation and incongruent phase change processLarge heating rates result in disappearing or merging small peaks into a larger one.
Slow dynamic mode is recommended.
[46]
Incomplete phase change processPartly melting/freezing due to the non-continuous load of energyLarge heating/cooling rate would not simulate correctly the real heat transfer into/out of PCM in the application.
Slow dynamic mode is recommended.
[46]
Asymmetrical process of melting and solidificationIn heat transfer modeling of PCMs, melting and solidification are assumed symmetricalIt is found out that melting and solidification are not symmetrical. Therefore, the enthalpy of a PCM is not only dependent on temperature, but also on the previous state of the PCM.[53]
Table 6. Studies on the transition temperature of PCMs.
Ref.PCMObjectiveRecommendations to Determine the Transition Temperature
[54]Not preciseRecommendations concerning accurate property measurementsLow heating rate (~2 °C/min)
Sample in good thermal contact with DSC pan
Multi point calibration or use of a calibrant with a close melting point to the sample
Reporting the test conditions
[64]RT27
26.8 °C
Accurate determination of PCM melting rangeProposed a new method to determine actual endset of melting that is not dependent on the heating rate
[57]Paraffin-based 15 °C
Hydrated salt 25 °C
Investigating the influence of heating rate and sample mass on transition properties of organic and inorganic PCMsBy increasing mass and heating rate, peak and endset temperatures shift to higher values.
In case of hydrated salts, high heating rates hide more information about the kinetics.
To achieve smaller deviation with larger sample, lower heating rate should be preferred.
[63]Hexadecane 18 °C
Heptadecane 21.8 °C
Octadecane 28 °C
Physical modelling of a heat transfer inside a DSC sampleIn order to describe accurately the melting process inside a DSC cell, use lower heating rate.
In case of mixture of PCMs, high heating rates hide more information about the kinetics of melting.
[65]23 organic and inorganic PCMs in the range of (−50 to 190 °C)Establishing a consistent method to determine the phase transition temperatures and enthalpyA combination of low heating rate (2 °C/min) for temperature measurement and high heating rate (10 °C/min) for enthalpy were used in a single temperature program.
Table 7. IEA method to determine enthalpy [7,59].
Steps Explanation
1Determination of the heating rateApply several heating rates from fast rate and slow down by half in the subsequent runs. When the temperature difference is less than 0.2 K between inflection points of two different heating rates, or less than 0.5 K between heating and cooling curves, criteria is met.
2Calibration with determined heating rateTemperature calibration using three different references by determined heating rate.
3Measurement with empty crucibleMeasurement of empty crucible as a baseline
4Sample measurementMeasure three samples per PCM, each for four cycles, using the determined heating rate and a similar mass
5Data AnalysisSubtract the baseline signal from sample signal
Subtract the zeroline
Representing the enthalpy graph
Table 8. Studies on PCMs’ enthalpy.
Ref.PCMObjectiveRecommendations to Determine Transition Temperatures
[54]PT-37
Paraffin (eicosane)
Indistinctive effect of heating rates on the value of transition enthalpy10 K/min heating rate or above 1 K/min
Sample in a good thermal contact with DSC pan (pre-melt the sample)
Calibration with indium just prior to the experiment
Reporting the test conditions
[64]Commercial RT27Finding the phase transition range by determining the endset of transitionProposed a new method to determine actual endset of melting peak that is independent of heating rate.
[57]n-octadecane 15 °C
calcium chloride hexahydrate 25 °C
Determining suitable heating rate and sample mass using DSCIn case of hydrated salts, high heating rates hide more information about the kinetics.
To achieve smaller deviation with larger sample, lower heating rate should be chosen.
PCMs with higher thermal conductivity are more sensitive to heating rate rather than sample mass.
[59]Octadecane (98.11%),Study dynamic and step method and test their accuracy on the h(T) relationshipRun a baseline test
Use low heat rate
Applying same method leads to repeatable results in different labs with different machines
[45]Commercial RT27Influence of two different modes of heating (dynamic and step modes) on the accuracy of enthalpy–temperature relationship.The step method is less sensitive to the measurement parameters. In dynamic mode, by decreasing heating rate the uncertainty is decreased, but at the cost of increasing uncertainty.
[22]Salt hydrateInvestigating the enthalpy change of a PCM as a function of temperatureCalorimetric measurements were carried out by three different methods (DSC, T-history and large-scale set-up). T-history method allows one to test a larger amount of sample. This is suitable in case of heterogenous PCMs.
[9]Salt hydrateReview of the studies concerning the phase transition enthalpy of salt hydratesIn case of salt hydrates, it is important to indicate the preparation, verification of sample composition and water content of the sample. This review paper includes the experimental results regarding the calorimetry of salt hydrates.
[66]Not precisedPreparing quality and testing specifications for PCMsDetermining heating rates for each test condition in order to measure enthalpy
Table 9. Studies on Cp measurements of PCMs.
Ref.PCMsInstrument/MethodTest ConditionsCalibrationHighlightsRecommendations
[54]Parafol 18–97 TA-Q200
Three steps ASTM-E1269-11
Isotherm-5 min
Ramp 10 °C/min
Isotherm-5 min
Baseline
Indium (cell constant check)
Following the ASTM-E1269-11, DSC can determine the Cp within 10% errorReproducible baseline
Good contact between the sample and the pan and between the pan and the DSC
Same condition and same pan for the three steps
[17]RT15
RT22 HC
TA-Q2000Isotherm-3 min
Ramp 10 °C/min
Isotherm-3 min
IndiumThe effects of heating rate and sample mass on Cp have been studiedStudying the effect of heating rate on heat capacity can provide the designer with a simulation of heat transfer conditions
[68]Octadecanoic acid
Tm: 70 °C
TA-modulated DSC (Discovery DSC)Equilibrium step for 10 min
Heating rate 3 °C/min
PCM was melted prior to starting measurements
SapphireHeat capacity measurements during the phase transition (less than 5% error)Use modulated DSC for heat capacity measurement during the thermal events
[62]RT24
RT25
RT26
PT25
Netzsch 214 Polyma heat-flux DSCBefore and after the phase transition by 10 °C/min according to DIN 51007
During the transition by 0.25 or 0.125 °C/min, according to IEA
Three steps based on DIN 51007Their Cp results showed negligible deviation Using two different heating rates to measure heat capacity of PCM
High rates for sensible regions
Low rates for transition
[57]Paraffin based (n-octadecane)
Hydrated salt (calcium chloride hexahydrate)
TA-DSC 2920Measurement in the range of (0–50 °C)Baseline (empty pan)By increasing heating rate and sample mass, the peak height decreases
[43]Sensible storage materials (water, slate and potassium nitrate (KNO3)Mettler Toledo 822e DSCThree steps method
Three modes of heating: dynamic, isostep and areas
Zinc
Indium
3% error in areas method
6% error in dynamic method
16% error in Isostep method
The wider temperature range of interest should be considered in dynamic method
[69](E)-3-phenylbut-2-enoic acid
Tm: 95 °C
TA-Q1000Isothermal period -5 min
Ramp 5 °C/min
Zero the heat flow in the middle of temperature range
Indium
Sapphire
Benzoic acid
The overall uncertainty was less than 5% for benzoic acid
Cp was measured to calculate thermodynamic properties such as enthalpy and entropy
Publisher’s Note: MDPI stays neutral with regard to jurisdictional claims in published maps and institutional affiliations.