
Machine Learning Approach for Chronic Kidney Disease Risk Prediction Combining Conventional Risk Factors and Novel Metabolic Indices

 ,
, 
 ,
, 

Abstract
1. Introduction
2. Materials and Methods
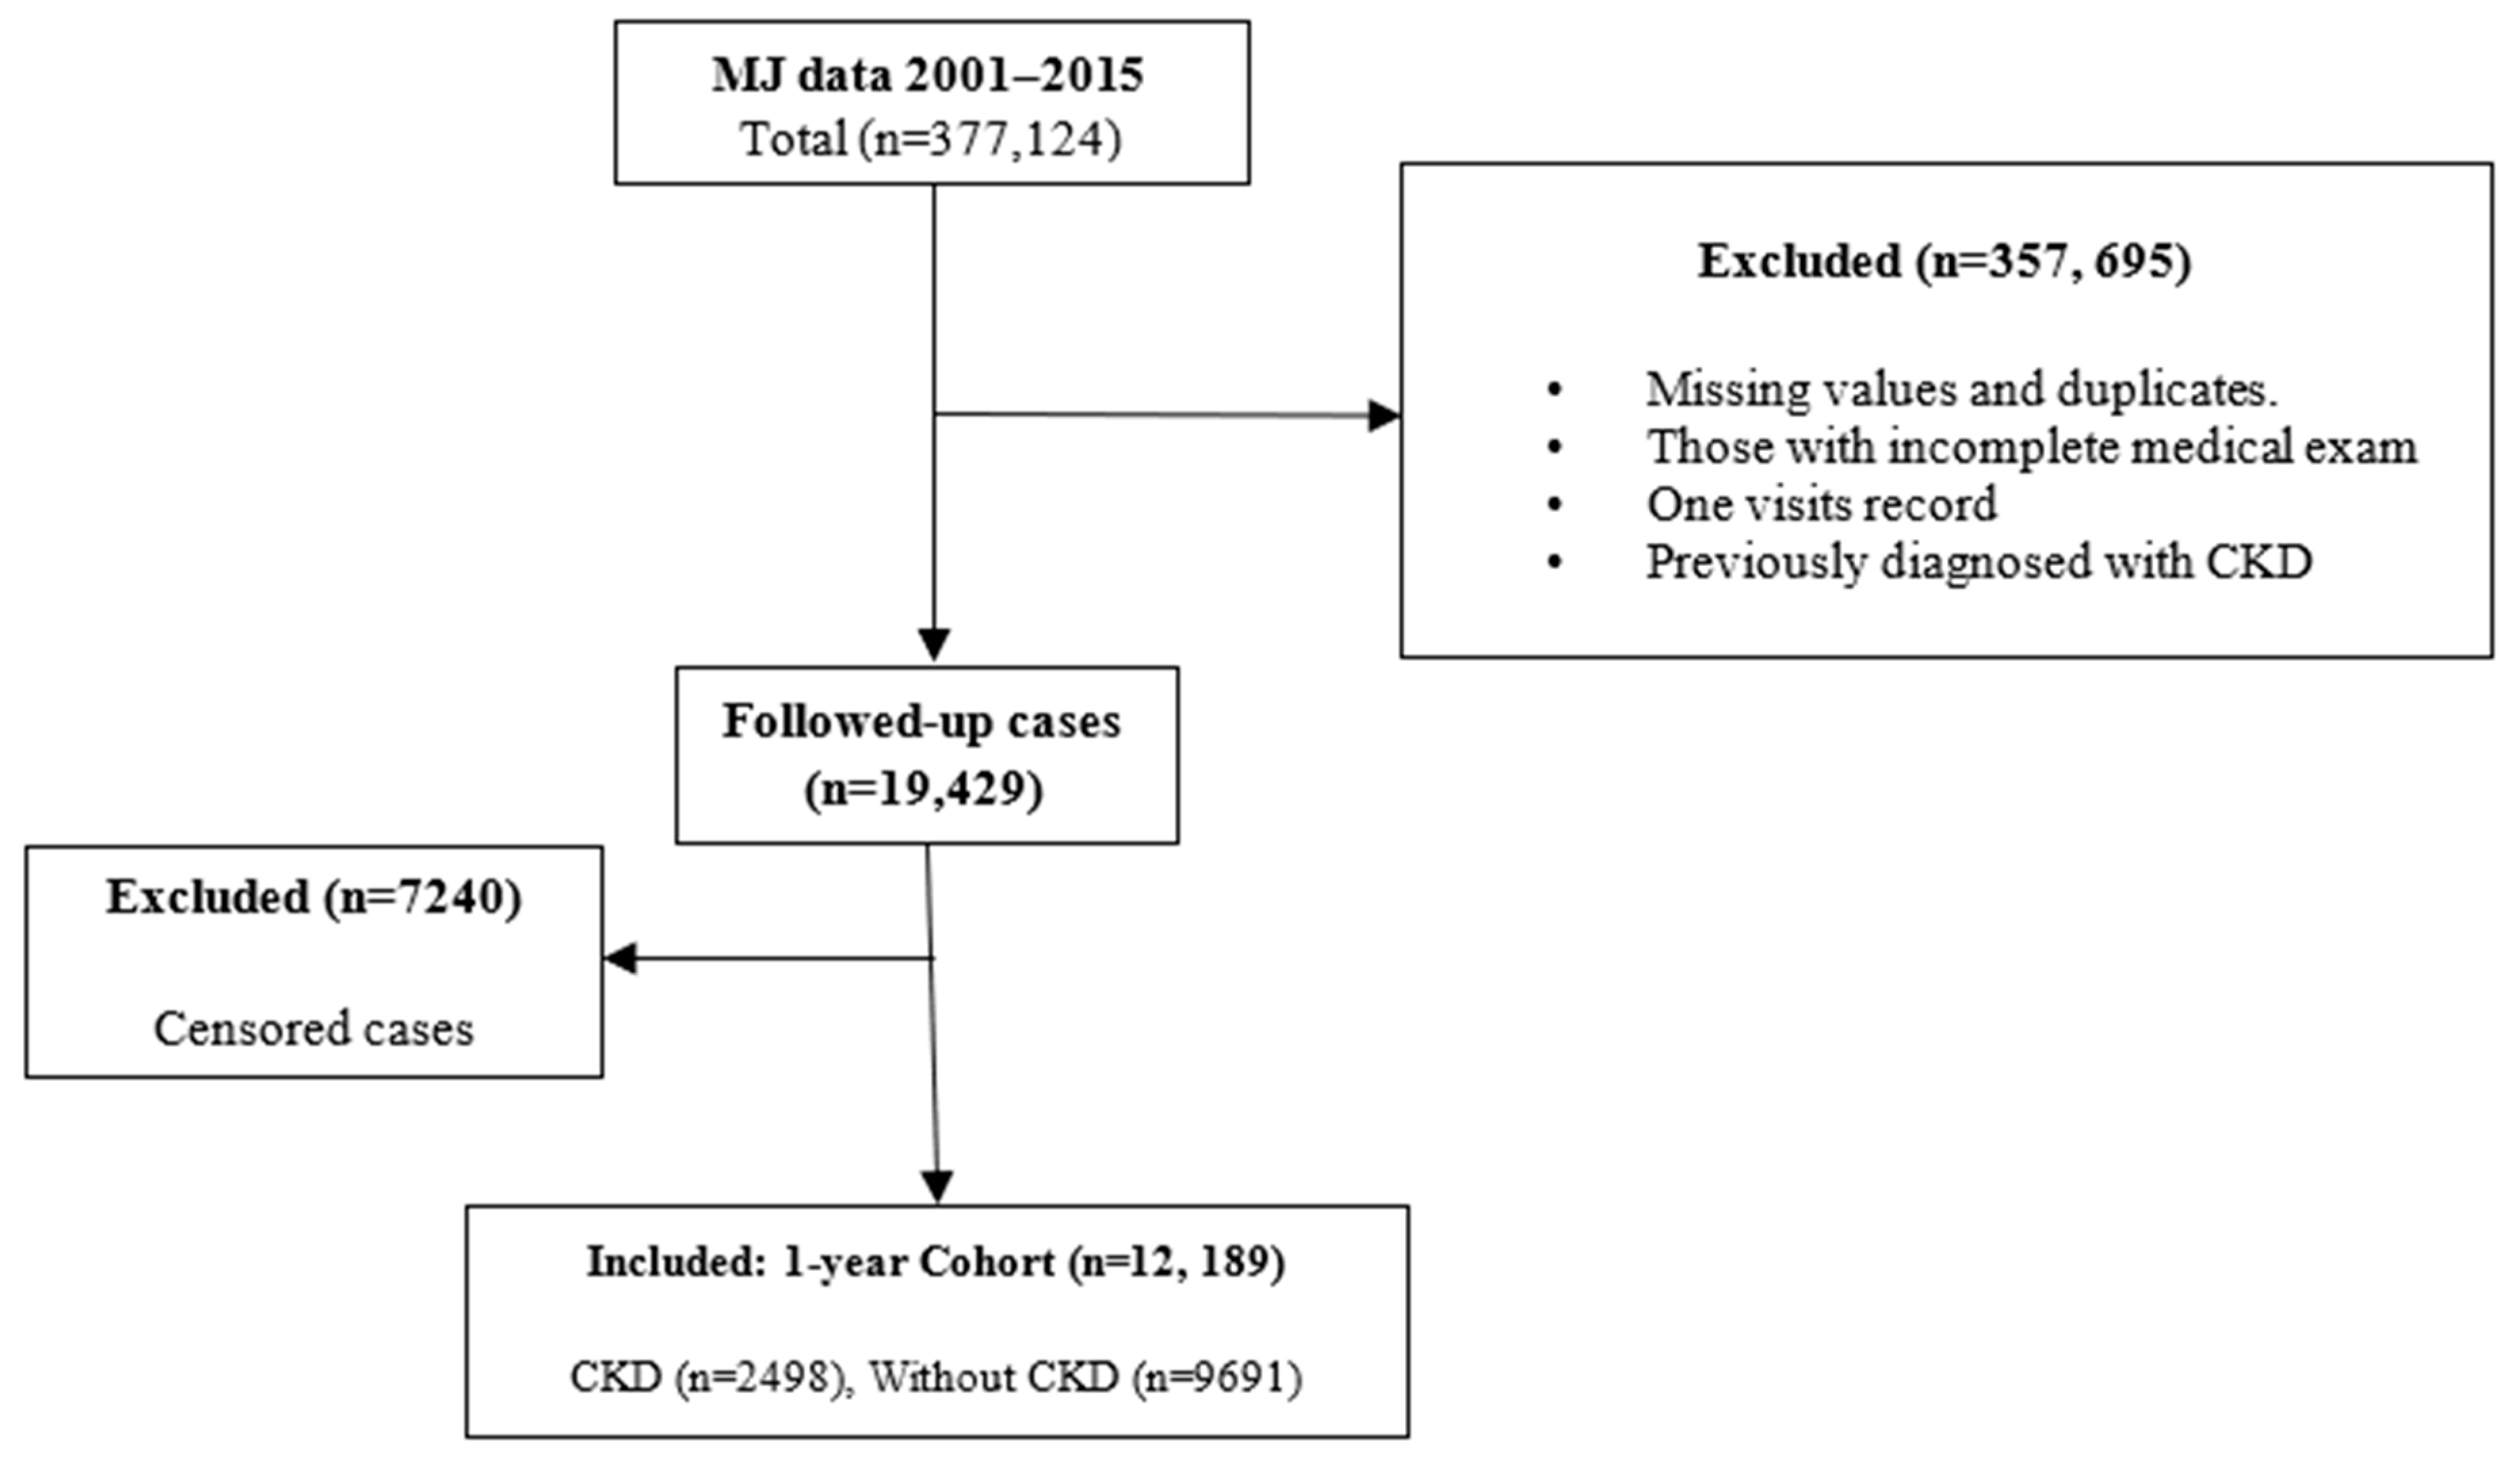
2.1. Study Design and Participants
2.2. Outcome Definition
2.3. Definition of the Novel Metabolic Indices (NMI)
- (1)
- Triglyceride-glucose (TyG) index = Ln [fasting triglycerides (mg/dL) × fasting glucose (mg/dL)]/2 [11];
- (2)
- Triglyceride/HDL-cholesterol ratio (TG/HDL-C) = The ratio between serum triglycerides and HDL cholesterol [12];
- (3)
- Visceral adiposity index (VAI) = (WC [cm]/39.68 + (1.88 × BMI) × (TG [mM/L]/1.03) × (1.31/HDLC [mM/L]) for men and (WC [cm]/36.58 + (1.89 × BMI) × (TG [mM/L]/0.81) × (1.52/HDL-C [mM/L]) for women [13].
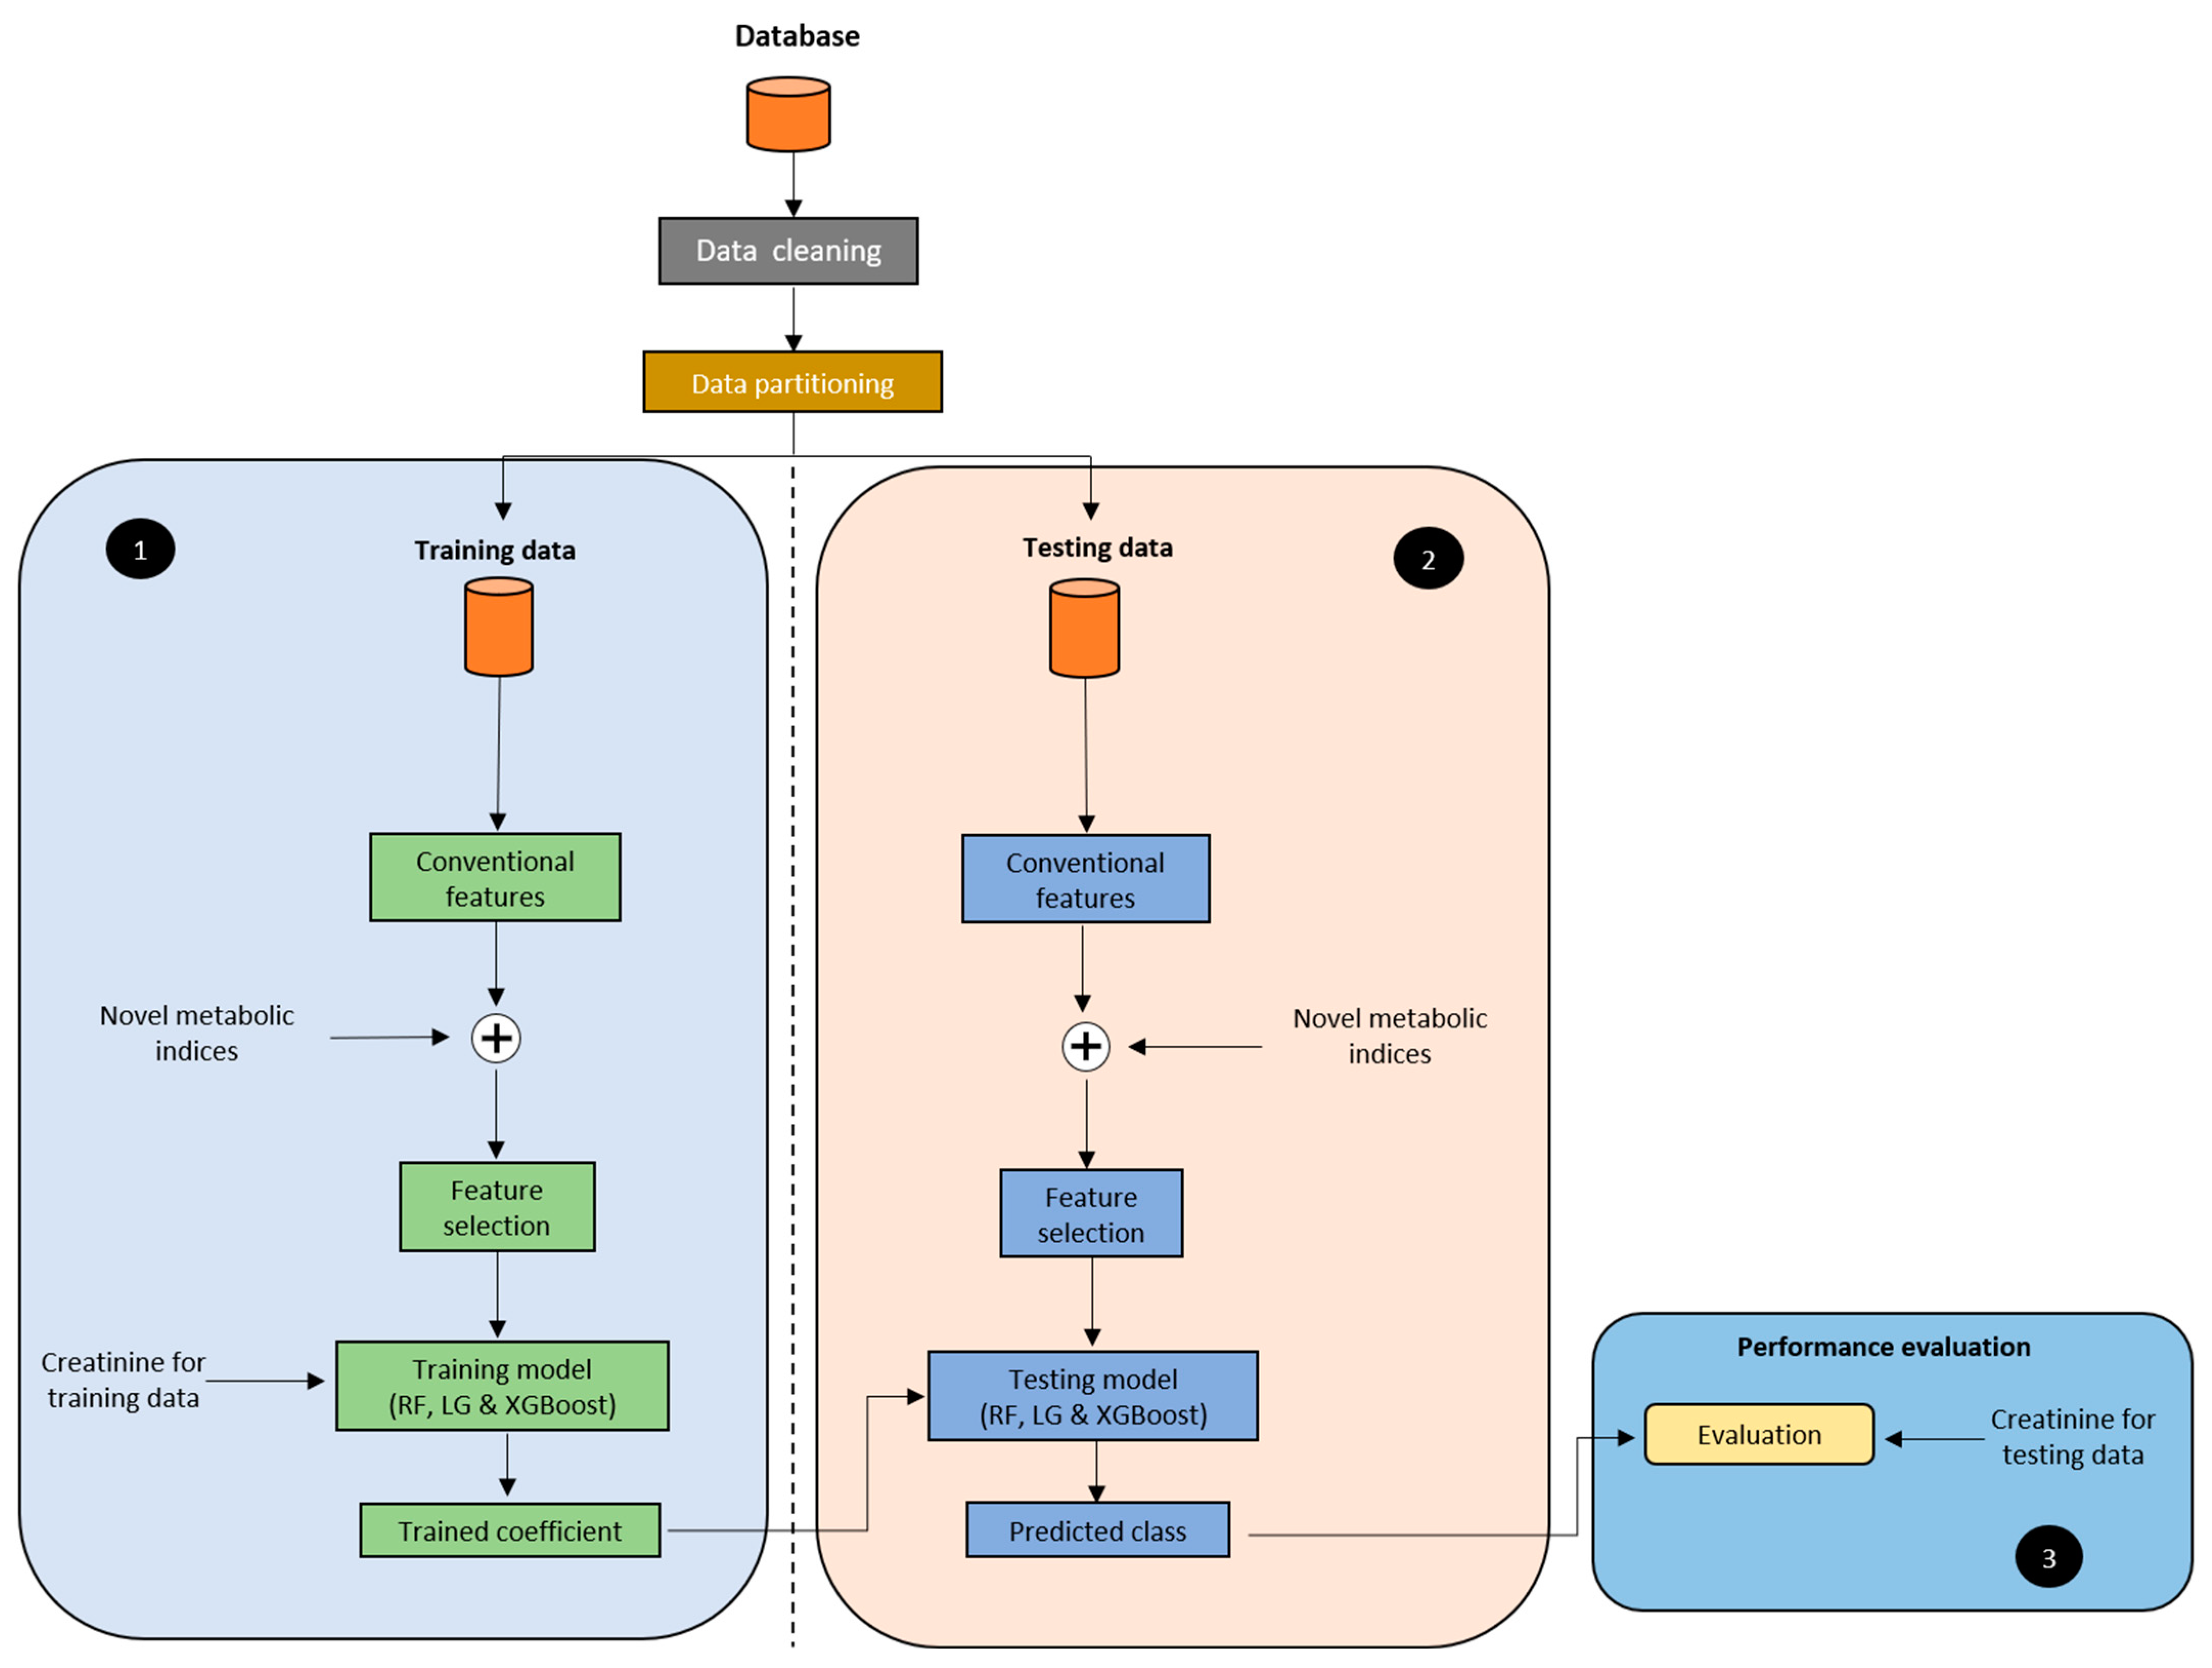
2.4. Model Development
2.5. Experimental Protocol
2.6. Statistical Analysis
3. Results and Discussion
3.1. Participants
3.2. Identification of Potential Predictors and Their Association with CKD
3.3. Grouping Predictors
3.4. Model Evaluation and Performance
4. Conclusions
Supplementary Materials
Author Contributions
Funding
Institutional Review Board Statement
Informed Consent Statement
Data Availability Statement
Acknowledgments
Conflicts of Interest
References
- Seong, J.M.; Lee, J.H.; Gi, M.Y.; Son, Y.H.; Moon, A.E.; Park, C.E.; Sung, H.H.; Yoon, H. Gender difference in the association of chronic kidney disease with visceral adiposity index and lipid accumulation product index in Korean adults: Korean National Health and Nutrition Examination Survey. Int. Urol. Nephrol. 2021, 53, 1417–1425. [Google Scholar] [CrossRef] [PubMed]
- Foundation, N.K. Kidney Disease: The Basics. 2021. Available online: https://www.kidney.org/news/newsroom/fsindex (accessed on 20 September 2022).
- Lin, Y.T. No More ‘Kidney Dialysis Island’. 2018. Available online: https://english.cw.com.tw/article/article.action?id=1839 (accessed on 8 June 2022).
- Stenvinkel, P. Chronic kidney disease: A public health priority and harbinger of premature cardiovascular disease. J. Intern. Med. 2010, 268, 456–467. [Google Scholar] [CrossRef] [PubMed]
- Shuster, A.; Patlas, M.; Pinthus, J.H.; Mourtzakis, M. The clinical importance of visceral adiposity: A critical review of methods for visceral adipose tissue analysis. Br. J. Radiol. 2012, 85, 1-e25. [Google Scholar] [CrossRef] [PubMed]
- Fiorentino, T.V.; Marini, M.A.; Succurro, E.; Andreozzi, F.; Sesti, G. Relationships of surrogate indexes of insulin resistance with insulin sensitivity assessed by euglycemic hyperinsulinemic clamp and subclinical vascular damage. BMJ Open Diabetes Res. Care 2019, 7, e000911. [Google Scholar] [CrossRef] [PubMed]
- Wang, Z.; Chung, J.W.; Jiang, X.; Cui, Y.; Wang, M.; Zheng, A. Machine Learning-Based Prediction System For Chronic Kidney Disease Using Associative Classification Technique. Int. J. Eng. Technol. 2018, 7, 1161–1167. [Google Scholar] [CrossRef]
- Wu, X.; Tsai, S.P.; Tsao, C.K.; Chiu, M.L.; Tsai, M.K.; Lu, P.J.; Lee, J.H.; Chen, C.H.; Wen, C.; Chang, S.-S.; et al. Cohort Profile: The Taiwan MJ Cohort: Half a million Chinese with repeated health surveillance data. Int. J. Epidemiol. 2017, 46, 1744–1744g. [Google Scholar] [CrossRef] [PubMed]
- Foundation, N.K. What Is the Criteria for CKD. 2021. Available online: https://www.kidney.org/professionals/explore-your-knowledge/what-is-the-criteria-for-ckd (accessed on 8 June 2022).
- Kasai, T.; Miyauchi, K.; Kajimoto, K.; Kubota, N.; Dohi, T.; Tsuruta, R.; Ogita, M.; Yokoyama, T.; Amano, A.; Daida, H. Prognostic significance of glomerular filtration rate estimated by the Japanese equation among patients who underwent complete coronary revascularization. Hypertens. Res. 2011, 34, 378–383. [Google Scholar] [CrossRef] [PubMed]
- Simental-Mendia, L.E.; Rodriguez-Moran, M.; Guerrero-Romero, F. The product of fasting glucose and triglycerides as surrogate for identifying insulin resistance in apparently healthy subjects. Metab. Syndr. Relat. Disord. 2008, 6, 299–304. [Google Scholar] [CrossRef] [PubMed]
- Hanak, V.; Munoz, J.; Teague, J.; Stanley, A.J.; Bittner, V. Accuracy of the triglyceride to high-density lipoprotein cholesterol ratio for prediction of the low-density lipoprotein phenotype B. Am. J. Cardiol. 2004, 94, 219–222. [Google Scholar] [CrossRef] [PubMed]
- Amato, M.C.; Giordano, C.; Galia, M.; Criscimanna, A.; Vitabile, S.; Midiri, M.; Galluzzo, A.; AlkaMeSy Study, Group. Visceral Adiposity Index: A reliable indicator of visceral fat function associated with cardiometabolic risk. Diabetes Care 2010, 33, 920–922. [Google Scholar] [CrossRef] [PubMed]
- Chawla, N.V.; Bowyer, K.W.; Hall, L.O.; Kegelmeyer, W.P. SMOTE: Synthetic minority over-sampling technique. J. Artif. Intell. Res. 2002, 16, 321–357. [Google Scholar] [CrossRef]
- Chen, T.K.; Knicely, D.H.; Grams, M.E. Chronic Kidney Disease Diagnosis and Management: A Review. JAMA 2019, 322, 1294–1304. [Google Scholar] [CrossRef] [PubMed]
- Bamba, R.; Okamura, T.; Hashimoto, Y.; Hamaguchi, M.; Obora, A.; Kojima, T.; Fukui, M. The Visceral Adiposity Index Is a Predictor of Incident Chronic Kidney Disease: A Population-Based Longitudinal Study. Kidney Blood Press. Res. 2020, 45, 407–418. [Google Scholar] [CrossRef] [PubMed]
- Kim, Y.; Lee, S.; Lee, Y.; Kang, M.W.; Park, S.; Park, S.; Han, K.; Paek, J.H.; Park, W.Y.; Jin, K.; et al. Predictive value of triglyceride/high-density lipoprotein cholesterol for major clinical outcomes in advanced chronic kidney disease: A nationwide population-based study. Clin. Kidney J. 2021, 14, 1961–1968. [Google Scholar] [CrossRef] [PubMed]
- Okamura, T.; Hashimoto, Y.; Hamaguchi, M.; Obora, A.; Kojima, T.; Fukui, M. Triglyceride-glucose index is a predictor of incident chronic kidney disease: A population-based longitudinal study. Clin. Exp. Nephrol. 2019, 23, 948–955. [Google Scholar] [CrossRef] [PubMed]
- Shih, C.-C.; Lu, C.-J.; Chen, G.-D.; Chang, C.-C. Risk Prediction for Early Chronic Kidney Disease: Results from an Adult Health Examination Program of 19,270 Individuals. Int. J. Environ. Res. Public Health 2020, 17, 4973. [Google Scholar] [CrossRef] [PubMed]
- Wang, W.G. Chakraborty, and B. Chakraborty. Predicting the Risk of Chronic Kidney Disease (CKD) Using Machine Learning Algorithm. Appl. Sci. 2020, 11, 202. [Google Scholar] [CrossRef]
- Ekanayake, I.U.; Herath, D. Chronic Kidney Disease Prediction Using Machine Learning Methods. In Proceedings of the 2020 Moratuwa Engineering Research Conference (MERCon), Moratuwa, Sri Lanka, 28–30 July 2020. [Google Scholar]


| Variable | Total (n = 12,189) | NCKD (n = 9691) | CKD (n = 2498) | p-Value |
|---|---|---|---|---|
| Age (years) | 37 (31–43) | 36 (31–42) | 40 (34–48) | <0.001 |
| Sex | ||||
| Male | 8457 (69%) | 7740 (80%) | 717 (29%) | <0.001 |
| Female | 3732 (31%) | 1951 (20%) | 1781 (71%) | <0.001 |
| Smoking status | ||||
| Not smoking | 9847 (84%) | 7648 (79%) | 2199 (88%) | <0.001 |
| Smoking | 2342 (19%) | 2043 (21%) | 299 (12%) | <0.001 |
| Alcohol | ||||
| Not drinking | 10,289 (84%) | 8035 (83%) | 2254 (90%) | <0.001 |
| Drinking | 1900 (16%) | 1656 (17%) | 244 (10%) | <0.001 |
| Comorbidities | ||||
| Hypertension | 157 (1.3%) | 55 (0.6%) | 102 (4.1%) | <0.001 |
| Diabetes | 51 (0.4%) | 21 (0.2%) | 30 (1.2%) | <0.001 |
| Physical examination | ||||
| BMI (kg/m2) | 22.0 (20–24.5) | 21.7 (19.8–24.2) | 23.1 (21.0–25.4) | <0.001 |
| Body fat (%) | 27.1 (22.9–32.0) | 27.6 (23.5–32.4) | 24.9 (21.0–29.5) | <0.001 |
| Waist circumference (cm) | 72 (67–79) | 71 (66–77) | 77 (71–84) | <0.001 |
| Systolic BP (right arm, mmHg) | 113 (103–125) | 112 (102–124) | 117 (107–128) | <0.001 |
| Diastolic BP (right arm, mmHg) | 67 (60–75) | 67 (60–74) | 70 (64–77) | <0.001 |
| Blood lipids | ||||
| Triglyceride (mmol/L) | 0.9 (0.7–1.3) | 0.9 (0.6–1.3) | 1.1 (0.8–1.5) | <0.001 |
| Cholesterol (mmol/L) | 4.9 (4.3–5.5) | 4.9 (4.3–5.5) | 5.0 (4.4–5.6) | <0.001 |
| HDL-cholesterol (mmol/L) | 1.5 (1.3–1.8) | 1.6 (1.3–1.8) | 1.4 (1.2–1.7) | <0.001 |
| LDL-cholesterol (mmol/L) | 2.8 (2.3–3.4) | 2.8 (2.3–3.3) | 3.0 (2.5–3.5) | <0.001 |
| Renal function | ||||
| Blood urea nitrogen (BUN, mg/dL) | 12.4 (10.5–14.8) | 12.1 (10.2–14.4) | 13.4 (11.5–15.7) | <0.001 |
| Creatinine (mg/dL) | 0.8 (0.7–0.95) | 0.8 (0.7–0.89) | 1.08 (0.92–1.19) | <0.001 |
| eGFR (mL/min/1.73 m2) | 78.8 (63.1–94.4) | 84.9 (73.0–98.3) | 52.9 (47.2–56.8) | <0.001 |
| Metabolic indices | ||||
| TyG-Index | 4.5 (4.3–4.7) | 4.5 (4.3–4.7) | 4.6 (4.4–4.8) | <0.001 |
| TG/HDL-C ratio | 1.3 (0.9–2.2) | 1.3 (0.9–2.0) | 1.7 (1.1–2.8) | <0.001 |
| VAI | 0.8 (0.5–1.3) | 0.7 (0.4–1.1) | 1.2 (0.8–2.0) | <0.001 |
| Variable | HR (95% CI) | AUC (95% CI) | p-Value |
|---|---|---|---|
| Non-laboratory examination | |||
| Age | 1.04 (1.032–1.038) | 0.633 (0.62–0.645) | <0.001 |
| Gender | 5.6 (5.208–6.083) | 0.756 (0.745–0.768) | <0.001 |
| BMI (kg/m2) | 1.07 (1.06–1.077) | 0.606 0.593–0.618) | <0.001 |
| Waist circumference (cm) | 1.05 (1.043–1.05) | 0.676 (0.663–0.687) | <0.001 |
| Laboratory examination | |||
| Triglyceride (mmol/L) | 1.3 (1.255–1.42) | 0.603 (0.59–0.615) | <0.001 |
| Cholesterol (mmol/L) | 1.1 (1.073–1.155) | 0.54 (0.527–0.553) | <0.001 |
| HDL-cholesterol (mmol/L) | 0.41 (0.366–0.455) | 0.377 (0.364–0.389) | <0.001 |
| LDL-cholesterol (mmol/L) | 1.23 (1.187–1.284) | 0.571 (0.558–0.583) | <0.001 |
| Blood urea nitrogen (BUN, mg/dL) | 1.06 (1.05–1.07) | 0.618 (0.605–0.629) | <0.001 |
| Creatinine | 1.7 (1.535–1.968) | 0.909 (0.903–0.915) | <0.001 |
| Metabolic indices | |||
| TyG-Index | 2.53 (2.269–2.816) | 0.605 (0.592–0.617) | <0.001 |
| TG/HDL-C ratio | 1.15 (1.121–1.186) | 0.625 (0.613–0.638) | <0.001 |
| VAI | 1.35 (1.291–1.407) | 0.716 (0.705–0.727) | <0.001 |
| Group | Predictors |
|---|---|
| Subset A | Age + Gender + TyG-Index |
| Subset B | Age + Gender + TG/HDL-C ratio |
| Subset C | Age + Gender + VAI |
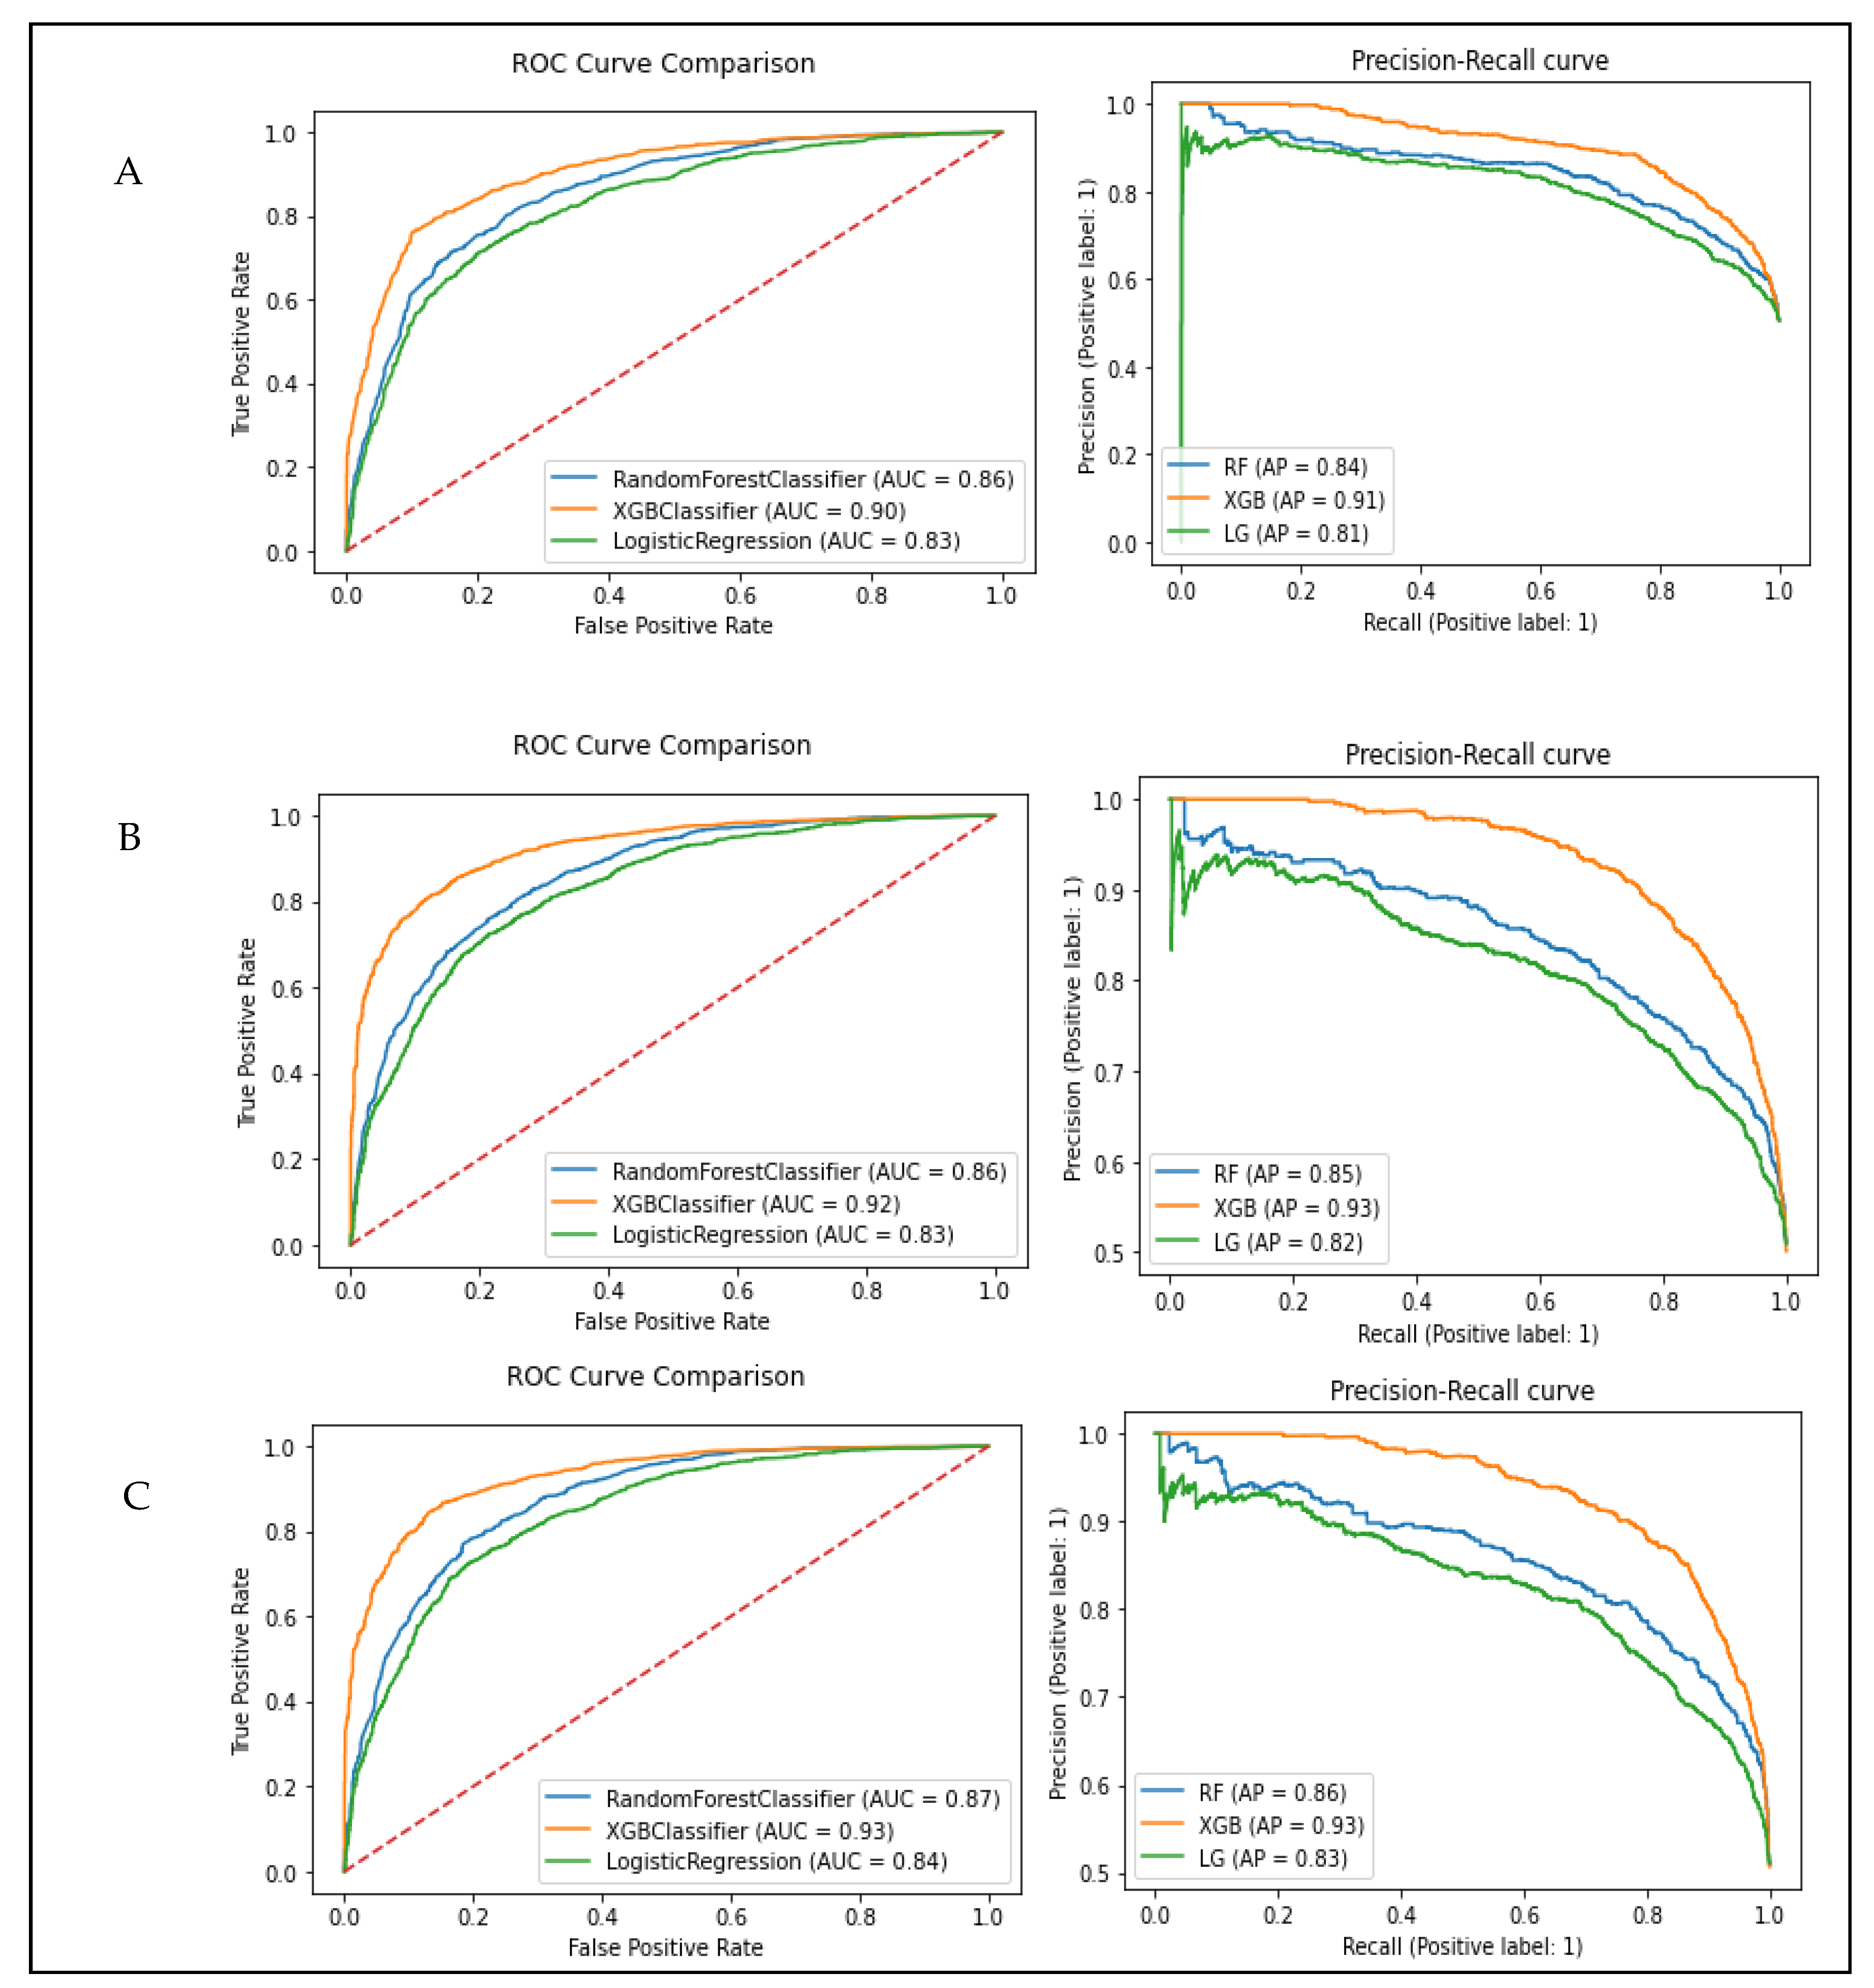
| Subset A: Age + Gender + TyG-Index | |||||||
|---|---|---|---|---|---|---|---|
| Model | Accuracy | Precision | Recall (Sensitivity) | Specificity | F-Score | AUC | |
| Train | Test | ||||||
| Random forest | 0.78 | 0.77 | 0.80 | 0.73 | 0.82 | 0.76 | 0.86 |
| Logistic regression | 0.76 | 0.75 | 0.76 | 0.74 | 0.77 | 0.75 | 0.83 |
| XGB classifier | 0.84 | 0.82 | 0.83 | 0.81 | 0.84 | 0.82 | 0.90 |
| Subset B: Age + Gender + TG/HDL-C ratio | |||||||
| Model | Accuracy | Precision | Recall (Sensitivity) | Specificity | F-Score | AUC | |
| Train | Test | ||||||
| Random forest | 0.78 | 0.77 | 0.78 | 0.74 | 0.79 | 0.76 | 0.86 |
| Logistic regression | 0.76 | 0.75 | 0.75 | 0.76 | 0.74 | 0.75 | 0.83 |
| XGB classifier | 0.86 | 0.84 | 0.83 | 0.86 | 0.82 | 0.85 | 0.92 |
| Subset C: Age + Gender + VAI | |||||||
| Model | Accuracy | Precision | Recall (Sensitivity) | Specificity | F-Score | AUC | |
| Train | Test | ||||||
| Random forest | 0.79 | 0.79 | 0.79 | 0.80 | 0.78 | 0.79 | 0.87 |
| Logistic regression | 0.76 | 0.76 | 0.76 | 0.76 | 0.76 | 0.76 | 0.84 |
| XGB classifier | 0.86 | 0.86 | 0.85 | 0.87 | 0.85 | 0.86 | 0.93 |
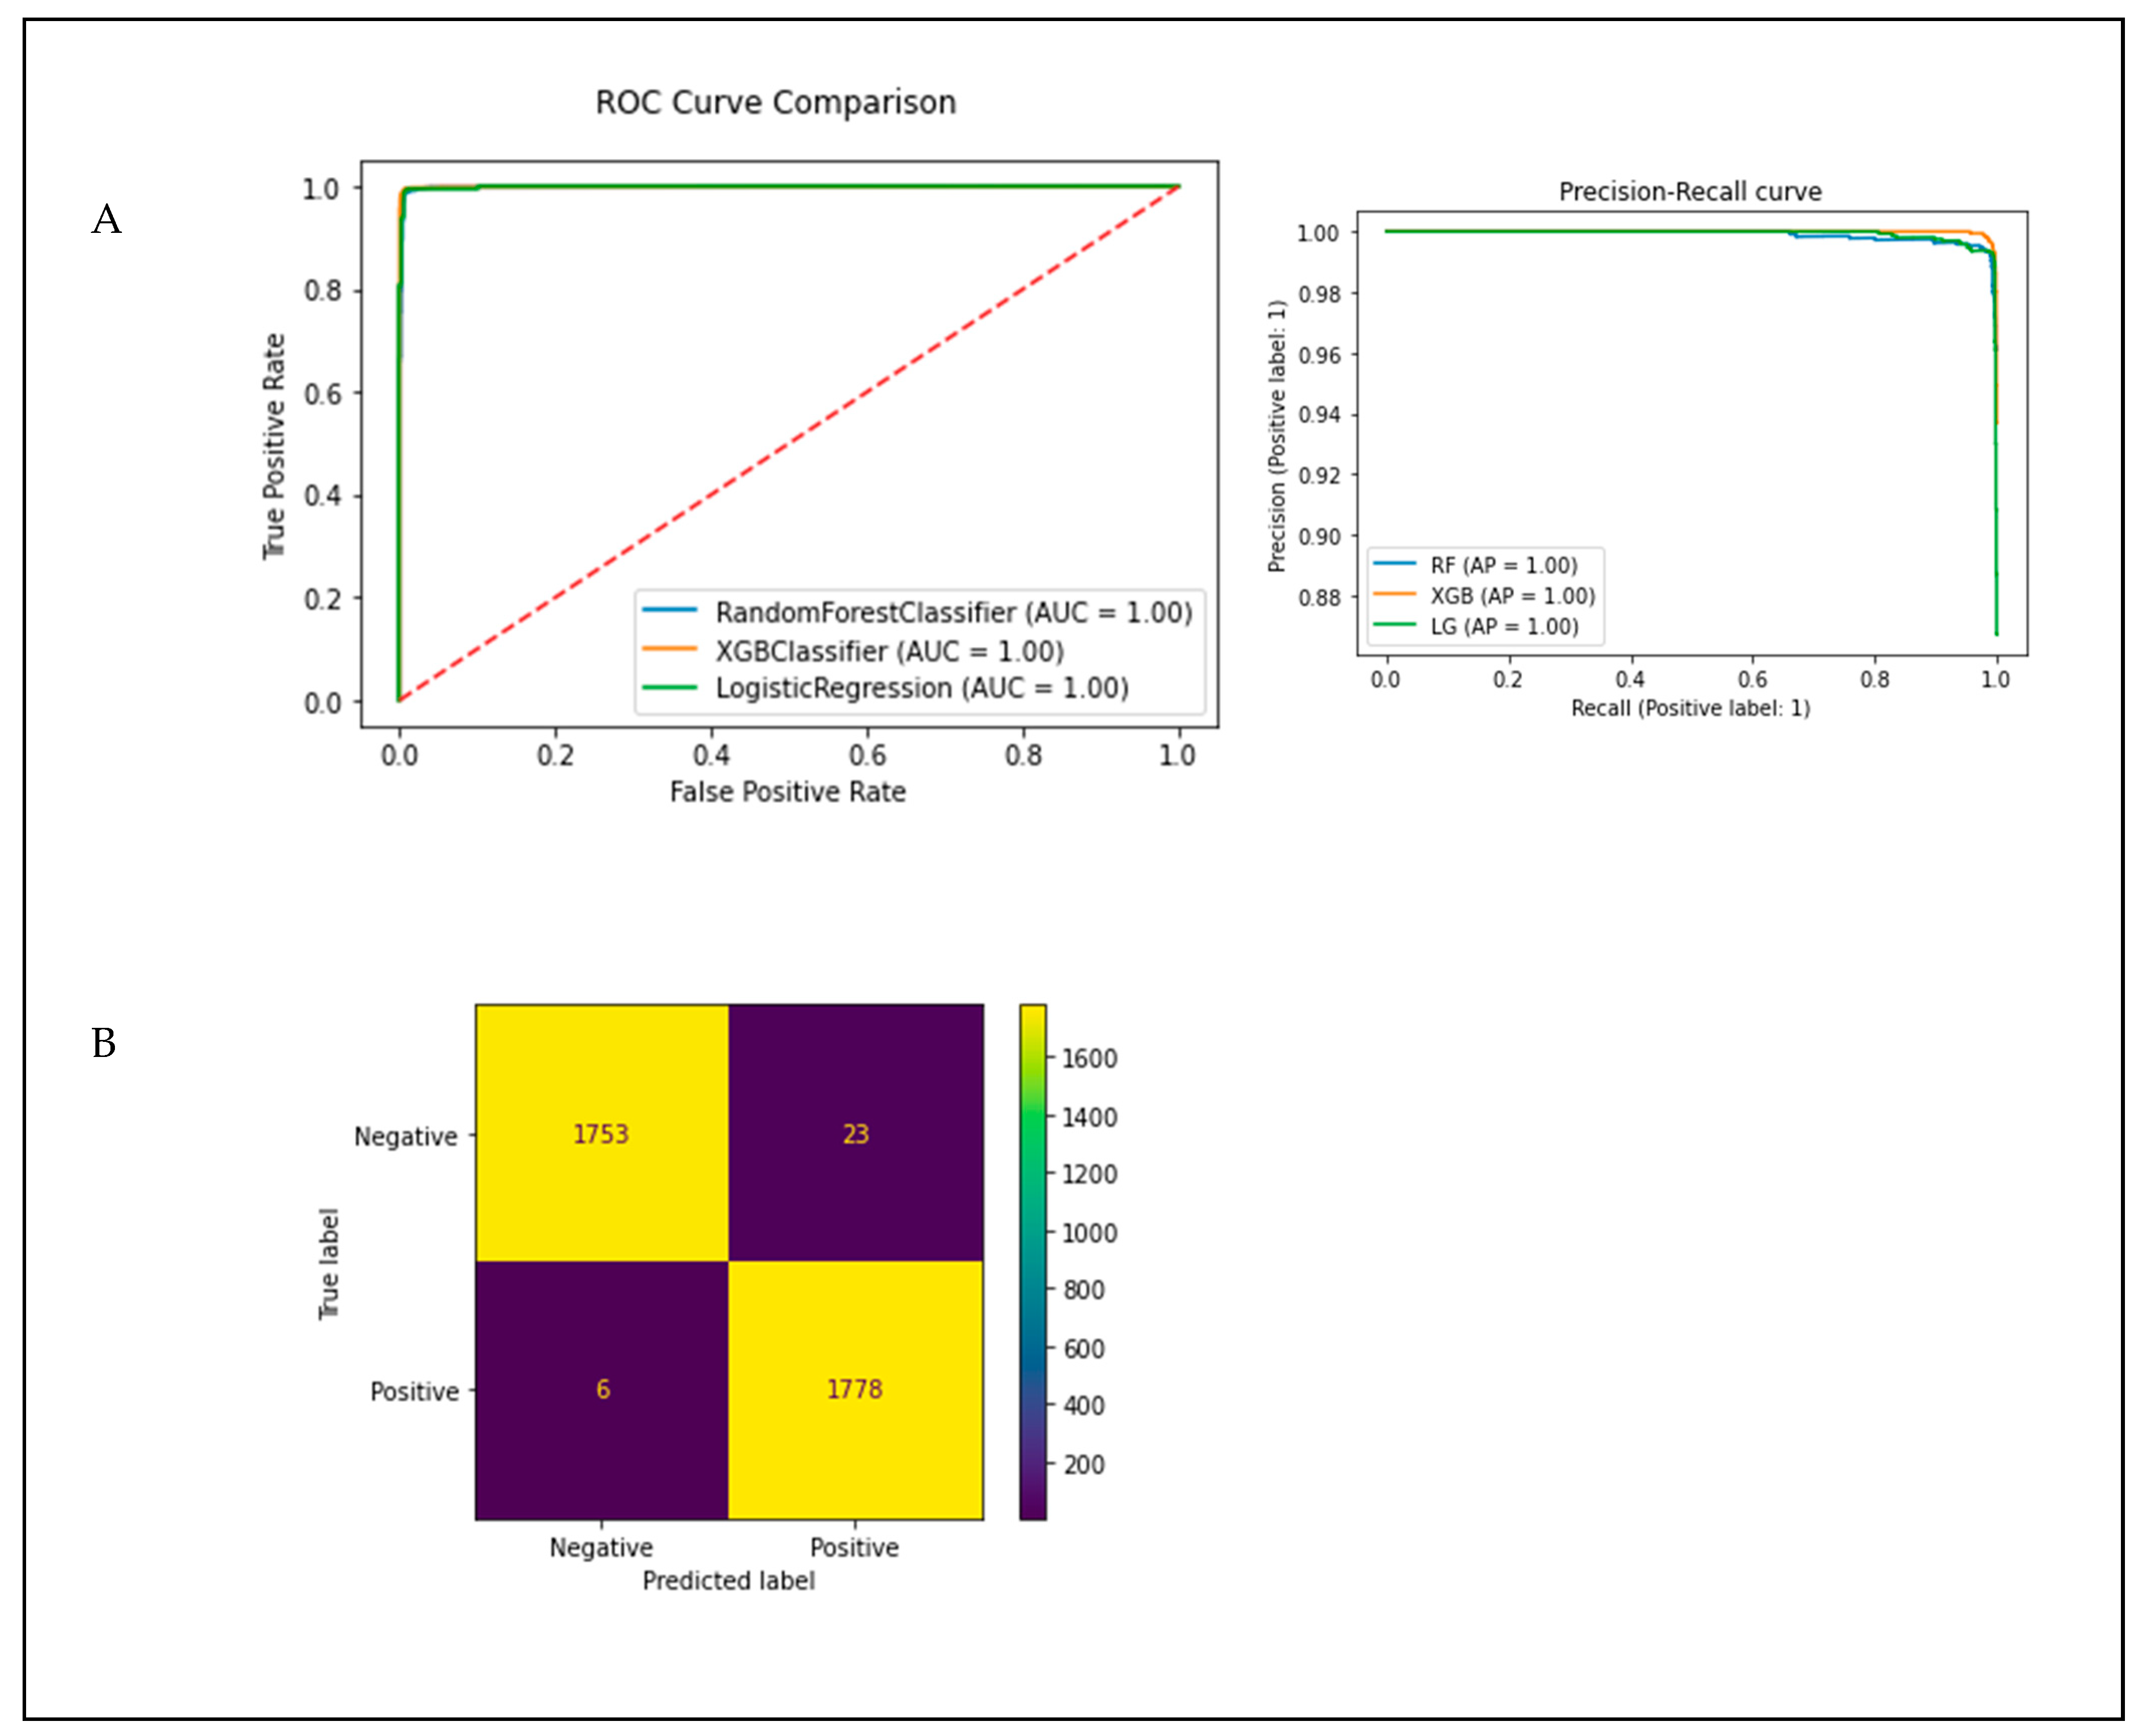
| Subset A: Age + Gender + TyG-Index + Creatinine | |||||||
|---|---|---|---|---|---|---|---|
| Model | Accuracy | Precision | Recall (Sensitivity) | Specificity | F-Score | AUC | |
| Train | Test | ||||||
| Random forest | 0.99 | 0.99 | 0.98 | 1.0 | 0.98 | 0.99 | 1.0 |
| Logistic regression | 0.99 | 0.99 | 0.99 | 1.0 | 0.99 | 0.99 | 1.0 |
| XGB classifier | 1.0 | 1.0 | 0.99 | 1.0 | 0.99 | 0.99 | 1.0 |
| Subset B: Age + Gender + TG/HDL-C ratio + Creatinine | |||||||
| Model | Accuracy | Precision | Recall (Sensitivity) | Specificity | F-Score | AUC | |
| Train | Test | ||||||
| Random forest | 0.99 | 0.99 | 0.98 | 0.99 | 0.98 | 0.99 | 1.0 |
| Logistic regression | 0.99 | 0.99 | 0.98 | 0.99 | 0.98 | 0.99 | 1.0 |
| XGB classifier | 0.99 | 0.99 | 0.99 | 0.99 | 0.99 | 0.99 | 1.0 |
| Subset C: Age + Gender + VAI + Creatinine | |||||||
| Model | Accuracy | Precision | Recall (Sensitivity) | Specificity | F-Score | AUC | |
| Train | Test | ||||||
| Random forest | 0.99 | 0.99 | 0.98 | 1.0 | 0.98 | 0.99 | 1.0 |
| Logistic regression | 0.99 | 0.99 | 0.98 | 0.99 | 0.98 | 0.99 | 1.0 |
| XGB classifier | 1.0 | 0.99 | 0.99 | 1.0 | 0.99 | 0.99 | 1.0 |
Publisher’s Note: MDPI stays neutral with regard to jurisdictional claims in published maps and institutional affiliations. |
© 2022 by the authors. Licensee MDPI, Basel, Switzerland. This article is an open access article distributed under the terms and conditions of the Creative Commons Attribution (CC BY) license (https://creativecommons.org/licenses/by/4.0/).
Share and Cite
Jallow, A.W.; Bah, A.N.S.; Bah, K.; Hsu, C.-Y.; Chu, K.-C. Machine Learning Approach for Chronic Kidney Disease Risk Prediction Combining Conventional Risk Factors and Novel Metabolic Indices. Appl. Sci. 2022, 12, 12001. https://doi.org/10.3390/app122312001
Jallow AW, Bah ANS, Bah K, Hsu C-Y, Chu K-C. Machine Learning Approach for Chronic Kidney Disease Risk Prediction Combining Conventional Risk Factors and Novel Metabolic Indices. Applied Sciences. 2022; 12(23):12001. https://doi.org/10.3390/app122312001
Chicago/Turabian StyleJallow, Amadou Wurry, Adama N. S. Bah, Karamo Bah, Chien-Yeh Hsu, and Kuo-Chung Chu. 2022. "Machine Learning Approach for Chronic Kidney Disease Risk Prediction Combining Conventional Risk Factors and Novel Metabolic Indices" Applied Sciences 12, no. 23: 12001. https://doi.org/10.3390/app122312001
APA StyleJallow, A. W., Bah, A. N. S., Bah, K., Hsu, C.-Y., & Chu, K.-C. (2022). Machine Learning Approach for Chronic Kidney Disease Risk Prediction Combining Conventional Risk Factors and Novel Metabolic Indices. Applied Sciences, 12(23), 12001. https://doi.org/10.3390/app122312001