Article

Machine Learning Approach for Chronic Kidney Disease Risk Prediction Combining Conventional Risk Factors and Novel Metabolic Indices

1
Department of Health Technology, National Taipei University of Nursing and Health Sciences, Taipei 112, Taiwan
2
Department of Medical Laboratory Science and Biotechnology, Taipei Medical University, Taipei 11031, Taiwan
3
Graduate Institute of Medical Informatic, Taipei Medical University, Taipei 11031, Taiwan
4
Department of Information Management, National Taipei University of Nursing and Health Sciences, Taipei 11219, Taiwan
5
College of Public Health, Taipei Medical University, Taipei 11031, Taiwan
6
Department of Education and Research, Taipei City Hospital, Taipei, Taiwan
*
Authors to whom correspondence should be addressed.
Appl. Sci. 2022, 12(23), 12001; https://doi.org/10.3390/app122312001
Submission received: 2 November 2022 / Revised: 14 November 2022 / Accepted: 16 November 2022 / Published: 24 November 2022
(This article belongs to the Special Issue Medical Intelligence with Interoperability and Standard (APAMI 2022))

Abstract

:
Patients at risk of chronic kidney disease (CKD) must be identified early and precisely in order to prevent complications, save lives, and limit expenditures for patients and health systems. This study aimed to develop a simple, high-precision machine learning model to identify individuals at risk of developing CKD in the near future, using a novel metabolic index with or without creatinine. This retrospective cohort study used data from the MJ medical record database collected between 2001 and 2015 in Taiwan. We used Cox hazard regression to identify potential predictors, including the novel metabolic index, for use as variables in the models. To develop a machine learning-based CKD risk model with fewer variables, we performed several experimental analyses to combine interacting variables into subsets. Those subsets were used to train three models, random forest, logistic regression, and XGBoost, with or without adding creatinine. The study included 12,189 participants, 20% with and 80% without CKD. The most important conventional predictors of CKD are age and gender. The novel metabolic index, TyG-Index, TG/HDL-ratio and VAI, had stronger predictive power than the conventional risk factors. Without including creatinine data, the XGBoost provided the best predictive performance. After adding creatinine, the performance of all the models was excellent, outperforming both conventional indicators and existing clinical algorithms for CKD. Using novel metabolic index in machine learning-based CKD risk prediction can accurately identify individuals at risk of diagnosis with CKD in the next year, with or without including creatinine.

1. Introduction

Chronic kidney disease (CKD) is a serious public health problem and increases the global burden of cardiovascular morbidity and mortality [1]. According to a recent report on disease surveillance in the United States, an estimated 37 million people (15 percent of the adult population) are affected by kidney disease, with approximately 90 percent of those affected unaware of their condition [2]. In Taiwan, CKD affects an estimated 2 million people, of whom only 3.5 percent are aware of their condition. Taiwan is controversial for having the highest per capita rate of end-stage renal disease in the world, resulting in extensive dialysis treatments [3]. It is hard to say if the vastly different rate of CKD in Taiwan compared to the U.S. reflects an actual difference or the ease of access to medical care and diagnosis in Taiwan’s healthcare system.
Kidney disease is asymptomatic and often goes undiagnosed until it reaches an advanced stage [4]. Organ transplantation remains the only survival option for patients with severe end-stage organ failure. In 2018, approximately 141,000 kidney transplants were performed worldwide. Therefore, both prediction and prevention of CKD are important, not only to prevent end-stage renal failure, but also to reduce the associated risk of cardiovascular disease and death.
Metabolic indices are increasingly used in clinical practice to predict disease, particularly in situations, such as large scale epidemiological studies, where the conventional methods of diagnosis are not feasible [5]. Recently, a number of novel metabolic indices (NMI) have been developed for disease assessment. For example, the triglyceride glucose (TyG) index, triglyceride high-density lipoprotein cholesterol (TG/HDL-C) ratio, visceral adiposity index (VAI), and the lipid accumulation product (LAP) are metabolic indices based on anthropometric and biochemical data collected in clinical practice [6].
Engineering techniques can be used to create predictive control systems for assessing and preventing CKD. Machine leaning (ML) is one of the data mining tools applied to analyzing databases as a way to produce new knowledge. With machine learning algorithms, it is possible to evaluate lab records and other information to identify patterns that can be used for early diagnosis of CKD. Through knowledge discovery in databases, low-level data can be synthesized into high-level knowledge that may assist practitioners in gaining a better understanding of how CKD develops in order to diagnose it earlier [7]. ML-based algorithms have a wide range of applications in the medical field, including CKD risk prediction. However, to the best of our knowledge, no attempts have been made to compare the effectiveness of ML-based CKD risk prediction with the novel metabolic indices or to combine the two approaches.
Common conventional methods of diagnosing CKD, such as albuminuria, eGFR and medical imaging, are tedious, unreliable, expensive, and can only diagnose CKD once it occurs. A cheap, accurate, and reliable tool to predict CKD risk earlier would be beneficial to save lives and avert economic losses. Identifying which novel indices better predict onset of CKD and utilizing those in machine learning could provide additional tools to support prevention strategies that can avoid the higher costs of dialysis. The goal of the study was to identify the novel metabolic indices with high predictive power and can also be combine with the conventional risk factors to develop a machine learning model that can identify individuals at risk of developing chronic kidney disease earlier and precisely at low cost with or without the conventional methods.

2. Materials and Methods

2.1. Study Design and Participants

A retrospective cohort study of chronic kidney disease (CKD) data from the Mei Jau (MJ) database of medical records collected between 2001 and 2015 in Taiwan. The data consists of apparently healthy individuals who participated annually in a standard medical screening programmed run by a private firm (MJ Health Management Institution, Taipei, Taiwan). The study first sought for institutional review board (IRB) approval from MJ Health Management Institution (MJHMI) prior to commencing. The dataset was received under the authorization code: MJHRF20170001A to the MJ database. A detailed description of the whole data collection and tool was explained in previous study [8].
The participants were adults (aged 18 years and above) with CKD stages 1 and 2 (estimated GFR, >60 mL/min/1.73 m2) at the initial visit. The participants included those who attained at least more than one visit and had complete medical records. CKD participants were those who developed the disease within one year of the follow-up. We excluded those participants who were previously diagnosed as CKD. The flow chart of the cohort study is shown in Figure 1. The study followed good clinical guidelines and regulations.

2.2. Outcome Definition

We defined CKD using the National Kidney Foundation (NKF) guidelines [9]. Participants with albuminuria ACR ≥ 30 mg/g or decreased glomerular filtration rate (GFR < 60 mL/min/1.73 m2) for over three months were identified as CKD patients. The eGFR was calculated using the Japanese equation: eGFR (mL/min/1.73 m2) = 194 × Serum creatinine−1.094 × Age−0.287 × 0.739 (if female) [10].

2.3. Definition of the Novel Metabolic Indices (NMI)

In this study, we identified three proposed novel metabolic indices (NMI) and they were calculated based on previous published formulas as below.
(1)
Triglyceride-glucose (TyG) index = Ln [fasting triglycerides (mg/dL) × fasting glucose (mg/dL)]/2 [11];
(2)
Triglyceride/HDL-cholesterol ratio (TG/HDL-C) = The ratio between serum triglycerides and HDL cholesterol [12];
(3)
Visceral adiposity index (VAI) = (WC [cm]/39.68 + (1.88 × BMI) × (TG [mM/L]/1.03) × (1.31/HDLC [mM/L]) for men and (WC [cm]/36.58 + (1.89 × BMI) × (TG [mM/L]/0.81) × (1.52/HDL-C [mM/L]) for women [13].
These indices are derivatives of the conventional risk factors for CKD, which include demographic characteristics (age, sex, and race), anthropometric measurements (waist circumference, body weight, and height), and blood biomarkers (triglycerides, cholesterol, HDL, and LDL-cholesterol.

2.4. Model Development

We predicted the individual risk of developing CKD based on two approaches: a statistically based and a machine learning-based approach.
In the statistically based method, all the covariates were analyzed with univariate Cox proportional hazard regression to identify the potential risk factors of CKD at baseline. The variables with high prognostic of CKD were selected at a set threshold with a p-value of ≤0.05, a hazard ratio (HR) and a review of previous literature for developing the ML model. We also performed univariate a receiver operating characteristic (ROC) curve analysis on the selected variables to further evaluate their propensity for discriminating CKD patients. Using the area under the ROC curve or AUC, we identified conventional features with strong diagnostic ability of CKD and combined them with the NMI to form a subset of predictors. To avoid bias on the respond variable (CKD) and enhance the performance of other features, eGFR was excluded from the selected predictors.
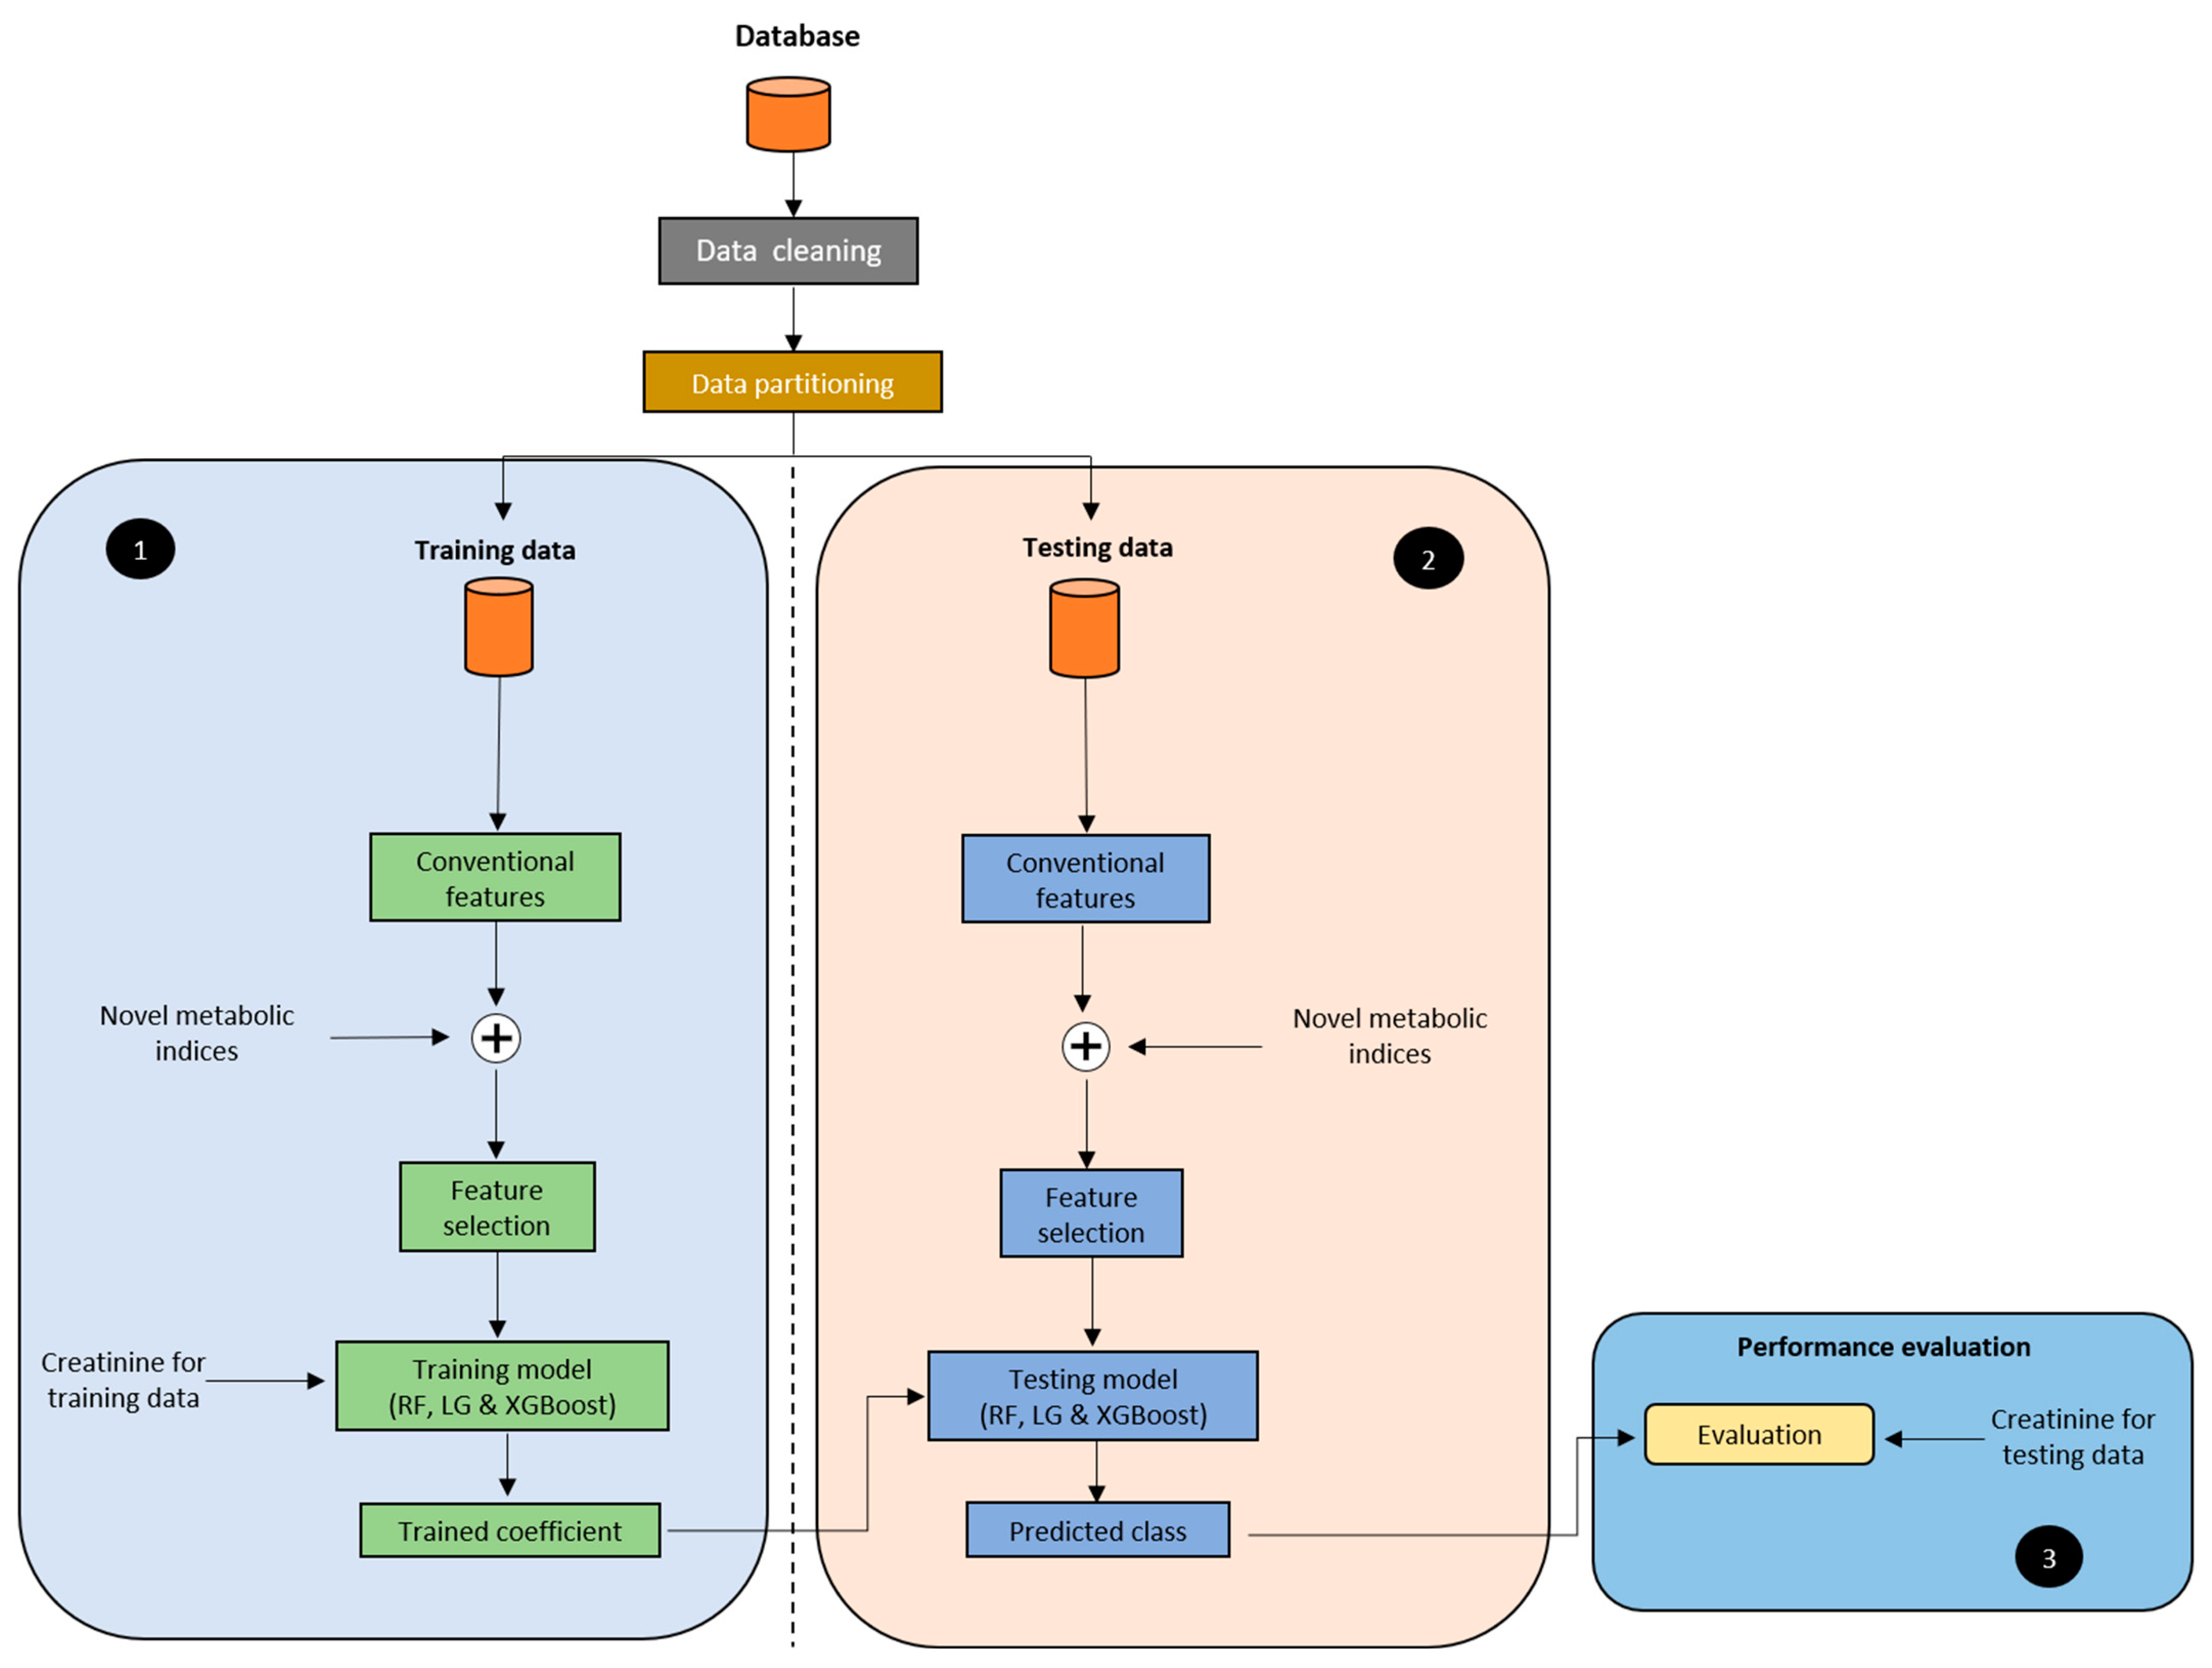
The framework for machine learning-based CKD risk prediction is shown in Figure 2. The framework is separated into three sections: (1) the training model, (2) the testing model, and (3) the performance evaluation. To avoid inconsistent and inaccurate decisions by the model, we performed a rigorous data preprocessing such as deleting all missing values, outliers, duplicated records and incomplete records. The patients without CKD were far more than those with CKD. To remedy this problem, Chawla et al. (2002) introduced a synthetic minority oversampling technique (SMOTE) by generating a synthetic example rather than a replacement with replication. Our study also uses this approach to solve the imbalance issue [14]. The dataset was partitioned into two sets, 80% for the training set and 20% for the testing set.
The best conventional features and the novel metabolic indices identified in the Cox model and ROC analysis were employed as inputs for the training model as shown in Figure 2. Before feeding the data into the models, we performed a comprehensive data preprocessing to avoid inaccurate decision-making by the models. The selected features were grouped into subsets and trained on random forest, logistic regression, and XGBoost. After training the algorithms, a trained coefficient was generated to transform the testing algorithms. The testing algorithms classified individuals into the CKD or non-CKD groups. Furthermore, to augment the model performance, we also added creatinine to each training model. Finally, the performance of the models was evaluated using metrics including accuracy, recall (sensitivity), specificity, F-score, and area under the curve (AUC).

2.5. Experimental Protocol

This study was focused on two categories of experiments.
 Protocol 1. 
Comparing conventional CKD risk factors and novel metabolic indicesat baseline.
The predictive power of the conventional CKD risk factors was compared against the novel metabolic indices (NMI) based on the hazard ratio (HR) coefficients in the Cox model and AUC. In this experiment, we hypothesized that the novel metabolic indices would have a greater predictive power to identify individuals at risk of CKD than the ordinary conventional or traditional risk factors.
 Protocol 2. 
Comparing machine learning-based novel metabolic indices with and without Creatinine.
Here, we compared the performance of two models; one model contained creatinine and the other was without creatinine. In this experiment, we assumed that the model combining creatinine with machine learning-based novel metabolic indices would produce better and more precise results than the model without creatinine. We also expected that the model using machine learning-based NMI with creatinine would outperform previously developed predictive models which do not integrate the NMI and creatinine together.

2.6. Statistical Analysis

The baseline characteristics were represented as median (IQR) for continuous variables and as numbers (%) for categorical variables. We used a Mann–Whitney U test to compare continuous variables, and a Chi-square test or Fisher’s exact test to compare categorical variables. A p-value of ≤ 0.05 was considered statistically significant. The area under the ROC curve was employed to compare the predictive performance of the models. All data analysis was performed using STATA (version 16.1) and Python (version 3.7).

3. Results and Discussion

3.1. Participants

The study finally recruited 12,189 participants, 20% (n = 2498) with evidence of CKD and 80% (n = 9691) without the disease. The majority of the CKD participants were female 71% (n = 1781), older (median 40, IQR 34–48, p < 0.001) and had a higher burden history of hypertension 4.1% (n = 102) and diabetes 30 1.2% (n = 30) (Table 1).
Compared with non-CKD, those with CKD had a higher body weight (median 63.6, IQR 56.2–72.7), BMI (median 23.1, IQR 21.0–25.4), waist circumference (median 77, IQR 71–84), hip circumference (median 95, IQR 91–99), systolic blood pressure (median 117, IQR 107–128) and diastolic blood pressure (median 70, IQR 64–77) but had lower body height (median 161.0, IQR 156.1–167.0) and body fat (median 24.9, IQR 21.0–29.5) (Table 1).
For the laboratory examinations data, CKD participants had a less favorable metabolic profile (fasting blood glucose, triglyceride, total cholesterol, HDL-cholesterol, LDL-cholesterol, blood urea nitrogen, creatinine, uric acid), and a worse level of eGFR (median 52.9, IQR 47.2–56.8) (Table 1).
A slightly higher level of metabolic indices was noted in those with chronic kidney disease than in those with the disease as shown in Table 1.

3.2. Identification of Potential Predictors and Their Association with CKD

The Cox hazard model is a model used to predict risk between pairs of subjects within the same cohort, and the area under the ROC curve (AUC) is a graphical representation showing the discriminatory ability of a classification problem. Based on the hazard ratio, p-value < 0.05, AUC, and domain knowledge, 13 variables (including the metabolic indices) were considered the most significant predictors of CKD, as shown in Table 2. Among the predictors, serum creatinine had the highest discriminatory capacity for CKD with an AUC of 0.909 (95% CI, 0.903–0.915), followed by gender with an AUC of 0.756 (95% CI, 0.745–0.768). Patient demographic data (age and gender) and creatinine were the most important predictors of CKD and are often used in clinical practice to estimate the glomerular filtration rate (GFR) for CKD diagnoses [15]. We compared the association of the metabolic indices with CKD against their original components such as BMI, WC, Triglyceride, Cholesterol, HDL-cholesterol, and LDL-cholesterol. Compared with the original components, our proposed metabolic indices (including TyG-Index, TG/HDL, and VAI) were more associated with CKD risk. However, the association of the TyG-Index, TG-HDL, and VAI with CKD can also differ by gender due to differences in lipid decomposition and distribution, which change according to age. The current findings were also similar to those reported in previous population-based longitudinal studies, which used only conventional statistics to investigate [16,17,18].

3.3. Grouping Predictors

For our machine learning (ML) model, we performed several experimental analyses to group interacting predictors into the same subset to identify which one of them better predicts CKD in the models with or without creatinine. To group our predictors into subsets, we first trained the models inputting all the 13 variables in Table 2. Applying the backward elimination feature selection technique, variables with the least significance to the models were removed according to their decreased AUC value in Table 2. This was important for the ML models to make an accurate and quick judgment on the predictors. Furthermore, it helped to control the impute variables and training time. The predictors with higher computing power to the models were retained for the grouping. Age, gender, creatinine, and the novel metabolic indices including TyG-Index, TG/HDL-C ratio, and VAI, were the most significant predictors for the grouping and modeling. Among the conventional CKD risk factors, age, gender, and creatinine were the most consistent and had better interaction with the NMI. To fit our models with fewer variables, we combined age, gender, and a novel metabolic index to form a distinct subset. Age and gender are non-modifiable conventional risk factors, which play a crucial role in the prediction of CKD [19]. Each ML model was trained and tested using the subsets. We discovered that conventional features with high affinity for the NMI accurately predicted CDK. Those with low affinity, on the other hand, predicted CKD moderately. In total, three subsets were identified as the best predictors, and each subset constituted three features as represented in Table 3. Integrating age and gender with TyG-Index, TG/HDL-C ratio or VAI generated high performance in the model. To further maximize the model performance, we subsequently added creatinine.

3.4. Model Evaluation and Performance

The study used several evaluation metrics (accuracy, recall or sensitivity, specificity, F-score and AUC–ROC) to determine the discriminative ability of the predictive models. To identify the most efficient model for our one-year prediction, we built multiple predictive models using different subsets and compared their predictive power. To boost the model’s performance, statistical relationships between variables were taken into account during imputation, and extensive data wrangling and feature selection techniques were used before loading the data into the models. All models were developed using the same predictors.
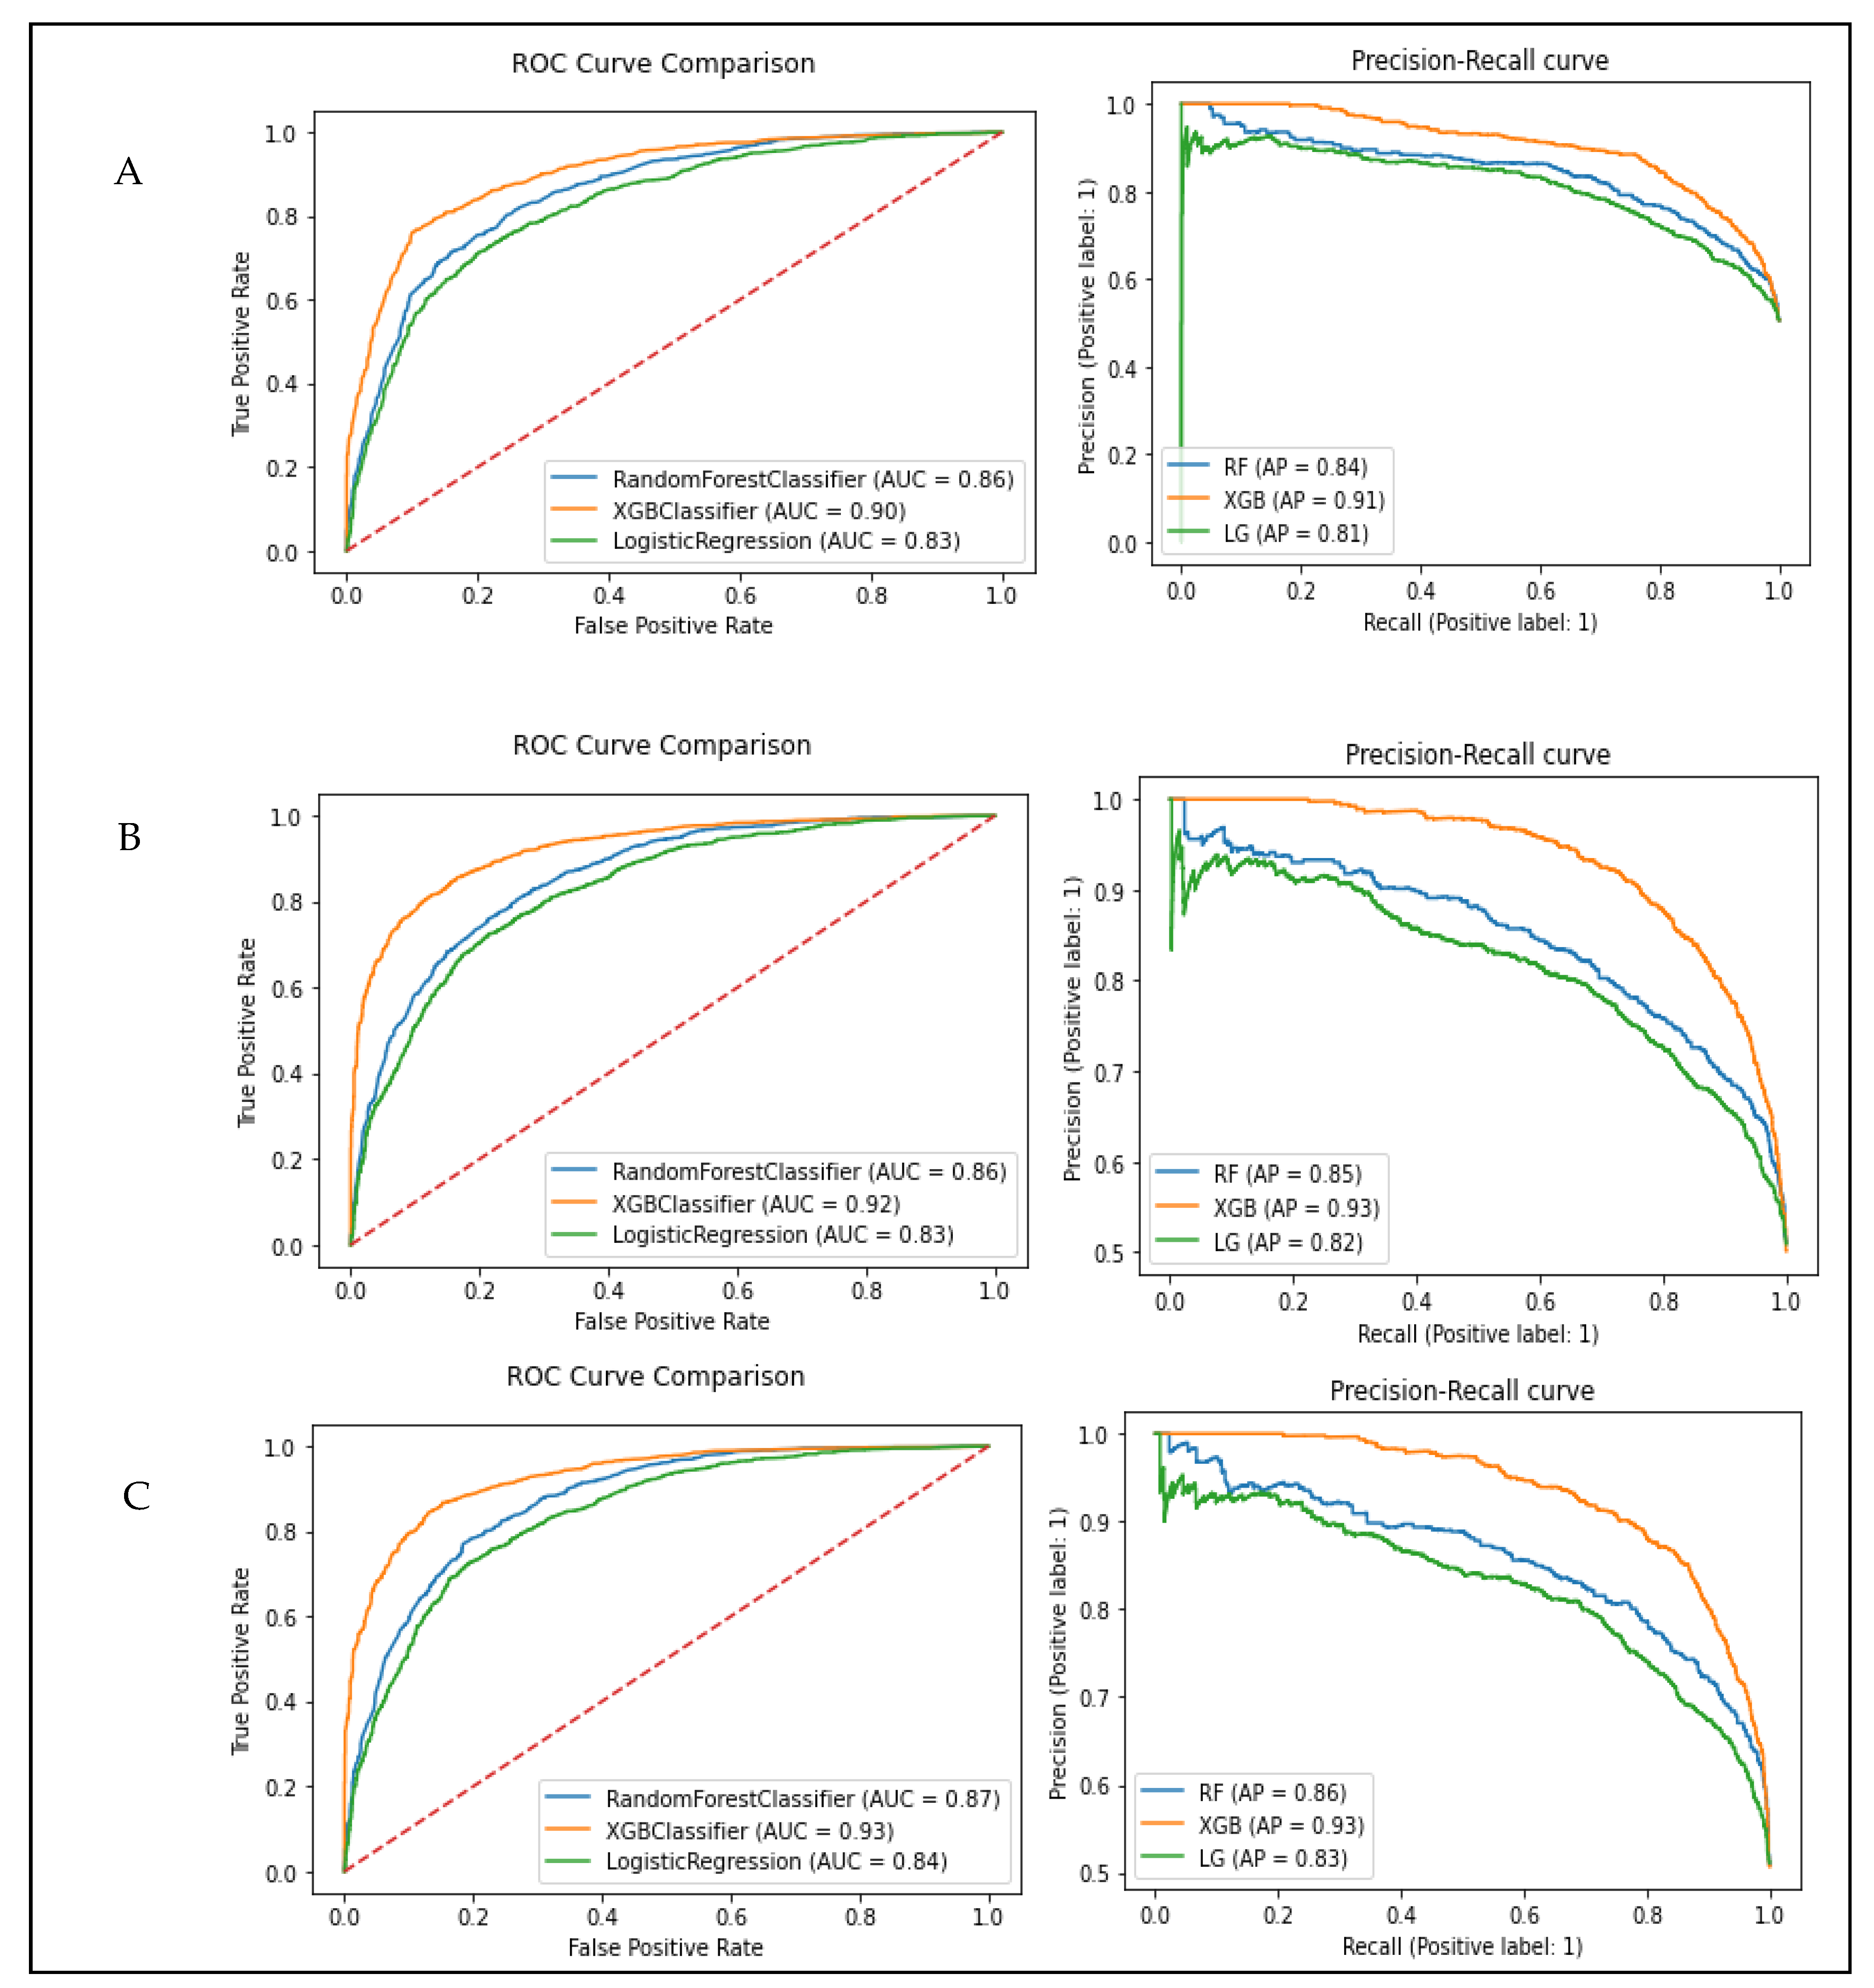
Table 4 and Table 5 showed the performance comparison of random forest, logistic regression, and XGBoost at various subsets of predictors trained without and with creatinine, respectively. Without the creatinine data (Table 4), the XGBoost model provided the highest AUC value in all the subsets (A, B and C), followed by the random forest and the logistic regression model. The training and testing accuracy, sensitivity, recall (specificity), and F-score values of the XGBoost model are all greater than the three competing models. Moreover, the discriminative ability of XGBoost at various predictor groups was superior when trained with subset C (Age + Gender + VAI), generating an AUC–ROC of 0.93. The subsets B and C are also comparatively good with an AUC–ROC of 0.90 and 0.92, respectively (Table 4). The ROC and precision-recall curves of the three classification models for the one-year CKD prediction at the different predictive subgroups are shown in Figure 3. It also shows that, when compared to the two comparison models, the XGBoost classifier has the strongest predictive performance and is a promising approach for predicting CKD in one year. As previously mentioned, age and gender are important predictors of CKD and have great influences on the models. Interacting age and gender with the metabolic indices provide stability and enhancement to the modes.
To further optimize the model and attain optimal performance, we altered the imputation variables by including creatinine into the trained subsets (A, B and C). Creatinine is a blood metabolite that is closely linked to the glomerular filtration rate (GFR). Therefore, creatinine can have a great influence on the result of the eGFR. The performance matrix of the models after incorporating creatinine is represented in Table 5. It can be observed that by adding creatinine to the three subsets of predictors, all the models attained maximum performance at an accuracy of 0.99 and AUC–ROC of 1.0. Therefore, including a creatinine test in routine health exams could help detect CKD. The graphical representation of the AUC–ROC, precision-recall curve and confusion matrix of the enhanced models with creatinine are shown in Figure 4. We also visualized the random forest tree for subset A, B and C (with or without creatinine) to examine the impact of the variables in the model (Supplementary File 1, Figures S1–S4).
Creatinine testing is not included in many countries’ routine health examinations since adding more items to a full examination increases the expense. An algorithm that evaluates the risk of CKD based on common test findings rather than the creatinine test would boost the chances of early detection and treatment. During our literature review, we have not come across any study that utilized the novel metabolic indices to develop a machine learning model for early CKD prediction.
The study showed that machine learning (ML) models using age, gender, and with any of the metabolic indices (TyG-Index, TG/HDL-C ratio, and VAI), can equally identify individuals at risk of CKD comparable to previously developed models that were fully enhanced by including creatinine and training many predictors to improve performance [20,21]. Our proposed indices (TyG-Index, TG/HDL-C ratio, and VAI) can be an alternative for predicting CKD in healthy middle-aged adults, especially in settings where creatinine data are unavailable.
Our research highlights some of the possibilities in ML-based CKD risk prediction using the novel metabolic indices with or without the use of creatinine. There were limitations to the study, some of which were concerning the dataset. The issue of class imbalance in the positive class was a major challenge. It is difficult to train classifiers on this type of data since they get biased toward a specific set of classes, resulting in poor performance. This problem was addressed by applying the Synthetic Minority Oversampling Technique (SMOTE). Another limitation was the issue of the generalizability as the study used participants only from Taiwan. This could be addressed by utilizing data from other countries. Only traditional machine learning models were used in this study. Deep learning, a sophisticated subset of machine learning and artificial intelligence, could be used to improve on the current findings.

4. Conclusions

Three subsets of predictors derived from one-year CKD data were used to train the three machine learning models. The models’ efficacy in predicting patients at risk of CKD in one year using various subsets predictors was similar across all models. Without creatinine data, the XGBoost classifier performs the best in all subsets (Subset A: AUC, 0.90; subset B: AUC, 0.92; Subset C: AUC, 0.93). More importantly, adding creatinine increased the generalization performance of all the models at an accuracy of 99% and AUC of 1.0. However, additional extensive modeling utilizing domain expertise and traditional approaches is still required to guarantee that the findings are interpretable.

Supplementary Materials

The following supporting information can be downloaded at: https://www.mdpi.com/article/10.3390/app122312001/s1, Figure S1: Random forest classifier tree for Subset A: age, gender, and TyG-Index; Figure S2: Random forest classifier tree for Subset A: age, gender, and TG/HDL-C ratio; Figure S3: Random forest classifier tree for Subset A: age, gender, and VAI; Figure S4: Random forest classifier tree for Subset A: age, gender, VAI, and Creatinine.

Author Contributions

Conceptualization, A.W.J., C.-Y.H. and K.-C.C.; methodology, A.W.J.; software, A.W.J., A.N.S.B. and K.B.; validation, A.W.J., C.-Y.H. and K.-C.C.; formal analysis, A.W.J.; investigation, A.W.J.; resources, C.-Y.H. and K.-C.C.; data curation, A.W.J.; writing—original draft preparation, A.W.J. and A.N.S.B.; writing—review and editing, A.N.S.B., K.B., C.-Y.H. and K.-C.C.; supervision, C.-Y.H. and K.-C.C. All authors have read and agreed to the published version of the manuscript.

Funding

This research received no external funding.

Institutional Review Board Statement

The study was conducted in accordance with the Declaration of Helsinki, and approved by the Institutional Review Board of Mei Jau (M.J.) Health Management Institute (Authorization code: MJHRF20170001A).

Informed Consent Statement

Informed consent was obtained from all subjects involved in the study.

Data Availability Statement

The data that support the findings of this study are available from Mei Jau (M.J.) Health Management Institute but limited for research purpose only. The data are not publicly available due to privacy/ethical restriction. Data are available from the authors upon reasonable request and with permission of M.J. Health Management Institute.

Acknowledgments

The authors thank M.J. Health Research Foundation group in Taiwan for providing the data and Stefani Pfeiffer of National Taipei University of Nursing and Health Science for proofreading the paper.

Conflicts of Interest

The authors declare no conflict of interest.

References

  1. Seong, J.M.; Lee, J.H.; Gi, M.Y.; Son, Y.H.; Moon, A.E.; Park, C.E.; Sung, H.H.; Yoon, H. Gender difference in the association of chronic kidney disease with visceral adiposity index and lipid accumulation product index in Korean adults: Korean National Health and Nutrition Examination Survey. Int. Urol. Nephrol. 2021, 53, 1417–1425. [Google Scholar] [CrossRef] [PubMed]
  2. Foundation, N.K. Kidney Disease: The Basics. 2021. Available online: https://www.kidney.org/news/newsroom/fsindex (accessed on 20 September 2022).
  3. Lin, Y.T. No More ‘Kidney Dialysis Island’. 2018. Available online: https://english.cw.com.tw/article/article.action?id=1839 (accessed on 8 June 2022).
  4. Stenvinkel, P. Chronic kidney disease: A public health priority and harbinger of premature cardiovascular disease. J. Intern. Med. 2010, 268, 456–467. [Google Scholar] [CrossRef] [PubMed]
  5. Shuster, A.; Patlas, M.; Pinthus, J.H.; Mourtzakis, M. The clinical importance of visceral adiposity: A critical review of methods for visceral adipose tissue analysis. Br. J. Radiol. 2012, 85, 1-e25. [Google Scholar] [CrossRef] [PubMed] [Green Version]
  6. Fiorentino, T.V.; Marini, M.A.; Succurro, E.; Andreozzi, F.; Sesti, G. Relationships of surrogate indexes of insulin resistance with insulin sensitivity assessed by euglycemic hyperinsulinemic clamp and subclinical vascular damage. BMJ Open Diabetes Res. Care 2019, 7, e000911. [Google Scholar] [CrossRef] [PubMed]
  7. Wang, Z.; Chung, J.W.; Jiang, X.; Cui, Y.; Wang, M.; Zheng, A. Machine Learning-Based Prediction System For Chronic Kidney Disease Using Associative Classification Technique. Int. J. Eng. Technol. 2018, 7, 1161–1167. [Google Scholar] [CrossRef]
  8. Wu, X.; Tsai, S.P.; Tsao, C.K.; Chiu, M.L.; Tsai, M.K.; Lu, P.J.; Lee, J.H.; Chen, C.H.; Wen, C.; Chang, S.-S.; et al. Cohort Profile: The Taiwan MJ Cohort: Half a million Chinese with repeated health surveillance data. Int. J. Epidemiol. 2017, 46, 1744–1744g. [Google Scholar] [CrossRef] [PubMed]
  9. Foundation, N.K. What Is the Criteria for CKD. 2021. Available online: https://www.kidney.org/professionals/explore-your-knowledge/what-is-the-criteria-for-ckd (accessed on 8 June 2022).
  10. Kasai, T.; Miyauchi, K.; Kajimoto, K.; Kubota, N.; Dohi, T.; Tsuruta, R.; Ogita, M.; Yokoyama, T.; Amano, A.; Daida, H. Prognostic significance of glomerular filtration rate estimated by the Japanese equation among patients who underwent complete coronary revascularization. Hypertens. Res. 2011, 34, 378–383. [Google Scholar] [CrossRef] [PubMed] [Green Version]
  11. Simental-Mendia, L.E.; Rodriguez-Moran, M.; Guerrero-Romero, F. The product of fasting glucose and triglycerides as surrogate for identifying insulin resistance in apparently healthy subjects. Metab. Syndr. Relat. Disord. 2008, 6, 299–304. [Google Scholar] [CrossRef] [PubMed]
  12. Hanak, V.; Munoz, J.; Teague, J.; Stanley, A.J.; Bittner, V. Accuracy of the triglyceride to high-density lipoprotein cholesterol ratio for prediction of the low-density lipoprotein phenotype B. Am. J. Cardiol. 2004, 94, 219–222. [Google Scholar] [CrossRef] [PubMed]
  13. Amato, M.C.; Giordano, C.; Galia, M.; Criscimanna, A.; Vitabile, S.; Midiri, M.; Galluzzo, A.; AlkaMeSy Study, Group. Visceral Adiposity Index: A reliable indicator of visceral fat function associated with cardiometabolic risk. Diabetes Care 2010, 33, 920–922. [Google Scholar] [CrossRef] [PubMed]
  14. Chawla, N.V.; Bowyer, K.W.; Hall, L.O.; Kegelmeyer, W.P. SMOTE: Synthetic minority over-sampling technique. J. Artif. Intell. Res. 2002, 16, 321–357. [Google Scholar] [CrossRef]
  15. Chen, T.K.; Knicely, D.H.; Grams, M.E. Chronic Kidney Disease Diagnosis and Management: A Review. JAMA 2019, 322, 1294–1304. [Google Scholar] [CrossRef] [PubMed]
  16. Bamba, R.; Okamura, T.; Hashimoto, Y.; Hamaguchi, M.; Obora, A.; Kojima, T.; Fukui, M. The Visceral Adiposity Index Is a Predictor of Incident Chronic Kidney Disease: A Population-Based Longitudinal Study. Kidney Blood Press. Res. 2020, 45, 407–418. [Google Scholar] [CrossRef] [PubMed]
  17. Kim, Y.; Lee, S.; Lee, Y.; Kang, M.W.; Park, S.; Park, S.; Han, K.; Paek, J.H.; Park, W.Y.; Jin, K.; et al. Predictive value of triglyceride/high-density lipoprotein cholesterol for major clinical outcomes in advanced chronic kidney disease: A nationwide population-based study. Clin. Kidney J. 2021, 14, 1961–1968. [Google Scholar] [CrossRef] [PubMed]
  18. Okamura, T.; Hashimoto, Y.; Hamaguchi, M.; Obora, A.; Kojima, T.; Fukui, M. Triglyceride-glucose index is a predictor of incident chronic kidney disease: A population-based longitudinal study. Clin. Exp. Nephrol. 2019, 23, 948–955. [Google Scholar] [CrossRef] [PubMed]
  19. Shih, C.-C.; Lu, C.-J.; Chen, G.-D.; Chang, C.-C. Risk Prediction for Early Chronic Kidney Disease: Results from an Adult Health Examination Program of 19,270 Individuals. Int. J. Environ. Res. Public Health 2020, 17, 4973. [Google Scholar] [CrossRef] [PubMed]
  20. Wang, W.G. Chakraborty, and B. Chakraborty. Predicting the Risk of Chronic Kidney Disease (CKD) Using Machine Learning Algorithm. Appl. Sci. 2020, 11, 202. [Google Scholar] [CrossRef]
  21. Ekanayake, I.U.; Herath, D. Chronic Kidney Disease Prediction Using Machine Learning Methods. In Proceedings of the 2020 Moratuwa Engineering Research Conference (MERCon), Moratuwa, Sri Lanka, 28–30 July 2020. [Google Scholar]
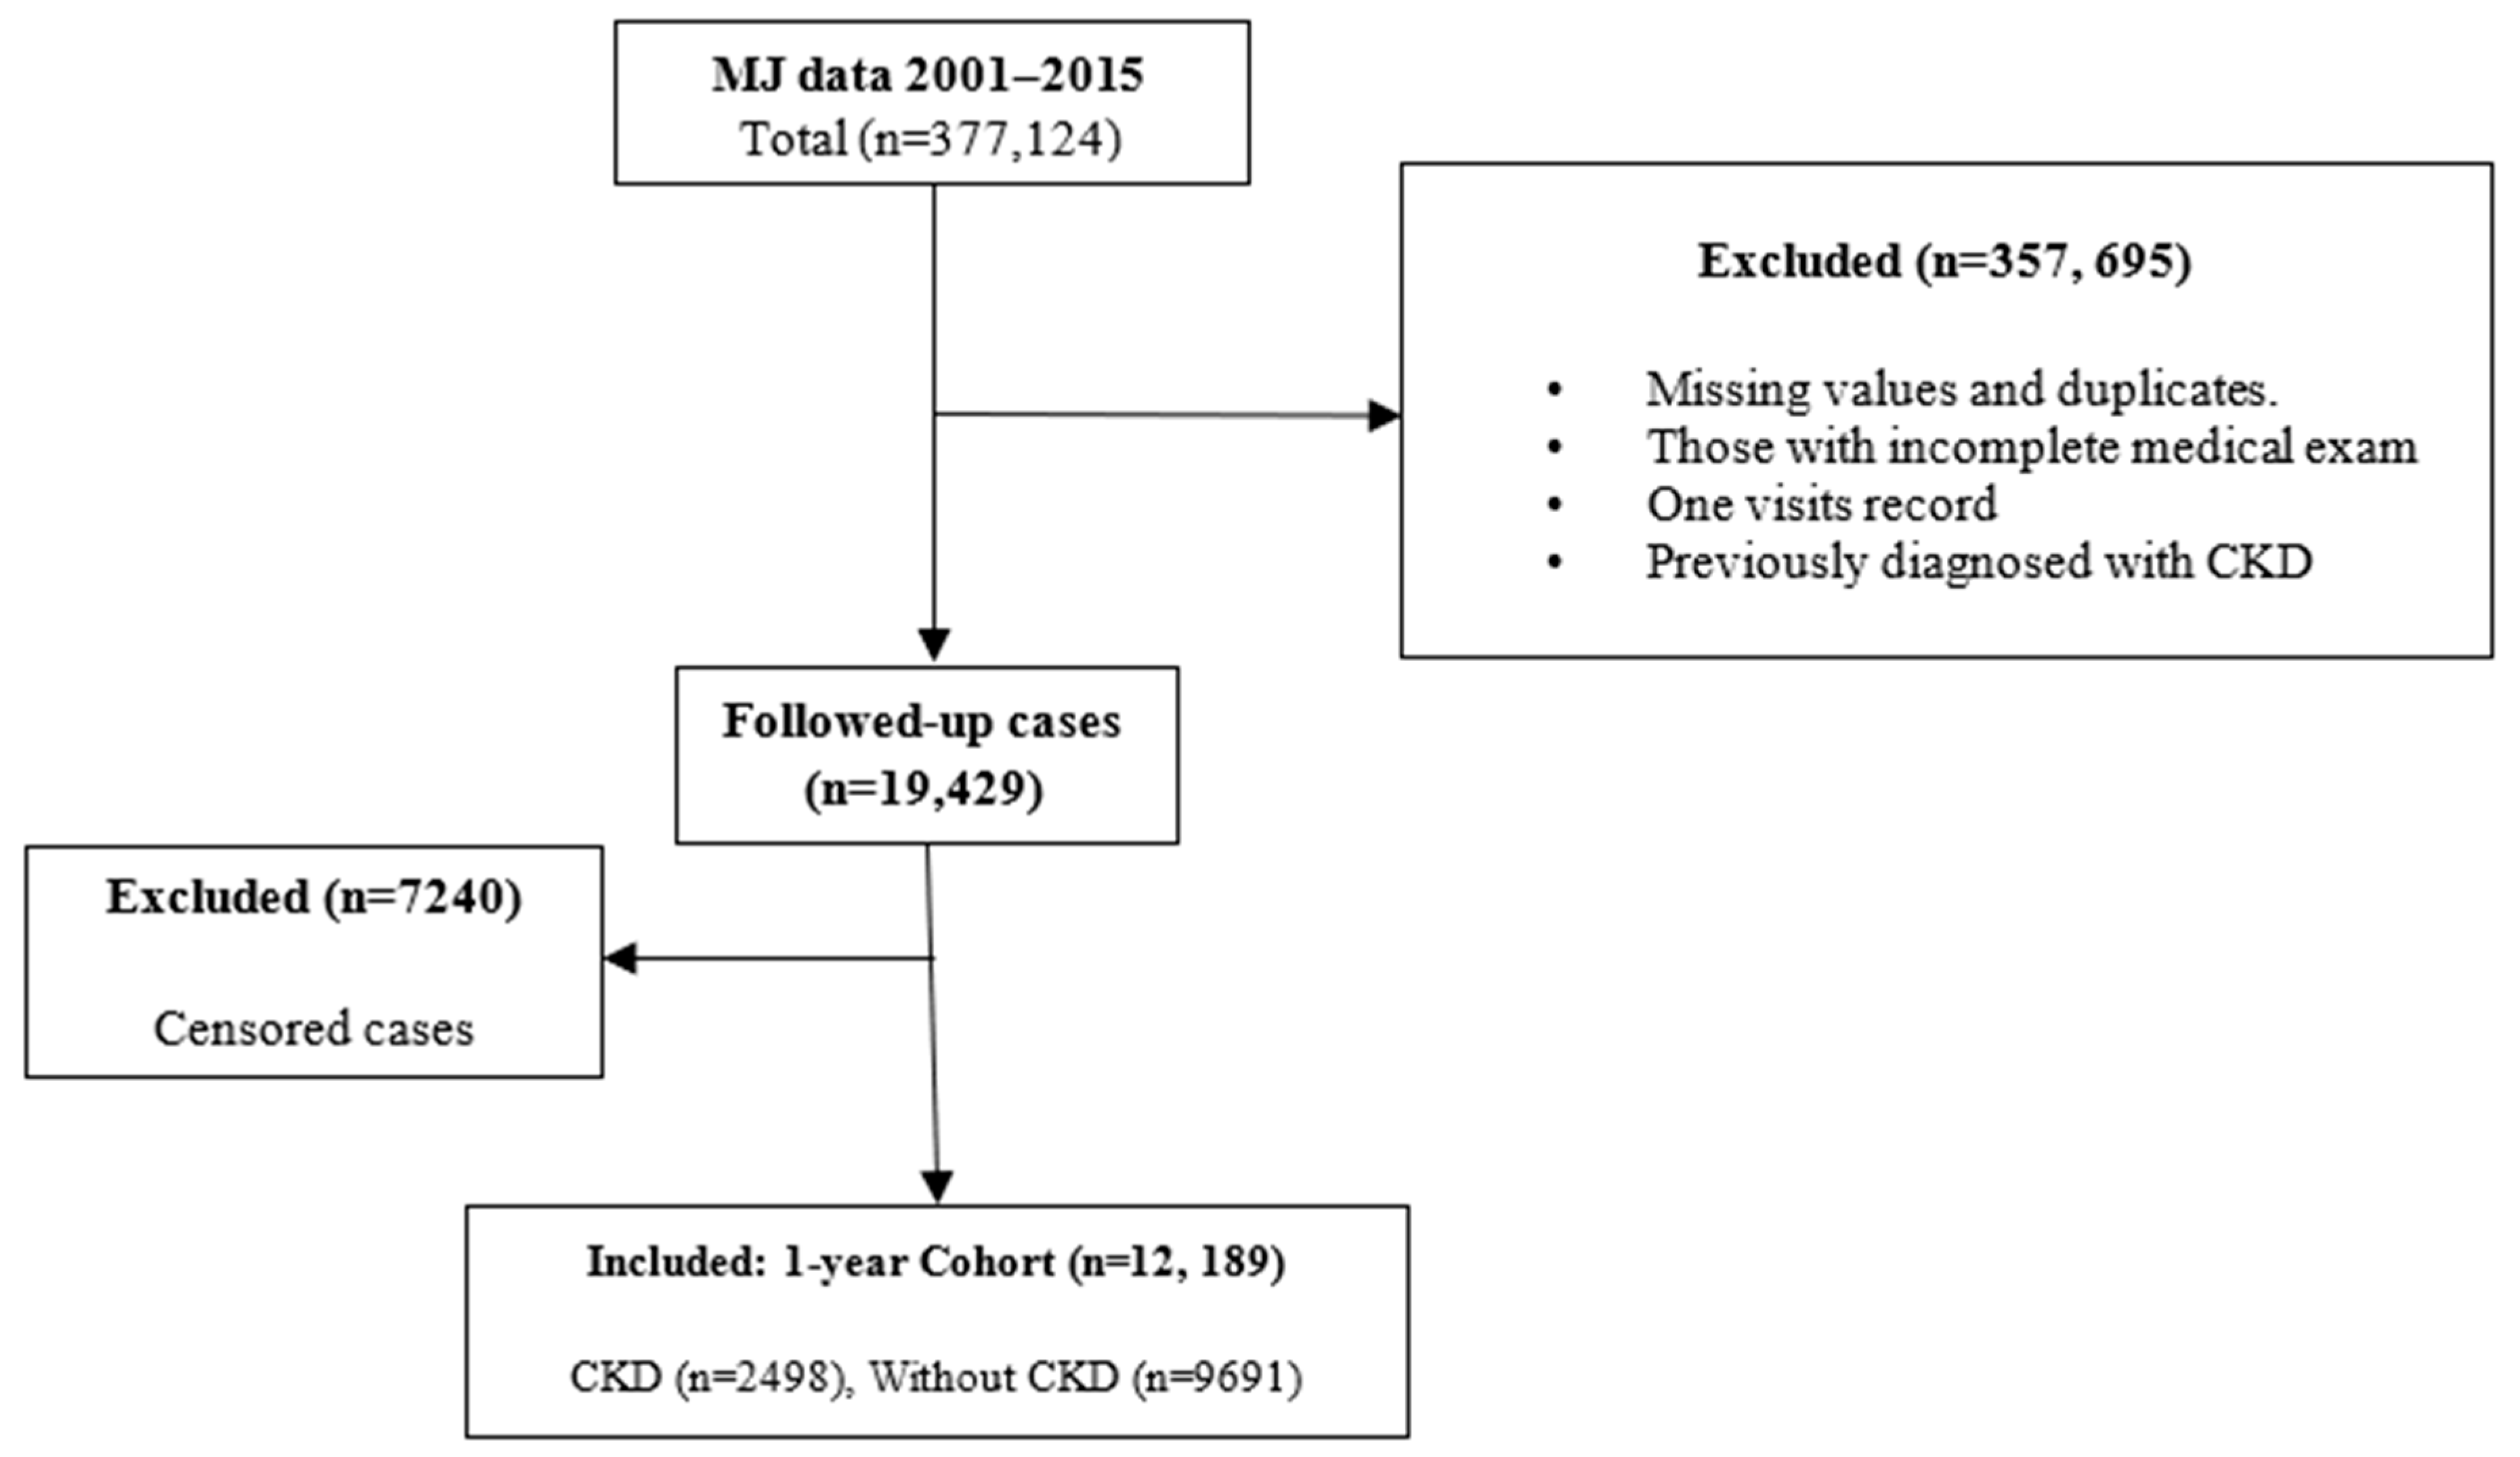
Figure 1. Flow chart of cohort study.
Applsci 12 12001 g001
Figure 2. The generalized framework for ML-based CKD risk prediction using the novel metabolic indices. RF: random forest; LG: logistic regression; XGB: Extreme Gradient Boosting; AUC: area under the curve.
Applsci 12 12001 g002
Figure 3. AUC–ROC and precision-recall curve of the machine learning models with different prediction groups without using creatinine. (A) subset A: Age + Gender + TyG-Index; (B) subset B: Age + Gender + TG/HDL-C ratio; (C) subset C: Age + Gender + VAI.
Applsci 12 12001 g003
Figure 4. Shows model comparison based on the subset C: age, gender, visceral adiposity index and creatinine; (A) Receiver operating characteristic (ROC) curve and Precision-recall curve of the models using subset C; (B) confusion matrix of XGBoost classifier using subset C.
Applsci 12 12001 g004
Table 1. Baseline characteristics.
VariableTotal (n = 12,189)NCKD (n = 9691)CKD (n = 2498)p-Value
Age (years)37 (31–43)36 (31–42)40 (34–48)<0.001
Sex
 Male8457 (69%)7740 (80%)717 (29%)<0.001
 Female3732 (31%)1951 (20%)1781 (71%)<0.001
Smoking status
 Not smoking9847 (84%)7648 (79%)2199 (88%)<0.001
 Smoking2342 (19%)2043 (21%)299 (12%)<0.001
Alcohol
 Not drinking 10,289 (84%)8035 (83%)2254 (90%)<0.001
 Drinking1900 (16%)1656 (17%)244 (10%)<0.001
Comorbidities
Hypertension157 (1.3%)55 (0.6%)102 (4.1%)<0.001
Diabetes51 (0.4%)21 (0.2%)30 (1.2%)<0.001
Physical examination
BMI (kg/m2)22.0 (20–24.5)21.7 (19.8–24.2)23.1 (21.0–25.4)<0.001
Body fat (%)27.1 (22.9–32.0)27.6 (23.5–32.4)24.9 (21.0–29.5)<0.001
Waist circumference (cm)72 (67–79)71 (66–77)77 (71–84)<0.001
Systolic BP (right arm, mmHg)113 (103–125)112 (102–124)117 (107–128)<0.001
Diastolic BP (right arm, mmHg)67 (60–75)67 (60–74)70 (64–77)<0.001
Blood lipids
Triglyceride (mmol/L)0.9 (0.7–1.3)0.9 (0.6–1.3)1.1 (0.8–1.5)<0.001
Cholesterol (mmol/L)4.9 (4.3–5.5)4.9 (4.3–5.5)5.0 (4.4–5.6)<0.001
HDL-cholesterol (mmol/L)1.5 (1.3–1.8)1.6 (1.3–1.8)1.4 (1.2–1.7)<0.001
LDL-cholesterol (mmol/L)2.8 (2.3–3.4)2.8 (2.3–3.3)3.0 (2.5–3.5)<0.001
Renal function
Blood urea nitrogen (BUN, mg/dL)12.4 (10.5–14.8)12.1 (10.2–14.4)13.4 (11.5–15.7)<0.001
Creatinine (mg/dL)0.8 (0.7–0.95)0.8 (0.7–0.89)1.08 (0.92–1.19)<0.001
eGFR (mL/min/1.73 m2)78.8 (63.1–94.4)84.9 (73.0–98.3)52.9 (47.2–56.8)<0.001
Metabolic indices
TyG-Index4.5 (4.3–4.7)4.5 (4.3–4.7)4.6 (4.4–4.8)<0.001
TG/HDL-C ratio1.3 (0.9–2.2)1.3 (0.9–2.0)1.7 (1.1–2.8)<0.001
VAI0.8 (0.5–1.3)0.7 (0.4–1.1)1.2 (0.8–2.0)<0.001
Data are represented as median (IQR, inter quartile range) for continuous variables, n (%) for categorical variables and p-value < 0.05 was considered significant. BMI, body mass index; Systolic BP, systolic blood pressure; Diastolic BP, diastolic blood pressure; HDL-cholesterol, high-density lipoprotein cholesterol; LDL-cholesterol, low-density lipoprotein cholesterol; eGFR, estimated glomerular filtration; TyG-Index, triglyceride glucose index; TG/HDL-C ratio, triglyceride to high-density lipoprotein cholesterol ratio; VAI, visceral adiposity index.
Table 2. Predictors of CKD in univariate Cox proportional hazard regression and ROC curve analysis.
VariableHR (95% CI)AUC (95% CI)p-Value
Non-laboratory examination
Age1.04 (1.032–1.038)0.633 (0.62–0.645)<0.001
Gender5.6 (5.208–6.083)0.756 (0.745–0.768)<0.001
BMI (kg/m2)1.07 (1.06–1.077)0.606 0.593–0.618)<0.001
Waist circumference (cm)1.05 (1.043–1.05)0.676 (0.663–0.687)<0.001
Laboratory examination
Triglyceride (mmol/L)1.3 (1.255–1.42)0.603 (0.59–0.615)<0.001
Cholesterol (mmol/L)1.1 (1.073–1.155)0.54 (0.527–0.553)<0.001
HDL-cholesterol (mmol/L)0.41 (0.366–0.455)0.377 (0.364–0.389)<0.001
LDL-cholesterol (mmol/L)1.23 (1.187–1.284)0.571 (0.558–0.583)<0.001
Blood urea nitrogen (BUN, mg/dL)1.06 (1.05–1.07)0.618 (0.605–0.629)<0.001
Creatinine1.7 (1.535–1.968)0.909 (0.903–0.915)<0.001
Metabolic indices
TyG-Index2.53 (2.269–2.816)0.605 (0.592–0.617)<0.001
TG/HDL-C ratio1.15 (1.121–1.186)0.625 (0.613–0.638)<0.001
VAI1.35 (1.291–1.407)0.716 (0.705–0.727)<0.001
BMI, body mass index; HDL-cholesterol, high-density lipoprotein cholesterol; LDL-cholesterol, low-density lipoprotein cholesterol; eGFR, estimated glomerular filtration; TyG-Index, triglyceride glucose index; TG/HDL-C ratio, triglyceride to high-density lipoprotein cholesterol ratio; VAI, visceral adiposity index.
Table 3. Best groups of predictors.
GroupPredictors
Subset AAge + Gender + TyG-Index
Subset BAge + Gender + TG/HDL-C ratio
Subset CAge + Gender + VAI
Table 4. Model performance comparison without creatinine.
Subset A: Age + Gender + TyG-Index
ModelAccuracyPrecisionRecall (Sensitivity)SpecificityF-ScoreAUC
TrainTest
Random forest0.780.770.800.730.820.760.86
Logistic regression0.760.750.760.740.770.750.83
XGB classifier0.840.820.830.810.840.820.90
Subset B: Age + Gender + TG/HDL-C ratio
ModelAccuracyPrecisionRecall (Sensitivity)SpecificityF-ScoreAUC
TrainTest
Random forest0.780.770.780.740.790.760.86
Logistic regression0.760.750.750.760.740.750.83
XGB classifier0.860.840.830.860.820.850.92
Subset C: Age + Gender + VAI
ModelAccuracyPrecisionRecall (Sensitivity)SpecificityF-ScoreAUC
TrainTest
Random forest0.790.790.790.800.780.790.87
Logistic regression0.760.760.760.760.760.760.84
XGB classifier0.860.860.850.870.850.860.93
Note: XGB classifier: Extreme Gradient Boosting.
Table 5. Model performance comparison with creatinine.
Subset A: Age + Gender + TyG-Index + Creatinine
ModelAccuracyPrecisionRecall (Sensitivity)SpecificityF-ScoreAUC
TrainTest
Random forest0.990.990.981.00.980.991.0
Logistic regression0.990.990.991.00.990.991.0
XGB classifier1.01.00.991.00.990.991.0
Subset B: Age + Gender + TG/HDL-C ratio + Creatinine
ModelAccuracyPrecisionRecall (Sensitivity)SpecificityF-ScoreAUC
TrainTest
Random forest0.990.990.980.990.980.991.0
Logistic regression0.990.990.980.990.980.991.0
XGB classifier0.990.990.990.990.990.991.0
Subset C: Age + Gender + VAI + Creatinine
ModelAccuracyPrecisionRecall (Sensitivity)SpecificityF-ScoreAUC
TrainTest
Random forest0.990.990.981.00.980.991.0
Logistic regression0.990.990.980.990.980.991.0
XGB classifier1.00.990.991.00.990.991.0
Note: XGB classifier: Extreme Gradient Boosting.
Publisher’s Note: MDPI stays neutral with regard to jurisdictional claims in published maps and institutional affiliations.