Abstract
The stress–strain characteristics of compressed sandstone are affected by many different factors. The study on the evolution law of the strain field of compressed sandstone is of great significance for disaster prediction and warning during the construction process of geotechnical engineering. In this paper, uniaxial compression tests of red sandstone of 100 mm height and 50 mm length and width were carried out under the conditions of (1) different loading rates, (2) different particle sizes and (3) different inclination angles of prefabricated fractures. Stress–strain curves corresponding to different conditions were presented, the evolution of strain field on the sample surfaces was analyzed with the help of Digital Image Correlation technology and the relationship between the stress–strain curves and the strain field was preliminarily given. This study may be helpful for obtaining a deeper understanding of the deformation and failure mechanism of sandstone under uniaxial compression.
1. Introduction
In the development of deep underground space and deep resources, sandstone is a non-negligible factor. Different from shallow mineral resources, the geological environment of deep underground resources has changed greatly. The mining of deep mineral resources and the construction of deep underground engineering make the factors of deformation and failure of deep sandstone more complex. This brings great challenges to the stability analysis of surrounding rock, so the deformation and failure characteristics of deep sandstone, its instability and its failure mechanism have become urgent problems to be solved, requiring in-depth studies [1].
During underground excavation, the mechanical properties of sandstone change with the change in loading rate [2,3,4], which is known as the loading rate effect of rock. In deep underground engineering, high-intensity excavation leads to the loading rate effect of surrounding rock, which easily causes engineering disasters such as rock burst and roof fracture, which bring serious threats to the construction safety and personal safety of deep underground engineering. The study on the evolution law of the sandstone strain field under different loading rates has important reference significance for disaster warning during geotechnical engineering construction. Zhao et al. [5] carried out compression tests on marble spheres under different impact rates by using the Hopkinson pressure bar, and discussed that the peak bearing capacity and crushing degree of the rock layers are affected by the impact rate. Zhou et al. [6] investigated the effect of the loading rate on the crack growth rate and initiation toughness of rock by conducting a drop weight impact test, and analyzed the effect of the loading rate on crack growth by finite difference software. Cao et al. [7] used an acoustic emission system to carry out uniaxial compression tests on sandstone samples at different rates. The results showed that with the increase in loading rate, the acoustic characteristics, such as hit, counting and events of acoustic emission, decreased significantly, and the acoustic emission energy increased significantly.
The different rock mechanical properties of sandstone are mainly due to the differences in rock formation mechanisms and the influence of the external environment, while the essential reasons for the differences in the internal structure of sandstone depend on the meso-structure and mineral composition of the sandstone [8]. Sandstone is an anisotropic complex formed by the cementation of mineral particles of different particle sizes, and the properties of the internal mineral particles will have an impact on the mechanical properties of rock. Mats Lindqvist et al. [9] used 0.725~2.03 mm silica sand to study the effect of particle size on the wear rate in the process of rock crushing. The results showed that the wear rate increases with the increase in particle size. Wang et al. [10] carried out many impact tests on calcareous sand under different impact test times, and analyzed it by using Digital Image Correlation technology. The results show that with the increase in the number of impact tests, the crushing degree of calcareous sand with a size of 2~5 mm is the highest. Li et al. [11] carried out compression tests on macadam with different particle size distributions, and studied the influence of different particle size distributions on the fractal characteristics of waste rock filling materials under compression. The results showed that the specimen with more coarse particles has higher stress in the stable deformation stage and higher strain at the same stress level.
At the same time, there are many micro-cracks in natural sandstone. Under the action of external load, the cracks in the rock undergo a series of development, such as closure, expansion and penetration, resulting in rock deformation and instability. The distribution and stress state of cracks in the rock will have a great influence on the mechanical behavior of rocks [12]. As early as the 1960s, domestic and foreign scholars began to study the failure mechanism of fractured rock mass under compression or tension conditions. Brace [13] and Hoek [14] et al. carried out uniaxial and biaxial compression tests on brittle rocks with single fractures, respectively, and analyzed the mechanism of crack propagation in brittle rocks. Lajtai [15,16] selected gypsum materials to make rock-like specimens, and conducted uniaxial compression tests on rocks containing single fractures. It was found that under compression conditions, cracks in the gypsum were mainly wing cracks and secondary cracks. According to Bertram’s research [17], crack propagation in rocks can be divided into three stages, namely, crack-free propagation, stable propagation and unstable propagation in the initial stage. Lin Peng et al. [18] prefabricated cracks with different dip angles in granite and carried out uniaxial compression tests on granite with different prefabricated fracture angles. Combined with the numerical simulation method, it was concluded that the crack dip angle has an effect on crack propagation and development.
In most cases, the deformation and failure in the rock is caused by the development of deformation localization in the rock system [19,20]. Analyzing the deformation and failure processes of rock through the development of deformation localization has become one of the most important methods to study rock mechanics. At present, scholars at home and abroad mostly use optical systems to observe the development of rock deformation localization and the rock failure process. Currently, the main optical systems used to measure stress–strain and displacement are three-dimensional laser Doppler vibration measurement (3D LDV) and Digital Image Correlation technology (DIC). Of these, the 3D laser vibration measurement system is the most advanced sensor; it has the advantage of a wide range of application scenarios and low requirements for the use environment, but because of its high cost, it is especially applied to the inspection of products of the automobile industry and aerospace industry, as well as light and ultra-light structures [21,22]. Digital Image Correlation technology (DIC) [23] is a non-contact full-field non-destructive optical measurement method, which combines a vision system and Digital Image Correlation technology (DIC) to realize displacement and strain measurement in a three-dimensional space. Through calculation, parameters such as displacement and strain of the calculated point on the surface of the specimen can be obtained. In the process of measurement, there is no need to install any sensor equipment, thus avoiding the human error of the traditional method [24,25,26]. Because of its performance to price ratio and wide range of application promotion, it is used by some researchers as a research approach. So far, DIC has been successfully suitable for the analysis of deformation behavior of rocks due to its robustness and utility in characterizing and detecting different types of fractures and failures in rocks. At present, some scholars have used this technology to study the deformation characteristics of rocks. Sharafisafa et al. [27] carried out compression tests on three-dimensional printed Brazilian disk specimens with single and double defects under quasi-static load by using Digital Image Correlation technology (DIC). They studied the bearing capacity, crack initiation, propagation and bonding mechanism of prefabricated cracked rock specimens, and systematically studied the aggregation behavior of double defect specimens. Zhao et al. [28] carried out uniaxial compression tests of rock-like materials with prefabricated single cracks by using the Digital Image Correlation method, and studied their deformation and failure characteristics from three aspects: meso-quantitative analysis, crack propagation law and deformation damage evolution. Wang et al. [29] measured the basic particle size parameters by digital image processing, established the particle shape parameters and analyzed the variation of shape parameters with particle size, distribution characteristics and sensitivity of shape parameters, by means of mathematical statistics and fractal theory.
To summarize, predecessors have studied the rock loading rate, rock particle size and crack angle, but generally, only one factor of rock mechanical properties has been studied. In this study, based on digital image processing technology under the condition of uniaxial compression, red sandstone samples mined in the same mining area were loaded with different loading rates, different particle sizes and different prefabricated crack angles, and then systematically analyzed. The factors affecting rock stability are studied, and the deformation and failure mechanism of sandstone is revealed.
2. Materials and Methods
2.1. Sample Preparation
The sandstone samples used in this paper were taken from the working face of the West No. 3 Mining area of the Hongyang No. 3 Mine, Sujiatun District, Shenyang, Liaoning Province. The rock mass was taken out, then transported back to the laboratory for processing and processed into standard cuboid samples, according to international rock mechanics test standards [30] and the “Methods for Determination of Physical and Mechanical Properties of Coal and Rock” [31]. The six end faces of the sample were polished in order to eliminate the samples with rough, uneven surfaces or obvious defects in appearance, so as to ensure that the diameter error of the sample used for the test was within 0.3 mm, the height error was within 0.05 mm and the maximum error of the axis was within 0.25°. The processed sandstone sample is shown in Figure 1a.
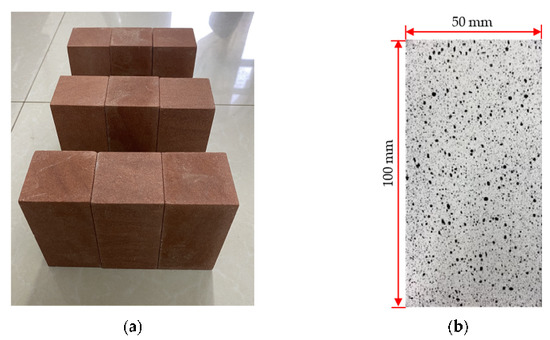
Figure 1.
Uniaxial-DIC test specimen: (a) red sandstone sample; (b) artificial speckle.
2.2. Test Equipment
The layout of the test system is shown in Figure 2, which consists of the test loading system and the data image acquisition system. The TAW-2000 (Chang Chun City Chao Yang Test Instrument Co., Ltd., Changchun, China) electro-hydraulic servo rock test system of the College of Civil Engineering of Liaoning Technical University can complete rock tests such as the uniaxial compression test, triaxial compression test, cyclic loading test and seepage test. It is an advanced rock test system both at home and abroad, which can automatically collect the stress–strain data of sandstone over the whole process of the uniaxial compression test. The stiffness of the testing machine reaches 1600 KN, the maximum confining pressure that can be applied is 70 MPa and the measuring range of displacement is ±4 mm, which can fully meet the requirements of this test. The SMT DIC-3D (Beijing SMAT Technology Co., Ltd., Beijing, China) full-field strain measurement and analysis system is composed of the surface speckle image acquisition system (CCD camera) and the related calculation program. The strain measurement range of the system is 0.01~1500%, and the strain measurement accuracy is ≤20 με. The image acquisition rate is 2 frames/s, and the image resolution is 1920 pixels × 1280 pixels. During the test, the CCD camera was adjusted so that the camera lens was parallel to the surface of the specimen, and the camera lens was 0.8 m away from the observation surface of the specimen. The time of the rock loading testing machine was strictly consistent with the time of CCD camera data acquisition.
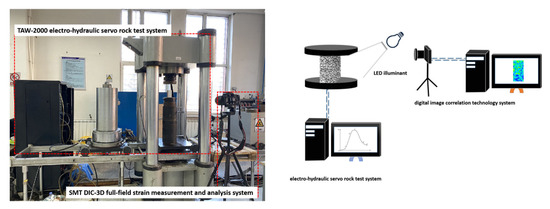
Figure 2.
Schematic diagram of the test system.
2.3. Test Method and Scheme
Artificial speckle was formed on the surface of the sandstone specimen by means of spray painting, and the speckle production process is as followed. The white matte paint was sprayed onto the surface of the sandstone specimen as the background color, and then the black matte paint was sprayed onto the white background in order to form artificial speckles, which were randomly distributed to meet the requirement that the size of a single speckle was more than three pixels. The ratio of speckle area to background color area on the surface of the specimen was close to 1:1, as shown in Figure 1b. An image acquisition system was used to capture the speckle changes before and after loading. During the test, image information acquisition of the testing machine compression and of the Digital Image Correlation technology (DIC) system was carried out simultaneously. When the loading reached a certain pressure, the loading and image acquisition were stopped at the same time when the specimen showed obvious macroscopic damage. The deformation field on the surface of the sandstone specimen was obtained by selecting appropriate surface plates for image processing and analysis. The loading was controlled by displacement, and a white light source was arranged to illuminate the surface of the sandstone specimen.
2.3.1. Explanation on the Test of Different Loading Rate
Rock has the characteristics of discontinuity and heterogeneity, which leads to the difference in rock strength under the same loading rate. In this paper, according to the previous research, the loading rates were selected [32,33] as 0.02 mm/min, 0.1 mm/min and 0.5 mm/min, respectively, and three groups of tests were carried out at each loading rate. Through the uniaxial compression test of sandstone under different loading rates, the strain field of sandstone specimens was analyzed combined with the digital speckle correlation method, so as to study the corresponding relationship between the loading rate, sandstone strain localization and sandstone characteristic parameters.
2.3.2. Explanation on the Test with Different Grain Sizes
The sandstone used in this study can be divided into fine sandstone, medium sandstone and coarse sandstone according to particle size. Their corresponding particle size were 0.05–0.25 mm, 0.25–0.5 mm and 0.5–2 mm, respectively. Through density measurement, it was found that the sandstones with different particle sizes used in this paper had similar densities, and their average values were 2.49 g/cm3, 2.16 g/cm3 and 1.85 g/cm3, respectively.
2.3.3. Explanation on the Test with Different Prefabricated Cracks
The mechanical properties of red sandstone with four different prefabricated crack inclination under uniaxial compression are studied in this paper. The high pressure water jet method was used to prefabricate the crack. The diameter of the water jet was 1.5 mm, and the width of the prefabricated crack was approximately 1.5~2 mm. The prefabricated crack ran along the width (thickness) of the specimen. The cracks were distributed in the center of the specimen, as shown in Figure 3. The geometric parameters of the prefabricated fractures included fracture length and inclination angle, which is defined as the angle between fracture strike and horizontal direction. This paper studied the influence of different crack dips on the mechanical properties of red sandstone under uniaxial compression. Therefore, the length of the crack was set as 12 mm, and the four dip levels were set as 0°, 30°, 60° and 90°, respectively. Three groups of tests were designed for each level.
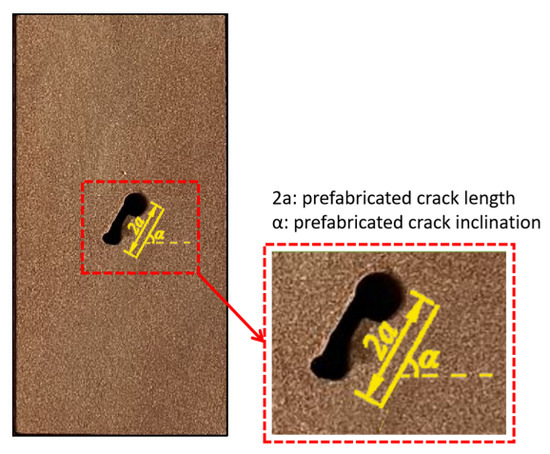
Figure 3.
Schematic diagram of prefabricated crack sandstone sample.
The specific test scheme is shown in Table 1.

Table 1.
Uniaxial-DIC test scheme for different loading rates, particle sizes and precast fissure inclination.
3. Test Results and Analysis
3.1. Evolution of Strain Field of Sandstone under Different Loading Rates
Figure 4 shows the stress–strain curves of red sandstone under three loading rates, and Table 2 shows the uniaxial compression test results of red sandstone under three loading rates. It can be found from the stress–strain curve and the test results that the peak strength and elastic modulus of sandstone increased with the increase in loading rate. In addition, with the increase in loading rate, less time is required for the sandstone specimen to be damaged. This is due to the fact that when the loading rate is high, the initial crack in the sandstone does not have time to fully expand and develop, which leads to the enhancement of rock resistance to external force and deformation. Its engineering significance is that properly increasing the excavation speed is beneficial for maintaining the strength of surrounding rock and reducing the difficulty of support when excavation is carried out in rock mass.
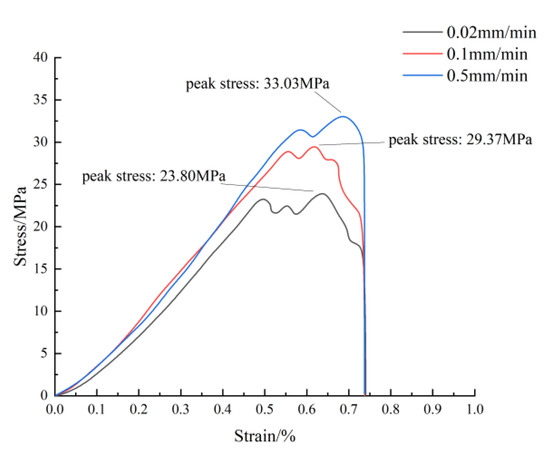
Figure 4.
Load curve at different loading rates.
Table 2.
Results of uniaxial compression tests at different loading rates.
Figure 5a shows the cloud diagram of strain field evolution at different times during the uniaxial loading process of sandstone, with a loading rate of 0.02 mm/min. Under the loading rate, the deformation localization zone of the rock begins to grow and develop from the right side of the bottom of the specimen, and gradually forms a macroscopic crack whose direction is approximately parallel to the axial direction of the specimen. This crack eventually runs through the whole specimen, leading to its overall failure. Figure 5b shows the cloud diagram of strain field evolution at different times during the uniaxial loading process of sandstone, at a loading rate of 0.1 mm/min. Under the loading rate, the deformation localization zone of rock begins to grow and develop from the left side of the top of the specimen, and macroscopic cracks appear. These cracks eventually run through the whole specimen, resulting in its overall failure. Figure 5c shows the cloud diagram of strain field evolution at different times during the uniaxial loading process of sandstone, at a loading rate of 0.5 mm/min. Under the loading conditions of this loading rate, the deformation localization zone of rock begins to grow and develop from the left side of the bottom of the specimen, and several small cracks grow near the main crack. The development, expansion and intersection of small cracks lead to the final macroscopic failure of the rock.
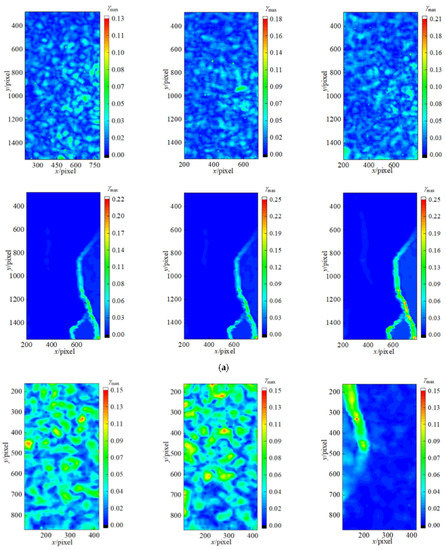
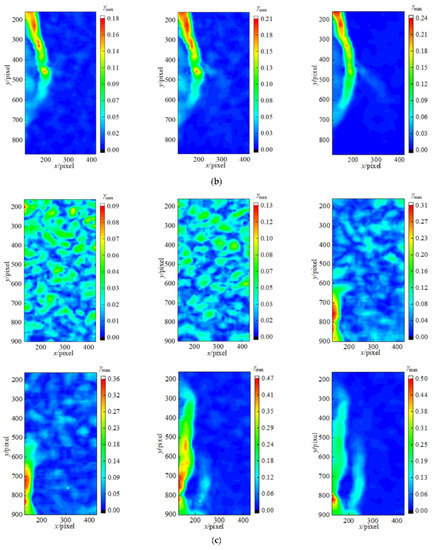
Figure 5.
Evolution cloud map of the strain field under different loading rates: (a) 0.02 mm/min; (b) 0.1 mm/min; (c) 0.5 mm/min.
By comparing the evolution cloud diagram of the sandstone strain field and the macroscopic deformation process of rock under the three loading rates, it can be seen that the failure range increases with the loading rate until the final failure of the specimen. With the increase in loading rate, the failure mode also changes from shear failure to splitting failure, and the failure degree of rock specimens shows an increasing trend.
3.2. Strain Field Evolution of Sandstone with Different Grain Sizes
As can be seen from Figure 6, sandstones with different grain sizes exhibit different characteristics in each stage of the stress–strain curve. Compared with fine sandstone, coarse sandstone has a larger particle size, which leads to more voids in coarse sandstone and a lower degree of cementation between rock particles. When entering the elastic stage, the elastic deformation stage of coarse sandstone is the shortest of the three kinds of rock size, and its elastic modulus is also the lowest. Fine sandstone has a compact structure, low deformation characteristics, high strength and a stronger ability to resist elastic deformation. When entering the plastic deformation stage, due to the dense internal structure and good integrity of fine sandstone, the stress–strain curve reaches its peak strength in the form of an approximate straight line, while the coarse sandstone grows in the form of a smooth curve before reaching its peak strength. After reaching peak strength and entering the failure stage, the macroscopic failure of sandstone of any particle size will occur in a very short time. The strain value of coarse sandstone is larger than that of the other two types. That is to say, under the action of external load, coarse sandstone has higher deformation characteristics than fine sandstone, resulting in greater strain.
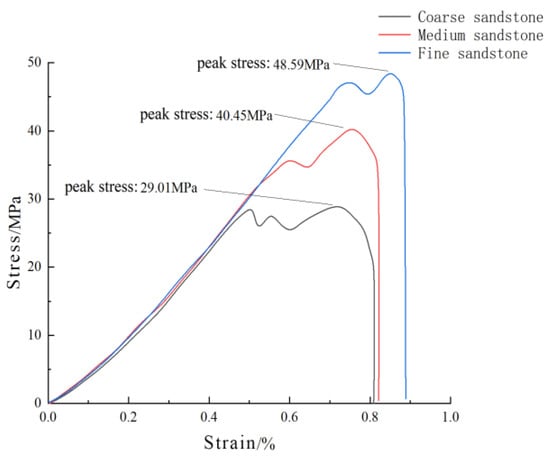
Figure 6.
Load curve of sandstone of different particle sizes.
Table 3 shows the comparison of mechanical properties of red sandstone of three kinds of grain size. It can be found that the uniaxial compressive strength of fine-grained sandstone is 1.67 times the uniaxial compressive strength of coarse-grained sandstone, the elastic modulus of fine-grained sandstone is 1.16 times the elastic modulus of coarse-grained sandstone and the density of fine-grained sandstone is 1.35 times the density of coarse-grained sandstone. Fine-grained sandstone has a smaller particle size, tighter internal structure, better compactness and stronger cementation between particles, so it shows stronger mechanical properties on the macro level.
Table 3.
Comparison of the mechanical properties of red sandstone with different particle size.
Figure 7 shows the evolution cloud diagram of the strain field of red sandstone with different grain sizes under uniaxial compression. For sandstone with a fine particle size, the crack on the surface of the specimen starts from the upper left, approximately parallel to the axial direction, and expands downward with continuous loading. At the same time, secondary cracks start from the end of the main crack. When they extend to the center of the axial direction, an obvious through-crack quickly occurs along the diagonal direction of the specimen surface, which leads to the failure of the specimen. The energy release is completed instantaneously, accompanied by a large noise and a splash of rock. With the increase in sandstone particle size, the failure process of medium and coarse grain size sandstones remains similar. Similarly to fine-grain sandstone, cracks in medium-grain rock samples start from the upper left, forming a strain localization area which is approximately parallel to the axial direction, but different from fine-grain sandstone. The crack growth rate is also slower.
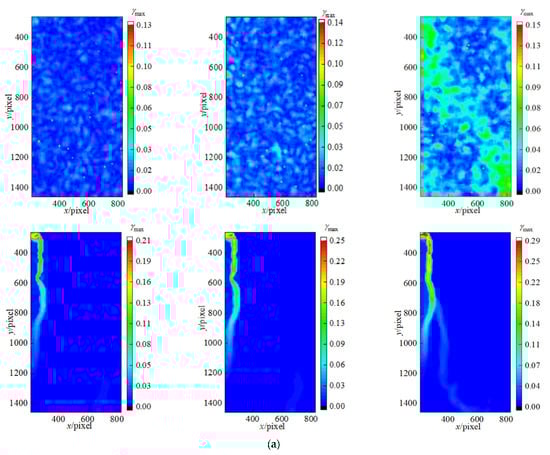
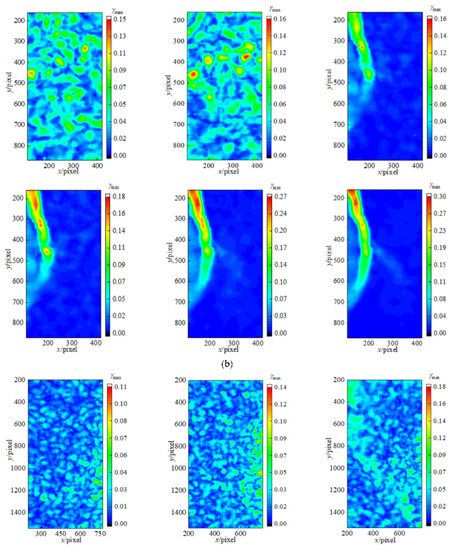
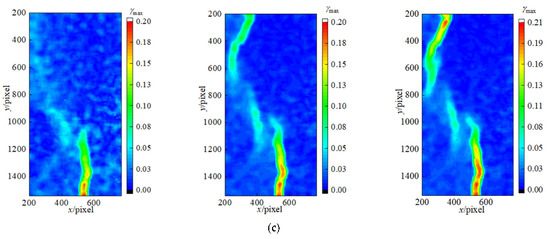
Figure 7.
Evolution cloud map of the strain field of sandstone with different grain sizes: (a) fine particle size; (b) medium particle size; (c) coarse particle size.
The single crack continued to expand downward along the axial direction of the specimen, and the strain localization region gradually expanded. With the increase in axial load, new cracks began to sprout on the right side of the original crack, and the direction was approximately parallel to the axial direction of the specimen. With the further increase in the axial load, the new cracks emerged in the bottom left of the specimens along the diagonal direction. Gradually, with the axis parallel to the direction of crack propagation, the width of the crack increased from the top to the bottom in the direction of crack extension. In the end, this caused macro damage to the sample, but the damage did not produce significant noise. Compared with fine-grain-size sandstone and medium-grain-size sandstone, the failure process of coarse-grain-size sandstone took less time, and the crack was firstly initiated at the lower right. The single crack was approximately parallel to the axial direction of the specimen, and the propagation speed was uniform and slow. With the increase in axial load, the single crack expanded upward along the axial direction, and a new crack was initiated at the upper left end of the specimen. The crack propagation direction was also approximately parallel to the axial direction of the specimen. With the increase in load, the crack expanded further, and the crack width increased further, which eventually led to the failure of the rock samples. Compared with the final failure forms of sandstone with different particle sizes, the integrity of fine sandstone was poor after failure, and more fragments were generated, while the failure degree of coarse sandstones was small.
3.3. Strain Field Evolution of Sandstone with Different Prefabricated Fractures
Figure 8 shows the corresponding relationship between the failure process and the stress–strain curve of red sandstone specimens with prefabricated cracks of different inclination angles under uniaxial compression. It can be seen from the failure process diagram that when the angle of the prefabricated fracture is 0°, the angle between the airfoil crack that starts at the tip of the prefabricated fracture and the prefabricated fracture is obtuse. With the increase in the inclination angle of the prefabricated fracture, the angle between the anti-wing crack and the prefabricated fracture gradually decreased. When the angle of the prefabricated fracture was 30°, the angle was approximately 90°. When the angle of the prefabricated fracture was 60° or 90°, the angle decreased to an acute angle. In other words, as the inclination angle of the prefabricated crack increased from 0° to 90°, the main crack formed in sandstone under compression expanded along the tip of the prefabricated crack in an anti-wing manner, so that the two were parallel to each other. Meanwhile, the angle between the main crack and the prefabricated crack evolved from an obtuse angle to a right angle, and finally formed an acute angle. With the increase in stress, the crack gradually expanded and grew from the tip of the prefabricated crack until the rock finally failed.
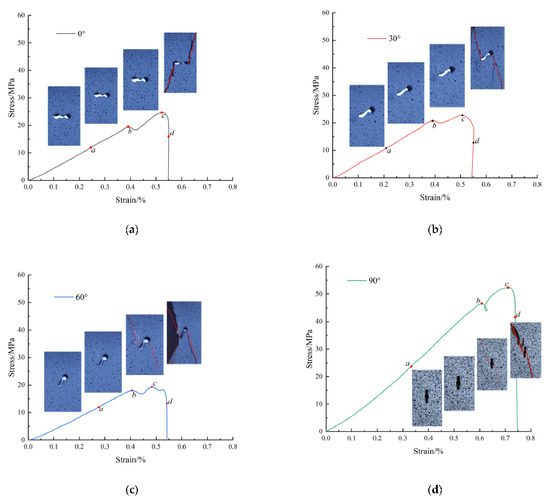
Figure 8.
Load curve of sandstone with different crack inclinations: (a) 0°; (b) 30°; (c) 60°; (d) 90°.
At the early stage of loading, as shown in Figure 9, the strain field changed around the prefabricated crack, and the maximum strain was located at the two tips of the prefabricated crack. However, there is no obvious new crack on the surface of the specimen at this time, indicating that the original defects inside the rock at this stage have little influence on the distribution trend of the stress–strain curve of the rock.
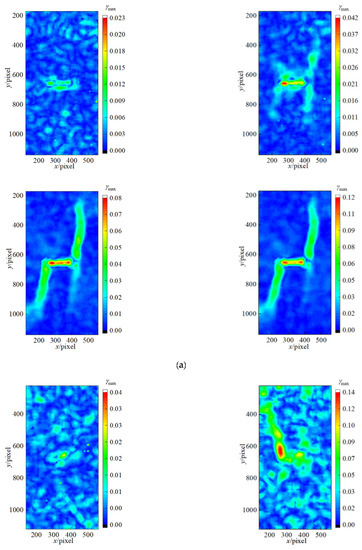
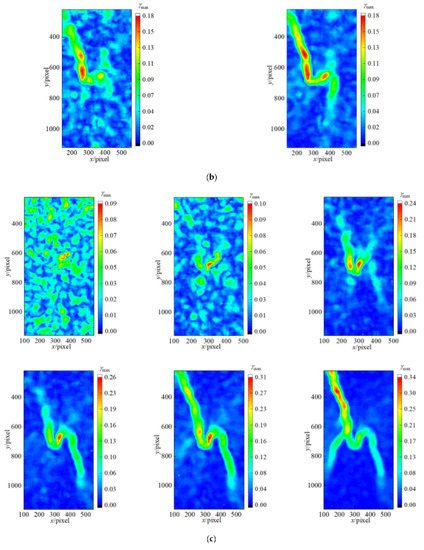
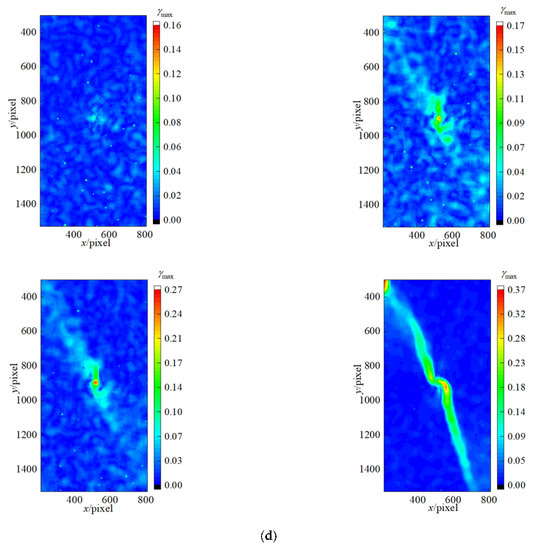
Figure 9.
Evolution cloud map of strain field of sandstone with different inclination cracks: (a) crack inclination of 0°; (b) crack inclination of 30°; (c) crack inclination of 60°; (d) crack inclination of 90°.
As the load continued to increase, obvious strain localization zones appeared inside the sandstone. The position of maximum strain shifted from the periphery of the prefabricated fracture to the two tips of the prefabricated fracture, and two strain localization zones, extending to the upper and lower faces, were formed along the prefabricated fracture tips. At this time, the expansion speed of the strain localization zone gradually accelerated and entered the unsteady development stage. With the continuous increase in load, the width of the strain localization zone increased, indicating that the crack was expanding slowly at this time.
Combined with the actual deformation and failure map of the rock and DIC strain cloud map, it can be found that when the rock was subjected to compressive stress, the crack began to expand from the end of the prefabricated crack, and the strain localization zone also began to develop from the end of the crack. In other words, under compressive stress, the stress was more concentrated at the end of the prefabricated crack.
According to the DIC test, the displacement vector diagram of the peak stress state, when the inclination angle of the prefabricated crack is 90°, was drawn, as shown in Figure 10. The red strip area in the figure represents a prefabricated crack, and the dotted line extending from both ends of the crack to the end face indicates the propagation path of the crack in the rock under pressure. The large blue arrows represent the approximate stress direction of the cracks in the rock, and the small arrows throughout the whole specimen represent the displacement vector field inside the rock. Through the appearance of the displacement field, we can judge the mechanical properties of the crack; that is, we can judge whether the force of the internal crack is compressive stress or tensile stress when the rock is under pressure. When the rock was subjected to compressive load, the compressive stress began to transfer from the end face of the rock specimen to the interior of the rock. Near the end of the crack in the rock, the crack tip was affected by tensile stress. Under the action of tensile stress, the crack began to sprout and propagate along the reverse wing direction of the prefabricated crack, extending to the upper and lower ends of the specimen, until macroscopic failure occurred. This confirms that there is still a phenomenon of tensile failure near the crack tip when the rock is under pressure, and the closer to the crack tip, the more obvious the tension on both sides of the crack.
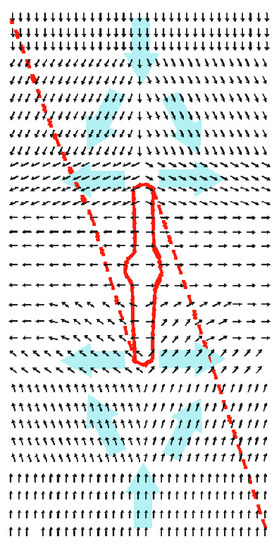
Figure 10.
Displacement vector field (crack inclination of 90°).
4. Conclusions
With the help of DIC technology and based on a uniaxial test, and by taking loading rate, particle size and prefabricated fracture angle as variables, this paper carried out a study on the mechanical properties and strain field evolution laws of sandstone under uniaxial compression, which revealed the deformation and failure mechanism of sandstone. The main conclusions are as follows:
- (1)
- With the increase in loading rate, the time for the growth of cracks inside the sandstone is no longer enough; thus, the peak strength and elastic modulus of the rock under uniaxial compression will gradually increase.
- (2)
- The increase in grain size will result in the decrease of homogeneity and uniformity of sandstone, which will further lead to the decrease in its peak strength, elastic modulus and density. Under the same stress conditions, fine-grained sandstone, compared with coarse-grained sandstone, will undergo a longer elastic deformation stage.
- (3)
- Although sandstone with prefabricated fracture subjected to uniaxial compression will undergo shear failure, tensile strain can also be observed near the crack tip. This means, essentially, that the failure of rock is tensile, and that shear is caused by the displacement of the tensile failure parts of the rock.
Author Contributions
Conceptualization, C.X. and Y.Y.; methodology, C.X. and M.Y.; validation, Y.S.; formal analysis, C.X.; data curation, P.L.; software, H.S.; writing—original draft preparation, C.X.; writing—review and editing, C.X. All authors have read and agreed to the published version of the manuscript.
Funding
This research was funded by the National Natural Science Foundation of China, grant number 51774167, and also by Provincial Natural Science Research Project of Colleges and Universities of Anhui Province, grant number KJ2019A0741.
Institutional Review Board Statement
Not applicable.
Informed Consent Statement
Not applicable.
Data Availability Statement
Not applicable.
Conflicts of Interest
The authors declare no conflict of interest.
References
- Li, P. Study on Failure Mechanism and Stabilily Control of Surrounding Rock of Underground Openings in Jointed Rockmass under Static and Dynamic Loading. Ph.D. Thesis, Univercity of Science and Technology Beijing, Beijing, China, 2020. [Google Scholar]
- Pandouria, A.K.; Kumar, S.; Tiwari, V. Experimental study of dynamic fracture behavior of Al7075-T651 under different loading rates. Mater. Today Commun. 2022, 33, 104529. [Google Scholar] [CrossRef]
- Khan, N.M.; Ma, L.; Cao, K.; Spearing, A.J.S.; Liu, W.; Jie, Y.; Yousaf, M. Early Violent Failure Precursor Prediction Based on Infrared Radiation Characteristics for Coal Specimens under Different Loading Rates. Rock Mech. Rock Eng. 2022, 55, 6939–6961. [Google Scholar] [CrossRef]
- Wang, J.B.; Zhang, Q.; Song, Z.P.; Zhang, Y.W.; Liu, X.R. Mechanical properties and damage constitutive model for uniaxial compression of salt rock at different loading rates. Int. J. Damage Mech. 2021, 30, 739–763. [Google Scholar] [CrossRef]
- Zhao, R.; Tao, M.; Wu, C.; Li, X.; Wang, S. Study on size and load rate effect of dynamic fragmentation and mechanical properties of marble sphere. Eng. Fail. Anal. 2022, 142, 106814. [Google Scholar]
- Zhou, L.; Zhu, Z.; Qiu, H.; Zhang, X.; Lang, L. Study of the effect of loading rates on crack propagation velocity and rock fracture toughness using cracked tunnel specimens. Int. J. Rock Mech. Min. Sci. 2018, 112, 25–34. [Google Scholar] [CrossRef]
- Cao, A.; Jing, G.; Ding, Y.L.; Liu, S. Mining-induced static and dynamic loading rate effect on rock damage and acoustic emission characteristic under uniaxial compression. Saf. Sci. 2019, 116, 86–96. [Google Scholar] [CrossRef]
- Potyondy, D.O.; Cundall, P.A. A bonded-particle model for rock. Int. J. Rock Mech. Min. Sci. 2004, 41, 1329–1364. [Google Scholar] [CrossRef]
- Lindqvist, M.; Evertsson, M.; Chenje, T.; Radziszewski, P. Influence of particle size on wear rate in compressive crushing. Miner. Eng. 2006, 19, 1328–1335. [Google Scholar] [CrossRef]
- Wang, X.; Wang, Y.; Liao, C.; Cui, J.; Shen, J.H.; Wang, X.Z.; Zhu, C.Q. Particle breakage mechanism and particle shape evolution of calcareous sand under impact loading. Bull. Eng. Geol. Environ. 2022, 81, 372. [Google Scholar] [CrossRef]
- Li, M.; Zhang, J.; Guo, Y.; Pu, H.; Peng, Y. Influence of particle size distribution on fractal characteristics of waste rock backfill materials under compression. J. Mater. Res. Technol. 2022, 20, 2977–2989. [Google Scholar] [CrossRef]
- Liu, X. Study on the Mechanical Behavior and Failure Mechanism of Fissured Rock under Triaxial Compression. Ph.D. Thesis, China University of Mining and Technology, Xuzhou, China, 2020. [Google Scholar]
- Brace, W.F.; Bombolakis, E.G. A Note on Brittle Crack Growth in Compression. J. Geophys. Res. 1963, 68, 3709–3713. [Google Scholar] [CrossRef]
- Hoek, E.; Bieniawski, Z.T. Brittle fracture propagation in rock under compression. Int. J. Fract. Mech. 1965, 1, 137–155. [Google Scholar] [CrossRef]
- Lajtai, E.Z. Brittle-Fracture in Compression. Int. J. Fract. 1974, 10, 525–536. [Google Scholar] [CrossRef]
- Lajtai, E.Z. Strength of discontinuous rocks in direct shear. Geotechnique 1969, 19, 218–233. [Google Scholar] [CrossRef]
- Bertram, B.K. Cracks and Fracture. s. l.; Academic Press: Cambridge, MA, USA, 1999. [Google Scholar]
- Lin, P.; Wang, R.H.C.; Wang, R.K.; Zhou, W.Y. Crack growth mechanism and failure behavior of specimen containing single flaw with different angles. Chin. J. Rock Mech. Eng. 2005, 24 (Suppl. 2), 5652–5657. [Google Scholar]
- Scholz, C.H. Experimental study of the fracturing process in brittle rocks. J. Geophys. Res. 1968, 73, 1447–1454. [Google Scholar] [CrossRef]
- Mogi, K. Source locations of elastic shocks in the fracturing processes in rocks. Bull. Earthq. Res. Inst. Tokyo Imp. Univ. 1968, 46, 1103–1125. [Google Scholar]
- Kudela, P.; Wandowski, T.; Malinowski, P.; Ostachowicz, W. Application of scanning laser Doppler vibrometry for delamination detection in composite structures. Opt. Lasers Eng. 2017, 99, 46–57. [Google Scholar] [CrossRef]
- Lukasz, S. Quality assurance and control of steel blade production using full non-contact frequency response analysis and 3d laser doppler scanning vibrometry system. In Proceedings of the 11th IEEE International Conference on Intelligent Data Acquisition and Advanced Computing Systems: Technology and Applications, Cracow, Poland, 22–25 September 2021; pp. 419–423. [Google Scholar]
- Sutton, M.A.; Orteu, J.J.; Schreier, H. Image Correlation for Shape, Motion and Deformation Measurements: Basic Concepts, Theory and Applications; Springer Science & Business Media: Columbia, SC, USA, 2009. [Google Scholar]
- Mao, L.T.; Liu, H.Z.; Lei, Y.; Wu, J.C.; Ju, Y.; Chiang, F.P. Evaluation of Global and Local Digital Volume Correlation for Measuring 3D Deformation in Rocks. Rock Mech. Rock Eng. 2021, 54, 4949–4964. [Google Scholar] [CrossRef]
- Mugnai, F.; Caporossi, P.; Mazzanti, P. Exploiting Image Assisted Total Station in Digital Image Correlation (DIC) displacement measurements: Insights from laboratory experiments. Eur. J. Remote Sens. 2022, 55, 115–128. [Google Scholar] [CrossRef]
- Seisuke, O.; Tang, Y.; Xu, J.; Peng, S.J.; Chen, C.C.; Yan, Z.S. Application of 3D-DIC system in rock mechanic test. Rock Soil Mech. 2019, 40, 3263–3273. [Google Scholar]
- Sharafisafa, M.; Shen, L.M.; Xu, Q.F. Characterisation of mechanical behaviour of 3D printed rock-like material with digital image correlation. Int. J. Rock Mech. Min. Sci. 2018, 112, 122–138. [Google Scholar] [CrossRef]
- Zhao, C.; Tian, J.; Hiroshi, M.; Zhao, C.; Bao, C. Crack propagation and damage of rock under uniaxial compression based on global strain field analysis. Chin. J. Rock Mech. Eng. 2015, 34, 763–769. [Google Scholar]
- Wang, X.; Wu, Y.; Cui, J.; Zhu, C.Q.; Wang, X.Z. Shape Characteristics of Coral Sand from the South China Sea. J. Mar. Sci. Eng. 2020, 8, 803. [Google Scholar] [CrossRef]
- Bieniawski, Z.T.; Hawkes, I. International society for rock mechanics commission on standardization of laboratory and field tests suggested methods for determining tensile-strength of rock materials. Int. J. Rock Mech. Min. Sci. 1978, 15, 99–103. [Google Scholar]
- GB/T 23561.1-2009; Methods for Determining the Physical and Mechanical Properties of Coal and Rock—Part 1: General Requirements for Sampling. Standards Press of China: Beijing, China, 2009.
- Pu, C.; Chen, Y.S.; Zhou, C.; LIG, M. Displacement loading rate of rock-like specimenunder uniaxial compress test. J. Water Resour. Archit. Eng. 2018, 16, 161–164. [Google Scholar]
- Zhou, H.; Yang, Y.S.; Xiao, H.B.; Zhang, C.Q.; Fu, Y.P. Research on loading rate effect of tensile strength property of hard brittle marble—Test characteristics and mechanism. Chin. J. Rock Mech. Eng. 2013, 32, 1868–1875. [Google Scholar]
Publisher’s Note: MDPI stays neutral with regard to jurisdictional claims in published maps and institutional affiliations. |
© 2022 by the authors. Licensee MDPI, Basel, Switzerland. This article is an open access article distributed under the terms and conditions of the Creative Commons Attribution (CC BY) license (https://creativecommons.org/licenses/by/4.0/).