Article

Knowledge Management for Injection Molding Defects by a Knowledge Graph

1
Department of Mechanical Engineering, Chung Yuan Christian University, Taoyuan City 320, Taiwan
2
Gudeng Precision Industrial Co., Ltd., New Taipei City 236, Taiwan
*
Author to whom correspondence should be addressed.
Appl. Sci. 2022, 12(23), 11888; https://doi.org/10.3390/app122311888
Submission received: 25 October 2022 / Revised: 11 November 2022 / Accepted: 18 November 2022 / Published: 22 November 2022
(This article belongs to the Special Issue Smart Machines and Intelligent Manufacturing)

Abstract

:
Injection molding is a technique with a high knowledge content. However, most of the injection molding knowledge is stored in books, and it is difficult for personnel to clarify the influence of the different factors. This study applies the concept of a knowledge graph by using three types of nodes and edges to express the complex injection molding knowledge in the related literature, and also combines SBERT and search engine building to retrieve the graph. The search engine can follow different search logics, according to the types of nodes, then find the knowledge related to the node, classify it according to the search path, and visualize the search results to the user. Users can clarify the relationship between various process factors and product qualities in a different way. We also use multiple tests to show the actual search results and verify the performance of the search engine. The results show that the search engine can quickly and correctly find the relevant knowledge in the graph, and maintain its performance when the graph is expanded. At the same time, users can clarify the impact of various process factors on the product quality, according to the search results.

1. Introduction

The plastic injection industry is characterized by workability, high accuracy, low cost, rapid molding, and mature technology. The industry has gradually expanded the application areas that are associated with daily necessities, automobiles, motorcycles, and space shuttles, even with precision 3C parts and components. As a result, the demand for professionals in injection molding is growing gradually. However, the present industry passes its molding experience and techniques through the mentoring system; in the long-term, the age discontinuity induced by the low birth rate, as well as the deficiency of the systematic informatization management of expertise, will fail to provide the continuous sophistication required by the industry.
Among the studies regarding injection molding expertise management systems, Jong et al. [1,2] used a computer-aided design (CAD) redevelopment tool and a historical knowledge base to build a mold design navigation system. This system can provide assistance for making decisions about subsequent products and mold designs, based on the practical knowledge accumulated in prior mold design processes, in order to effectively shorten the mold design time, and prevent the losses induced by inappropriate designs. Khosravani et al. [3] implemented an intelligent injection machine fault detection system, based on case-based reasoning (CBR), which can analyze the current fault features and search prior similar cases to find the cause for the current machine faults. The fault-induced stop time of the injection machine was effectively shortened. Mikos et al. [4] identified similar historical cases through CBR to address molding quality problems in the injection molding process, and used the retrieved case solutions as the criteria of solutions for current problems. Khosravani et al. [5] proposed an injection molding defect elimination system, which can find similar cases from the historical database through the current situation, and select an appropriate solution according to pre-established rules. Mathivanan et al. [6] used the Taguchi method to find the best process parameter settings to improve the problem of sink marks on the product. Altan [7] used the Taguchi method and ANOVA to find out the injection molding process parameters that are highly correlated with product shrinkage, and found the best parameter settings. Utomo et al. [8] used the Taguchi method and ANOVA to find the injection molding process parameters that are highly correlated with the short shot of the product, and adjusted the parameters to improve the product’s short shot. Yin et al. [9] used a neural network to predict the warpage of injection molding products, and adjusted the process parameters, according to the prediction results, to improve the warpage. Kurtaran et al. [10] used a neural network to predict the warpage of injection molding products, and combined it with a genetic algorithm to find the optimal process parameter configurations.
According to the above references, the present injection molding industry uses past experience and parameter analysis results as guidelines for mold designs, machine fault clearance, and solving product defects. Therefore, most contemporary engineering staff are unaware of the causes behind previous mold design changes and the criteria used in machine fault diagnosis, thus, when faced with the need to solve product defects, they are not clear about the purpose or associated effects of adjusting process parameters. According to the current shorter product life cycles, product designs must change frequently, which makes it difficult to solve new design and process problems, according to past experience.
Among the studies about the application of knowledge graphs, Zhang et al. [11] integrated medical text knowledge with doctors’ clinical experiences to create a health knowledge graph and designed a graph expanding mechanism in which new diseases can be added to the existing knowledge graph. This graph can assist clinicians in making decisions. Kim [12] built a knowledge graph that includes all medical institutions in Korea, which can be linked to the heterogeneous data sources of the administrative regions, in order that the users can choose the appropriate medical institutions, according to their requirements. Jiang et al. [13] built a knowledge graph of construction safety standards (KGCSSs) for guiding the development and revision of construction safety standards (CSSs), which provides the function of question input queries to promote the analysis, query, and sharing of safety standard knowledge. Shi et al. [14] used a web crawler to obtain agricultural Qs & As and scientific data, which they used as the original data to create a knowledge graph that contained three major classes, crops, pesticides, and diseases and insect damage. This graph can disclose disease and insect damage trends, and manifest the implicit relations among the different diseases and insect damages, thus, providing multiple agricultural suggestions for pest control. Lee et al. [15] collected the open source data possessed by government institutions and created a knowledge graph for displaying the relationships of government data, to enhance the users’ accessibility to government data, meaning users can obtain related data through one query, and the barriers to obtain the necessary data are greatly reduced for the citizens. Yan et al. [16] proposed a method that used the structured and unstructured data of water affairs, to build a knowledge graph according to the requirements of water affairs, proposed an information recommendation system, based on the water affairs knowledge graph, and applied a validation data set to validate the effectiveness of the information recommendation system. Chi et al. [17] designed a knowledge graph that integrates healthy diet information on the internet, which provides a retrieval system for users to learn healthy diet knowledge faster and more comprehensively, to facilitate more balanced diets for the public. Zhang et al. [18] proposed a knowledge reutilization method, based on a knowledge graph, where the knowledge resources required at various stages of the product life cycles were appropriately captured by the personalized PageRank [19], in order to support engineers’ decisions regarding new product development. Gao et al. [20] introduced a detailed construction method through a knowledge graph in the domain of power system dispatching, then discussed the application of the knowledge graph to the actual field of power system dispatching, and found that the knowledge graph could help the dispatchers in the aspect of knowledge management for emergency decisions. In the aspect of analyzing and comprehending pedigree data, Su et al. [21] established a public Chinese tourism knowledge graph, and proposed a recommendation algorithm, based on user interests and attraction attributes, which can provide users with travel suggestions, based on user preferences. Zhang et al. [22] built a knowledge graph to express the correlation between enterprises, which took the target enterprise as a starting point, based on a knowledge graph, to look for the associated enterprises in the knowledge graph, and then, used a relation algorithm to detect the potential risks of the target enterprise. Huang et al. [23] proposed using a power grid equipment knowledge graph for the reasonable analysis and visualization of a wide variety of complex power grid equipment information and relationships, in order to develop a power grid information system. Haussmann et al. [24] proposed a knowledge graph for recording the association between recipes and ingredients, and developed a service architecture that can recommend suitable recipes, based on the ingredients prepared by the user and the user’s allergy situation. Liu et al. [25] constructed a knowledge graph through railway accidents and their causes, and used the analysis results of the graph as the basis for railway operators’ accident prevention decision-making. Zehra et al. [26] established a financial knowledge graph through the bank’s annual report, and established a QA system with NLP technology to help users quickly query the required financial information in an intuitive way.
According to the above literature, knowledge graphs can clearly express the correlation among data and help people understand mass information more easily. Therefore, knowledge graphs play a major role in knowledge retrieval, knowledge Qs & As, and knowledge recommendations.
Although the knowledge graph can save large amounts of data with complex relationships, it needs to be retrieved through a search programming language, which leads to many difficulties for engineers without a knowledge graph background. Acikalin et al. [27] fine-tuned the multilingual BERT model, and used it to classify positive and negative reviews on Turkish movie and hotel review datasets. The experimental results showed that the model achieved an extremely high accuracy. Mozafari et al. [28] fine-tuned the BERT model to detect unfriendly speeches on social networks and classify them into topics, such as racism, sexism, hatred, and attacks. The results show that the model achieves a high accuracy and can improve the current speech monitoring tools to detect the negative effects of errors on platforms and users. Dang et al. [29] used Sentence-BERT (SBERT) to integrate different state evaluation indicators in power equipment and built a power equipment evaluation indicator knowledge graph to help engineers evaluate the state of power equipment. Casillas et al. [30] created a fact-checking model, based on BERT, to test the authenticity of COVID-19 related information, thereby reducing the harm of fake news. The above literature shows that BERT has an excellent performance in natural language processing, and can extract the textual features of sentences for analysis, thereby demonstrating its potential in helping users to retrieve graphs in an intuitive way.
We can find that in the past related research on injection molding, most of them use experience, experiments, and neural networks to clarify the relationship between process parameters and product quality, but none of them can explain how process parameters affect product quality, and they don’t consider the impact of non-processed parameters. Knowledge graphs have shown a great effectiveness in clarifying the relation between entities and have been used in many fields, but this technology has few applications in injection molding. We believe that a knowledge graph can help us to understand the impact of various factors on product quality, and play an important role in personnel training and decision assistance.
Therefore, this study collects the knowledge from books and articles related to injection molding, and integrates them through expert opinions to propose an injection molding knowledge graph. Using a self-developed search engine with natural language processing technology, will help the user to retrieve the graph. It can help users to clearly understand the interaction between mold design, machine conditions and process parameters and also solve the problem of new personnel training.

2. Materials and Methods

2.1. Knowledge Graph

Google proposed the concept of a knowledge graph in 2012 [31]. Knowledge graphs provide a brief description of the world, and Google initially used them in search engines. Knowledge graphs comprised multiple semantic triples, and these semantic triples contain three elements, entities, relationships, and attributes. The entity acts as a node in the knowledge graph, and specific persons, things, objects, and even abstract concepts can be expressed as entities. While the correlations among the entities are expressed as the edges between the nodes in the graph, the edges in a graph can directionally express the correlation between a subject and object. In addition, attributes can be added to the nodes and edges in a graph to present more detailed descriptions.

2.2. Neo4j

Most traditional SQL databases store data in a tabular form. When the database needs to store large amounts of data with complex relationships, it takes a lot of time to write the programs to describe the relationship between the data. Neo4j is a property graph database. Through the programming language Cypher [32], it can quickly express the relationships that are difficult to describe in the SQL programming language, and visualize the graph data with D3.js, providing users with a friendly development environment. Based on the above advantages, this study uses Neo4j to build the knowledge graph.

2.3. MongoDB

Although Neo4j provides a friendly development environment, its retrieval performance is difficult to meet the needs of this research. According to the experiment, it will take 4.1 s to search for the relevant attribute of a node and the related information of its neighbor nodes, by the Neo4j Python driver, a Python package provided by Neo4j. MongoDB is a NoSQL database that stores data in JSON format and provides an object-oriented query language, which can quickly retrieve data. This study uses the Neo4j Python driver to obtain and organize all knowledge graph information, and then use MongoDB’s Python package pymongo to store the node information and connections between the nodes in MongoDB, as two collections. The node’s Chinese name, English name, node class, and node ID are stored in the node property collection. The node relation collection records the node’s neighbor nodes, the direction of the connection, and the category of the relationship. Using MongoDB only took 0.003 s to complete the search operation that took Neo4j 4.1 s to accomplish.

2.4. BERT

BERT [33] is a pre-trained natural language model, proposed by Google in 2018. When BERT receives text, it needs to process the text through a tokenizer, which can convert the text into token embedding, segment embedding, and position embedding, which respectively record the character encoding in the text and the segmentation annotation of the text. The position information of each character, and the three will be used as the input of BERT to extract the text features. The biggest difference between BERT and the traditional NLP (natural language processing) model is that when BERT extracts the features of each character in the text, it will consider the position of the character in the text data and its corresponding context, so that BERT has an excellent performance in the NLP task.

2.5. Graph Construction

Due to the difficulty of transforming expertise into entities and integrating the correlations between entities, the application of a knowledge graph has fewer cases in the manufacturing industry than in other areas. This study divided the knowledge of injection molding into three classes of nodes: problem, phenomenon, and action. The node classification criteria are provided, as follows:

2.5.1. Problem Nodes

This study defined 13 problem nodes regarding product defects in injection molding, such as short shots, flash, and flow marks, as shown in Figure 1.

2.5.2. Phenomenon Nodes

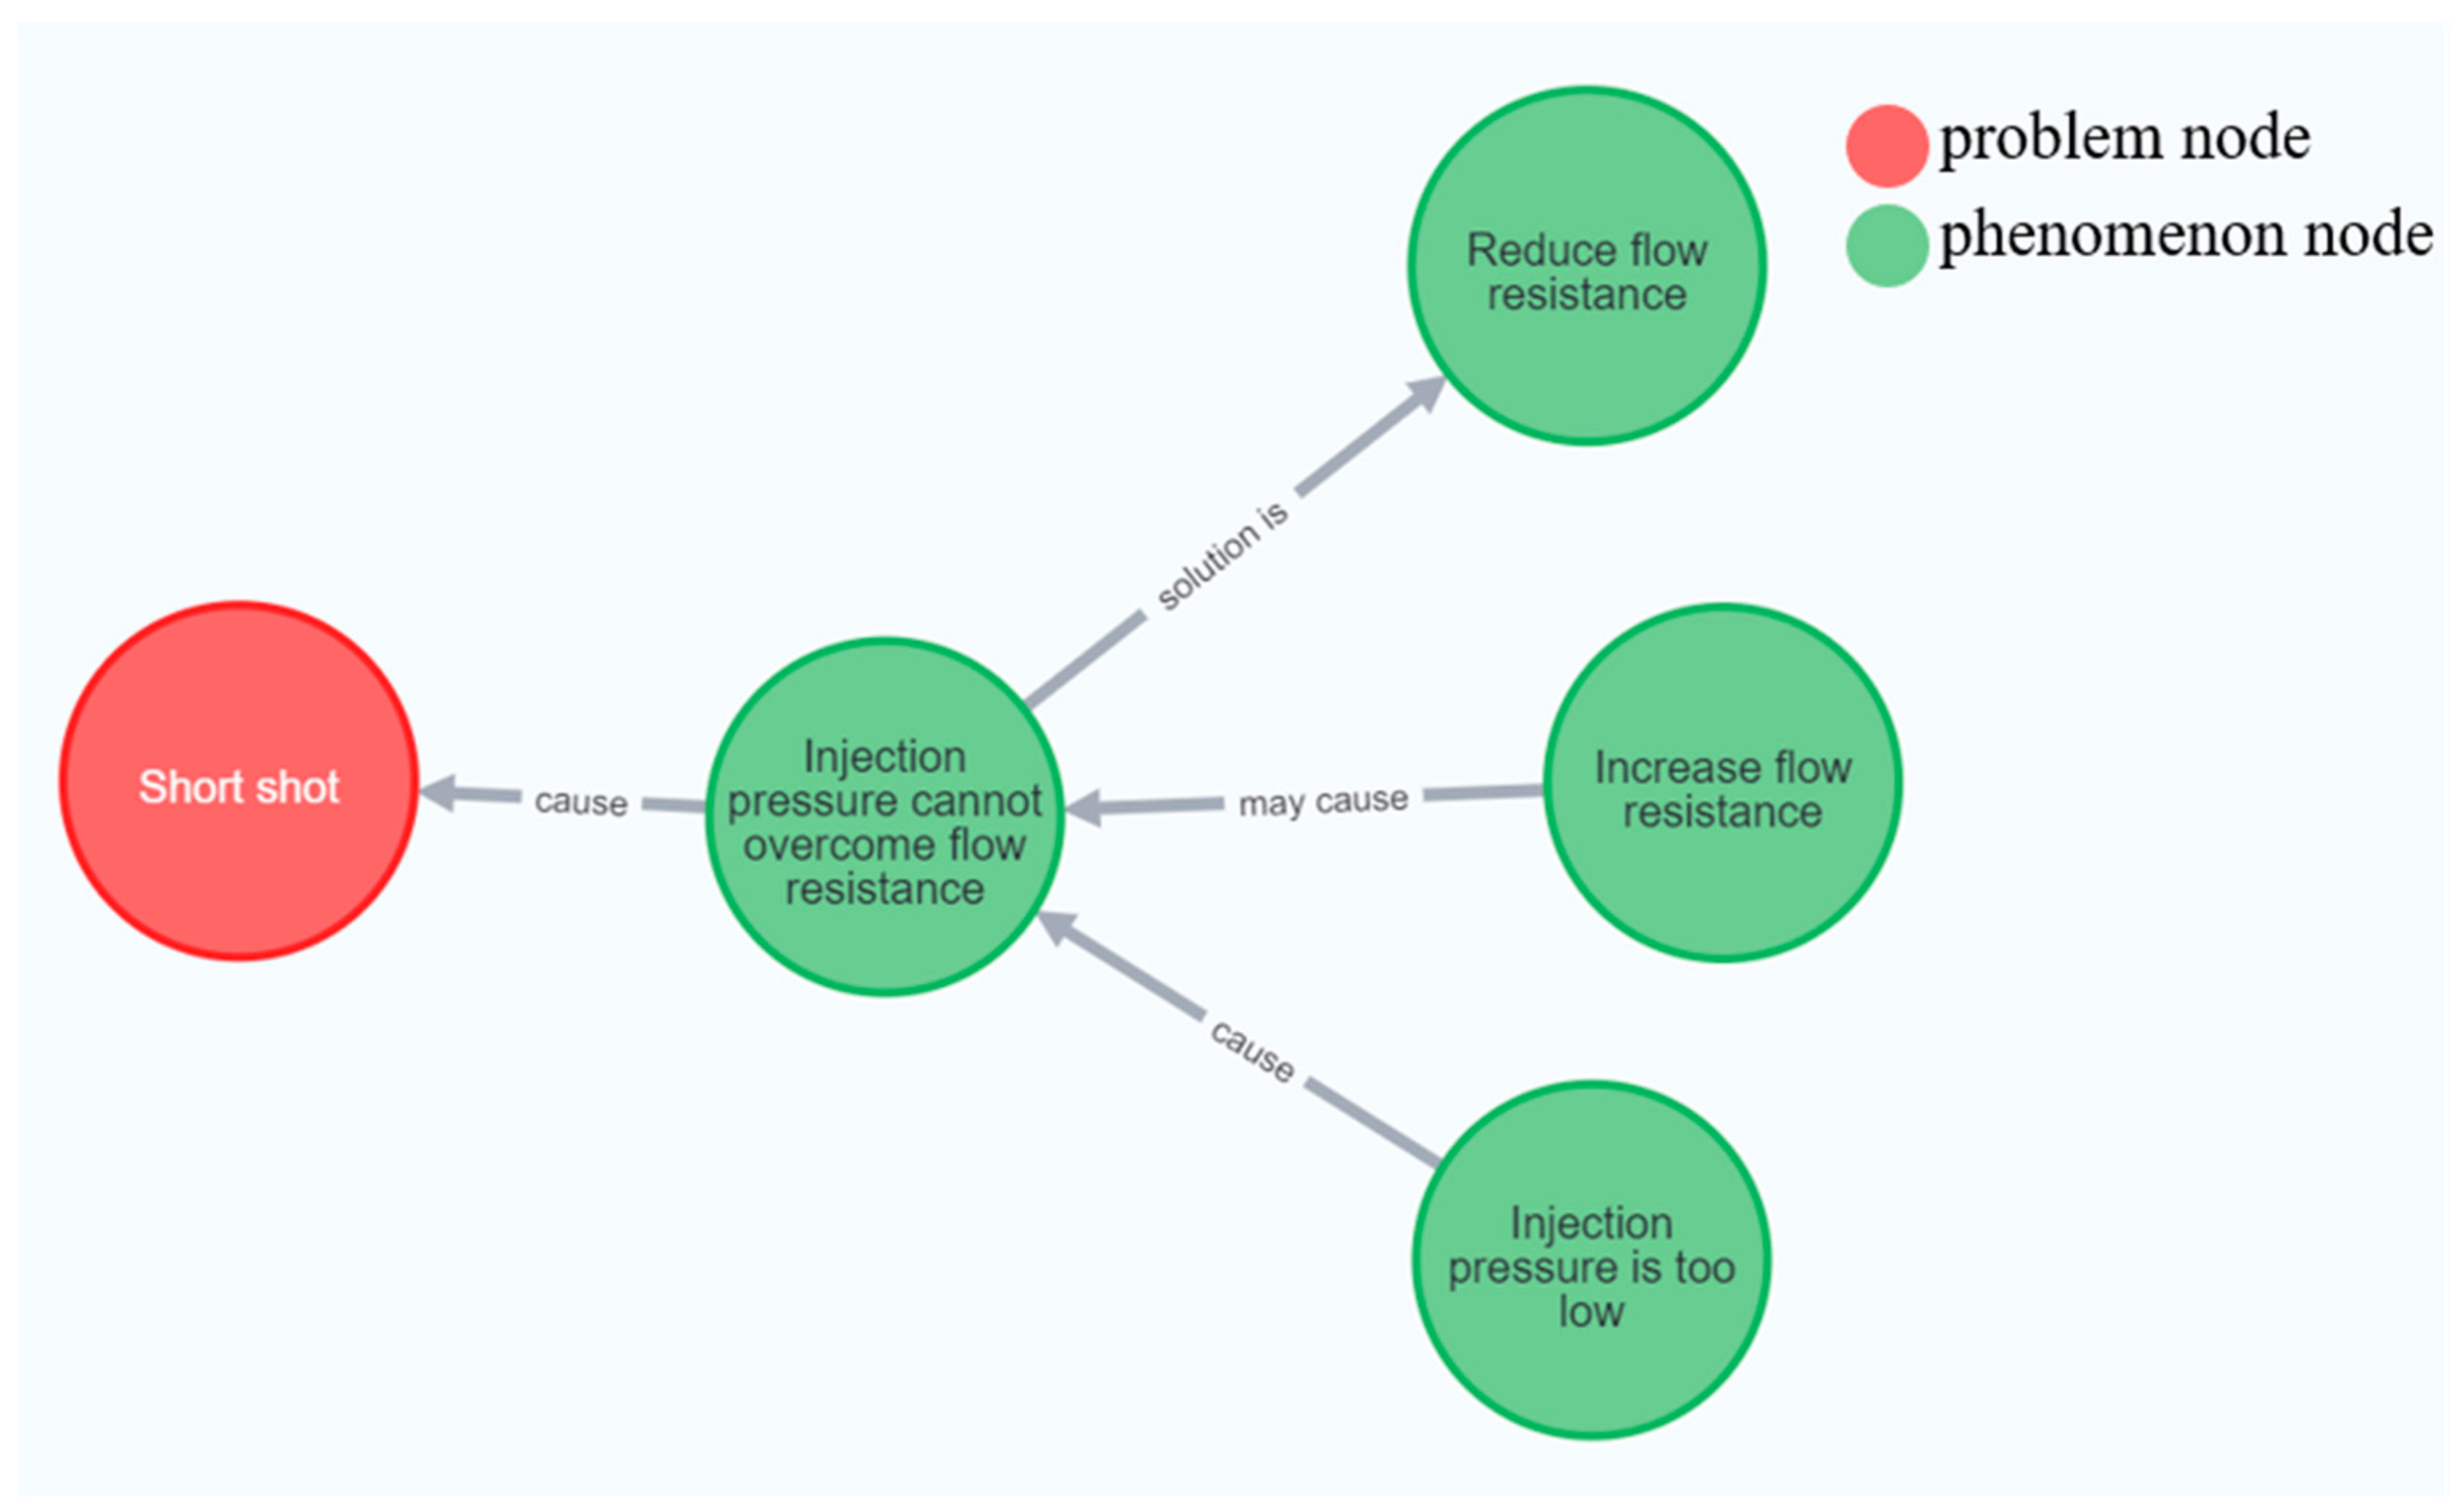
The physical state changes and different scenarios in injection knowledge are defined as phenomenon nodes in this study, as shown in Figure 2. Different from the problem-causing nodes, phenomenon nodes would not directly cause a problem; for example, the cavity pressure rise and mold strength increased nodes are defined as phenomenon nodes, and there are 141 phenomenon nodes in this graph.

2.5.3. Action Nodes

Changes in the mold designs and machine parameters are defined as action nodes in this study, as shown in Figure 3. The action node is generally regarded as the solution to problems, and there are 87 action nodes in this graph.
Following the establishment of the node classes, this study used three kinds of edges, including cause, may cause, and solution, to describe the correlation among the nodes and connect them. The definition modes of the three edges are introduced, as follows:
  • Cause
The fact that B certainly will happen if A happens, is described by the cause type edge in the graph; for example, if the melt temperature rises, the melt density will certainly decrease. This type of correlation is described by the cause-labeled edge.
2.
May cause
The fact that A will induce B under specific circumstances, is described by the may cause type edge in the graph; for example, when the flow resistance approximates the bearable critical value of the injection pressure, the increase in the melt flow resistance will cause the injection pressure to be unable to overcome the flow resistance, and as the cavity pressure approaches the bearable critical value of the clamping force, the increase of the cavity pressure will cause the clamping force to fail to overcome the cavity pressure. Similar types of correlations are also described by the may cause-labeled edge.
3.
Solution
The fact that the improvement method for A is B, is described using the solution type edge in the graph; for example, the solution to the incomplete cooling of the end product is to increase the cooling time, which can be expressed by the solution-labeled edge.
Finally, this study used the abovementioned three types of edges to connect the four types of nodes in the graph to form the injection molding knowledge graph. Figure 4 shows the injection molding knowledge graph, which shows that 242 graph nodes are connected by 340 edges.

2.6. Search Engine

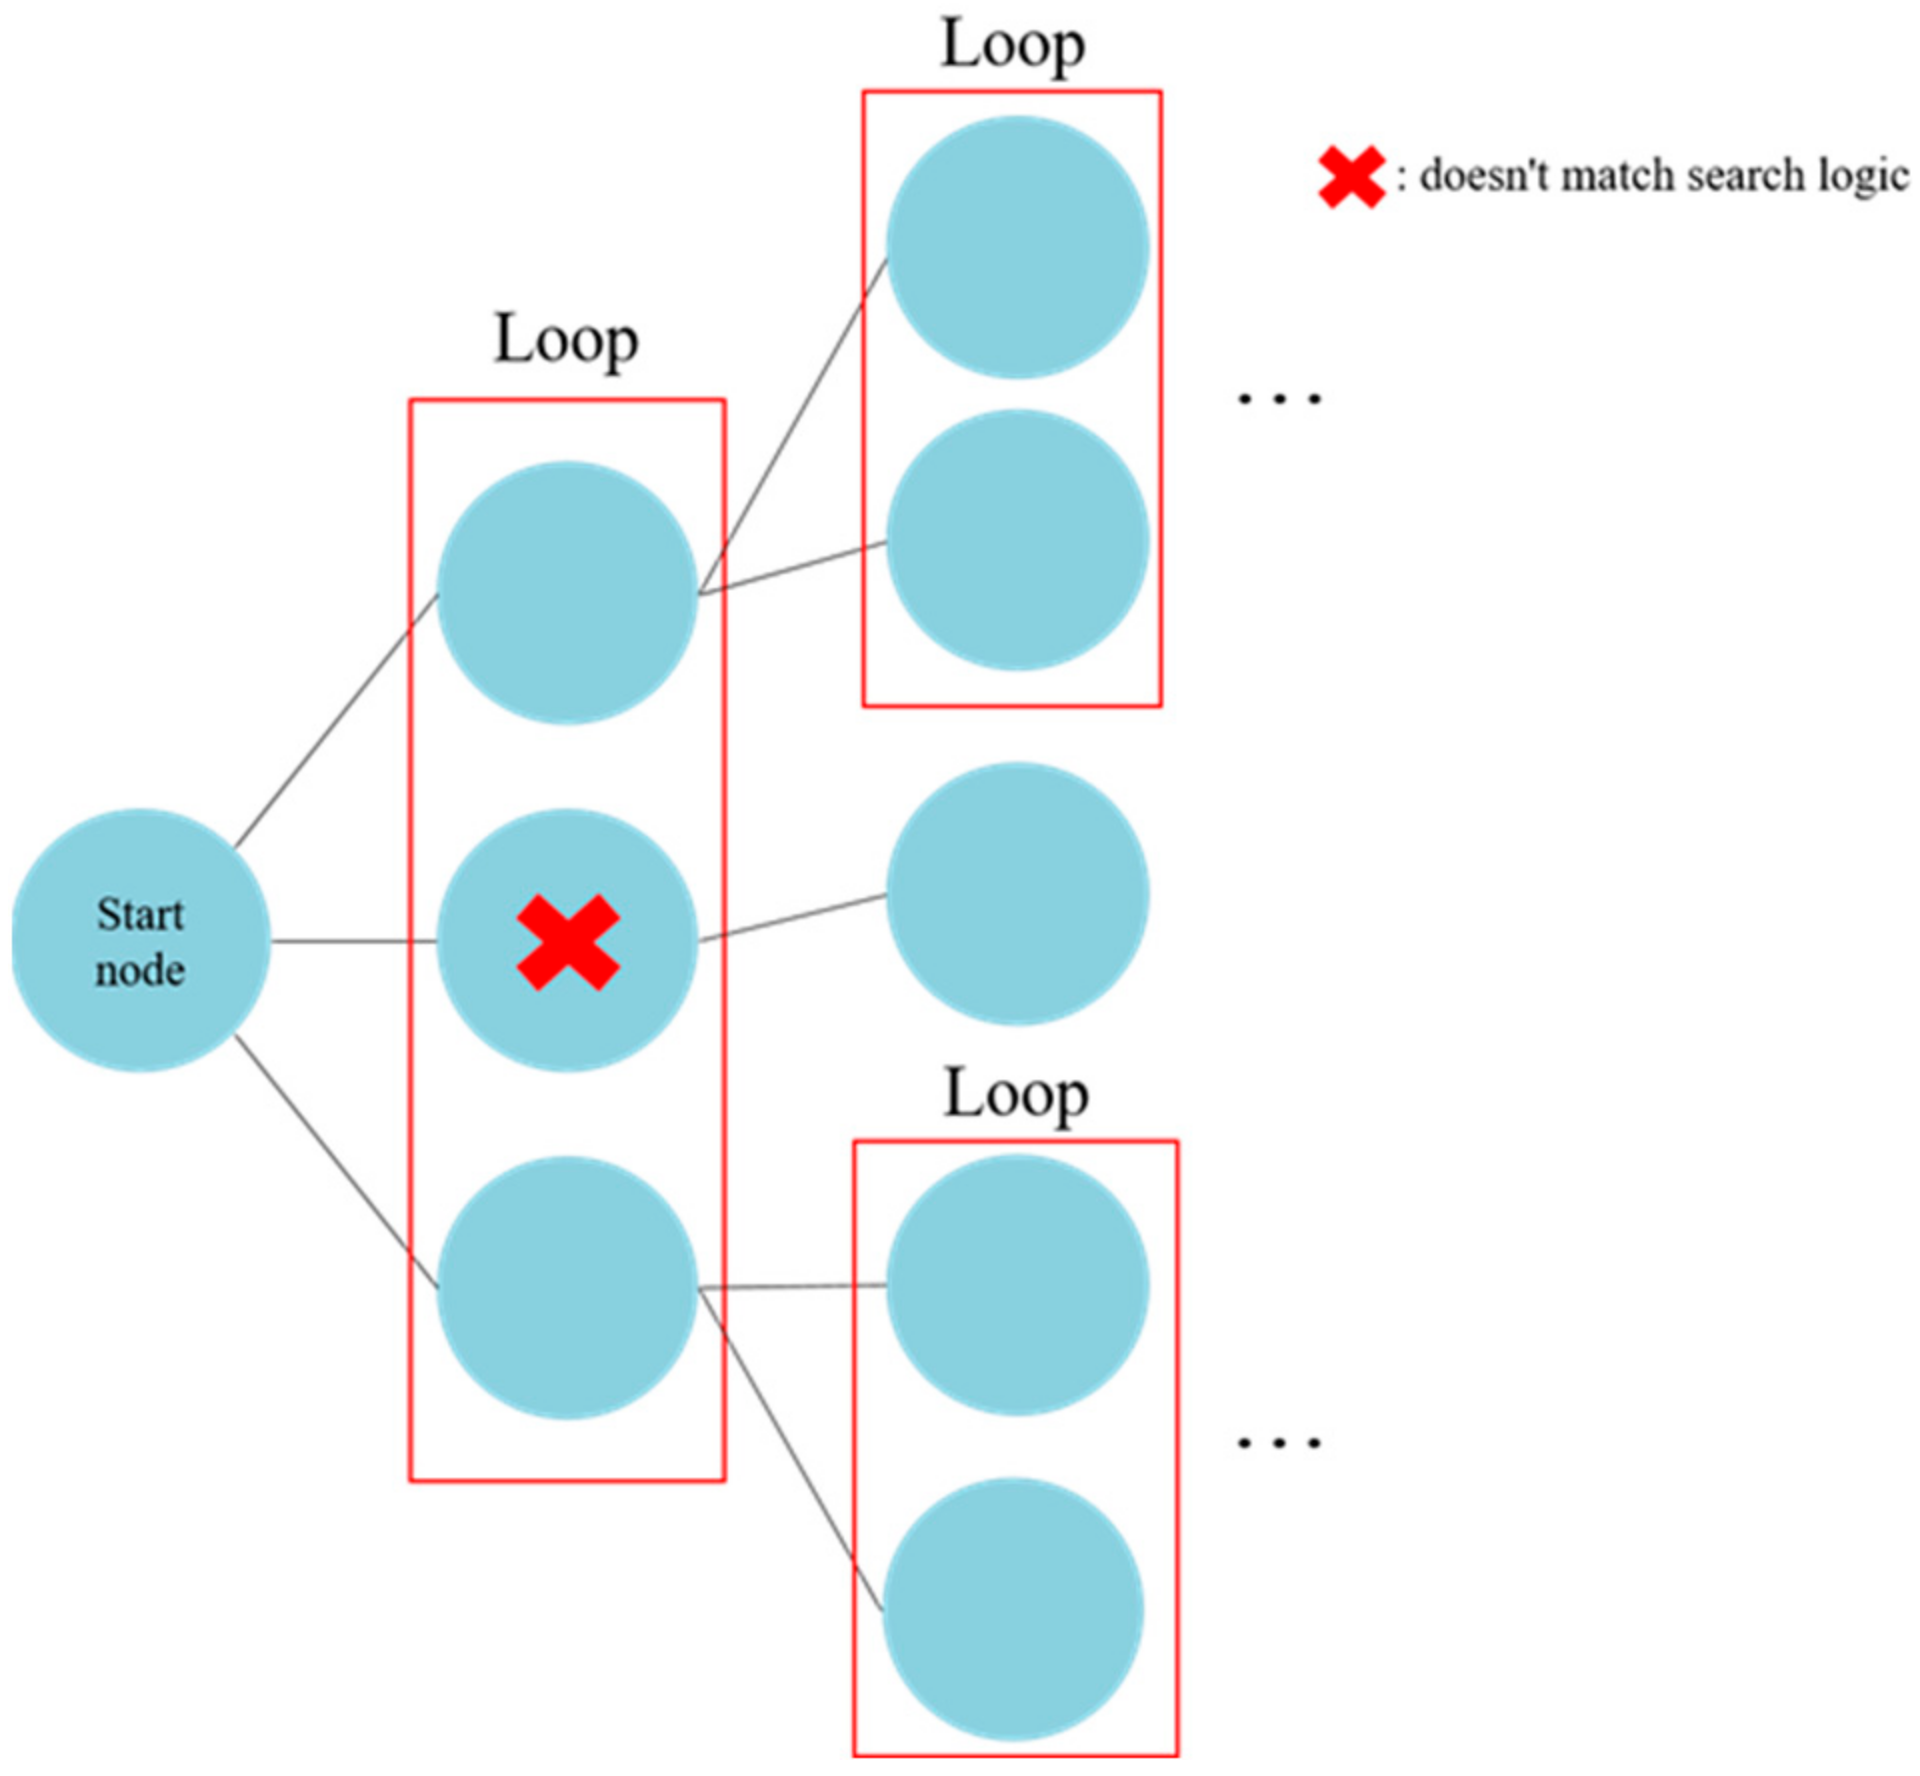
Most injection molding knowledge requires many triple sets to express, so the traditional graph search can’t meet the needs of the knowledge retrieval in this study. Therefore, this study uses Python to build a multi-hop search engine, based on the loop concept to retrieve the graphs. As shown in Figure 5, the multi-hop search engine obtains the type of the starting node and the neighbor nodes through MongoDB, and then selects the corresponding search logic, according to the type of the starting node. The engine checks each neighbor node, whether the type of neighbor node and the relationships of the sort and direction, conform to the search logic; if it matches, then it obtains the neighbor node through MongoDB. The engine checks whether the neighbor node and relationship conform to the search logic through another loop. Otherwise, the engine will continue to execute the current loop until all loops are executed, and the search is considered complete. During the searching process, the nodes that meet the search logic will be included in the search results and will return in the form of graph data. Through this method, the search engine can determine the search depth and direction, according to the type of the starting node.

2.7. Search Logic

The search logic factors corresponding to the different types of start nodes are introduced, as follows.

2.7.1. Problem Search Logic

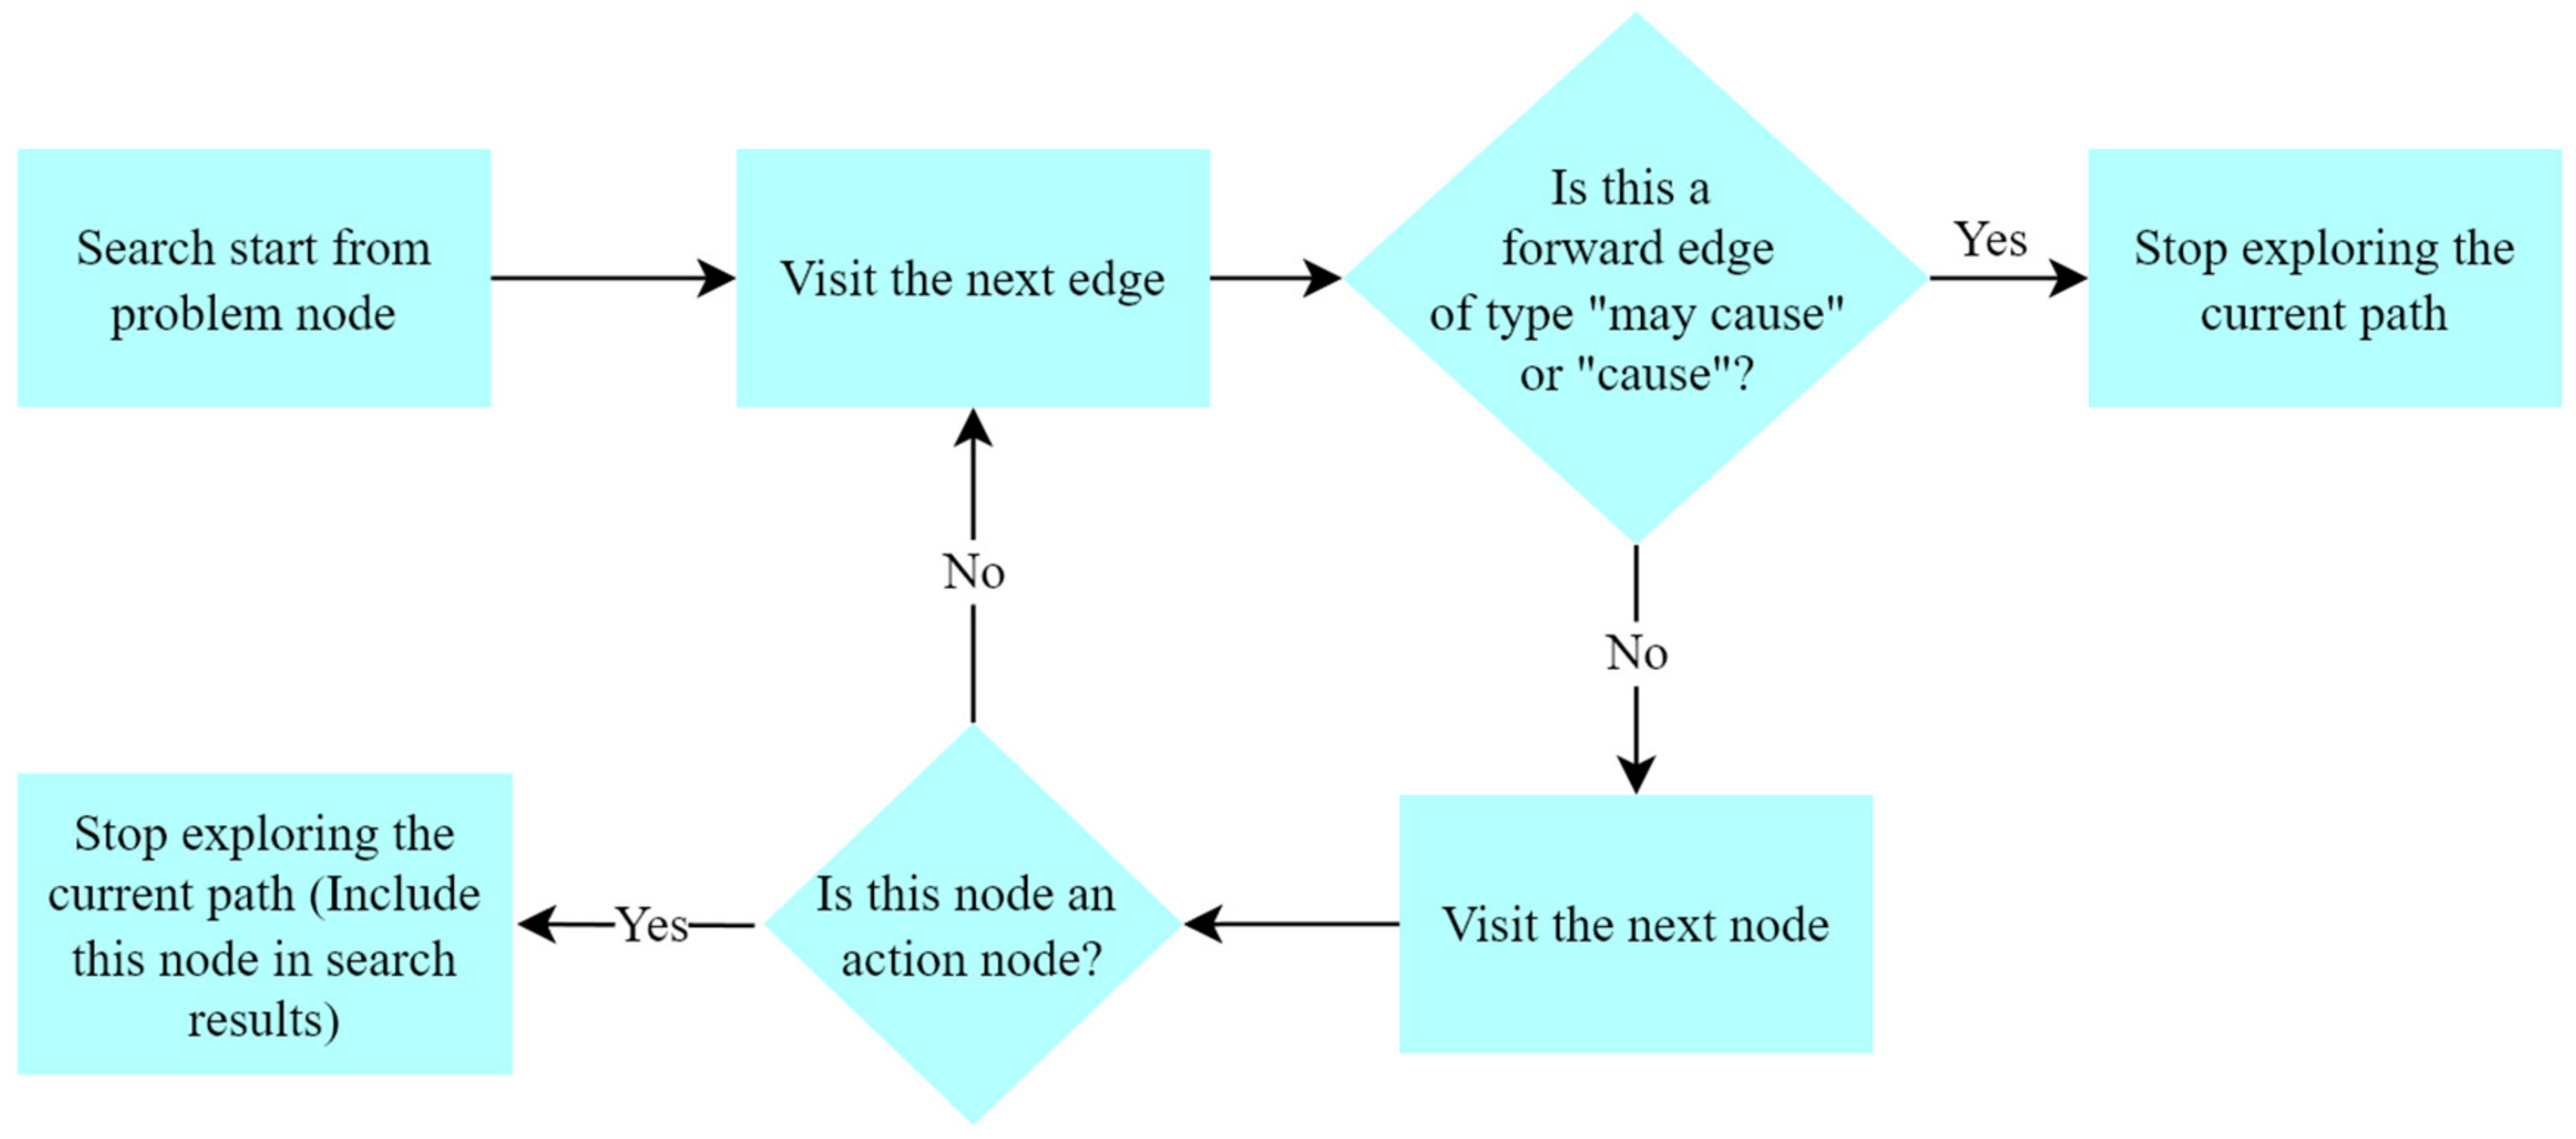
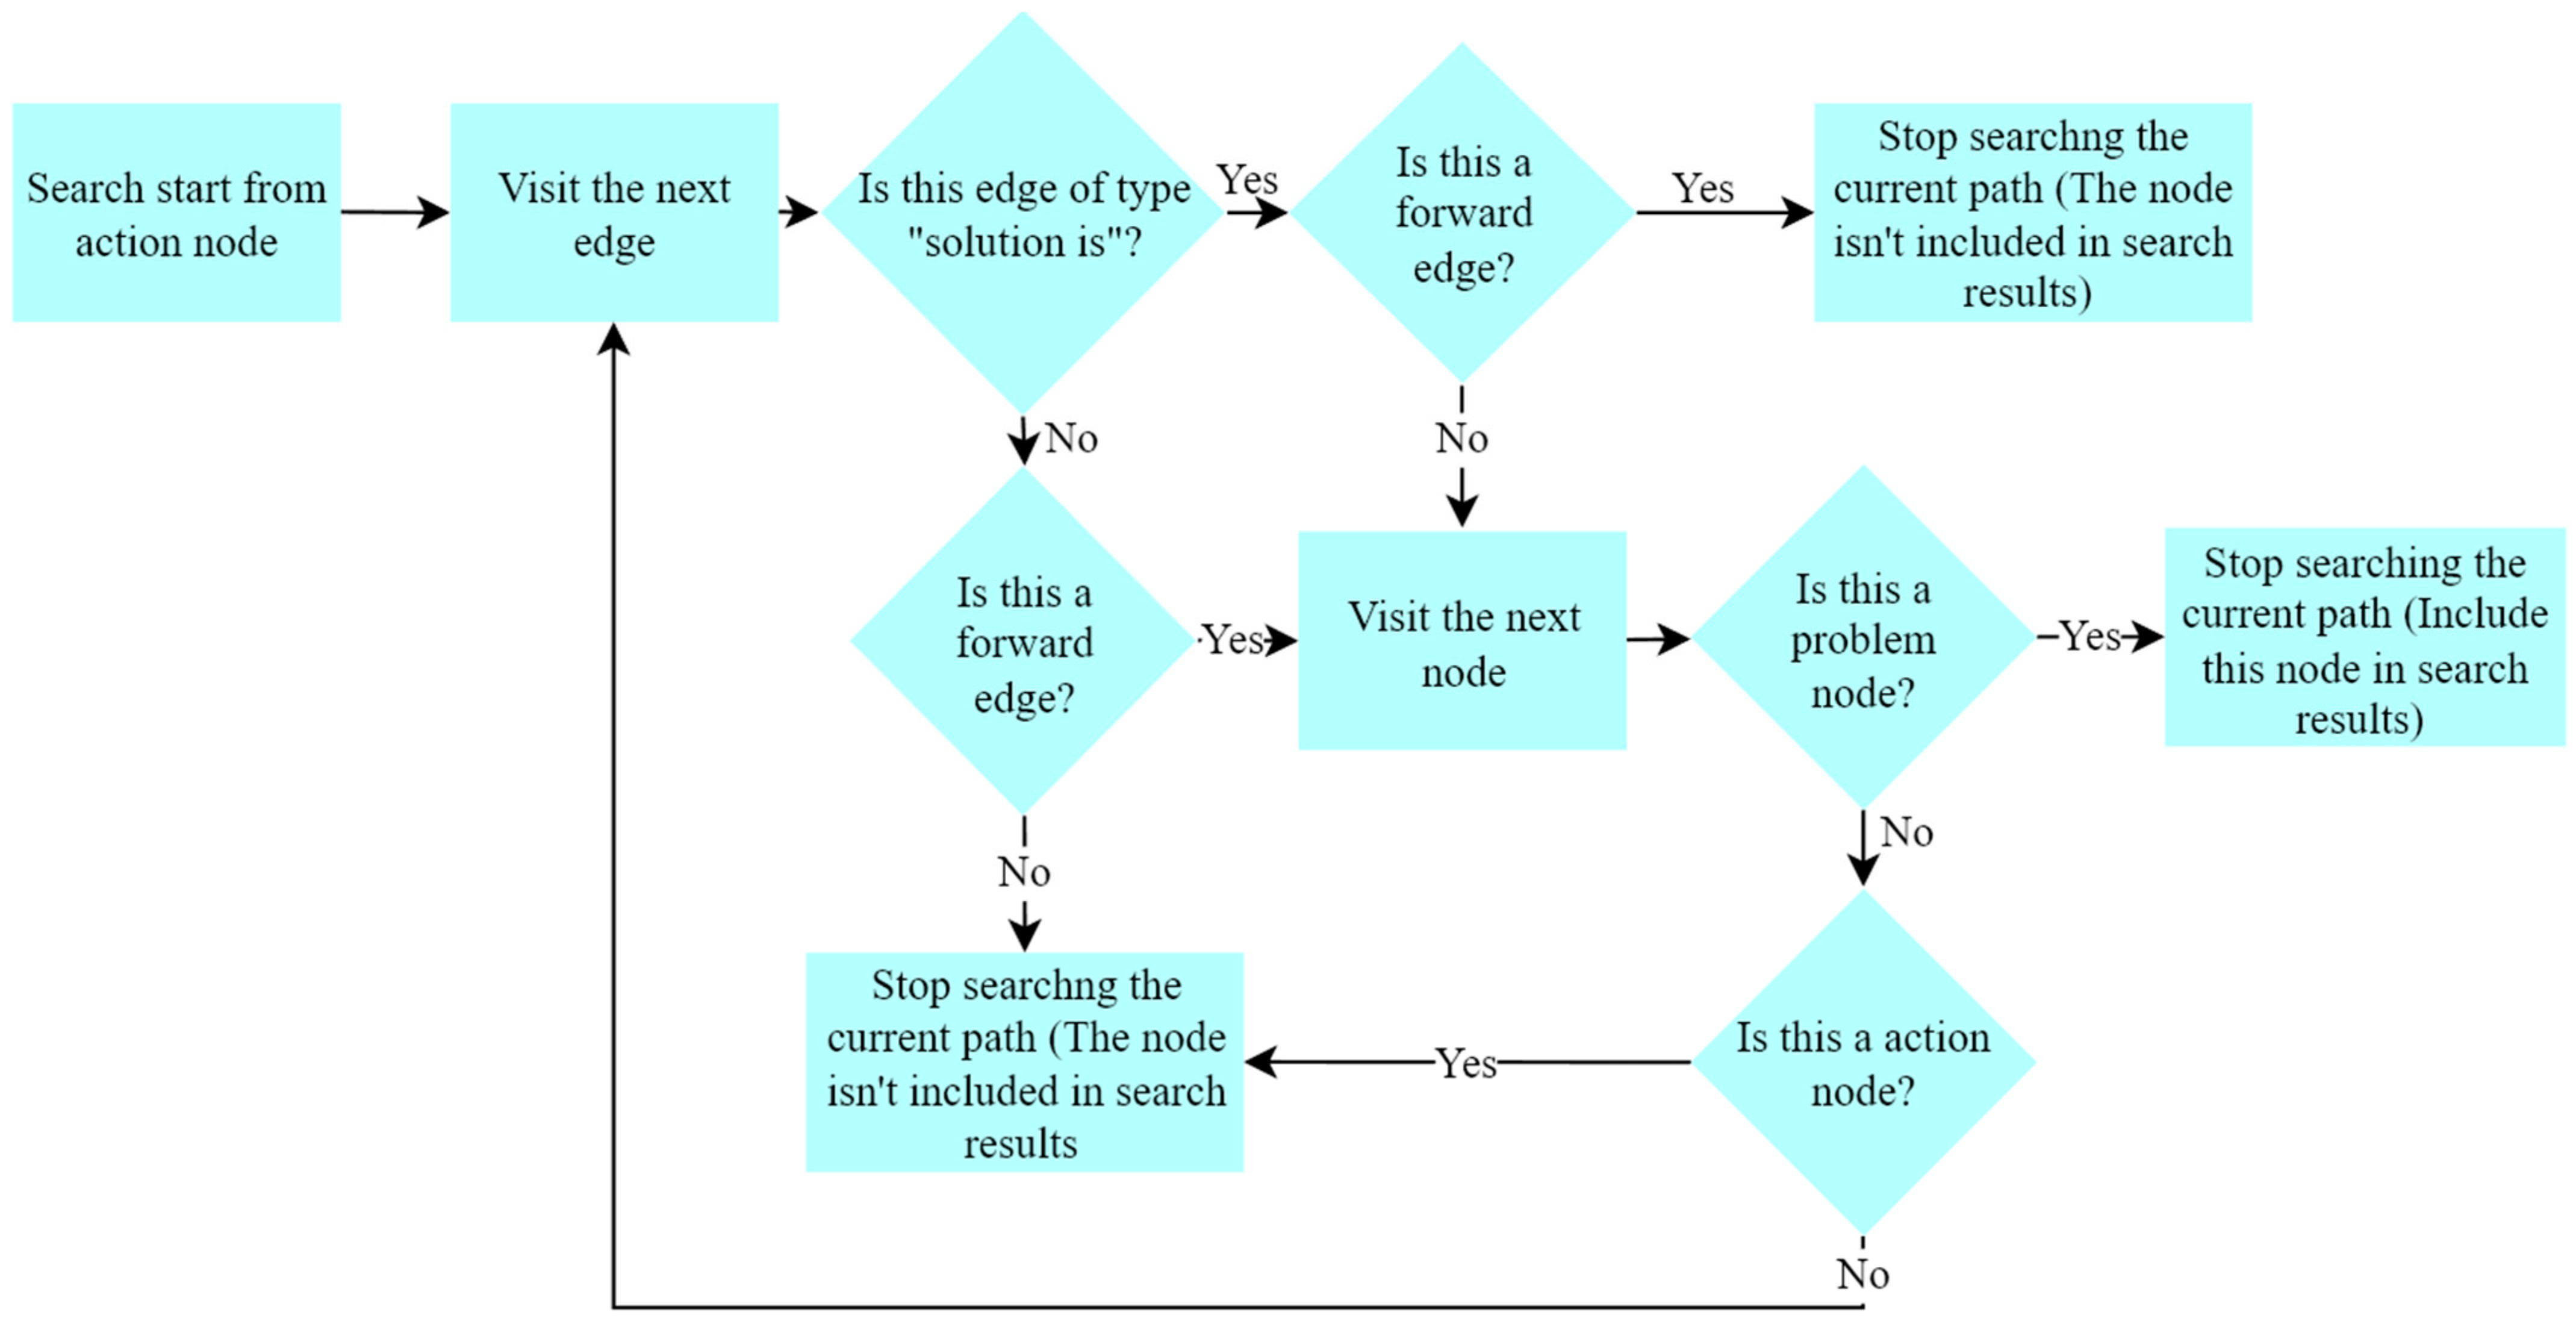
As shown in Figure 6, in the problem search logic, when an action node is visited during the course of exploration, the path exploration is stopped, and the node is brought into the search result. Meanwhile, the agent would decide whether to stop exploring the current path, according to the type and directionality of the edge. In a problem search logic, the directionality of the cause type may cause the type edges to be reversed.
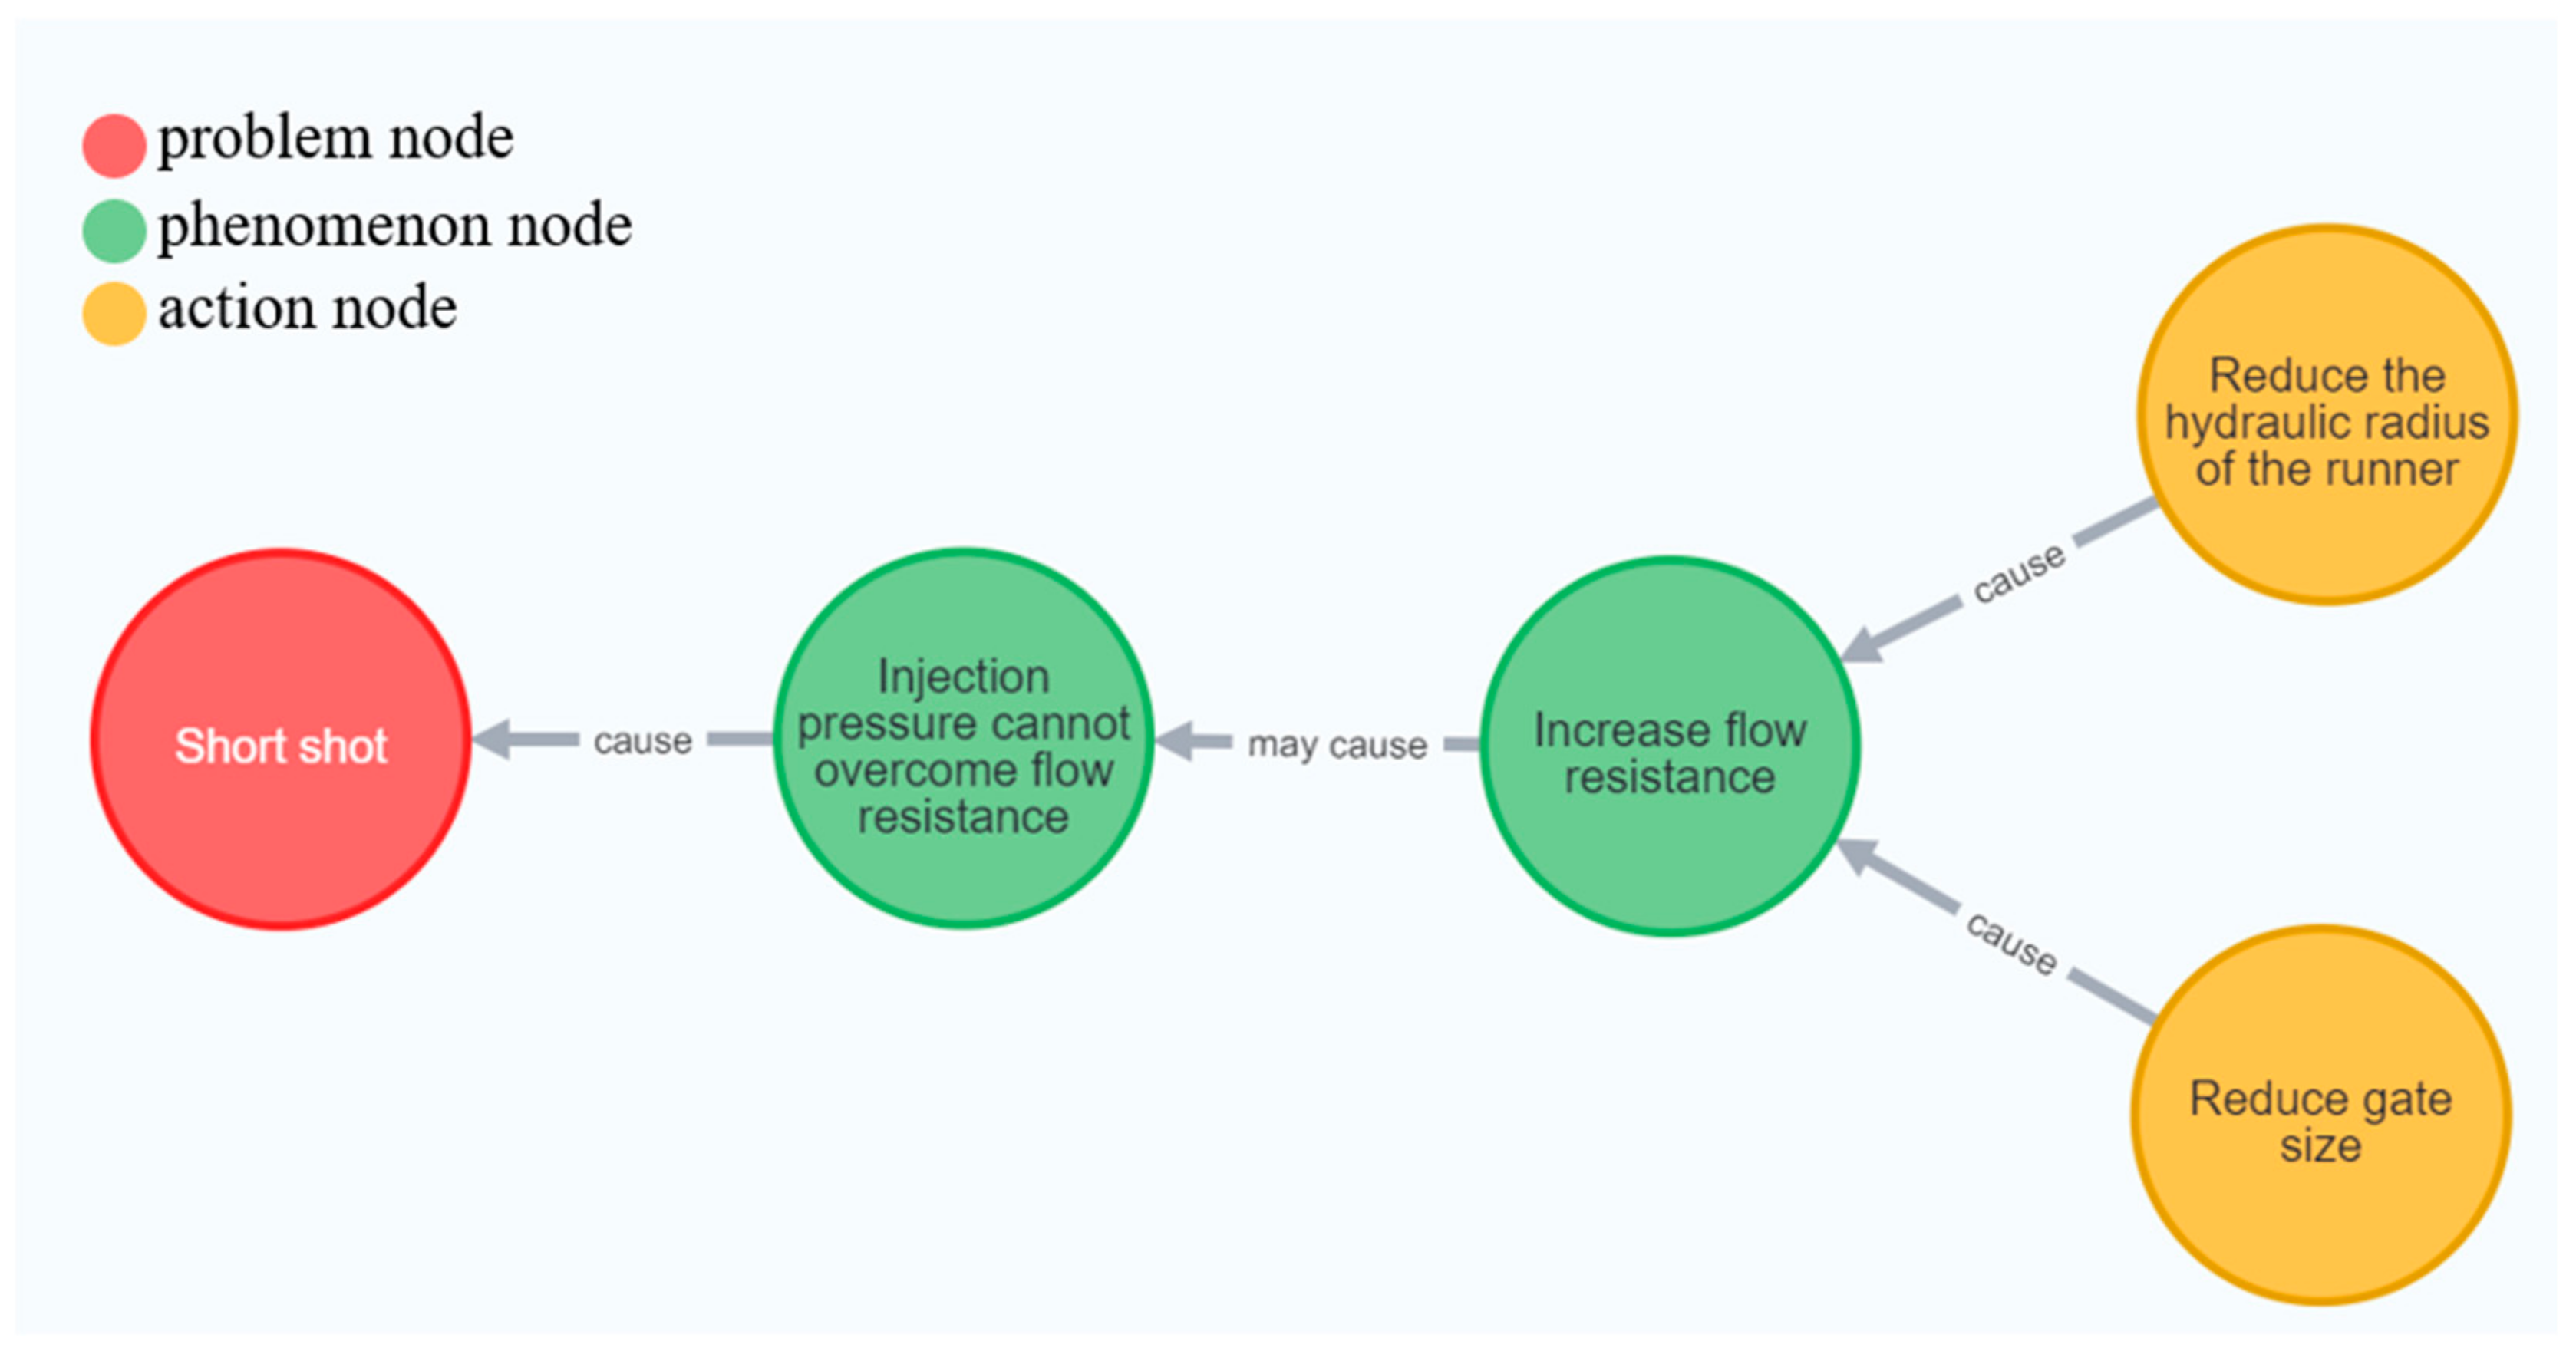
As shown in Figure 7, the action node in the search result was reasoned, according to the path of the node explored by the agent. If a solution type edge is explored in the path of the action node, the node is regarded as a solving action; otherwise, it is regarded as a causative action.

2.7.2. Phenomenon Node Search Logic

As shown in Figure 8, in the phenomenon node search logic, when the agent has visited the problem node and the action node, the exploration of the current path will be stopped, and brought into the search result. Meanwhile, it is specified that the agent must have consistent directionality when passing through the cause type, and might cause type edges in the course of exploration, thus, the directionality of the solution type edge must be opposite.
As shown in Figure 9, the search engine classified the problem nodes searched by quoting the phenomenon logic into problems that could be solved by the start node, as well as the problems initiated by the start node. Thus, if a solution type edge is explored in the path of the problem node, then the problem node would be recognized as a problem that could be solved, otherwise, it is recognized as an initiated problem.

2.7.3. Phenomenon Node Search Logic

Figure 10 shows that, in the search logic of the action node, if the agent visited a problem node, the exploration of the current path would be stopped and the node would be brought into the search result. If an action node is visited, the exploration of the current path would be suspended, and the node would not be listed as a search result. In addition, if the agent decides to stop exploring the current path, according to the type and directionality of the edge, then the agent must pass through the solution type edge backwards, and must pass back through the cause or might cause type edge, in order to continue moving forward in the course of the exploration.

2.8. Semantic Comparison

In injection molding expertise, there are many phrases that have multiple expressions with the same semantics. For example, although “flash” and “burrs” have a very low text similarity, they express the same semantics. When retrieving the knowledge graph, if the corresponding nodes cannot be found, according to the semantics of the keywords input by the user, the convenience of the retrieval system will be reduced.
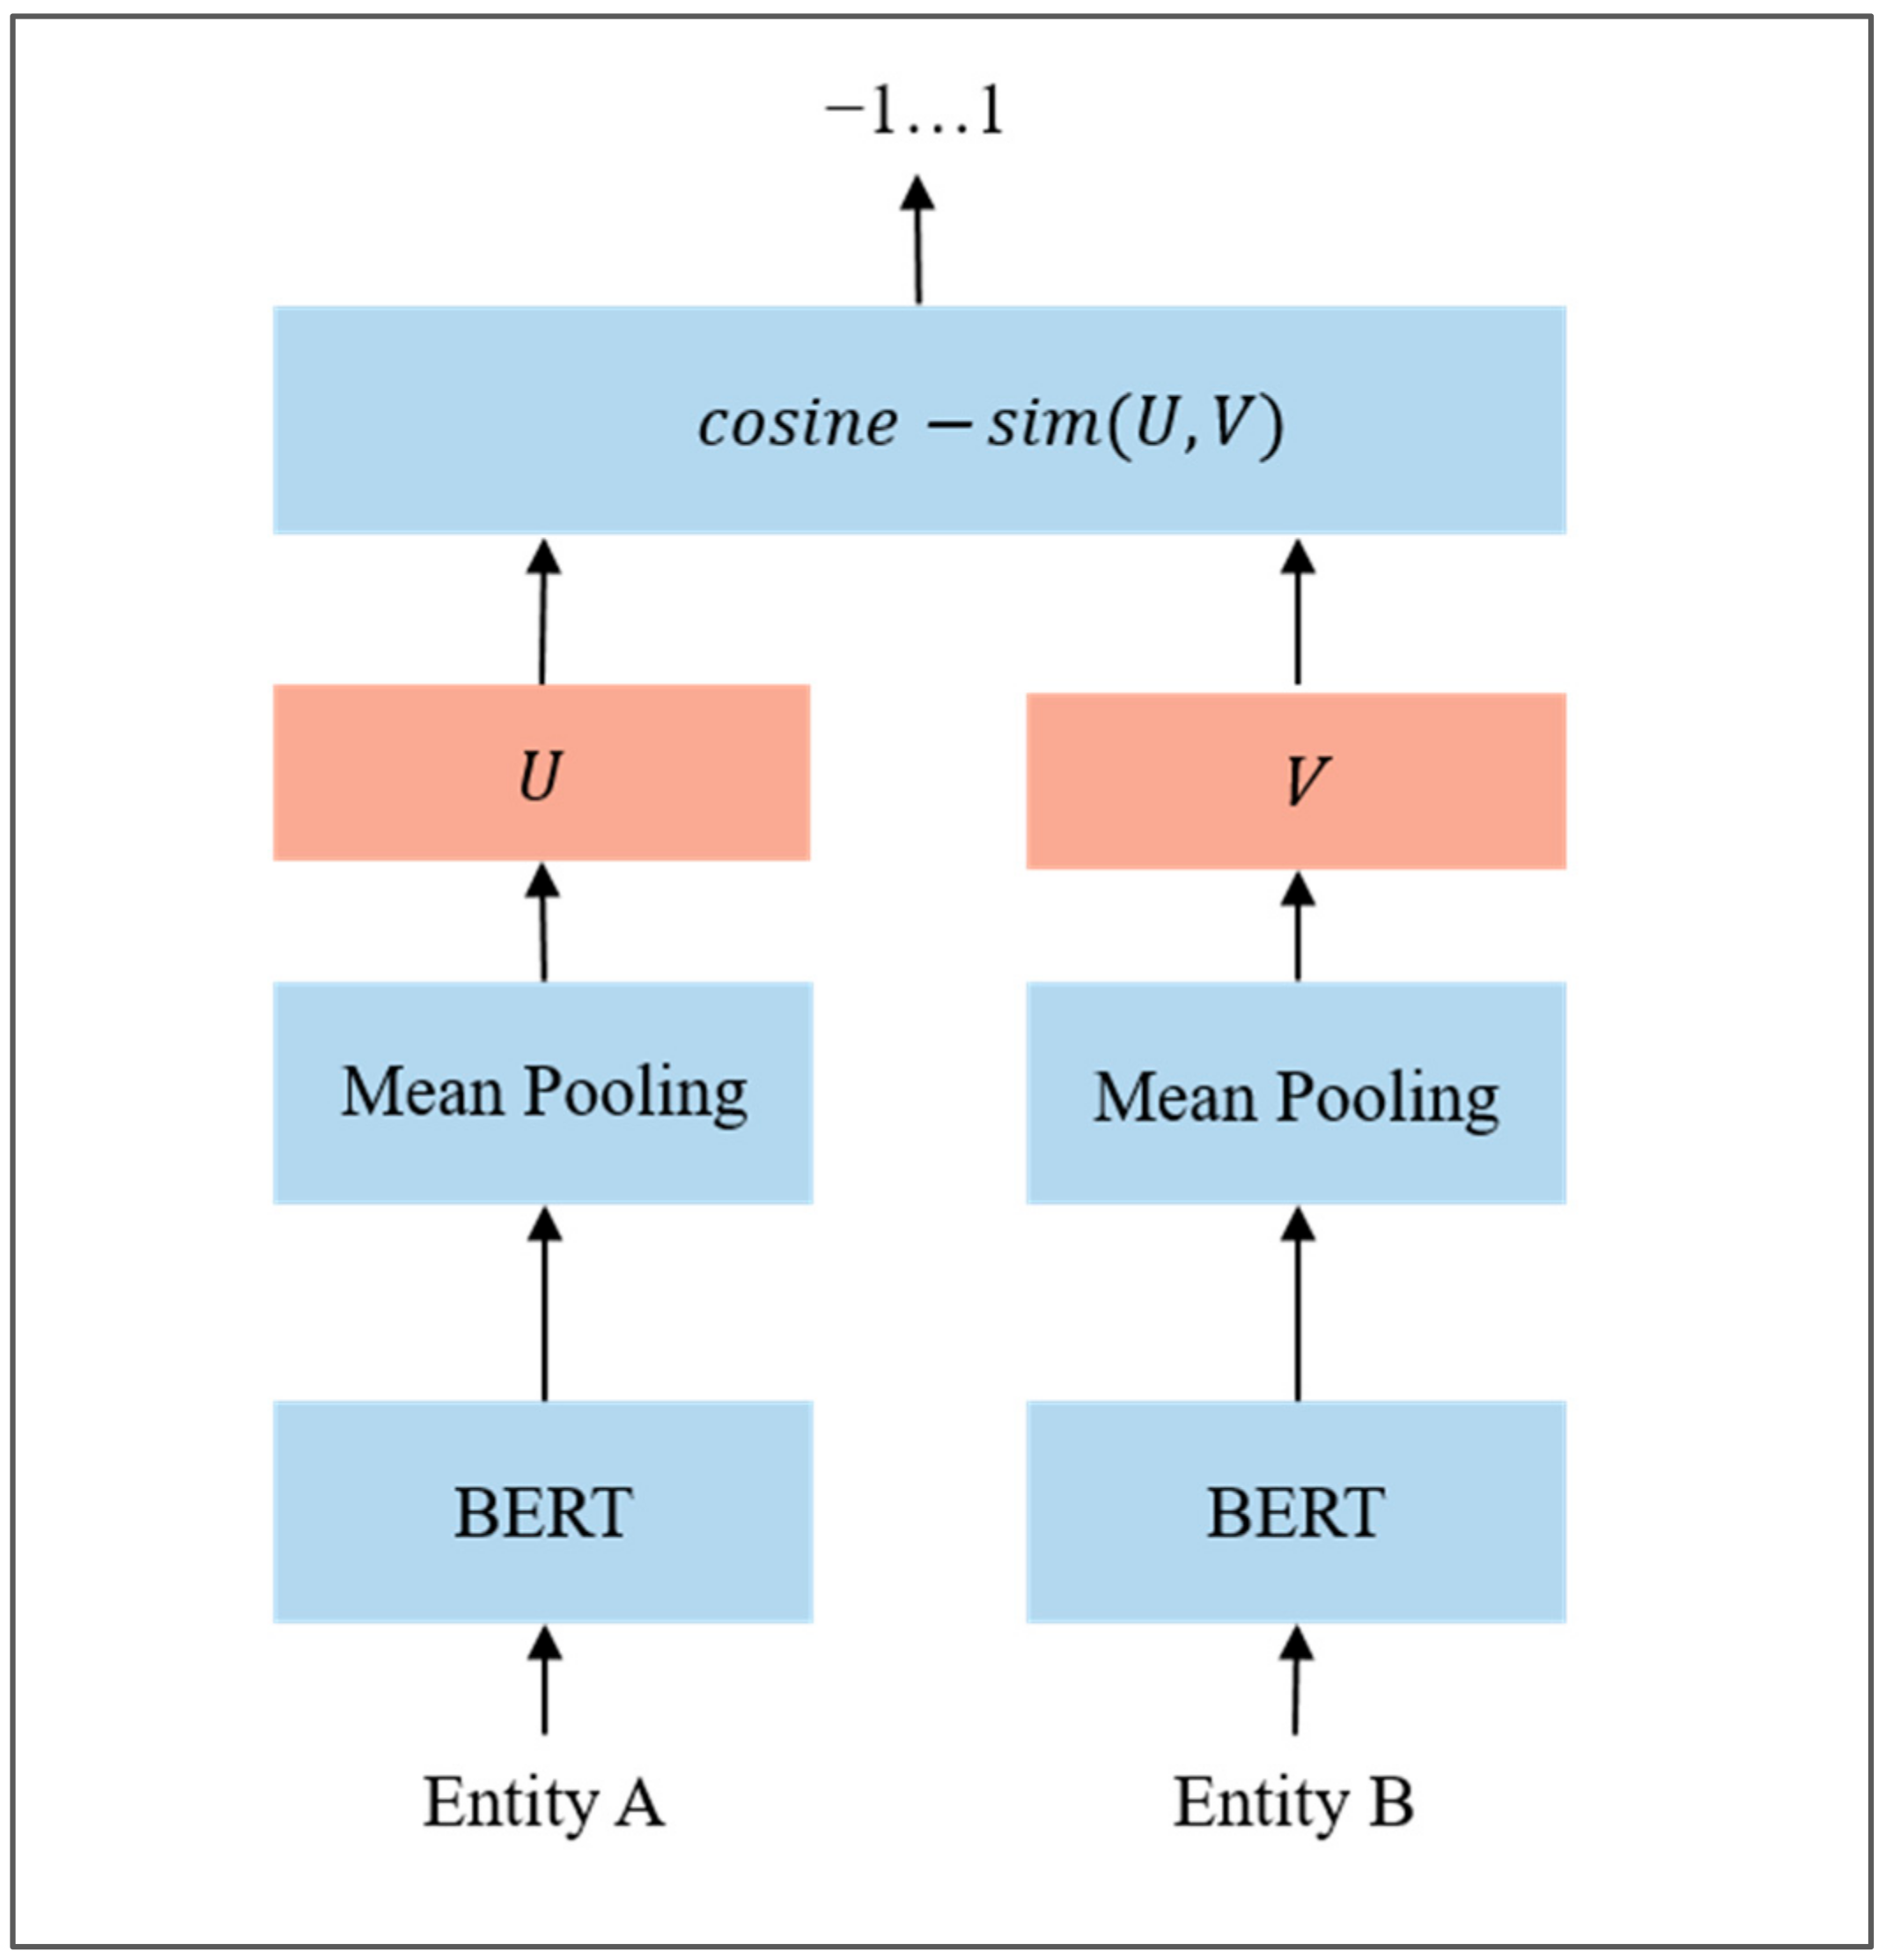
This study uses SBERT (Sentence-BERT) for the semantic similarity comparison. Figure 11 shows the model structure of SBERT. When the model receives the entity pair, it will extract the text features of the two through BERT, and project the text feature to the vector space through mean pooling and calculate the cosine similarity of the entity pair in the vector space, semantically similar entity pairs have a higher cosine similarity, and vice versa.
In this study, 1400 semantic comparison training data were prepared to train SBERT, and the model was trained 200 times using the mean square error (MSE) of the cosine similarity as the loss value and the learning rate was set to 0.001. The cosine similarity of 0.7 is the threshold for judging whether the entity pair has similar semantics. If the cosine similarity between the two is higher than the threshold, it can be considered that the two have similar semantics. The trained model achieved an accuracy of 0.92 in the 100 validation data.
This study uses Python Flask to build a web-based search interface. Users can enter keywords through the search interface to find the relevant knowledge. If the user inputs “short shot”, the system will use SBERT to find a node with a semantic similar to the short shot and use it as the starting node of the search engine to search the graph. The search results will be visualized in the interface, in the form of a graph through the Vis.js network. The Vis.js network provides operations, such as dragging, zooming, and clicking on the graph, which can help users to clearly view the search results.

3. Results and Discussion

3.1. Discussion of the Actual Cases

The actual search results of the problem, the problem-causes, the phenomena, and the action nodes are discussed, as follows.

3.1.1. Problem Search Result

Figure 12 shows the search results for “burrs”. Through SBERT, the search engine finds the node “Flash” with similar semantics to burrs, and uses it as the starting node of the search engine. The search engine found 13 action nodes related to the flash problem in the graph, which were classified into causative action and solving action. This result shows that the actions of the increased injection volume, increased injection pressure, reduced clamping force, and reduced mold plate thickness and mold rigidity, could induce a flash. Additionally, the actions of the reduced injection volume, reduced injection pressure, reduced back pressure, increased clamping force, and increased mold plate thickness and mold rigidity, could resolve the flash problem. Therefore, among the process parameters, the injection volume, injection pressure, back pressure, and clamping force are the factors correlated with flash, while mold plate thickness and mold rigidity are correlated with the flash among the non-processed parameters.
From this, it can be seen that the search engine can find out the relevant factors of the defect, and summarize the reasons and corresponding solutions. Through the search results, the user can clearly understand the motivation of the various solutions, and select a suitable solution, according to the site conditions.

3.1.2. Phenomenon Search Result

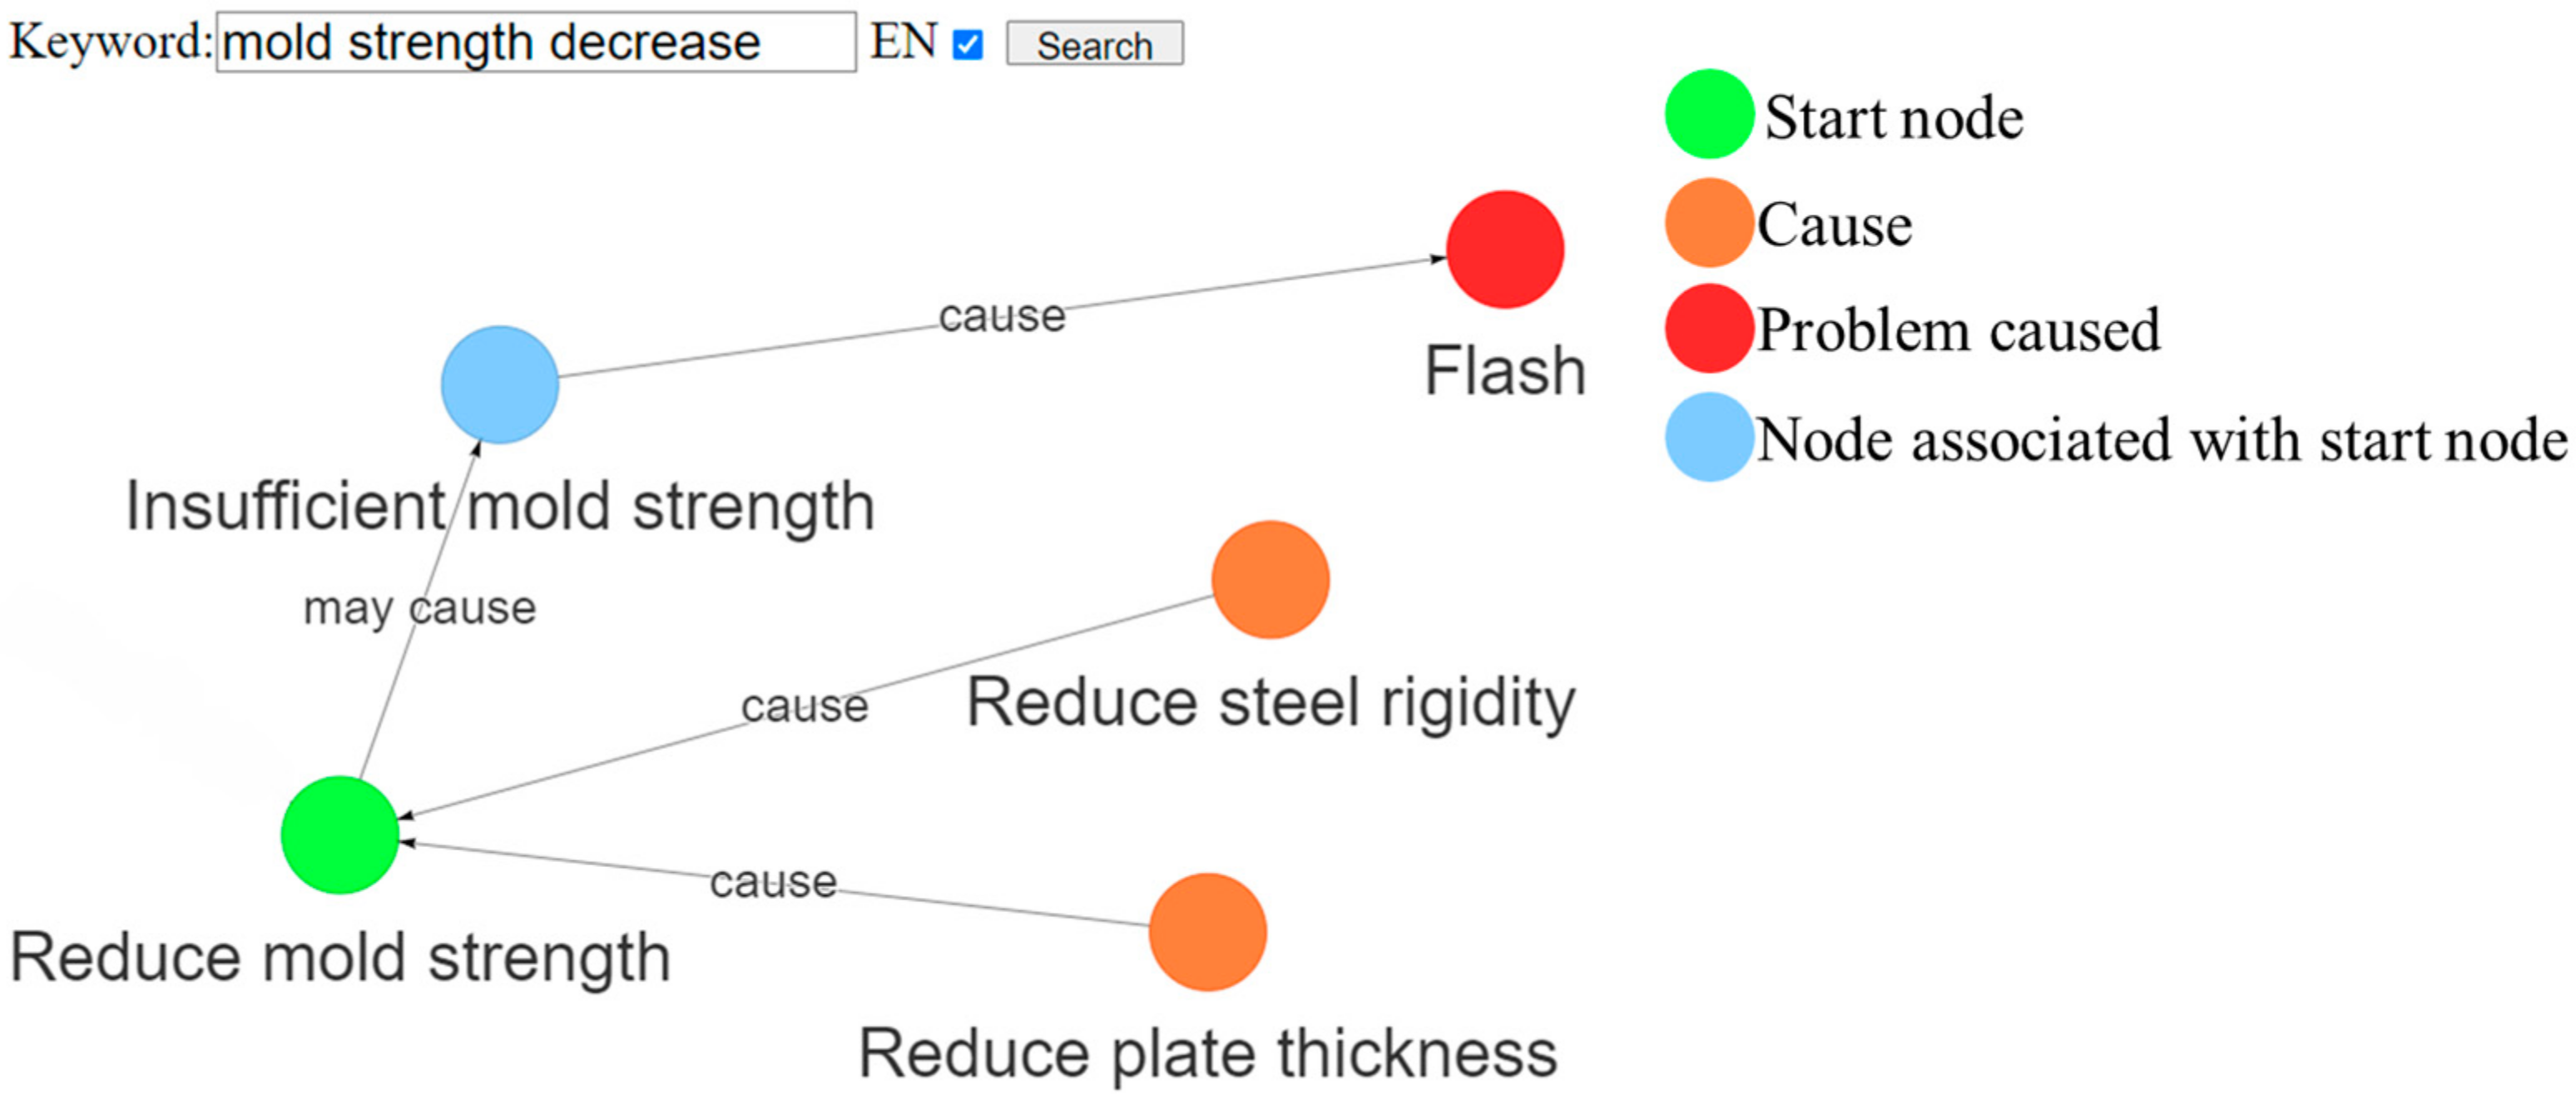
Figure 13 shows the result of searching for “mold strength decrease”. From the search results, SBERT successfully finds nodes in the graph that have similar semantics to the search keywords. At the same time, it can also be known that reducing the thickness of the template and the rigidity of the mold will reduce the strength of the mold, and it is known that this phenomenon may lead to the occurrence of burrs. From the above case, we know that the search engine can find out what is the cause of the phenomenon, how to deal with it, and the impact of the phenomenon. When a phenomenon occurs in the manufacturing process in the future, the user can find out the impact of the phenomenon through the search engine, and judge whether it needs to be excluded immediately, and if so, it can be handled, according to the solution provided by the search engine.

3.1.3. Action Search Result

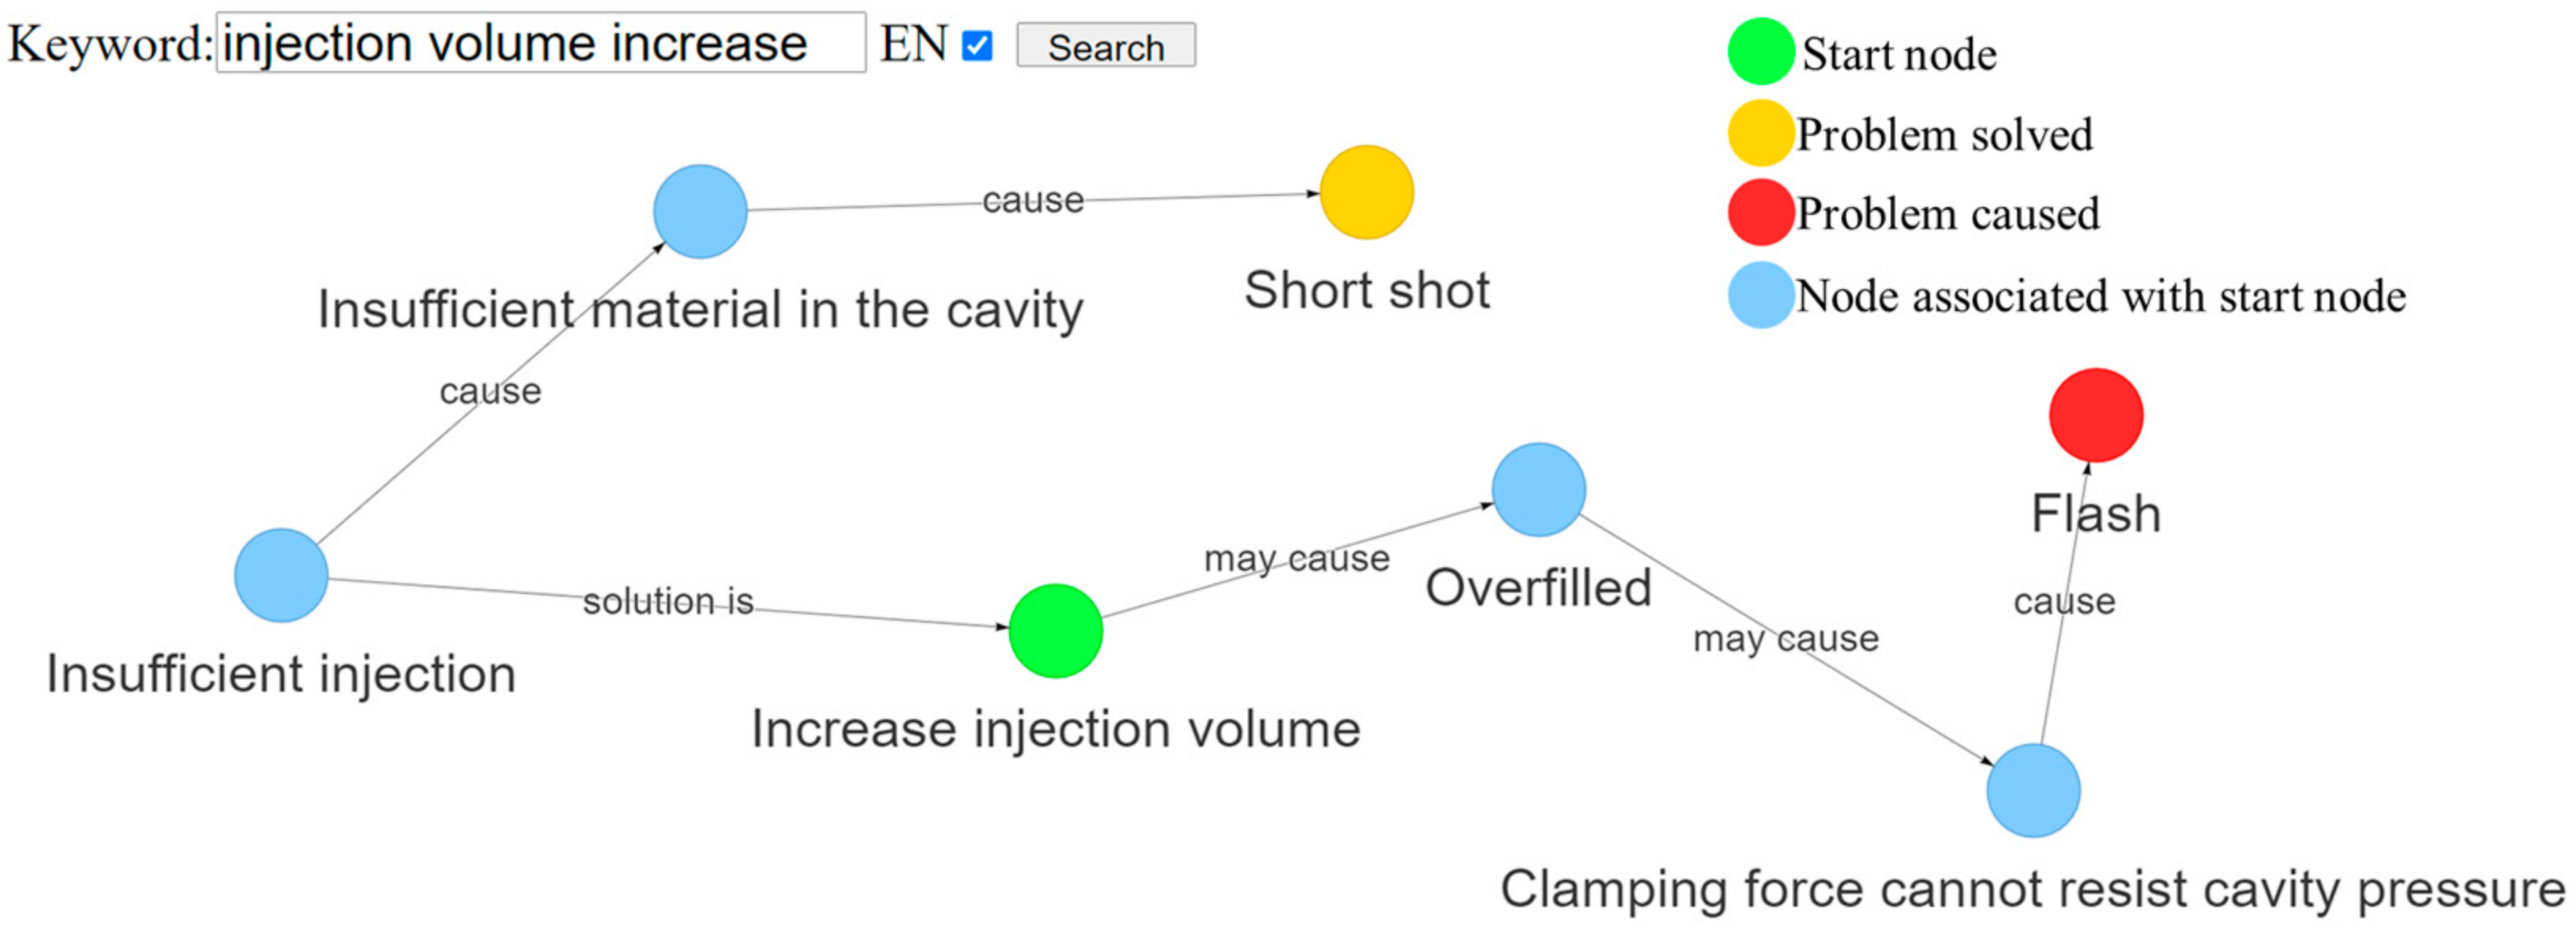
Figure 14 shows the search results by entering “injection volume increase”. From the search results, it can be found that increasing the injection dose can improve the situation of short shots, but at the same time, it may also cause the problem of burrs. Through the search engine, we can find the impact caused by the action and the problems it can improve, and the user can clearly understand the impact caused by the action through the search engine before executing the action.

3.2. Search Efficiency

This study used the F1_Score as the search efficiency evaluation index. The F1_Score consists of the measurement score calculated by considering the TP, FP, and FN of the search results, as shown in Equation (1). Table 1 shows the search performance comparison results of the search engine constructed in this study and Neo4j’s Cypher in different search depths. According to the performance of Neo4j’s Cypher in different search depths, the search method, using Neo4j’s Cypher, could not have a satisfactory performance in the different search depths, because the injection molding knowledge was composed of an unfixed quantity of triples, thus, it was impossible to obtain the complete knowledge by setting a fixed search length. If the search depth was increased, while the complete injection molding knowledge might be found, the search result would contain excessive non-associated nodes, leading to a low search performance. The F1_Score of the search engine constructed in this study was 1.0 in most search tests, which proves that the search engine constructed in this study can filter non-associated nodes, and find the complete injection molding knowledge.
F1_Score = TP/(TP + 1/2 (FP + FN))
TP: Number of associated nodes in the search results.
FP: Number of non-associated nodes in the search results.
FN: Number of associated nodes not in the search results.
In addition to using the search engine constructed in this study to find the complete injection molding knowledge, and to filter the non-associated nodes, the Neo4j Cypher should be combined with manual filtering. Therefore, this study used the search engine and Neo4j’s Cypher + manual filtering to find all of the associated nodes, and the required time of the two methods was compared.
Table 2 shows the comparison results. It was observed that using a search engine to retrieve the graph can save a lot of time in comparison to Neo4j’s Cypher + manual filtering, and the knowledge retrieval efficiency was increased.

3.3. Graph Expansion

In order to validate whether the search engine can maintain its efficiency as the scale of the knowledge graph is increased, this study proposed several cases for discussion.

3.3.1. Case 1

As shown in Figure 15, the phenomenon node A and problem node B were created in the graph and connected by the cause type edge to express that phenomenon A will cause problem B. This study discussed the feedback result of problem B, as searched using the search engine, in the given condition that phenomenon A was induced by the reduced mold strength, thus, phenomenon A could be improved by increasing the mold strength.
Figure 16 shows the search result of node B; it was observed that both the reduced mold steel rigidity and reduced mold plate thickness could induce phenomenon A, and then, induce problem B. Thus, increasing the mold steel rigidity and mold plate thickness could improve phenomenon A to solve problem B. From the above cases, we can verify that if the problem nodes or phenomenon nodes are added to the graph in the future, the search engine can still maintain its performance and find the relevant knowledge, according to the graph structure.

3.3.2. Case 2

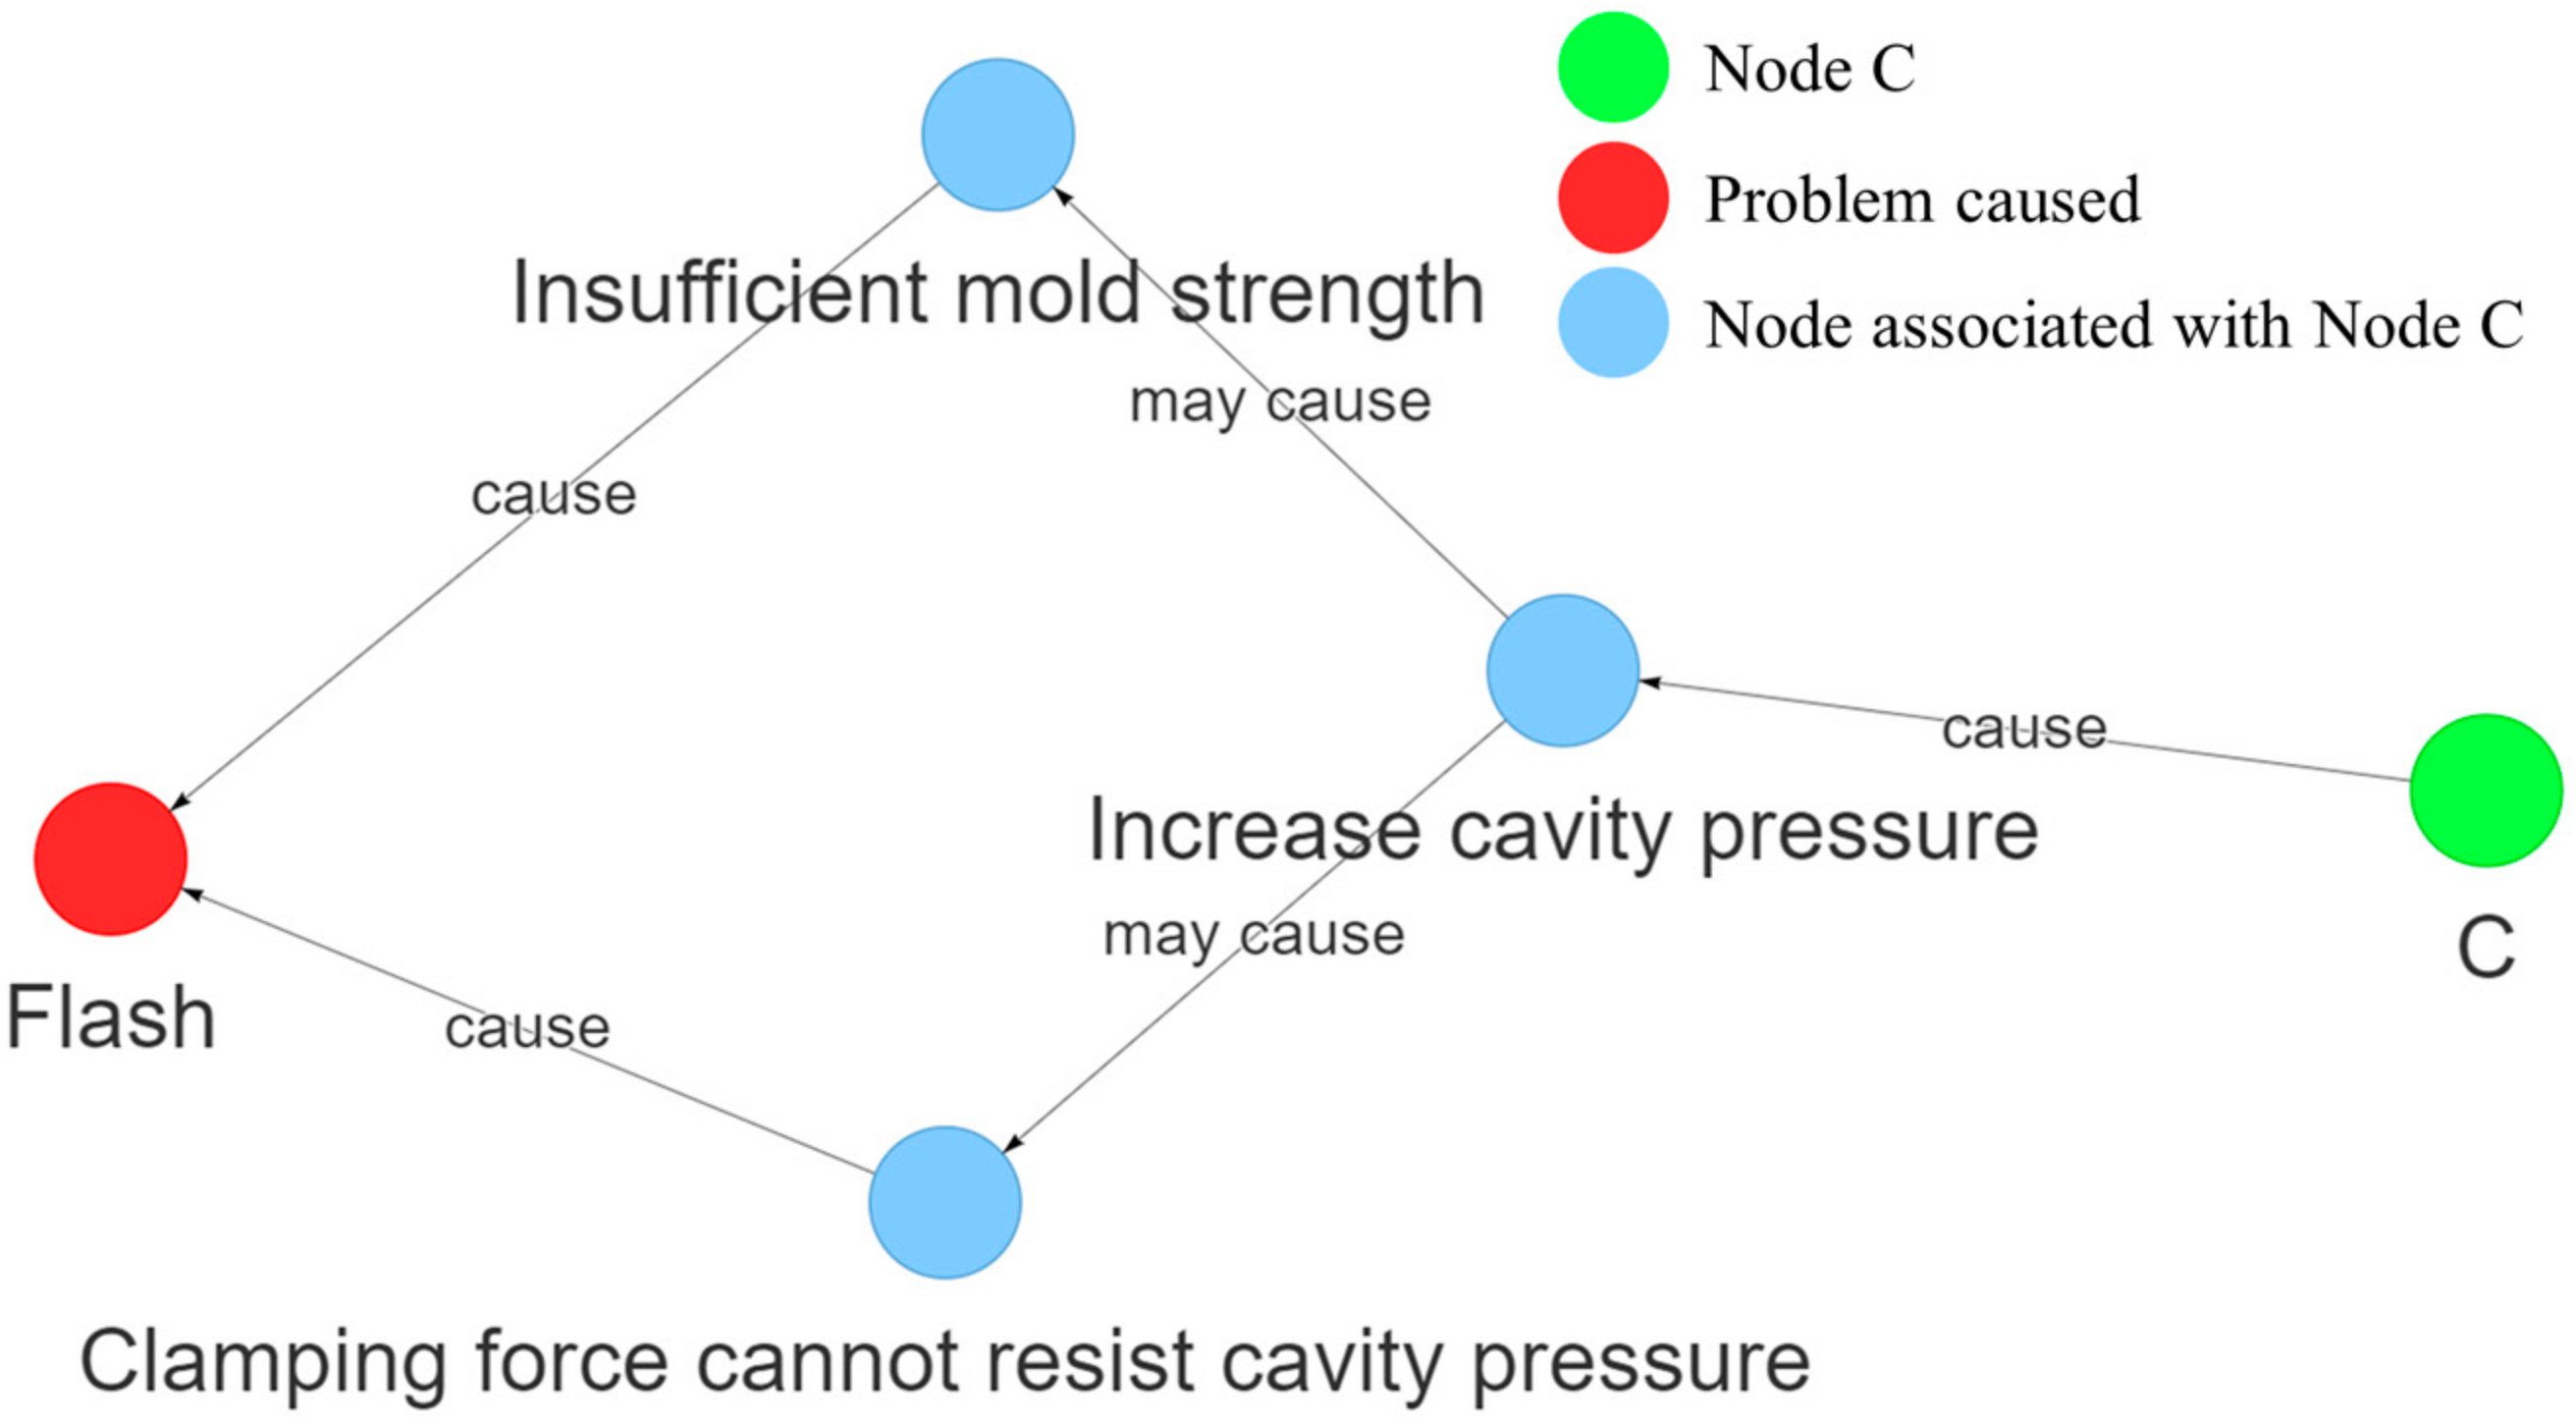
As shown in Figure 17, action node C was created in the graph, and the action would increase the cavity pressure.
Figure 18 shows the search result of node C; it was observed that node C might induce the condition of an insufficient mold strength, thus, the clamping force could not resist the cavity pressure, which would eventually lead to a flash. Through this case, we can verify that if a new action node is added to the graph in the future, the search engine can still find out its impact.

4. Conclusions

This study expresses the complex injection molding knowledge in the form of a knowledge graph, and combined SBERT and a self-developed search engine for users to search the graph. The search engine can import the corresponding search logic to search the graph, according to the type of the starting node, find out the cause and solution of the problem, and also the impact of the action and the phenomenon.
By observing the actual search result of the system in different cases, we prove that through the visualization of the search result, the system can clearly display the relationship between each node. Users can quickly understand the complex knowledge of injection molding through the system, clearly understand the causes of defects in different aspects and the motivation of each solution, and select the appropriate solution, according to the site conditions. In addition, users can also view the cause and improvement of the phenomena in the process and their impact through the knowledge graph, and can also find out the impact of the action.
We also checked the performance of the search engine by calculating the F1_Score and the searching time under different tests. The results show that in nine tests, the F1_Score of the search engine is 1.0, and the search time was within 0.5 s in all three tests. Finally, we also used two cases to verify that the search engine can still maintain its performance when the graph is expanded in the future. In addition, we also tested our SBERT model, the model achieved an accuracy of 0.92 in 100 tests, and demonstrated its effectiveness in the actual cases. In this study, we showed the effectiveness of a knowledge graph for clarifying the injection molding knowledge. Different from the previous methods, we can understand the impact of various factors on product quality through a knowledge graph. When personnel face product defects in the future, they can reduce their reliance on experience and historical data, and improve the defects with a full understanding of the principles. At the same time, our research can also confirm the potential of a knowledge graph in the field of injection molding.

Author Contributions

Conceptualization, Z.-W.Z. and W.-R.J.; methodology, Z.-W.Z. and Y.-H.T.; software, Z.-W.Z.; validation, Z.-W.Z. and W.-R.J.; data curation, Z.-W.Z.; writing—original draft preparation, Z.-W.Z. and Y.-H.T.; writing—review and editing, Y.-H.T., W.-R.J. and M.-C.C.; visualization, Z.-W.Z.; supervision, Y.-H.T., W.-R.J. and M.-C.C. All authors have read and agreed to the published version of the manuscript.

Funding

This research received no external funding.

Institutional Review Board Statement

Not applicable.

Informed Consent Statement

Not applicable.

Conflicts of Interest

The authors declare no conflict of interest.

References

  1. Jong, W.R.; Wu, C.H.; Li, M.Y. Web-based navigating system for conceptual mould design with knowledge management. Int. J. Prod. Res. 2010, 49, 553–567. [Google Scholar] [CrossRef]
  2. Jong, W.R.; Ting, Y.H.; Li, T.C.; Chen, K.Y. An integrated application for historical knowledge management with mould design navigating process. Int. J. Prod. Res. 2012, 51, 3191–3205. [Google Scholar] [CrossRef]
  3. Khosravani, M.R.; Nasiri, S.; Weinberg, K. Application of case-based reasoning in a fault detection system on production of drippers. Appl. Soft Comput. 2018, 75, 227–232. [Google Scholar] [CrossRef]
  4. Mikos, W.L.; Ferreira, J.C.E.; Gomes, F.G.C. A distributed system for rapid determination of nonconformance causes and solutions for the thermoplastic injection molding process: A Case-Based Reasoning Agents approach. In Proceedings of the 2011 IEEE International Conference on Automation Science and Engineering, Trieste, Italy, 24–27 August 2011; pp. 755–760. [Google Scholar]
  5. Khosravani, M.R.; Nasiri, S.; Reinicke, T. Intelligent knowledge-based system to improve injection molding process. J. Ind. Inf. Integr. 2022, 25, 100275. [Google Scholar] [CrossRef]
  6. Mathivanan, D.; Nouby, M.; Vidhya, R. Minimization of sink mark defects in injection molding process—Taguchi approach. Int. J. Eng. Sci. Technol. 2010, 2, 13–22. [Google Scholar] [CrossRef]
  7. Altan, M. Reducing shrinkage in injection moldings via the Taguchi, ANOVA and neural network methods. Mater. Des. 2010, 31, 599–604. [Google Scholar] [CrossRef]
  8. Utomo, A.P.; Bintara, R.D.; Suprayitno. Optimization Injection Molding Parameters of Polypropylene Materials to Minimize Product Not Complete Defects Using the Taguchi Method. Proc. Int. Conf. Relig. Sci. Educ. 2022, 1, 605–611. [Google Scholar]
  9. Yin, F.; Mao, H.; Hua, L.; Guo, W.; Shu, M. Back Propagation neural network modeling for warpage prediction and optimization of plastic products during injection molding. Mater. Des. 2011, 32, 1844–1850. [Google Scholar] [CrossRef]
  10. Kurtaran, H.; Ozcelik, B.; Erzurumlu, T. Warpage optimization of a bus ceiling lamp base using neural network model and genetic algorithm. J. Mater. Process. Technol. 2005, 169, 314–319. [Google Scholar] [CrossRef]
  11. Zhang, Y.; Sheng, M.; Zhou, R.; Wang, Y.; Han, G.; Zhang, H.; Xing, C.; Dong, J. HKGB: An Inclusive, Extensible, Intelligent, Semi-auto-constructed Knowledge Graph Framework for Healthcare with Clinicians’ Expertise Incorporated. Inf. Process. Manag. 2020, 57, 102324. [Google Scholar] [CrossRef]
  12. Kim, H. Chapter 5—A knowledge graph of medical institutions in Korea. In Web Semantic; Jain, S., Jain, V., Balas, V.E., Eds.; Academic Press: Cambridge, MA, USA, 2021; pp. 55–68. [Google Scholar]
  13. Jiang, Y.; Gao, X.; Su, W.; Li, J. Systematic Knowledge Management of Construction Safety Standards Based on Knowledge Graphs: A Case Study in China. Environ. Res. Public Health 2021, 18, 10692. [Google Scholar] [CrossRef]
  14. Shi, Y.-X.; Zhang, B.-K.; Wang, Y.-X.; Luo, H.-Q.; Li, X. Constructing Crop Portraits Based on Graph Databases Is Essential to Agricultural Data Mining. Information 2021, 12, 227. [Google Scholar] [CrossRef]
  15. Lee, J.W.; Park, J. An Approach to Constructing a Knowledge Graph Based on Korean Open-Government Data. Appl. Sci. 2019, 9, 4095. [Google Scholar] [CrossRef] [Green Version]
  16. Yan, J.; Lv, T.; Yu, Y. Construction and Recommendation of a Water Affair Knowledge Graph. Sustainability 2018, 10, 3429. [Google Scholar] [CrossRef] [Green Version]
  17. Chi, Y.; Yu, C.; Qi, X.; Xu, H. Knowledge Management in Healthcare Sustainability: A Smart Healthy Diet Assistant in Traditional Chinese Medicine Culture. Sustainability 2018, 10, 4197. [Google Scholar] [CrossRef] [Green Version]
  18. Zhang, C.; Zhou, G.; Lu, Q.; Chang, F. Graph-based knowledge reuse for supporting knowledge-driven decision-making in new product development. Int. J. Prod. Res. 2017, 55, 7187–7203. [Google Scholar] [CrossRef]
  19. Park, S.; Lee, W.; Choe, B.; Lee, S.G. A Survey on Personalized PageRank Computation Algorithms. IEEE Access 2019, 7, 163049–163062. [Google Scholar] [CrossRef]
  20. Gao, H.; Miao, L.; Liu, J.; Dong, K.; Lin, X. Construction and Application of Knowledge Graph for Power System Dispatching. In Proceedings of the 7th International Forum on Electrical Engineering and Automation (IFEEA), Hefei, China, 25–27 September 2020. [Google Scholar]
  21. Su, X.; He, J.; Ren, J.; Peng, J. Personalized Chinese Tourism Recommendation Algorithm Based on Knowledge Graph. Appl. Sci. 2022, 12, 10226. [Google Scholar] [CrossRef]
  22. Zhang, J.; Song, Z. Research on knowledge graph for quantification of relationship between enterprises and recognition of potential risks. In Proceedings of the 2019 4th IEEE International Conference on Cybernetics, Tokyo, Japan, 27–30 September 2019. [Google Scholar]
  23. Huang, H.; Chen, Y.; Lou, B.; Hongzhou, Z.; Wu, J.; Yan, K. Constructing Knowledge Graph from Big Data of Smart Grids. In Proceedings of the 2019 10th International Conference on Information Technology in Medicine and Education (ITME), Qingdao, China, 23–25 August 2019. [Google Scholar]
  24. Haussmann, S.; Seneviratne, O.; Chen, Y.; Ne’eman, Y.; Codella, J.; Chen, C.H.; McGuinness, D.L.; Zaki, M.J. FoodKG: A Semantics-Driven Knowledge Graph for Food Recommendation. In International Semantic Web Conference: The Semantic Web—ISWC 2019; Springer: Cham, Switzerland, 2019; pp. 146–162. [Google Scholar]
  25. Liu, J.; Schmid, F.; Li, K.; Zheng, W. A knowledge graph-based approach for exploring railway operational accidents. Reliab. Eng. Syst. Saf. 2021, 207, 107352. [Google Scholar] [CrossRef]
  26. Zehra, S.; Mohsin, S.F.M.; Wasi, S.; Jami, S.I.; Siddiqui, M.S.; Syed, M.K.R. Financial Knowledge Graph Based Financial Report Query System. IEEE Access 2021, 9, 69766–69782. [Google Scholar] [CrossRef]
  27. Acikalin, U.U.; Bardak, B.; Kutlu, M. Turkish Sentiment Analysis Using BERT. In Proceedings of the 28th Signal Processing and Communications Applications Conference, Gaziantep, Turkey, 5–7 October 2020; pp. 1–4. [Google Scholar]
  28. Mozafari, M.R.; Farahbakhsh, R.; Crespi, N. A BERT-Based Transfer Learning Approach for Hate Speech Detection in Online Social Media. In Proceedings of the 8th International Conference on Complex Networks and Their Applications COMPLEX NETWORKS, Lisbon, Portugal, 10–12 December 2019; Volume 1, pp. 928–940. [Google Scholar]
  29. Dang, J.; Wei, H.; Yan, Y.; Jia, R.; Li, Y. Construction of Knowledge Graph of Electrical Equipment Based on Sentence—BERT. In Proceedings of the 2021 International Conference on Advanced Electrical Equipment and Reliable Operation, Beijing, China, 15–17 October 2021; pp. 1–5. [Google Scholar]
  30. Casillas, R.; Gómez-Adorno, H.; Lomas-Barrie, V.; Ramos-Flores, O. Automatic Fact Checking Using an Interpretable Bert-Based Architecture on COVID-19 Claims. Appl. Sci. 2022, 12, 10644. [Google Scholar] [CrossRef]
  31. Introducing the Knowledge Graph: Things, Not Strings. Available online: https://blog.google/products/search/introducing-knowledge-graph-things-not/ (accessed on 21 December 2021).
  32. Guia, J.; Soares, V.G.; Bernardino, J. Graph Databases: Neo4j Analysis. Int. Conf. Enterp. Inf. Syst. 2017, 1, 351–356. [Google Scholar]
  33. Devlin, J.; Chang, M.W.; Lee, K.; Toutanova, K. Bert: Pre-training of deep bidirectional transformers for language understanding. In Proceedings of the 2019 Conference of the North American Chapter of the Association for Computational Linguistics: Human Language Technologies, Minneapolis, MN, USA, 2–7 June 2019. [Google Scholar]
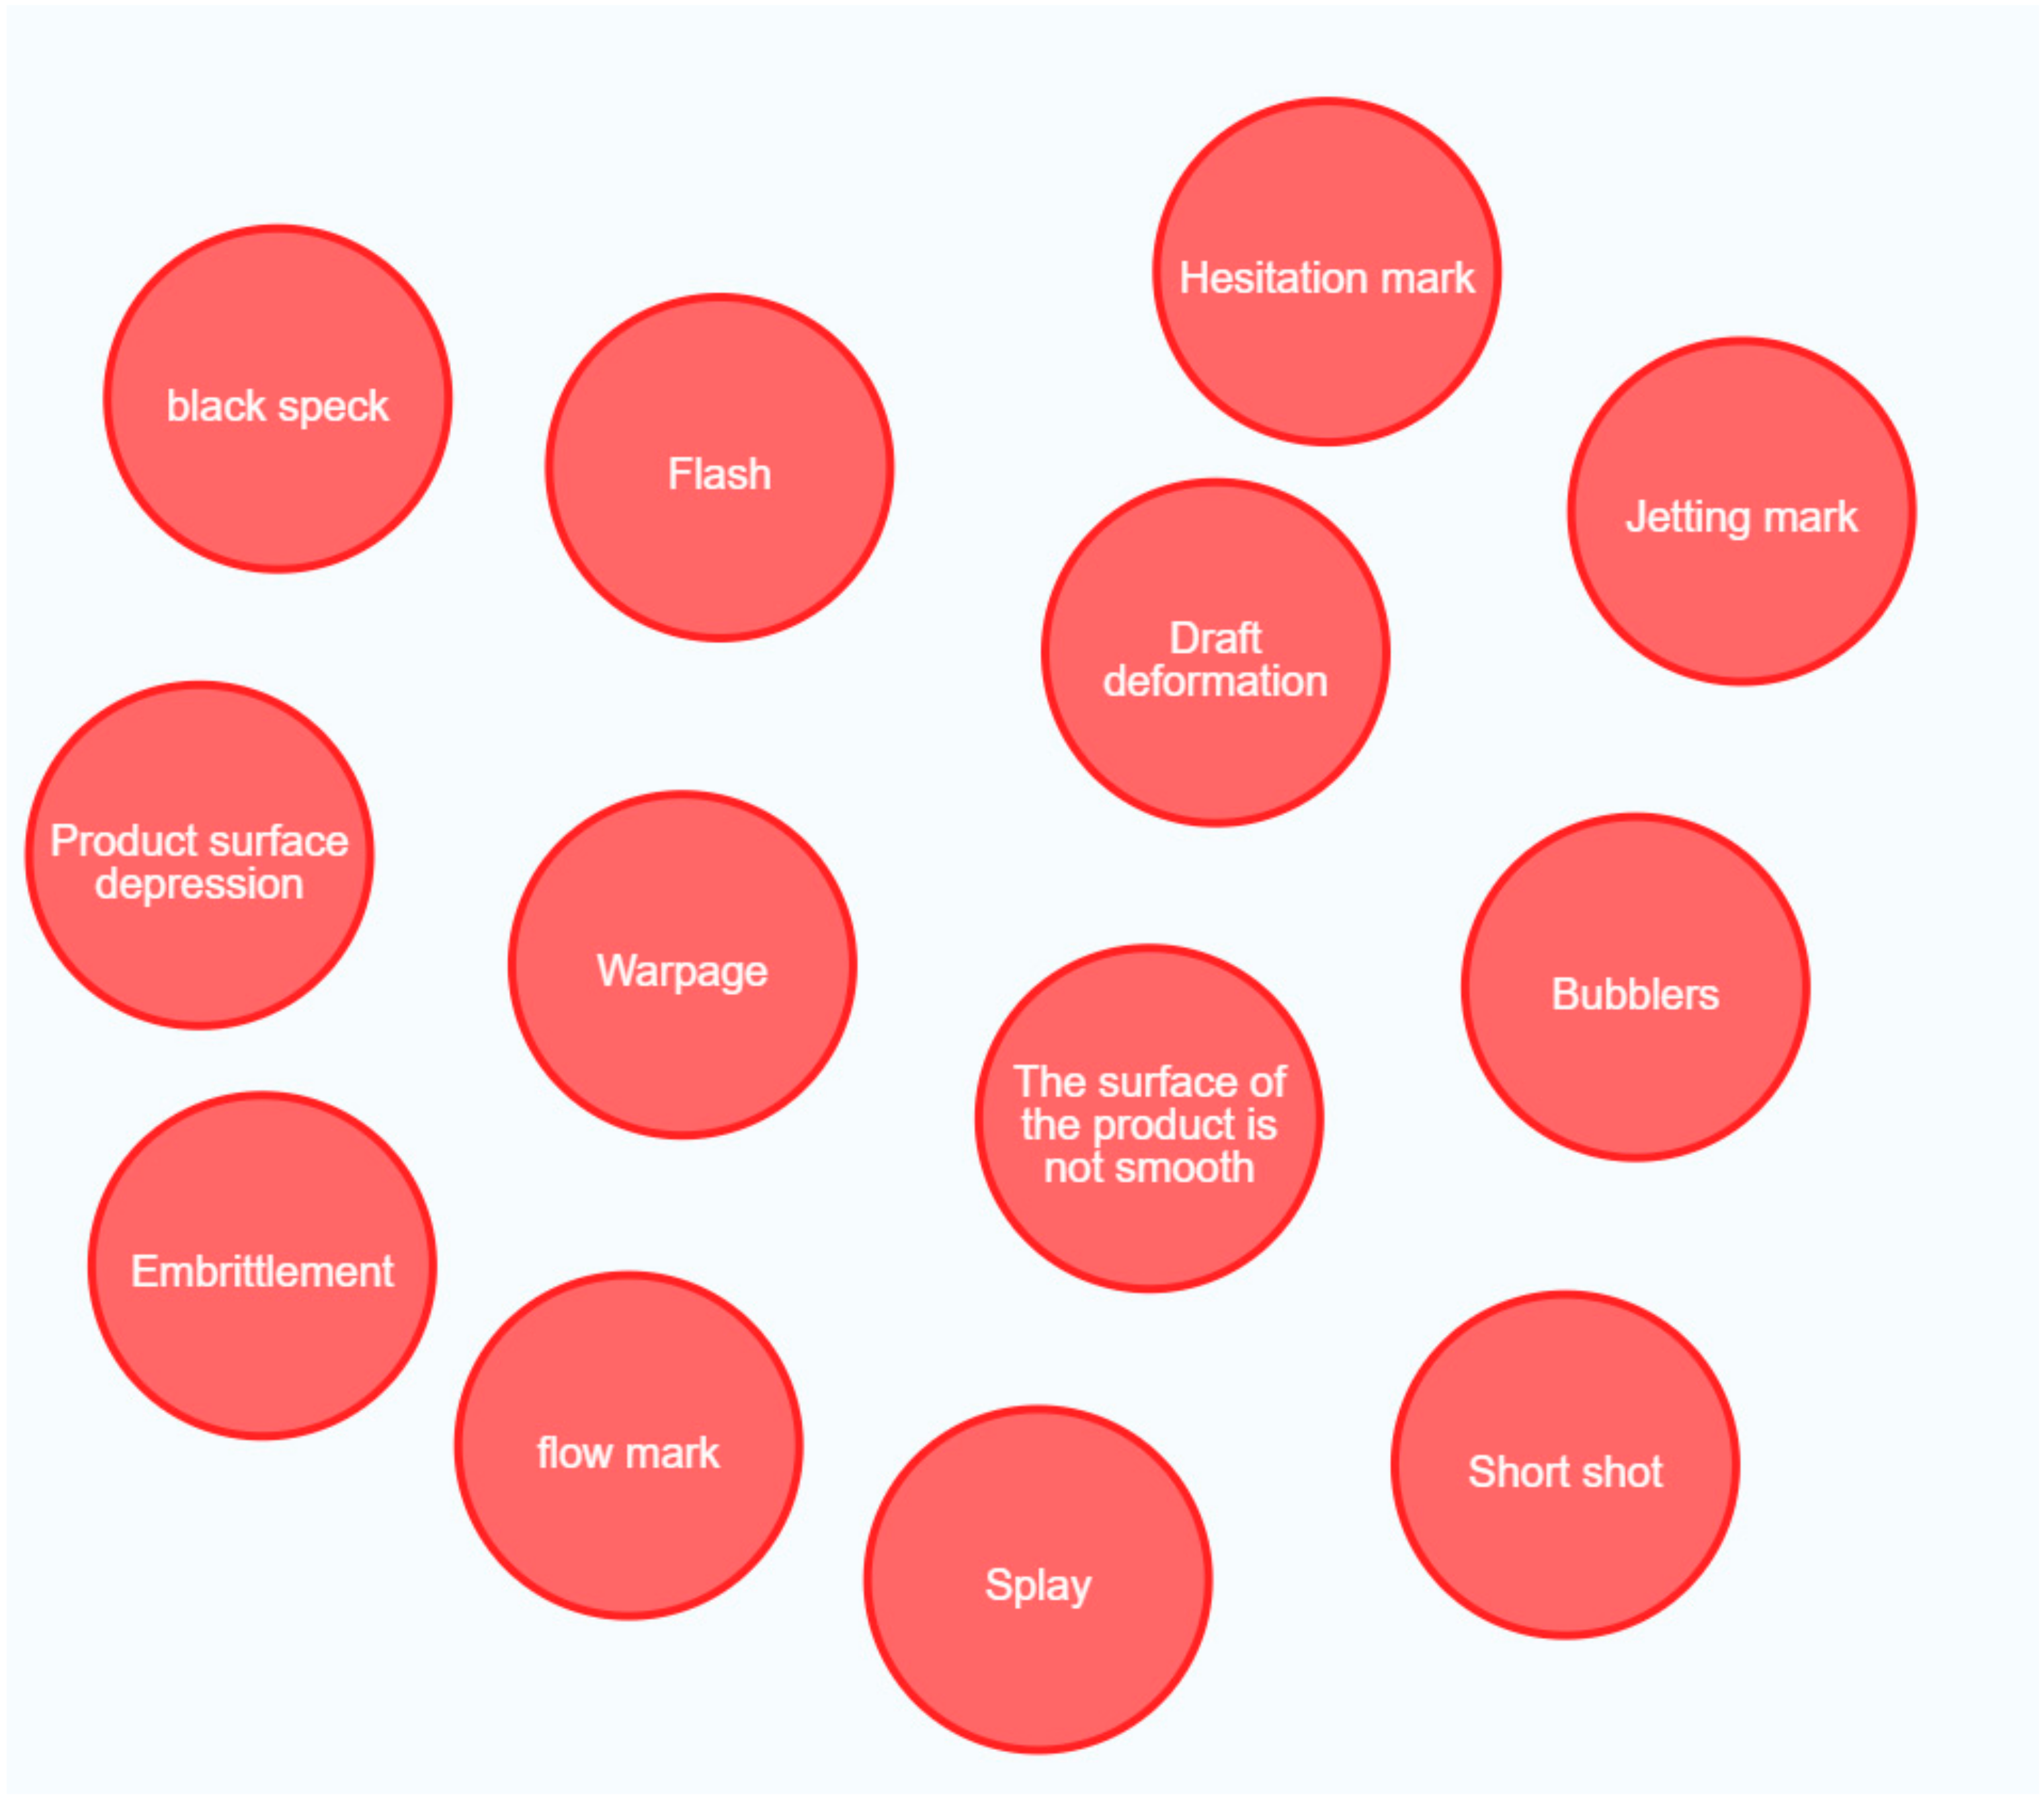
Figure 1. Problem nodes.
Applsci 12 11888 g001
Figure 2. Phenomenon Nodes.
Applsci 12 11888 g002
Figure 3. Action Nodes.
Applsci 12 11888 g003
Figure 4. Injection molding knowledge graph.
Applsci 12 11888 g004
Figure 5. Principles of search engines.
Applsci 12 11888 g005
Figure 6. Problem search logic.
Applsci 12 11888 g006
Figure 7. Schematic diagram of the action node classification.
Applsci 12 11888 g007
Figure 8. Phenomenon node search logic.
Applsci 12 11888 g008
Figure 9. Schematic diagram of the problem node classification.
Applsci 12 11888 g009
Figure 10. Action node search logic.
Applsci 12 11888 g010
Figure 11. SBERT model architecture.
Applsci 12 11888 g011
Figure 12. Problem node search result.
Applsci 12 11888 g012
Figure 13. Phenomenon node search result.
Applsci 12 11888 g013
Figure 14. Action node search result.
Applsci 12 11888 g014
Figure 15. Case 1.
Figure 15. Case 1.
Applsci 12 11888 g015
Figure 16. Search result of case 1.
Applsci 12 11888 g016
Figure 17. Case 2.
Figure 17. Case 2.
Applsci 12 11888 g017
Figure 18. Search result of case 2.
Applsci 12 11888 g018
Table 1. Search performance comparison.
Node TypeNode NameTotal Number of Associated NodesComparison
F1_Score of the Rule Based Search EngineF1_Score of the Neo4j Cypher (Search Depth = 3)F1_Score of the Neo4j Cypher (Search Depth = 5)
ProblemFlash261.0000.7210.366
ProblemSplay511.0000.6490.415
ProblemShort shot871.0000.4920.697
PhenomenonReduce the flow resistance301.0000.5650.282
PhenomenonReduce the plastic temperature361.0000.4580.310
PhenomenonIncrease the venting capacity of the mold171.0000.4150.159
ActionDecrease the mold temperature301.0000.4560.282
ActionIncrease the coolant flow rate211.0000.4260.237
ActionIncrease the nozzle temperature301.0000.5420.339
Table 2. Search time comparison.
Node TypeNode NameTotal Number of Associated NodesSearching Time of
The Rule Based Search Engine (s)
Searching Time of the Neo4j Cypher + Manual Filtering (s)
ProblemFlash260.225100
PhenomenonReduce the plastic temperature360.50150
ActionIncrease the coolant flow rate210.34997
Publisher’s Note: MDPI stays neutral with regard to jurisdictional claims in published maps and institutional affiliations.