Article

Optimization of Machining Parameters for Corner Accuracy Improvement for WEDM Processing

1
Department of Mechanical Engineering, National Chung Hsing University, Taichung 40227, Taiwan
2
Department of Mechanical Engineering, Chung Yuan Christian University, Taoyuan 320314, Taiwan
3
R&D Center for Smart Manufacturing, Chung Yuan Christian University, Taoyuan 320314, Taiwan
*
Author to whom correspondence should be addressed.
Appl. Sci. 2022, 12(20), 10324; https://doi.org/10.3390/app122010324
Submission received: 5 September 2022 / Revised: 11 October 2022 / Accepted: 12 October 2022 / Published: 13 October 2022
(This article belongs to the Special Issue Smart Machines and Intelligent Manufacturing)

Abstract

:
Corner accuracy occurring in wire electrical discharge machining (WEDM) is influenced by machining parameters such as wire vibration, wire lag, and excessive discharge, etc. This study proposed an optimization method which can improve the corner accuracy of the WEDM process. The parameters of pulse-on time (ON), pulse-off time (OFF), open circuit voltage (OV), servo voltage (SV), wire tension (WT), and flushing pressure (WA) were selected to investigate the influences of the major parameters on the machining accuracy in this study. Three different corner angles of 30°, 60°, and 90° were chosen for the verification experiments. The response surface methodology (RSM) was used to analyze and investigate the effect of each parameter on the corner error. After integrating the response surface value and algorithm, an optimization system with a friendly human–machine interface, which has a procedure guiding function, was developed with use of C# language. The system can predict the corner error and also recommend optimal machining parameters for smaller corner error and faster machining speed based on the original machining parameters. Finally, cutting experiments were conducted to verify the proposed system, and the results showed that the proposed method can effectively improve the corner accuracy by 39%, 20%, and 33%.

1. Introduction

Nowadays, with the rapid development of the mechanical processing industry, the requirements for processing materials and the manufacturing industry have been continuously improved, and the demand for materials with high hardness and high strength has also increased, especially for molds and dies. For such special hard materials, the use of traditional machining methods will speed up the reduction of tool life due to its hardness and strength [1]. Special alloy tools must be used to process them; however, it will result in high machining costs. The nontraditional machining method is an alternative to process hard materials. Wire electrical discharge machining (WEDM) is one nontraditional machining method that is suitable for processing material with high hardness and high strength. WEDM is a thermoelectric process to remove material from the workpiece by using electrical discharges (sparks) to obtain complex shapes with fine accuracy and dimensions. Corner accuracy, surface roughness, and machining speed for complex cutting are the main concerns in the WEDM machining process. The machining speed is usually expressed by the material removal rate and the surface machining speed. The main factors that affect the machining speed are workpiece material, workpiece thickness, dielectric fluid, and machining parameters. The electrical conductivity and thermal conductivity of the workpiece material will also affect the machining speed of WEDM. The larger the thickness of the workpiece, the larger the machining area, which increases the surface machining speed. However, as the distance between the upper and lower guides increases, the vibration of the wire also increases, which makes the straightness of the workpiece worse. Deionized water is used as dielectric fluid which acts not only as a flushing agent to wash away the debris created during cutting but also as a semiconductor between the workpiece and wire. In addition, it will maintain the stable condition to achieve machining accuracy and cutting speed.
The machining accuracy of WEDM is generally divided into shape accuracy and positioning accuracy. The shape accuracy mainly includes the corner machining accuracy and the straightness of the workpiece surface. The factors that affect these accuracies are wire vibration, machining speed, machining parameter setting, the resistance value of the dielectric fluid, etc. The straightness of the workpiece surface is mainly due to the deflection of the wire during processing, which leads to the occurrence of drum-shaped inaccuracy phenomenon, and when machining the corner part, it will also cause an overcutting phenomenon. During corner machining, the overcutting will occur at the tip of the corner if the discharge energy is too large. The positioning accuracy is the accuracy of the mechanical movement and the accuracy of the origin positioning. Sanchez et al. [2] investigated the corner geometry error generated by roughing and finishing cuts. The errors at different corner zones were identified and related to the material removal rate (MRR) for each cut. It was concluded that a corner accuracy optimization must consider the error generated by previous cuts. Selvakumar et al. [3] used an experimental approach to investigate die corner accuracy. Various machining parameters such as pulse-on time, pulse frequency, peak current, servo voltage, and wire tension were chosen for the experiment. The results showed that the cutting parameter modification strategy gave poor results in improving corner accuracy during the presence of wire lag. In a similar experiment carried out by Saravanan et al. [4], machine control parameters such as input voltage, wire feed, current, wire diameter, wire tension, and pulse-on/off time were taken to maximize MRR and minimize surface roughness regarding the corner cutting process. Han et al. [5] developed a simulation method to investigate the relation between the actual path and the programmed path of the wire, then used it to predict the actual path of the wire for sharp corner machining. In the WEDM process, electrostatic, electromagnetic, electrodynamics, and dielectric pressure act on the wire and will deflect the wire [6]. Large cutting error usually occurs while cutting sharp corners due to wire lag and other effects. Dekeyser et al. [7] found errors in corners due to the wire lag and wire vibration. Other researchers tried to modify machining parameters such as wire speed and pulse time in order to reduce the wire deflection, and, hence, found that the dimension accuracy and the flatness of the workpiece wall could be improved. Obara et al. [8,9] investigated several controlling methods including power control with path correction to increase corner accuracy and reduce machining time at the roughing stage. Increasing the wire tension can improve the accuracy of corner machining; however, when the wire tension is too large, it will easily break the wire during processing. On the other hand, when the wire tension is too small, the phenomenon of wire deflection and vibration will occur, resulting in the phenomenon of corner overcut during corner machining. Another study to enhance the machining process by adding nanopowder in the dielectric fluid was investigated by Chaudhari et al. [10]. Different concentrations of Al2O3 nanopowder were used in the dielectric fluid, and the effects on the surface roughness, MRR, and recast layer thickness (RLT) were investigated. The experimental result showed that Al2O3 nanopowder and pulse-on time have high contribution for surface roughness and recast layer thickness. Pandey et al. [11] investigated the effect of different wire materials on WEDM performance. Brass wire and zinc-coated brass wire were used during the machining of titanium alloy, and the effect on surface roughness and material removal rate were investigated. The experimental result shows that the zinc-coated brass wire could increase the cutting speed and better surface roughness. Chen et al. [12] proposed a zinc-coated surface microstructure on wire electrodes (ZCSMWE) for improving the machining process. The experimental results showed that ZCSMWE can increase the MRR and reduce surface roughness. It also significantly decreased the recast layer and microcrack on the surface.
As mentioned above, the corner machining accuracy can be improved by finding the suitable setting of machining parameters to reduce the error of corner machining. It is known that the WEDM process is complex, stochastic, and time-varying, involving many variables which make it extremely difficult for setting an optimal parameter setting. Different methods were proposed by researchers to solve this problem. Elyass et al. [13] investigated the performance of WEDM process parameters. The Taguchi method and RSM were used to investigate the effect of pulse-on time, pulse-off time, wire feed rate, and peak current on cutting time, cutting rate, overcut, and dimensional deviations. The results showed a significant effect of pulse-on/off time and peak current on the cutting time, while wire feed rate gave significant effect to cutting rate. Puri et al. [14] used the L27 Taguchi method that involved 13 control parameters to analyze and investigate the geometrical accuracy. It was concluded that the significant factors for geometrical inaccuracy due to wire lag for rough cutting are pulse-on/off time and pulse peak current. Lodhi et al. [15] proposed the L9 Taguchi method to optimize the machining conditions in order to obtain the best surface roughness. The signal-to-noise (S/N) ratio and the analysis of variance (ANOVA) were used in the study. The observation concluded that the most influential factor on the surface roughness was discharge current. Kam et al. [16] studied the tool vibration and surface roughness of AISI 4340 steel using the Taguchi method. The Taguchi design L18 was used to analyze the experimental results and showed that significant relationship between the surface roughness and vibration, and lower surface roughness were found during the turning process with tempered AISI 4340. Similarly, Singh et al. [17] used the L27 Taguchi method for investigating the effect of WEDM process parameters on surface roughness, MRR, and cutting rate. The results showed that the surface roughness was affected by pulse-on time and servo voltage, while the cutting rate and MRR were affected by pulse-on/off time. Kam et al. [18,19] used the L16 Taguchi method to investigate the turning process and EDM process for machining deep cryogenically treated AISI 4140 steel. Mir et al. [20] used response surface methodology (RSM) for modeling and analysis of the machining parameters to obtain best surface roughness on electrical discharge machining (EDM). Doreswamy et al. [21] proposed the RSM method to optimize machining parameters to achieve maximum material removal rate (MRR). Several parameters such as pulse-on time, pulse-off time, and current were chosen and investigated. The study showed a significant increase in MRR when current and pulse-on time increased. On the contrary, MRR decreased when pulse-off time increased. Saha et al. [22] proposed a combination of gray relational analysis (GRA) and principal component analysis (PCA) to identify the optimal combination of machining parameters on the WEDM process of hardfacing materials. Kumar et al. [23] used gray relational analysis for optimizing the WEDM process parameters. Peak current, pulse-on time, and wire feed rate were chosen as input parameters, with kerf width and surface roughness as the output response. Chalisgaonkar et al. [24] developed a multiresponse optimization technique to optimize WEDM process parameters for surface roughness, material removal rate, and wire consumption.
This study proposed a systematic system that can optimize the machining parameters in order to reduce the corner error during corner machining and shorten the machining time. Experiments with different settings of machine parameters were conducted. In this study, statistical analysis using the Box–Behnken response surface methodology (RSM) was carried out to investigate the relationship between each parameter and corner machining error. Additionally, the multiparameter interaction and the correlation to corner machining error was studied. Box–Behnken Design is specially designed to fit a second-order model and only needs three levels for each factor which avoids the extreme axial (star) points as in the central composite design, so it is more practical. In addition, the Box–Behnken design requires a smaller number of experiments. The mathematical model was developed using the RSM to establish the relationship between independent parameters, the surface response corner error, and machining time. Furthermore, an algorithm was developed to optimize the parameter to obtain smaller corner error and faster machining time. In addition, a friendly human–machine interface that can predict the corner error and machining time, and also optimize the parameters to obtain smaller corner error and faster machining time, was developed using C# programming language.

2. Methodology

The purpose of this research was to reduce the corner error during machining corners through optimization of the machining parameters. Therefore, the overall experiment was essentially divided into three parts.
The first part investigated the influence of each parameter on the corner error through experiments. The experiments with different parameter settings were conducted, and the data of the influence of each parameter on the corner error were collected. The second part involved the response surface methodology (RSM) to optimize the parameters in order to obtain a smaller corner error, and then an algorithm according to this RSM was created. Additionally, the effect and influence of the parameters open-circuit voltage (OV), pulse-on time (ON), pulse-off time (OFF), servo voltage (SV), flushing pressure (WA), and wire tension (WT) on the corner error were discussed. The third part developed a human–machine interface that can search for the optimal parameter for reducing corner error. The evaluation of the proposed method was also carried out to verify the improvement of corner accuracy.

2.1. Experiment Condition and Equipment

The wire bending can result in overcutting during corner cutting [14]. Therefore, adjustment of wire tension (WT) can effectively reduce the corner error during machining a corner shape. During corner cutting, the wire direction is tuned, and meanwhile the discharge time (pulse-on time) at the corner is increased due to the slowdown of the cutting speed. This increase in discharge time will result in overcutting. To avoid the interference of wire bending, a workpiece thickness of 10 mm was used in this study. Furthermore, the strategy to reduce the wire deflection was to modify the cutting parameters such as pulse-on time, pulse-off time, and peak current [2,14]. The power control could increase accuracy at corners during rough cutting, and decrease the processing time [8,9]. To understand the trend and influence of each parameter on corner error during the WEDM corner cutting process, the parameters of open-circuit voltage (OV), pulse-on time (ON), pulse-off time (OFF), servo voltage (SV), flushing pressure (WA), and wire tension (WT) were selected for experiments based on the literature and the preliminary investigation. According to the preliminary experiment investigation, the larger deviation of uncut or overcut happened on smaller corner angles. Thus, three kinds of corner degrees (30°, 60°, and 90°) were selected for the experiments as shown in Figure 1. Table 1 shows the experiment designed with three levels of parameter settings and actual values. The machining operation was designed to comprise rough cutting followed by a trim cutting. The WEDM machine model AL-400SA with 0.1 μm resolution of linear motor manufactured by Accutex Co. (Taichung City, Taiwan) was used. SKD11 (alloy tool steel) was used as the workpiece material, and a brass wire electrode with diameter of 0.25 mm was used in this experiment.
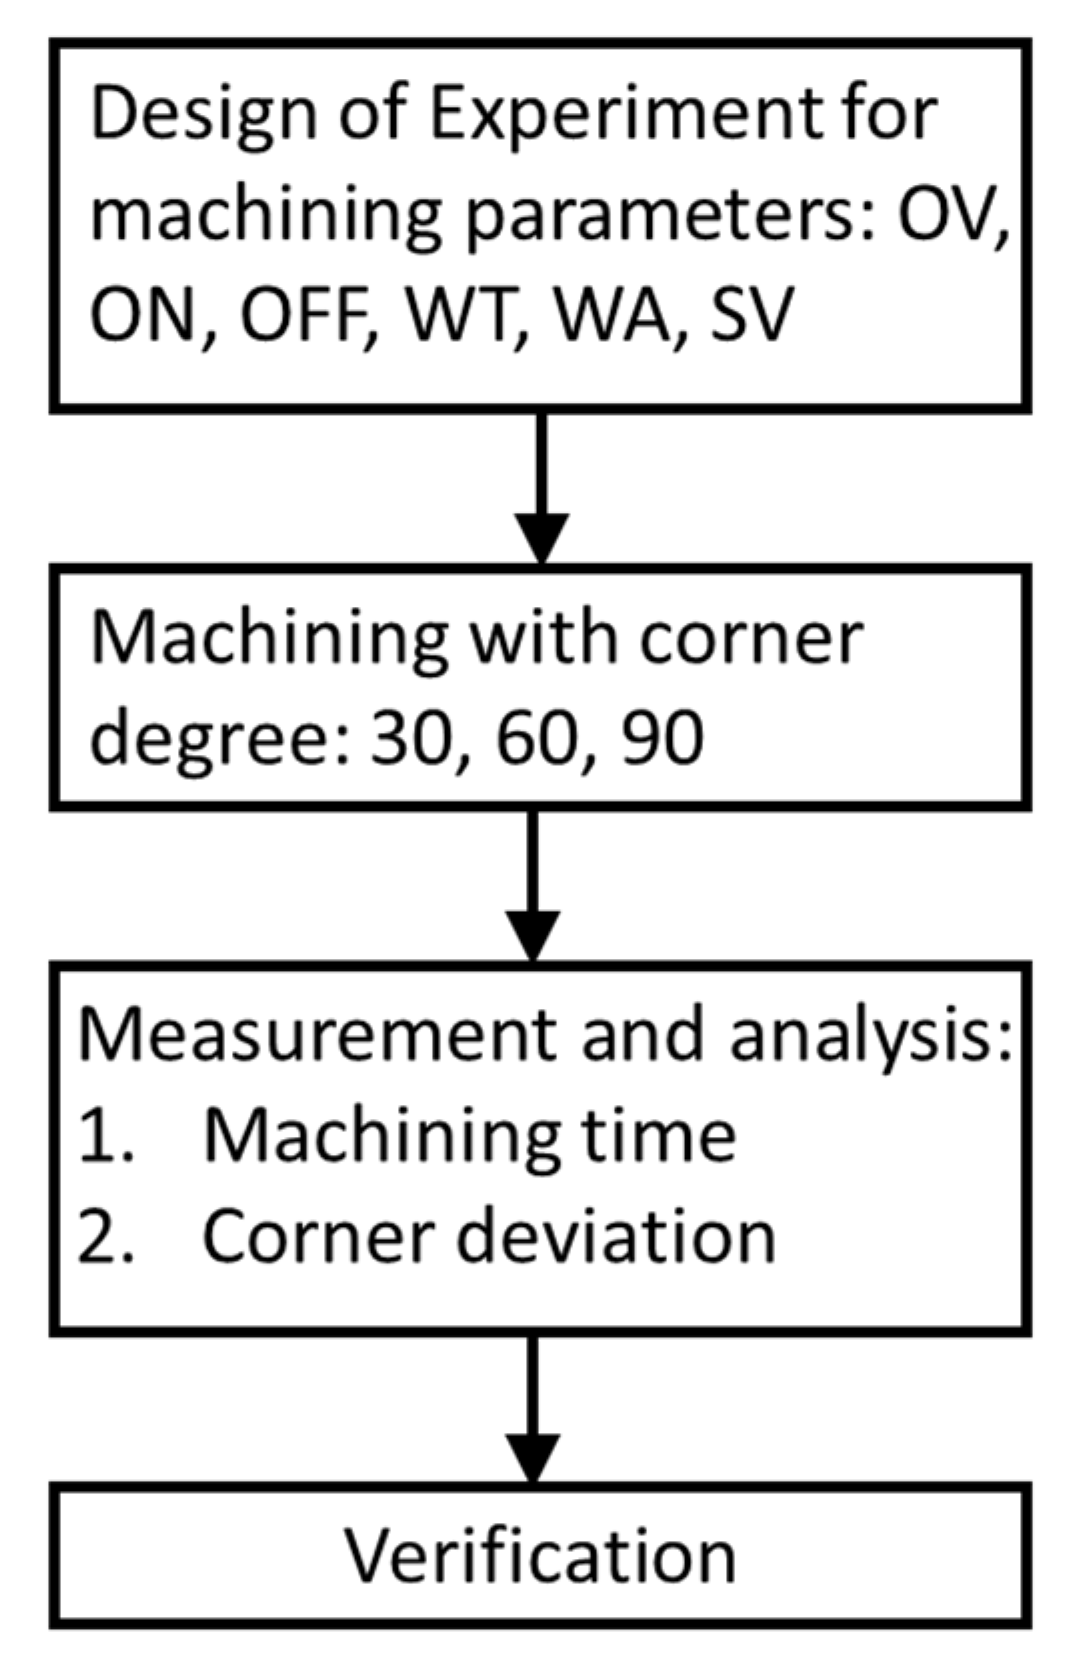
Figure 2 shows the flow chart of the experiment. After selecting the process parameters, they were brought into the Minitab software to design the experiment based on the RSM method. The parameter range was designed according to the standard parameter values suggested by Accutex Co. The suggested standard parameter values were used as middle values, and the smaller values were obtained by reducing the standard parameter values two points. On the other hand, the higher values were obtained by adding two points to the standard parameter values. For instance, the suggested standard parameter value of pulse-on time (ON) was 10, then this value was determined as the middle value. Based on that, the low value was 8 (=10 − 2), and high value was 12 (=10 + 2), as shown in Table 1. After machining, the corner error and machining time were measured. To accurately measure the corner error, an optical inspection method was chosen. The optical inspection measurement instrument (model of VM-2515) with resolution of 0.001 mm made by Power Assist Instrument Scientific Co. was used. The corner error was defined as the distance from the corner vertex to the machined workpiece plane (X) as shown in Figure 1.

2.2. Response Surface Methodology

Response surface methodology (RSM) is an advanced experimental design method that combines mathematics and statistics that are helpful for analyzing the problem and fitting the model with a lot of independent parameters to control the dependent parameter. The response surface contour map is used to represent the relationship between the influencing factors and the quality characteristics. The first step of the response surface method (RSM) is to find out the mathematical model relationship between the response variables and the independent variables. Usually, a low-order polynomial with independent variables within a set range is used, which is a first-order regression model, as shown in Equation (1) [25].
Y = ϕ ( X 1 , X 2 , X 3 , , X i , , X k )
where Y is the performance characteristic of the system, ϕ is the performance of function, X i is the independent parameter i, and k is the number of parameters.
If the correlation between variables is nonlinear, a higher-order polynomial must be used, such as a second-order model, as shown in Equation (2).
Y = d 0 + i = 1 k d i X i + i = 1 k d i i X i 2 + i = 1 k 1   j = i + 1 k d i j X i X j
where d i , d i i , and d i j are the regression coefficients.
When the experiment is close to the region near the optimal response value, the second-order model is usually used to analyze the second-order response surface, and the optimal response value can be determined.
The Box–Behnken design approach was used in this study. The Box–Behnken design method is an experimental design method in RSM that can be efficiently used for developing second-order polynomial models to solve problems. To fit a second-order regression model (quadratic model), the Box–Behnken design only requires three levels for each factor, rather than the five levels in central composite design. The design points fall at combinations of the high and low factor levels and their midpoints [26]. Moreover, the Box–Behnken design uses face points, which is relatively more practical rather than the corner points in central composite design. Since the Box–Behnken design has fewer design points, it needs a smaller number of experimental runs. In this study, the Box–Behnken design was developed using Minitab for optimizing six different independent process parameters as shown in Table 1. Table 2 shows the experimental design using Box–Behnken RSM by Minitab.

3. Experiment and Discussion

Generally, the experiment can be divided into two parts. The first part is to conduct the experiment using a single parameter, then analyze and investigate the effect of each parameter on corner error. The second part is optimization using the RSM and analyzing the effect of interaction between each parameter on corner error.
Based on the Box–Behnken RSM method, 54 experiments were conducted for six parameters (as shown in Table 2). Each experiment was repeated three times for each parameter condition, and the average value was calculated for analysis. The corner error and machining speed were considered as response variables.

3.1. Effect of Parameter on Corner Error

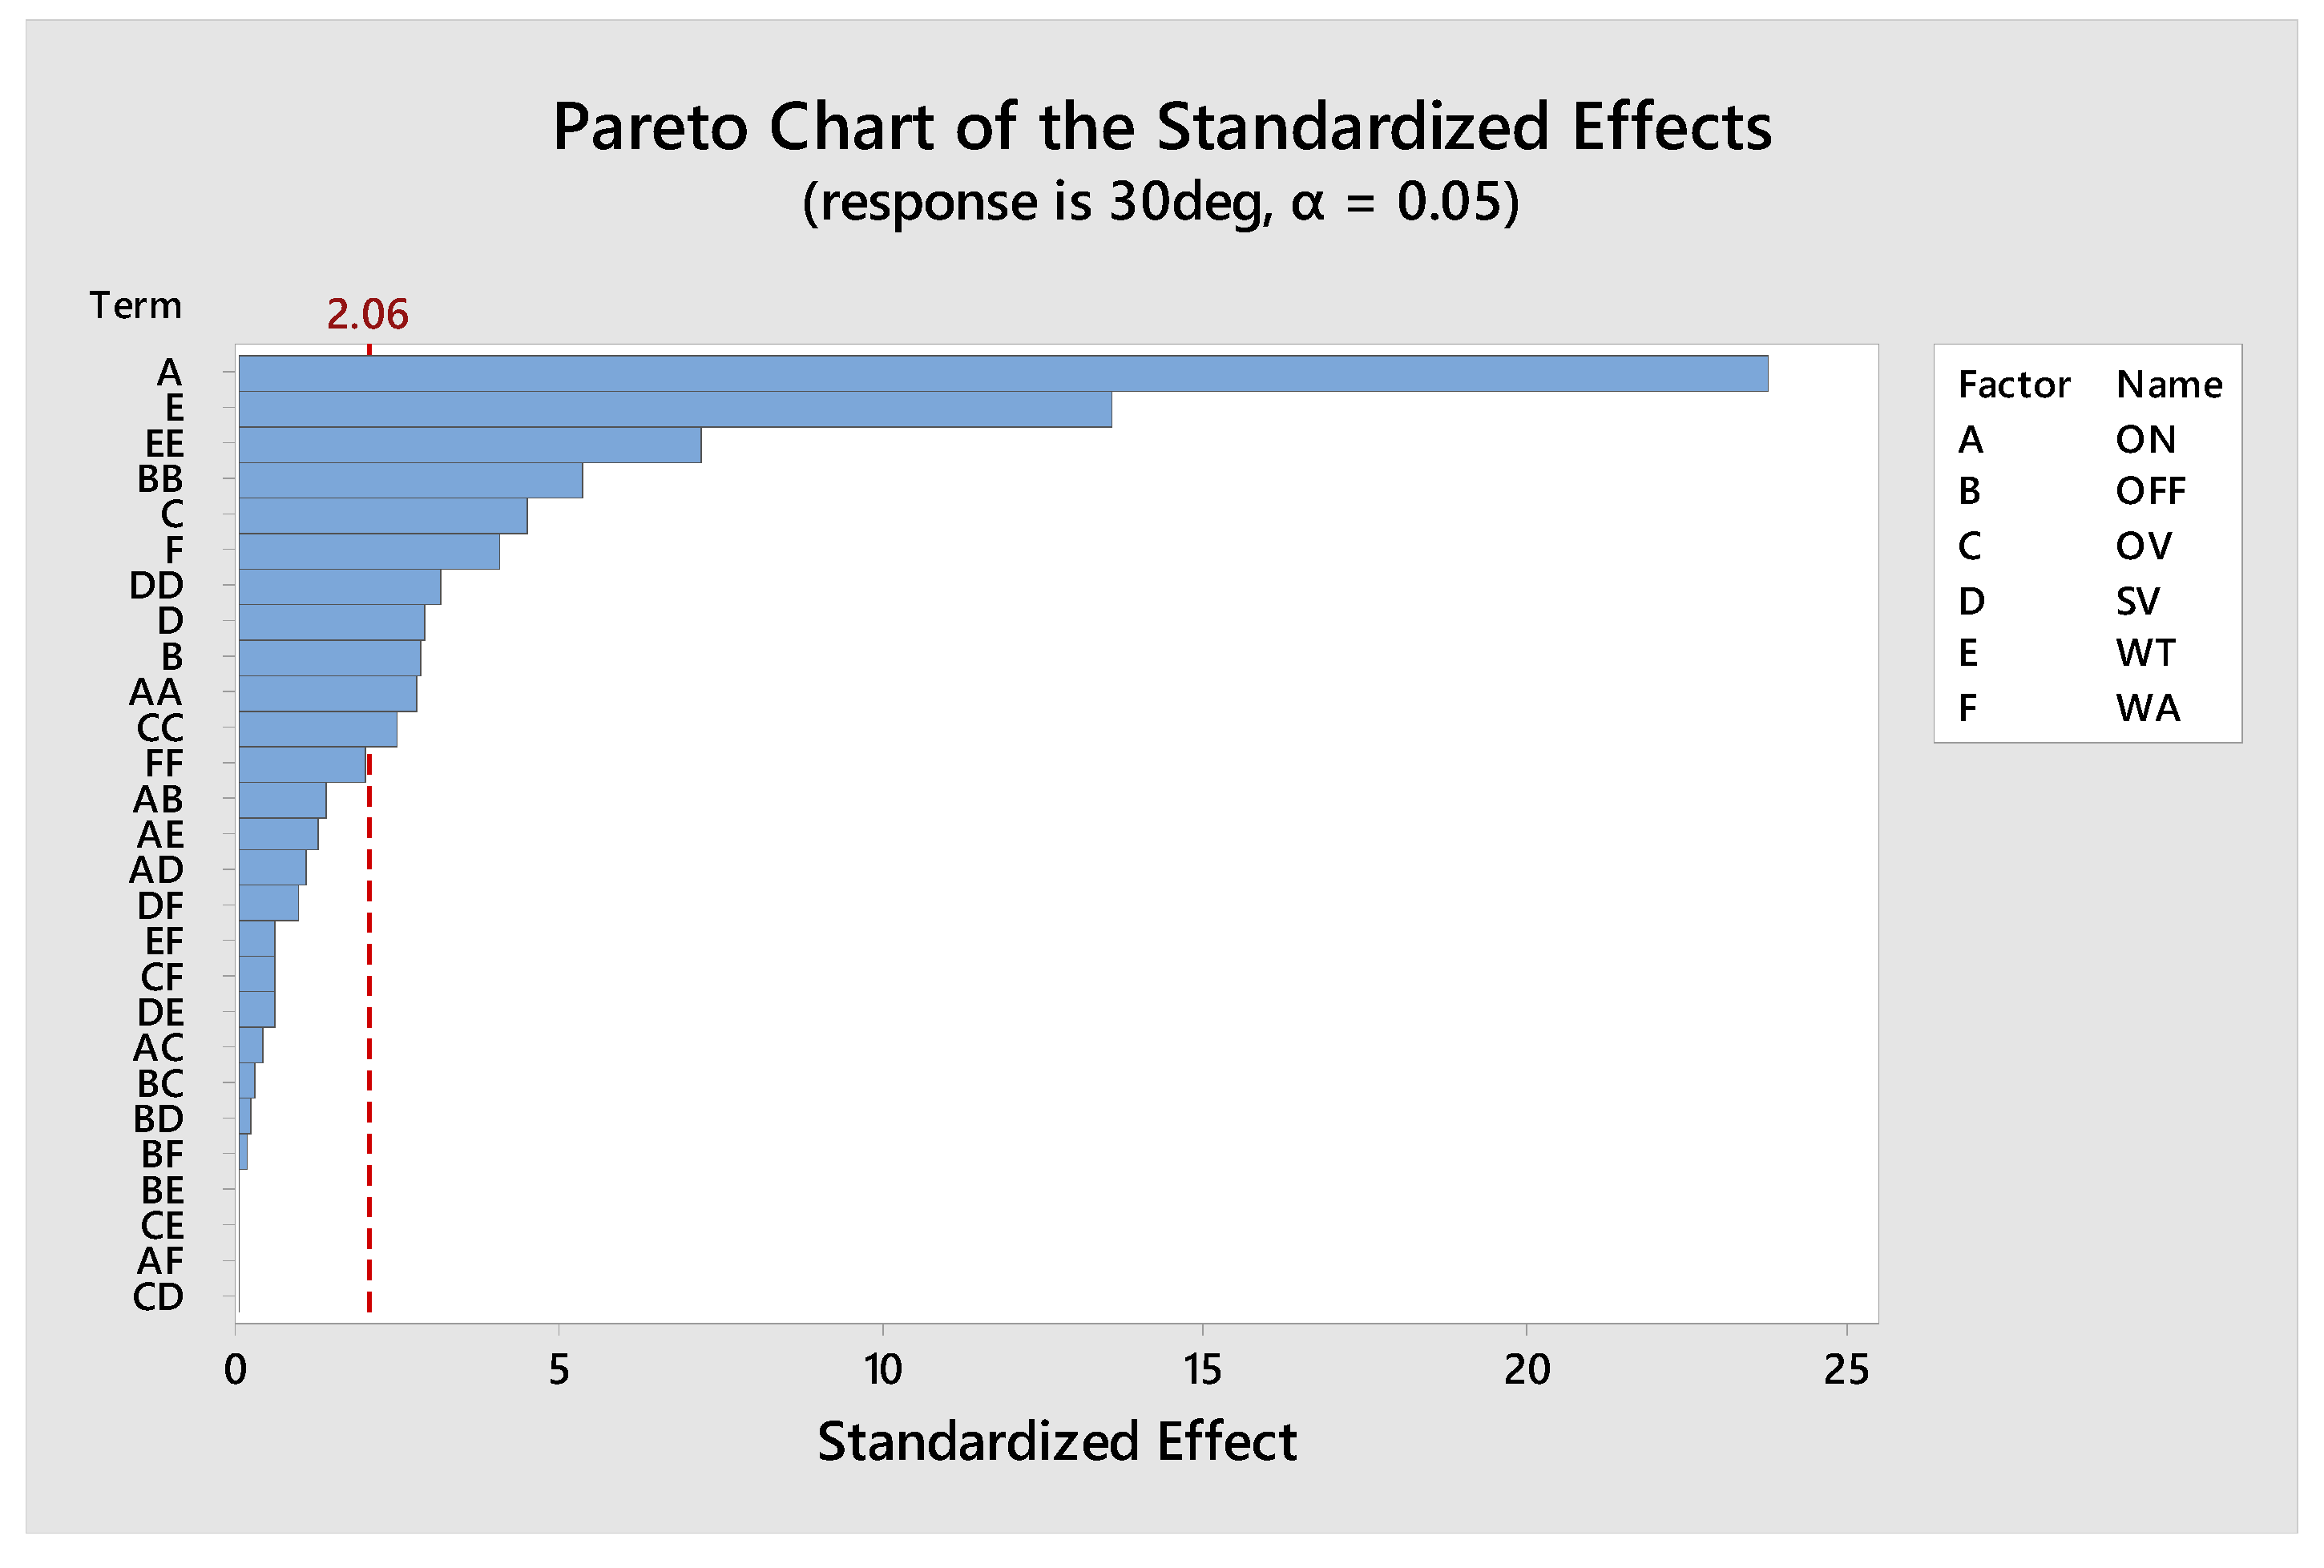
When the experimental data collection was completed, the analysis of variance using RSM was performed to investigate the influence of the independent variable on the performance variable. The analysis of variance (ANOVA) results of the quadratic model for 30°, 60°, and 90° corners are given in Table 3, Table 4 and Table 5. These developed models are statistically significant which are indicated by the value of F and p. The larger the value of F and the smaller the value of p, the more significant [27,28]. The F-value was found to be 33.331 (30°), 7.95 (60°), and 5.15 (90°), representing that these models are statistically significant. The large F-values may occur due to the noise and only 0.01% possibility. The p-value was observed to be less than 0.0500, indicating that these models are significant. For 30° corner error, the model terms ON, WT, and the second order of OFF2, WT2 were found to be highly significant, while OFF, OV, SV, WA, and the second order of ON2, OV2, SV2 were significant factors. In the case of the 60° corner, the model terms ON, OFF, WA, and the second order of SV2 were found to be highly significant, while OV, SV, two-level interaction ON OV, and the second order of OFF2, WT2 were the significant model terms. Meanwhile, for the case of the 90° corner, the model terms ON and WT were found to be highly significant, while OFF, OV, SV, WA, and the second order of SV2 were significant factors. The significant parameters and their interaction effect on the output response corner error and the machining time can be seen through the Pareto chart as shown in Figure 3. In addition to p-value, the coefficient of determination R2, adjusted R2 ( R a d j 2 ), and predicted R2 ( R p r e d 2 ) were used to evaluate the developed model. The value of R2 for the 30°, 60°, and 90° corners were 0.9719, 0.9644, and 0.9539, respectively. For a model to be adequate, R2 value should not be less than 0.75 [29]. Although the larger the R2 value is, the more accurate the model is, the R2 will be overestimated due to the influence of the sample. Therefore, the R a d j 2 value needed to be considered to avoid the overestimation. The value of R a d j 2 for the 30°, 60°, and 90° corners were 0.9558, 0.9427, and 0.9385, respectively. The small deviation between R2 and R a d j 2 indicates the adequacy and fitness of the model. Meanwhile, the R p r e d 2 value for the 30°, 60°, and 90° corners were 0.9340, 0.9225, and 0.9196, respectively. It can be seen that the predicted R2 value was in close agreement with the adjusted R2.

3.1.1. Effect of Pulse-on Time (ON) on Corner Error

The p-value for the ON term was less than 0.0001, and the F-value was large, which indicates that this parameter is highly significant. It is desirable as it indicates that the ON parameter has a significant effect on the response. Additionally, the results showed that the ON2 term provides secondary contribution to the 30° corner as shown in Table 3. Meanwhile, the interaction between the ON and OV terms provides secondary contribution to the 60° corner as shown in Table 4. Table 6 shows the experimental result of corner machining for different pulse-on time (ON) parameter settings. It can be seen that when the pulse-on time (ON) parameter increased from 8 to 12, the corner error for 30°, 60°, and 90° increased from 0.076, 0.029, 0.018 mm to 0.101, 0.041, 0.023 mm, respectively. Moreover, the corner error increased more the more narrow the degree of the corner. Regarding the machining speed, when the pulse-on time (ON) parameter increased from 8 to 12, the machining time decreased from 50.13 to 33.56 min.

3.1.2. Effect of Pulse-off Time (OFF) on Corner Error

The OFF parameter was significant for different corner degrees, which was indicated by a p-value less than 0.05. Additionally, the results showed that the OFF2 term provides secondary contribution to the 30° and 60° corners. Table 7 shows the experimental results of corner machining for different pulse-off time (OFF) parameter settings. It can be seen that the corner error decreased when the pulse-off time (OFF) increased from 8 to 12 for the 30°, 60°, and 90° corners. However, the corner error increase was steep when the corner degree decreased from 60 to 30 degrees. Meanwhile, the corner error slightly increased when the corner degree decreased from 90 to 60 degrees. The machining time increased with the increase in pulse-off time (OFF).

3.1.3. Effect of Open Circuit Voltage (OV) on Corner Error

From Table 3, Table 4 and Table 5, it can be seen that the OV parameter was significant, which was indicated by the p-value being less than 0.05. Additionally, the results showed that the OV2 term provides secondary contribution to the 30° corner. Meanwhile, the interaction between the OV and ON terms provide secondary contribution to the 60° corner. Table 8 shows the experimental results of corner machining for different open circuit voltage (OV) parameter settings. It was seen, when the open circuit voltage (OV) parameter changed from 9 to 11, that the corner error was almost the same. When the OV parameter changed from 11 to 13, the corner error slightly increased. Similarly, the machining speed also showed as slight shorter from 44.95 to 38.5 min when the OV parameter changed from 9 to 13.

3.1.4. Effect of Servo Voltage (SV) on Corner Error

The SV parameter was significant for the 30° and 90° corners due to the p-value which was less than 0.05. However, the p-value for 60° was larger than 0.05 which indicated that it was not significant. It was probably because of the varying concentration of discharge, and the open and arcing pulse due to the varying servo voltage [30]. Moreover, the second order of SV2 provides secondary contribution to the different corner error. Table 9 shows the experimental results of corner machining for different servo voltage (SV) parameter settings. It can be seen that the corner error slightly increased when the servo voltage (SV) parameter increased from 36 to 40 for the 30°, 60°, and 90° corner angles. A similar increasing trend was also shown for the machining time. When the servo voltage (SV) parameter increased, the machining time increased.

3.1.5. Effect of Wire Tension (WT) on Corner Error

The p-value for the WT term was less than 0.0001 and the F-value was large which indicated that this parameter had a highly significant effect on the response. In addition, the second order effect of WT2 was significant for the 30° and 60° corners. Table 10 shows the experimental results of corner machining for different wire tension (WT) parameter settings. It can be seen from Table 7 that when the wire tension (WT) increased from 10 to 14, the corner error decreased for the 30°, 60°, and 90° corners. However, the machining speed remained almost the same without any significant changes for the different wire tension parameter settings. This proved that adjustment of the wire tension (WT) parameter has little effect on the machining speed.

3.1.6. Effect of Flushing Pressure (WA) on Corner Error

The WA parameter was significant for the 30° and 90° corners due to the p-value which was less than 0.05. However, the p-value was larger than 0.05 for the 60° corner which indicated that it was not significant. This might be because the top and bottom fluid jet were symmetrical, so the flow influence would cancel each other, and the erosion products were not flushed as a consequence [31]. Table 11 shows the experimental results of corner machining for different flushing pressure (WA) parameter settings. It can be seen that when the flushing pressure (WA) increased from 2 to 4, the corner error slightly increased from 0.089, 0.035, 0.023 mm to 0.109, 0.037, 0.025 mm for the 30°, 60°, and 90° corners, respectively. The change of corner error was relatively small for the 60° and 90° corners. Regarding the machining time, there was no significant effect of the flushing pressure on machining time.
The Pareto chart shown in Figure 3 illustrates the importance of the parameters and their interaction effects on the output response of corner error and machining time. The values for each parameter effect are represented by the horizontal columns in the Pareto chart. It can be seen that all the parameters such as ON, OFF, OV, SV, WT, WA, and their interaction, cross the red lines that indicate all the parameters and their interaction were significant at the 95% confidence level (α = 0.05). Therefore, all these parameters need to be considered to evaluate the effect on corner error and machining time.

3.2. Optimization

After conducting the experiment for different parameters and obtaining the corner error, machining time data, and relationship between each parameter to corner error, these data were analyzed by using the Box–Behnken RSM response surface method for optimization. The process optimization involves estimation of coefficients, prediction of responses, and verifying the developed model. In terms of quality, the value of the corner error and processing time are minimum value. The quadratic equation for predicting the optimum value was obtained according to the Box–Behnken design and input variables. Furthermore, the relationship between the independent variable and the response can be presented as follows.
Error ( 30 ) = 1.043 + 0.01259 ON − 0.02993 OFF − 0.01148 OV − 0.0555 SV + 0.03325 WT + 0.01393 WA − 0.000654 ON × ON + 0.001264 OFF × OFF + 0.000585 OV × OV + 0.000743 SV × SV − 0.001704 WT × WT
Error ( 60 ) = 1.673 − 0.00265 ON − 0.01569 OFF − 0.01248 OV − 0.0839 SV + 0.01677 WT+ 0.000585 OFF × OFF + 0.000236 OV × OV + 0.001110 SV × SV − 0.000759 WT × WT + 0.000477 ON × OV+ 0.000314 OFF × OV
Error ( 90 ) = 0.684 + 0.001092 ON − 0.000547 OFF − 0.00443 OV − 0.03774 SV + 0.00977 WT + 0.001204 WA+ 0.000242 OV × OV + 0.000551 SV × SV − 0.000295 SV × WT
CutSpeed = 18474 − 306.5 ON + 202.4 OFF − 79.0 OV − 672.7 SV − 268.5 WT − 309.9 WA + 17.354 ON × ON − 1.396 OFF × OFF + 12.354 OV × OV + 11.323 SV × SV + 10.635 WT × WT + 43.17 WA × WA − 15.531 ON × OFF + 12.750 ON × OV − 7.266 ON × SV − 7.594 OFF × OV + 4.281 OFF × SV + 3.56 OFF × WA− 9.031 OV × SV − 1.84 OV × WA
where Error(30) is the corner error prediction for the 30° corner, Error(60) is the corner error prediction for the 60° corner, Error(90) is the corner error prediction for the 90° corner, and CutSpeed is the machining time prediction.
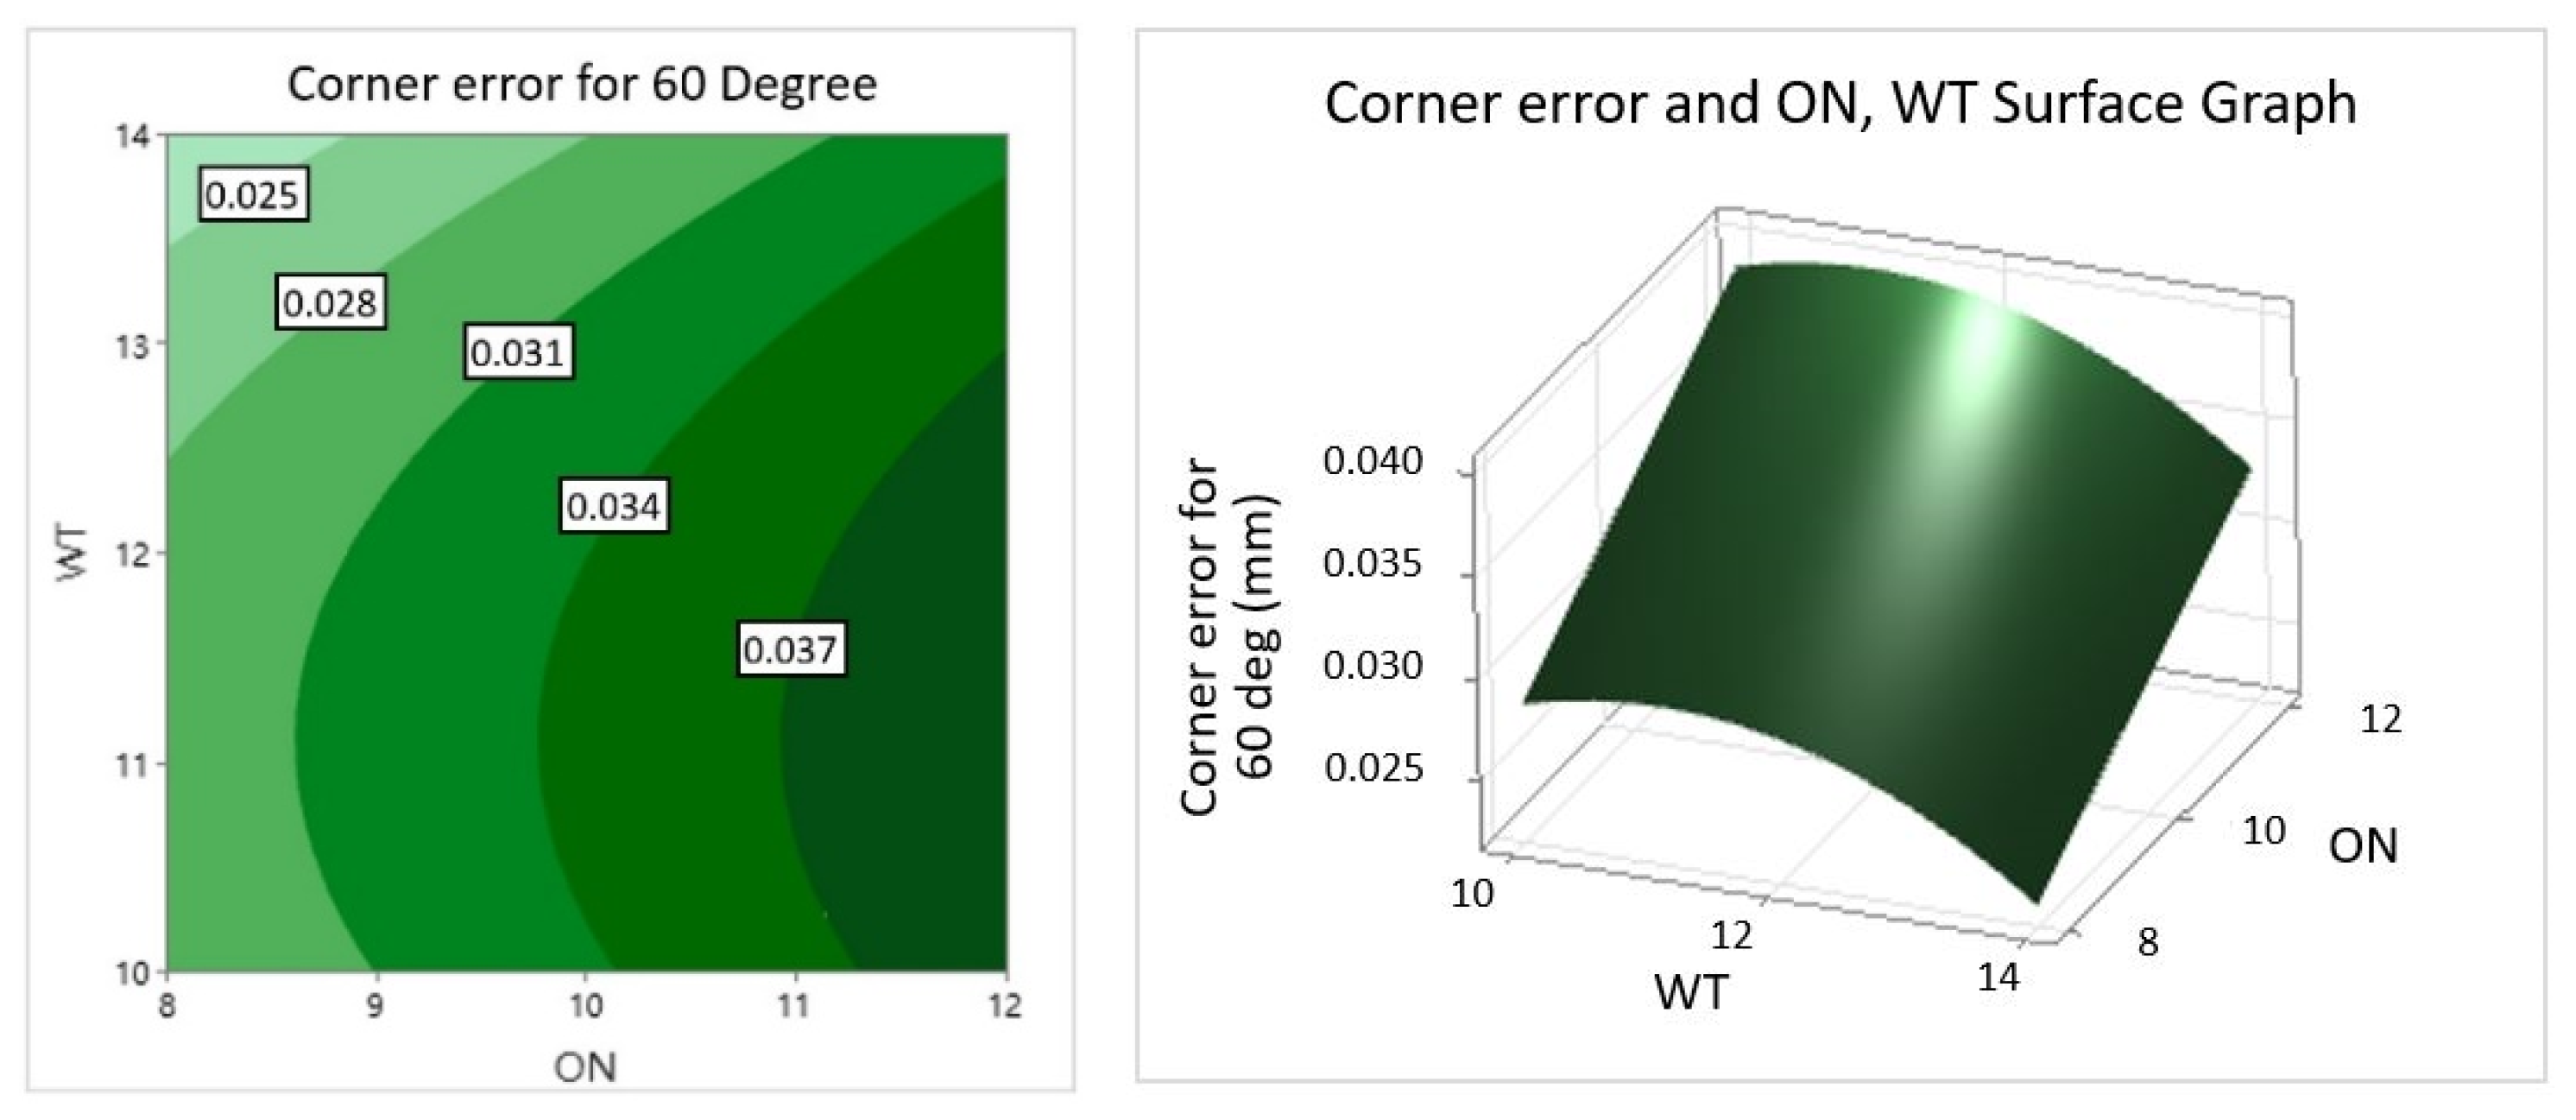
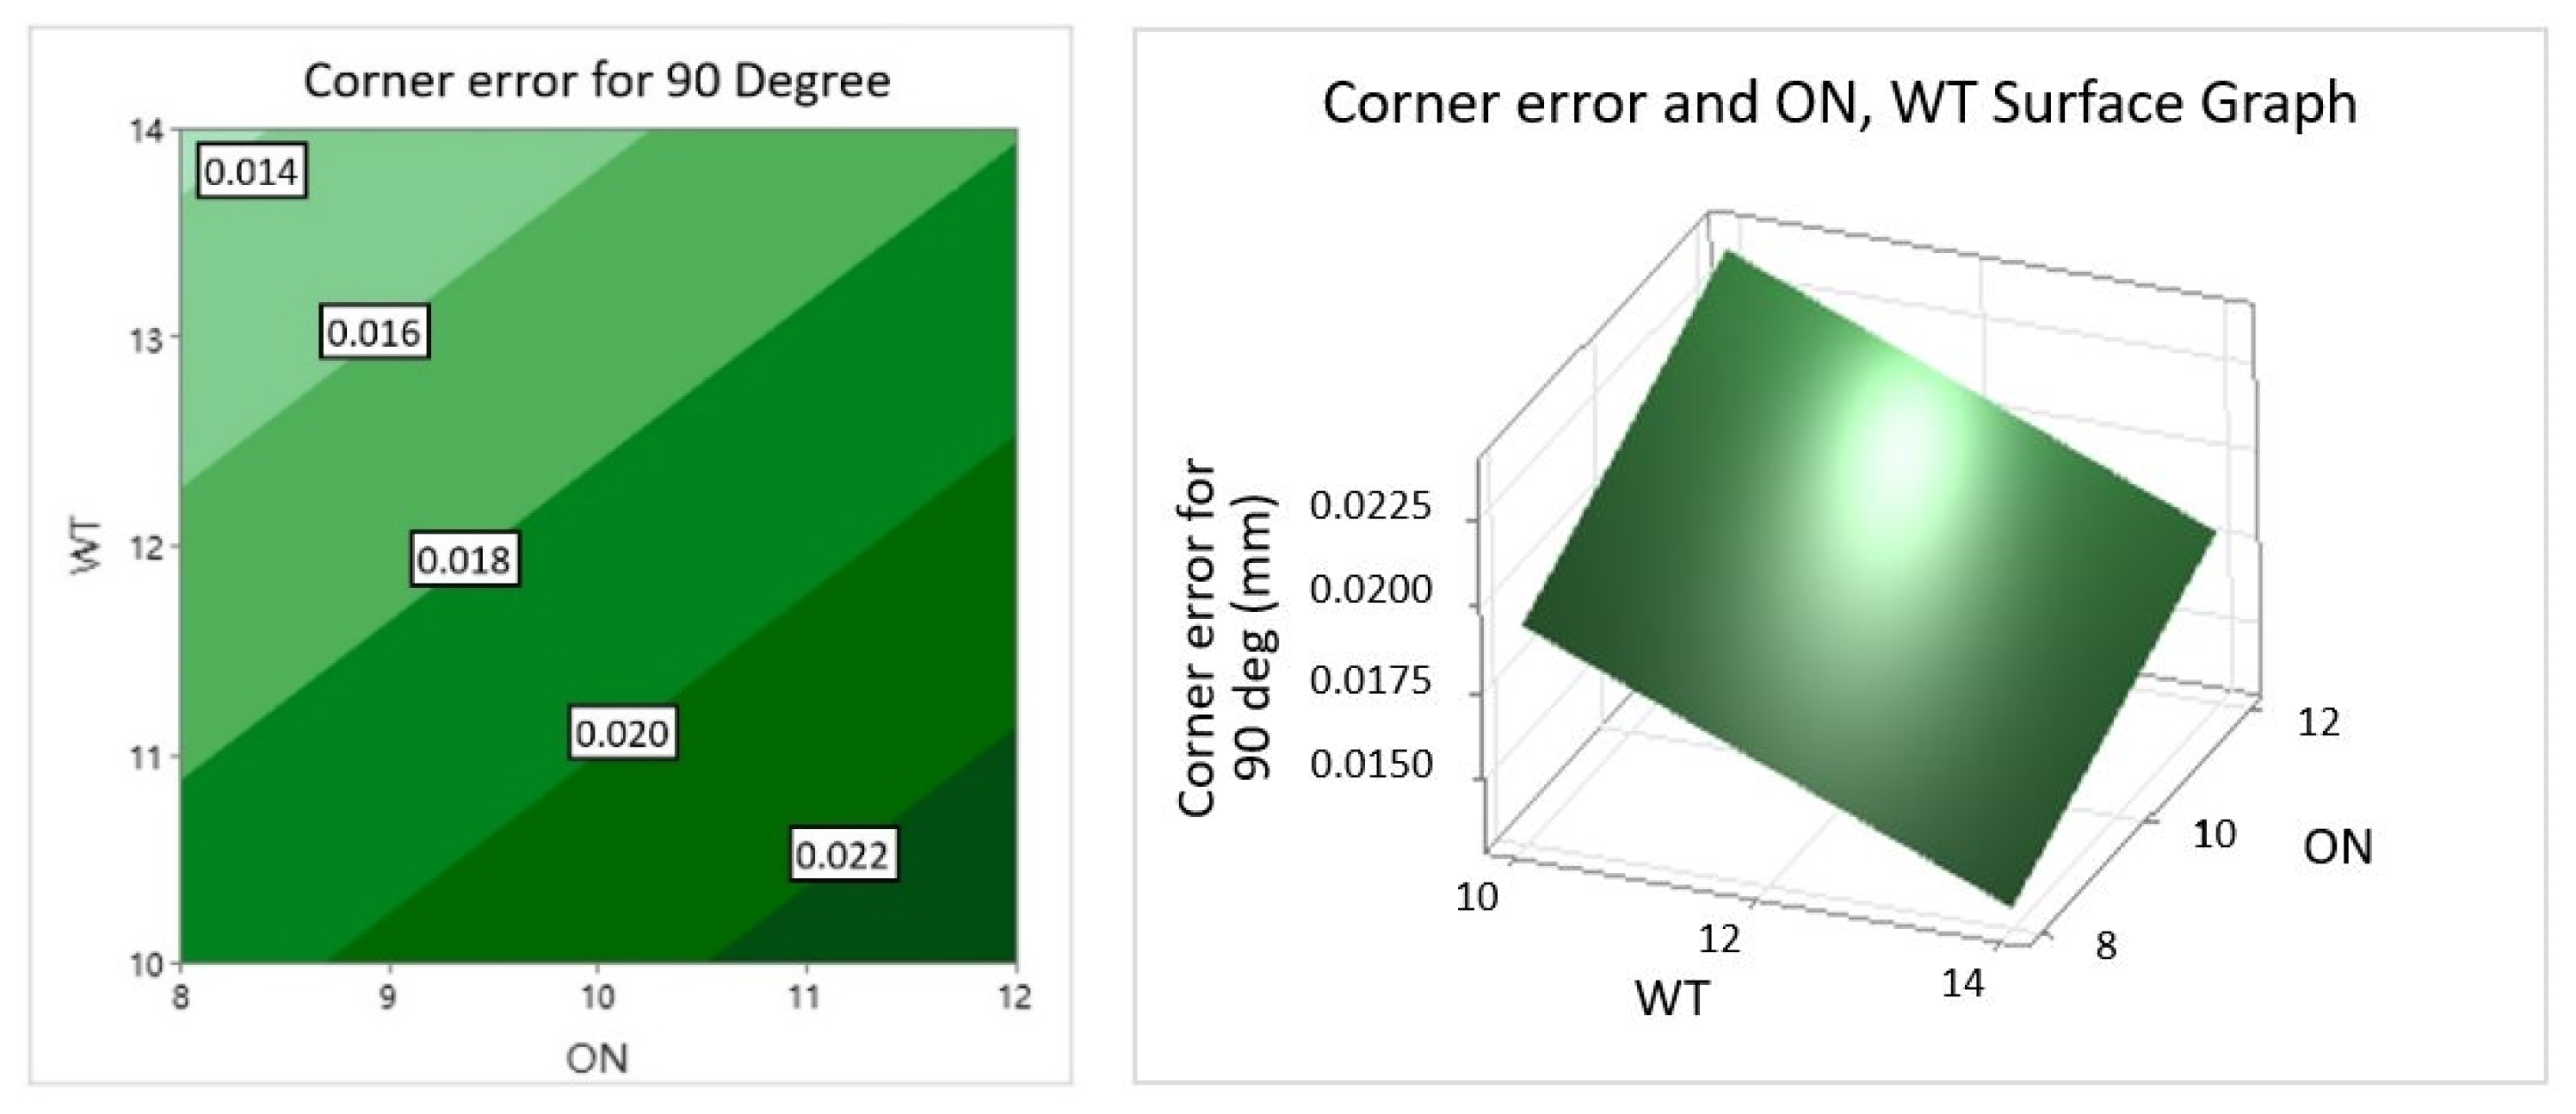
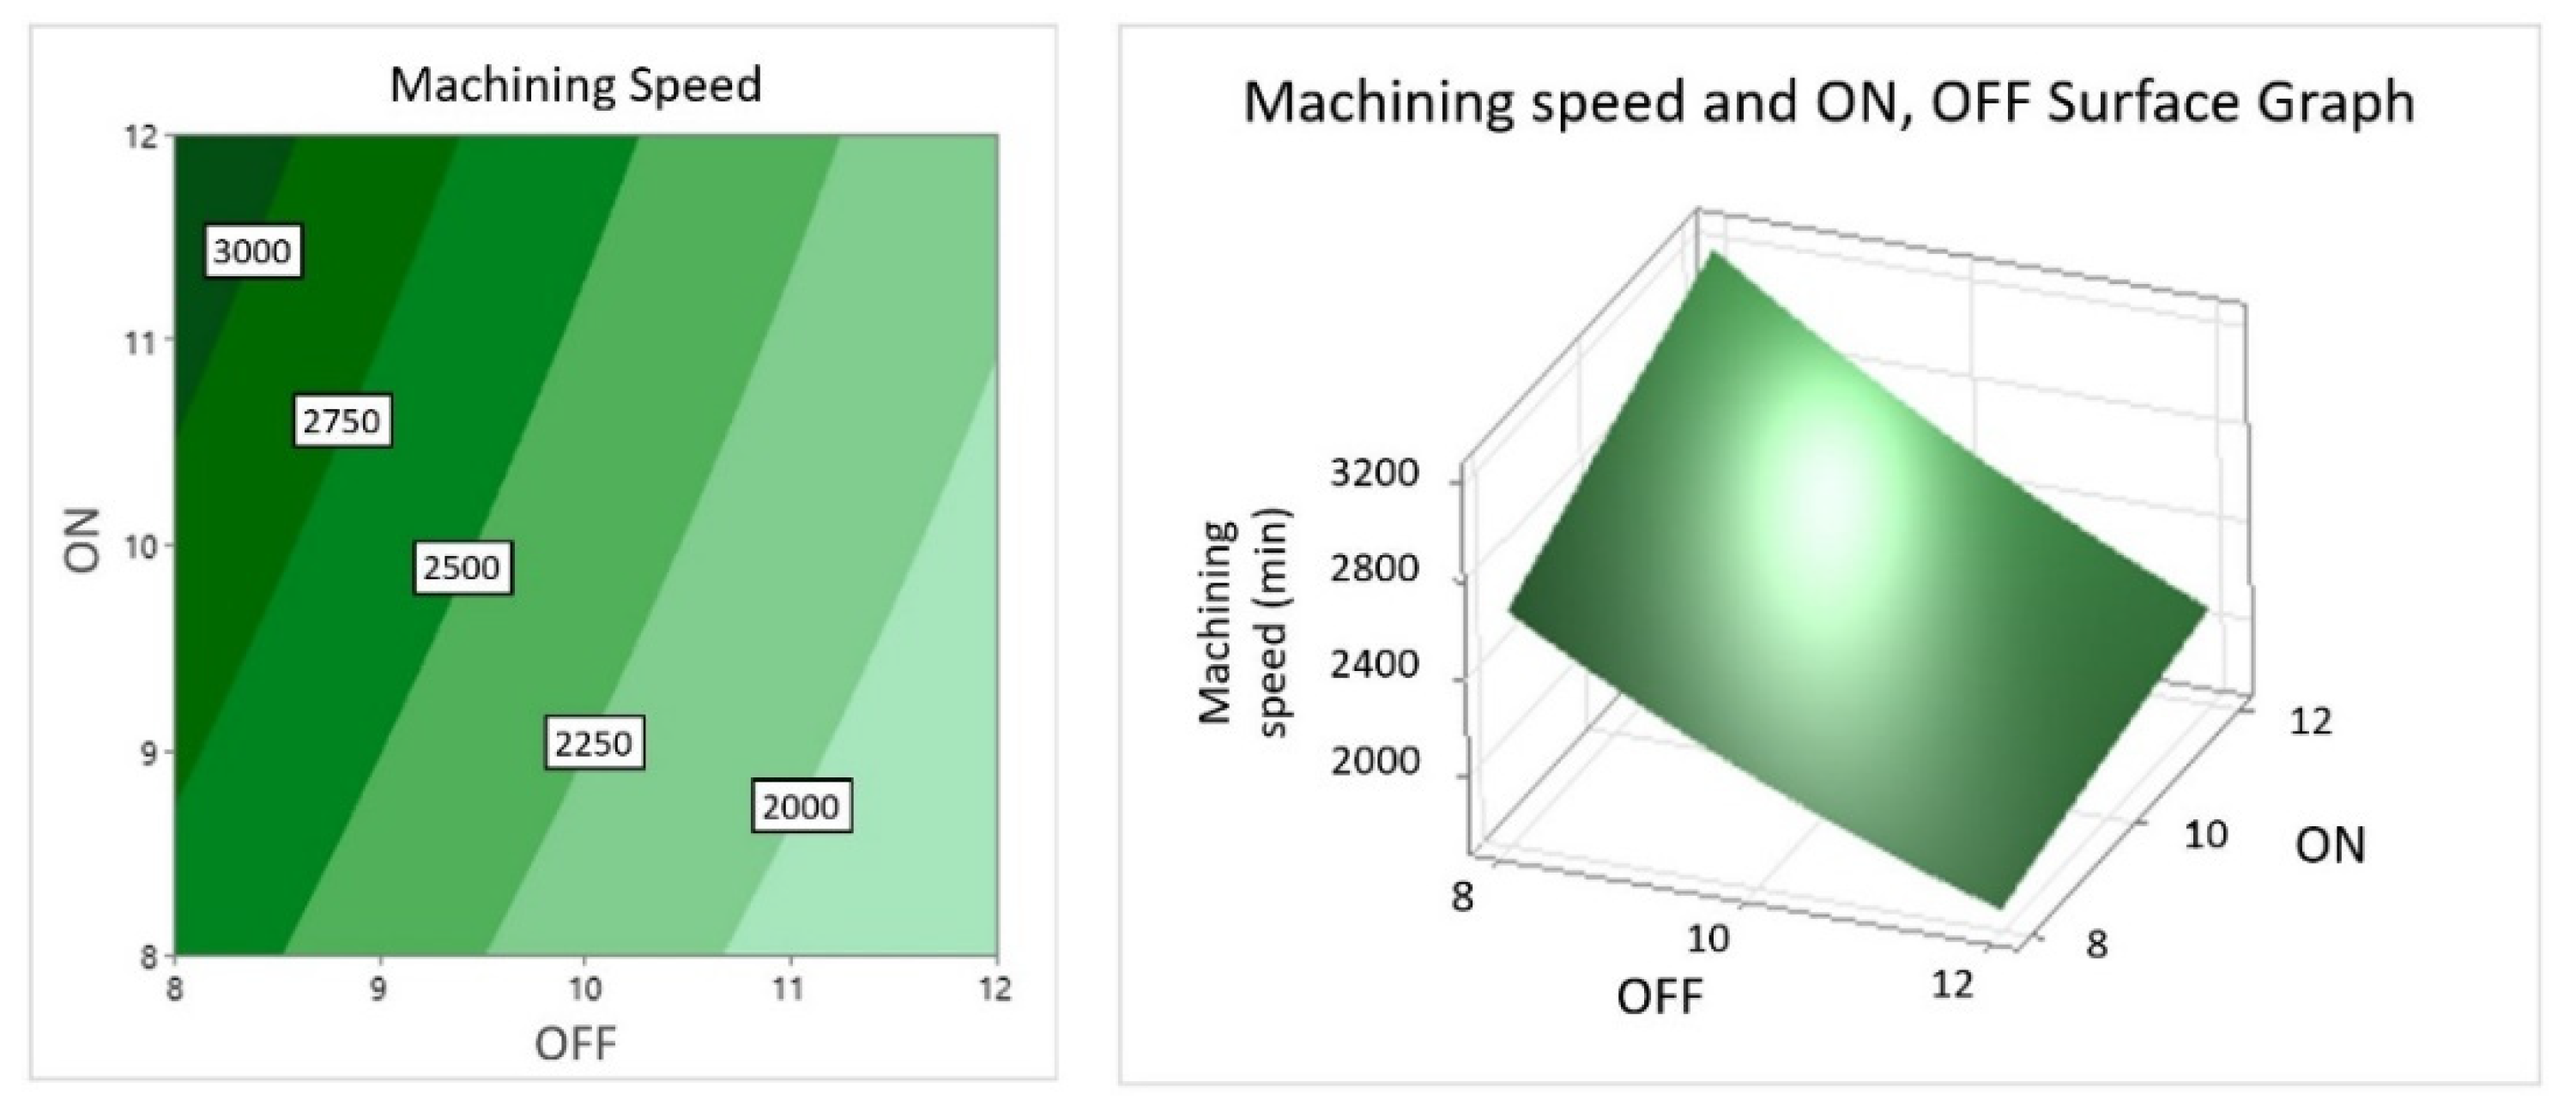
As a function of two factors, 3D surface plots and their corresponding 2D contour graphs are helpful in understanding both main and interaction effects of two factors. The two parameters with the greatest influence were chosen for confirmation. The effects of interaction with the ON and WT parameters on corner error are depicted in Figure 4, Figure 5 and Figure 6. It can be seen, when the parameter pulse-on time (ON) was 8 and wire tension (WT) was 14, that the smaller corner error was obtained. Meanwhile, the effect of interaction with the ON and OFF parameters on machining speed is shown in Figure 7. It is seen that the faster machining time was obtained with the setting parameter pulse-on time (ON) of 12 and pulse-off time (OFF) of 8.
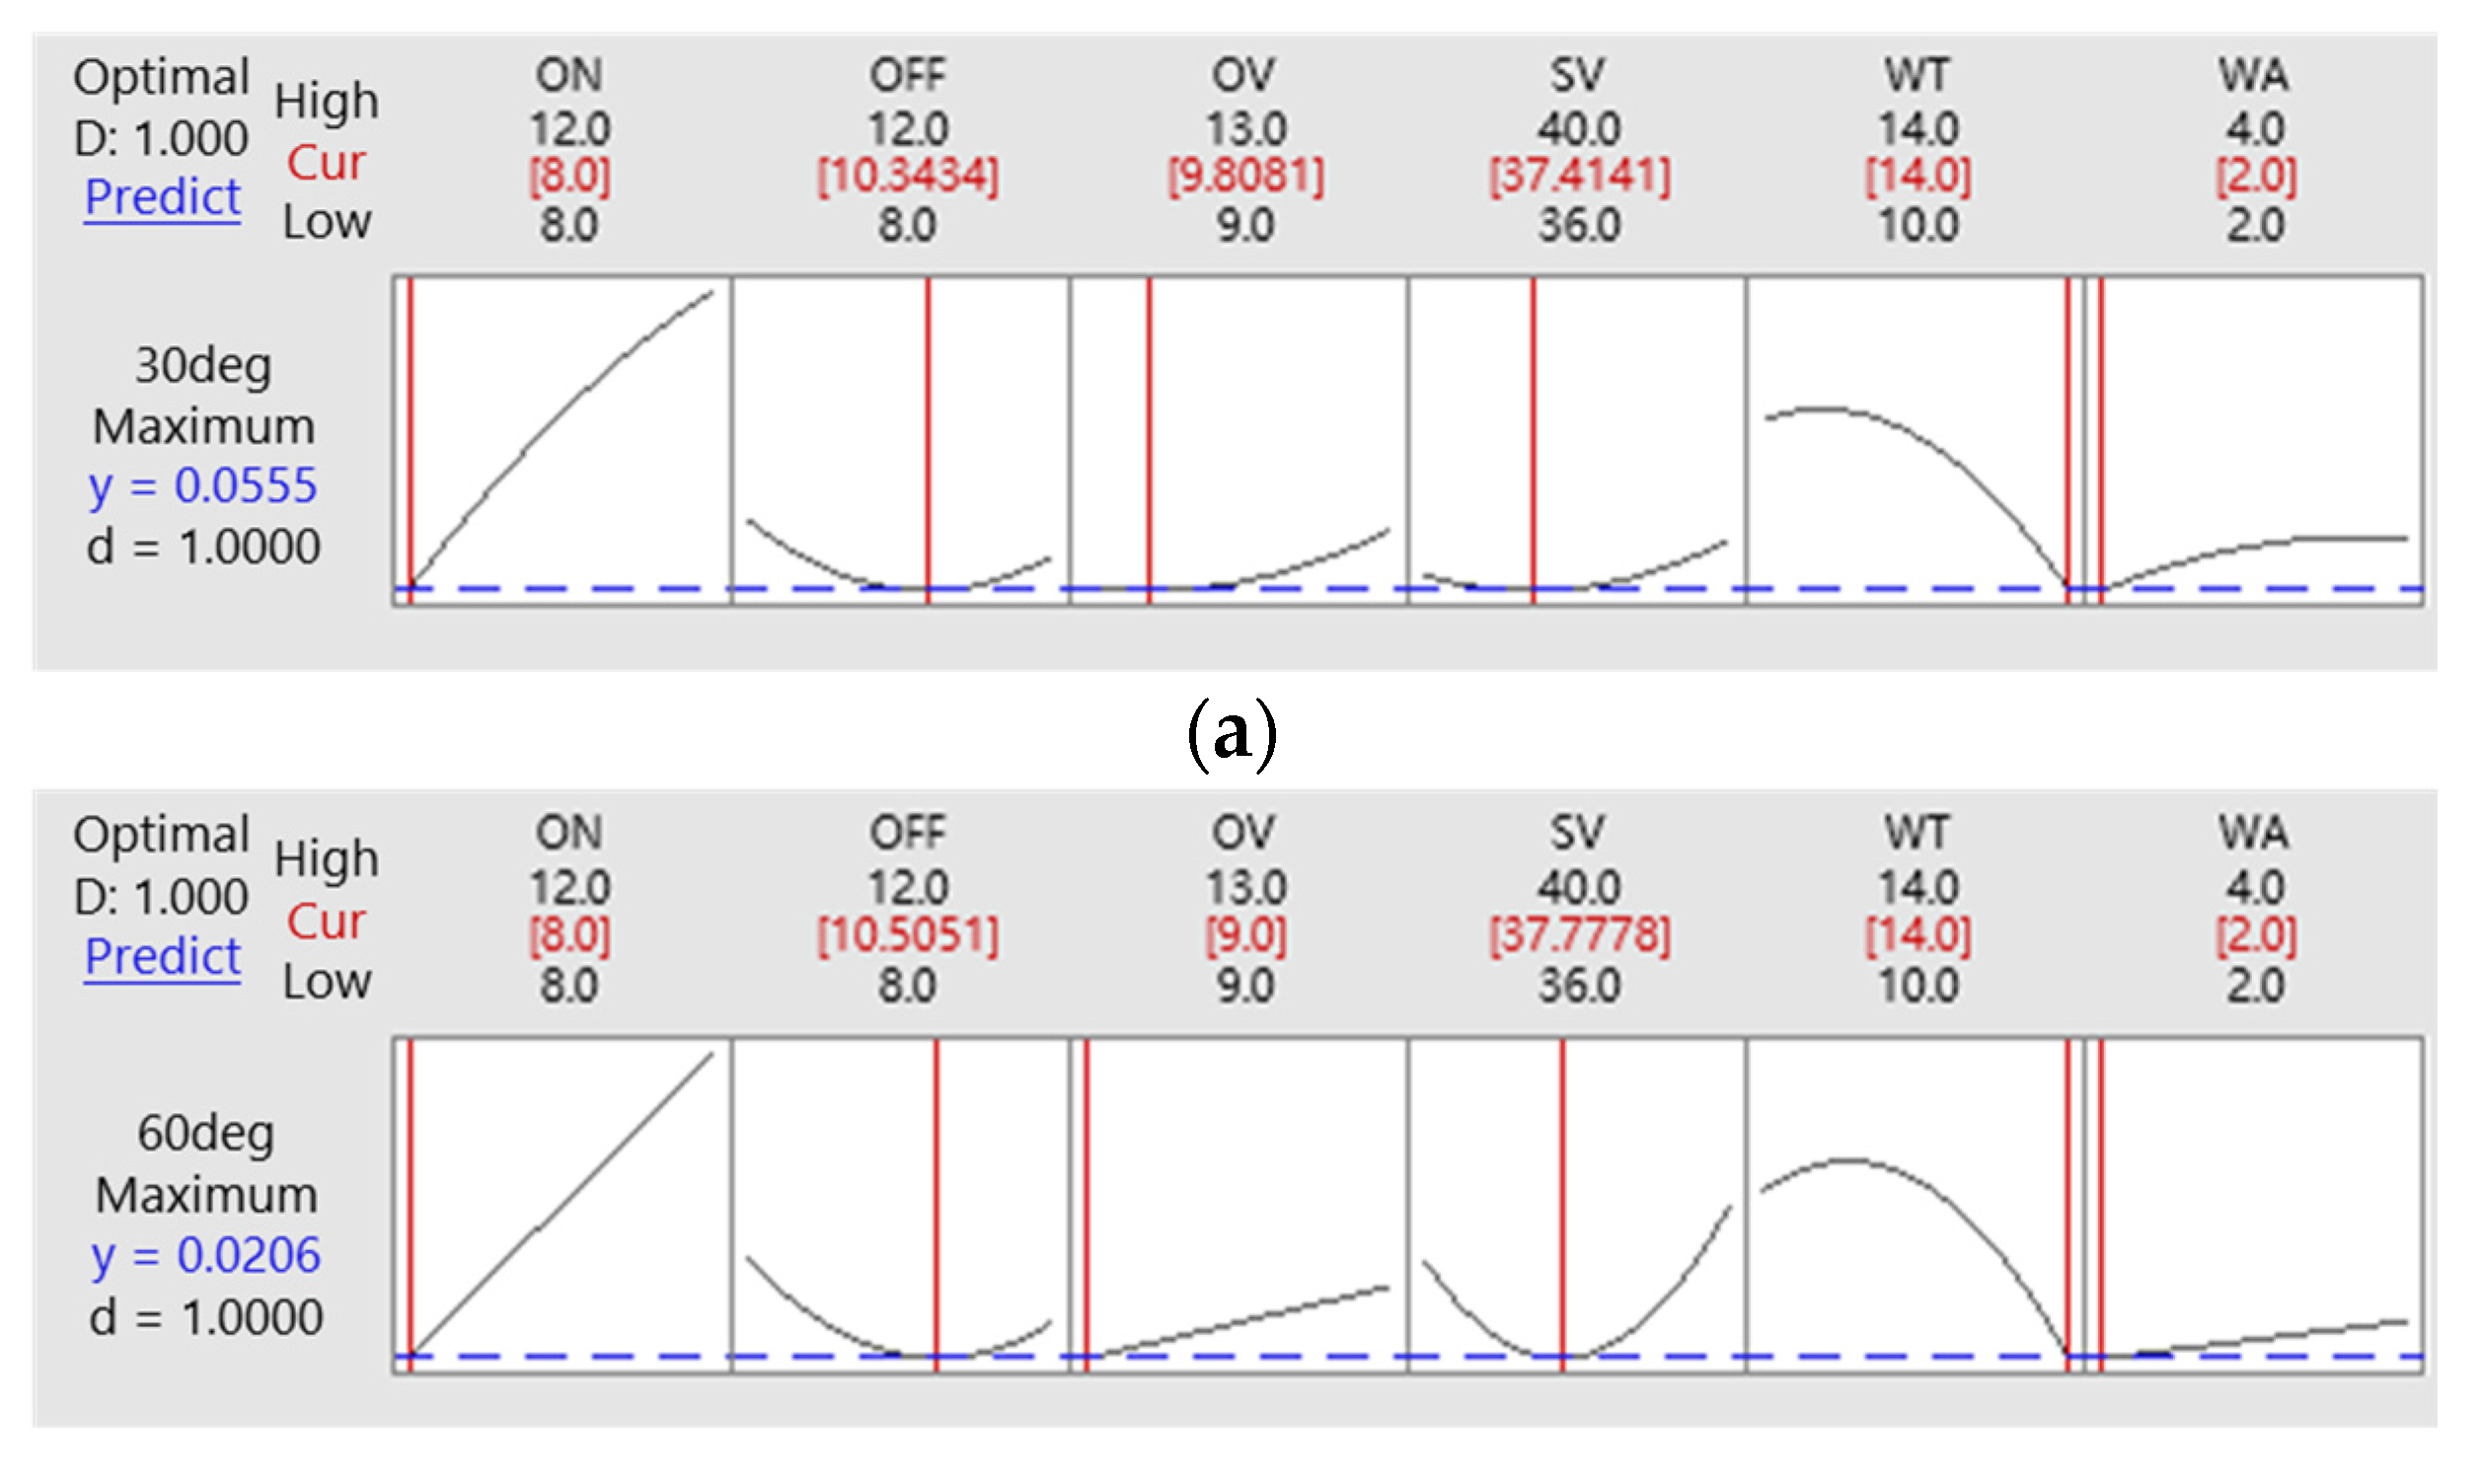
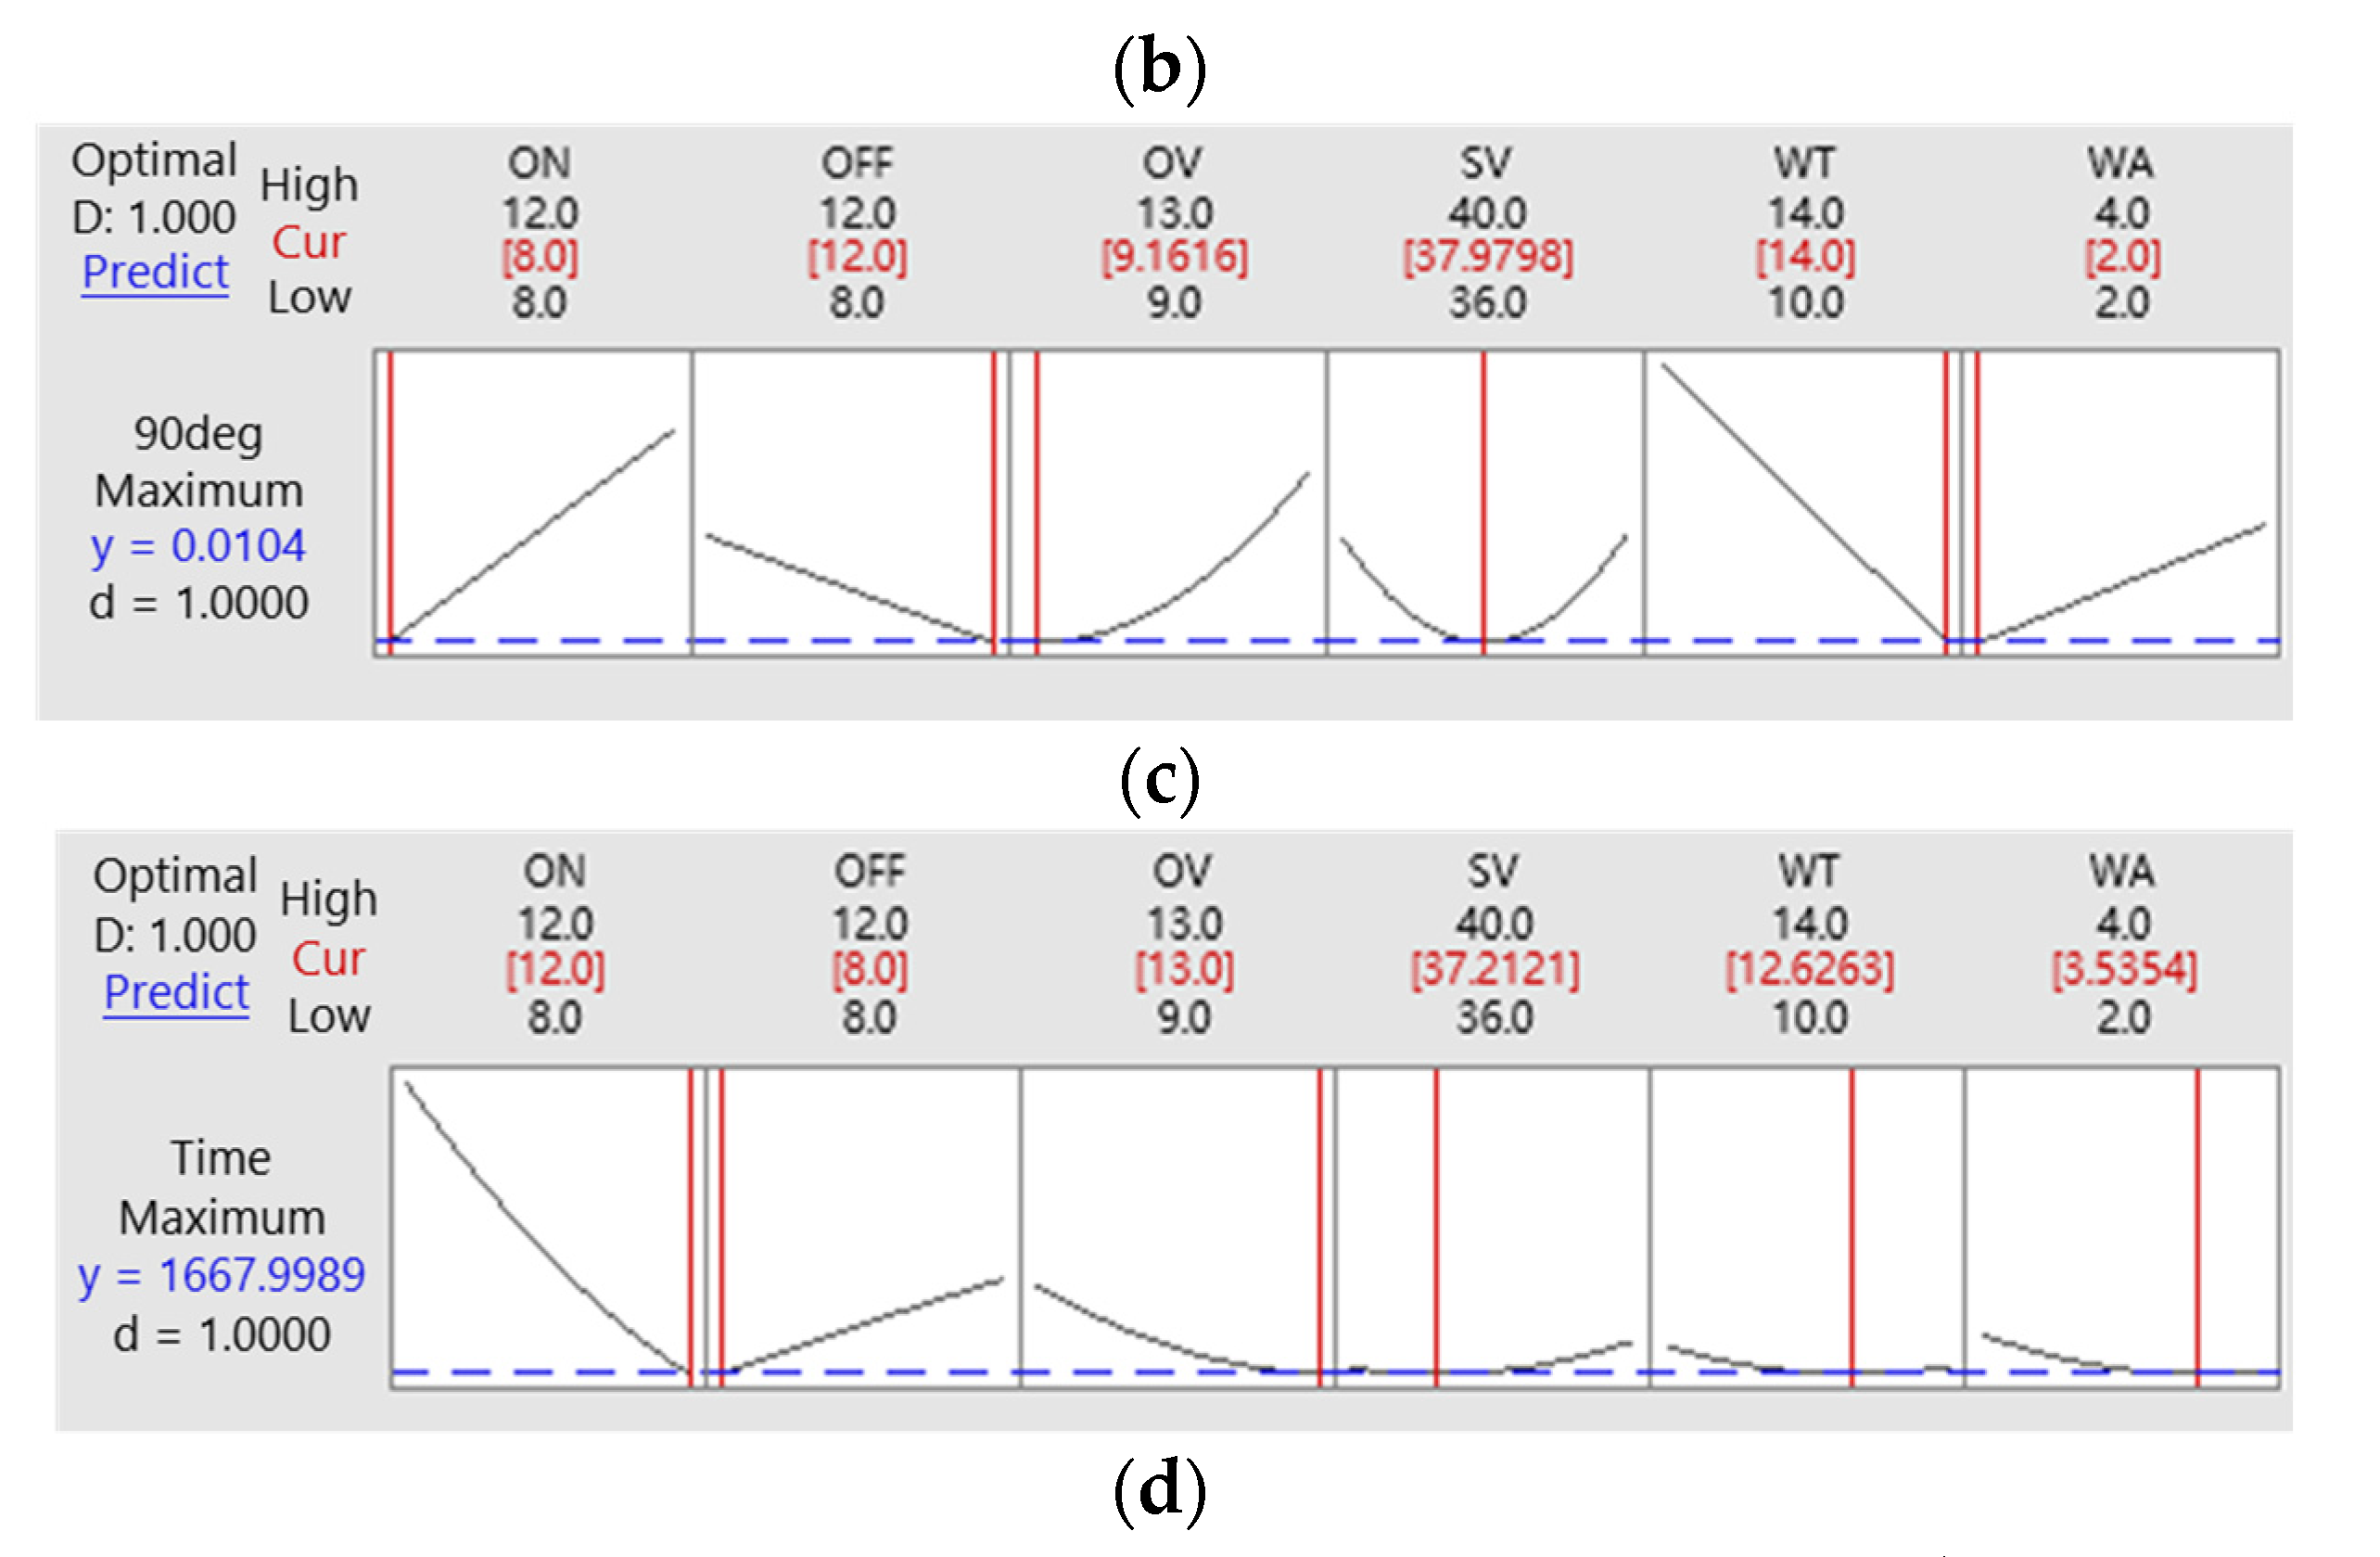
The Minitab response optimizer tool was used for setting the highest desirability, and different numerical combinations were looked for in maximizing the model functions. As shown in Figure 8a, the optimal conditions of the maximum response for the 30° corner were obtained at ON:8, OFF:10, OV:10, SV:37, WT:14, and WA:2. The maximum response for the 60° corner was obtained at ON:8, OFF:11, OV:9, SV:38, WT:14, and WA:2 (Figure 8b). Similarly, the maximum response for the 90° corner was obtained at ON:8, OFF:12, OV:11, SV:38, WT:14, and WA:2 (Figure 8c). Meanwhile, the maximum response for machining speed was achieved at ON:12, OFF:8, OV:13, SV:37, WT:13, and WA:4 (Figure 8d). The optimized results were obtained at a desirability (D) of 1.000 which indicates the applicability of the developed models. In addition, the D value closer to 1 is considered most desirable [32].

4. Human–Machine Interface

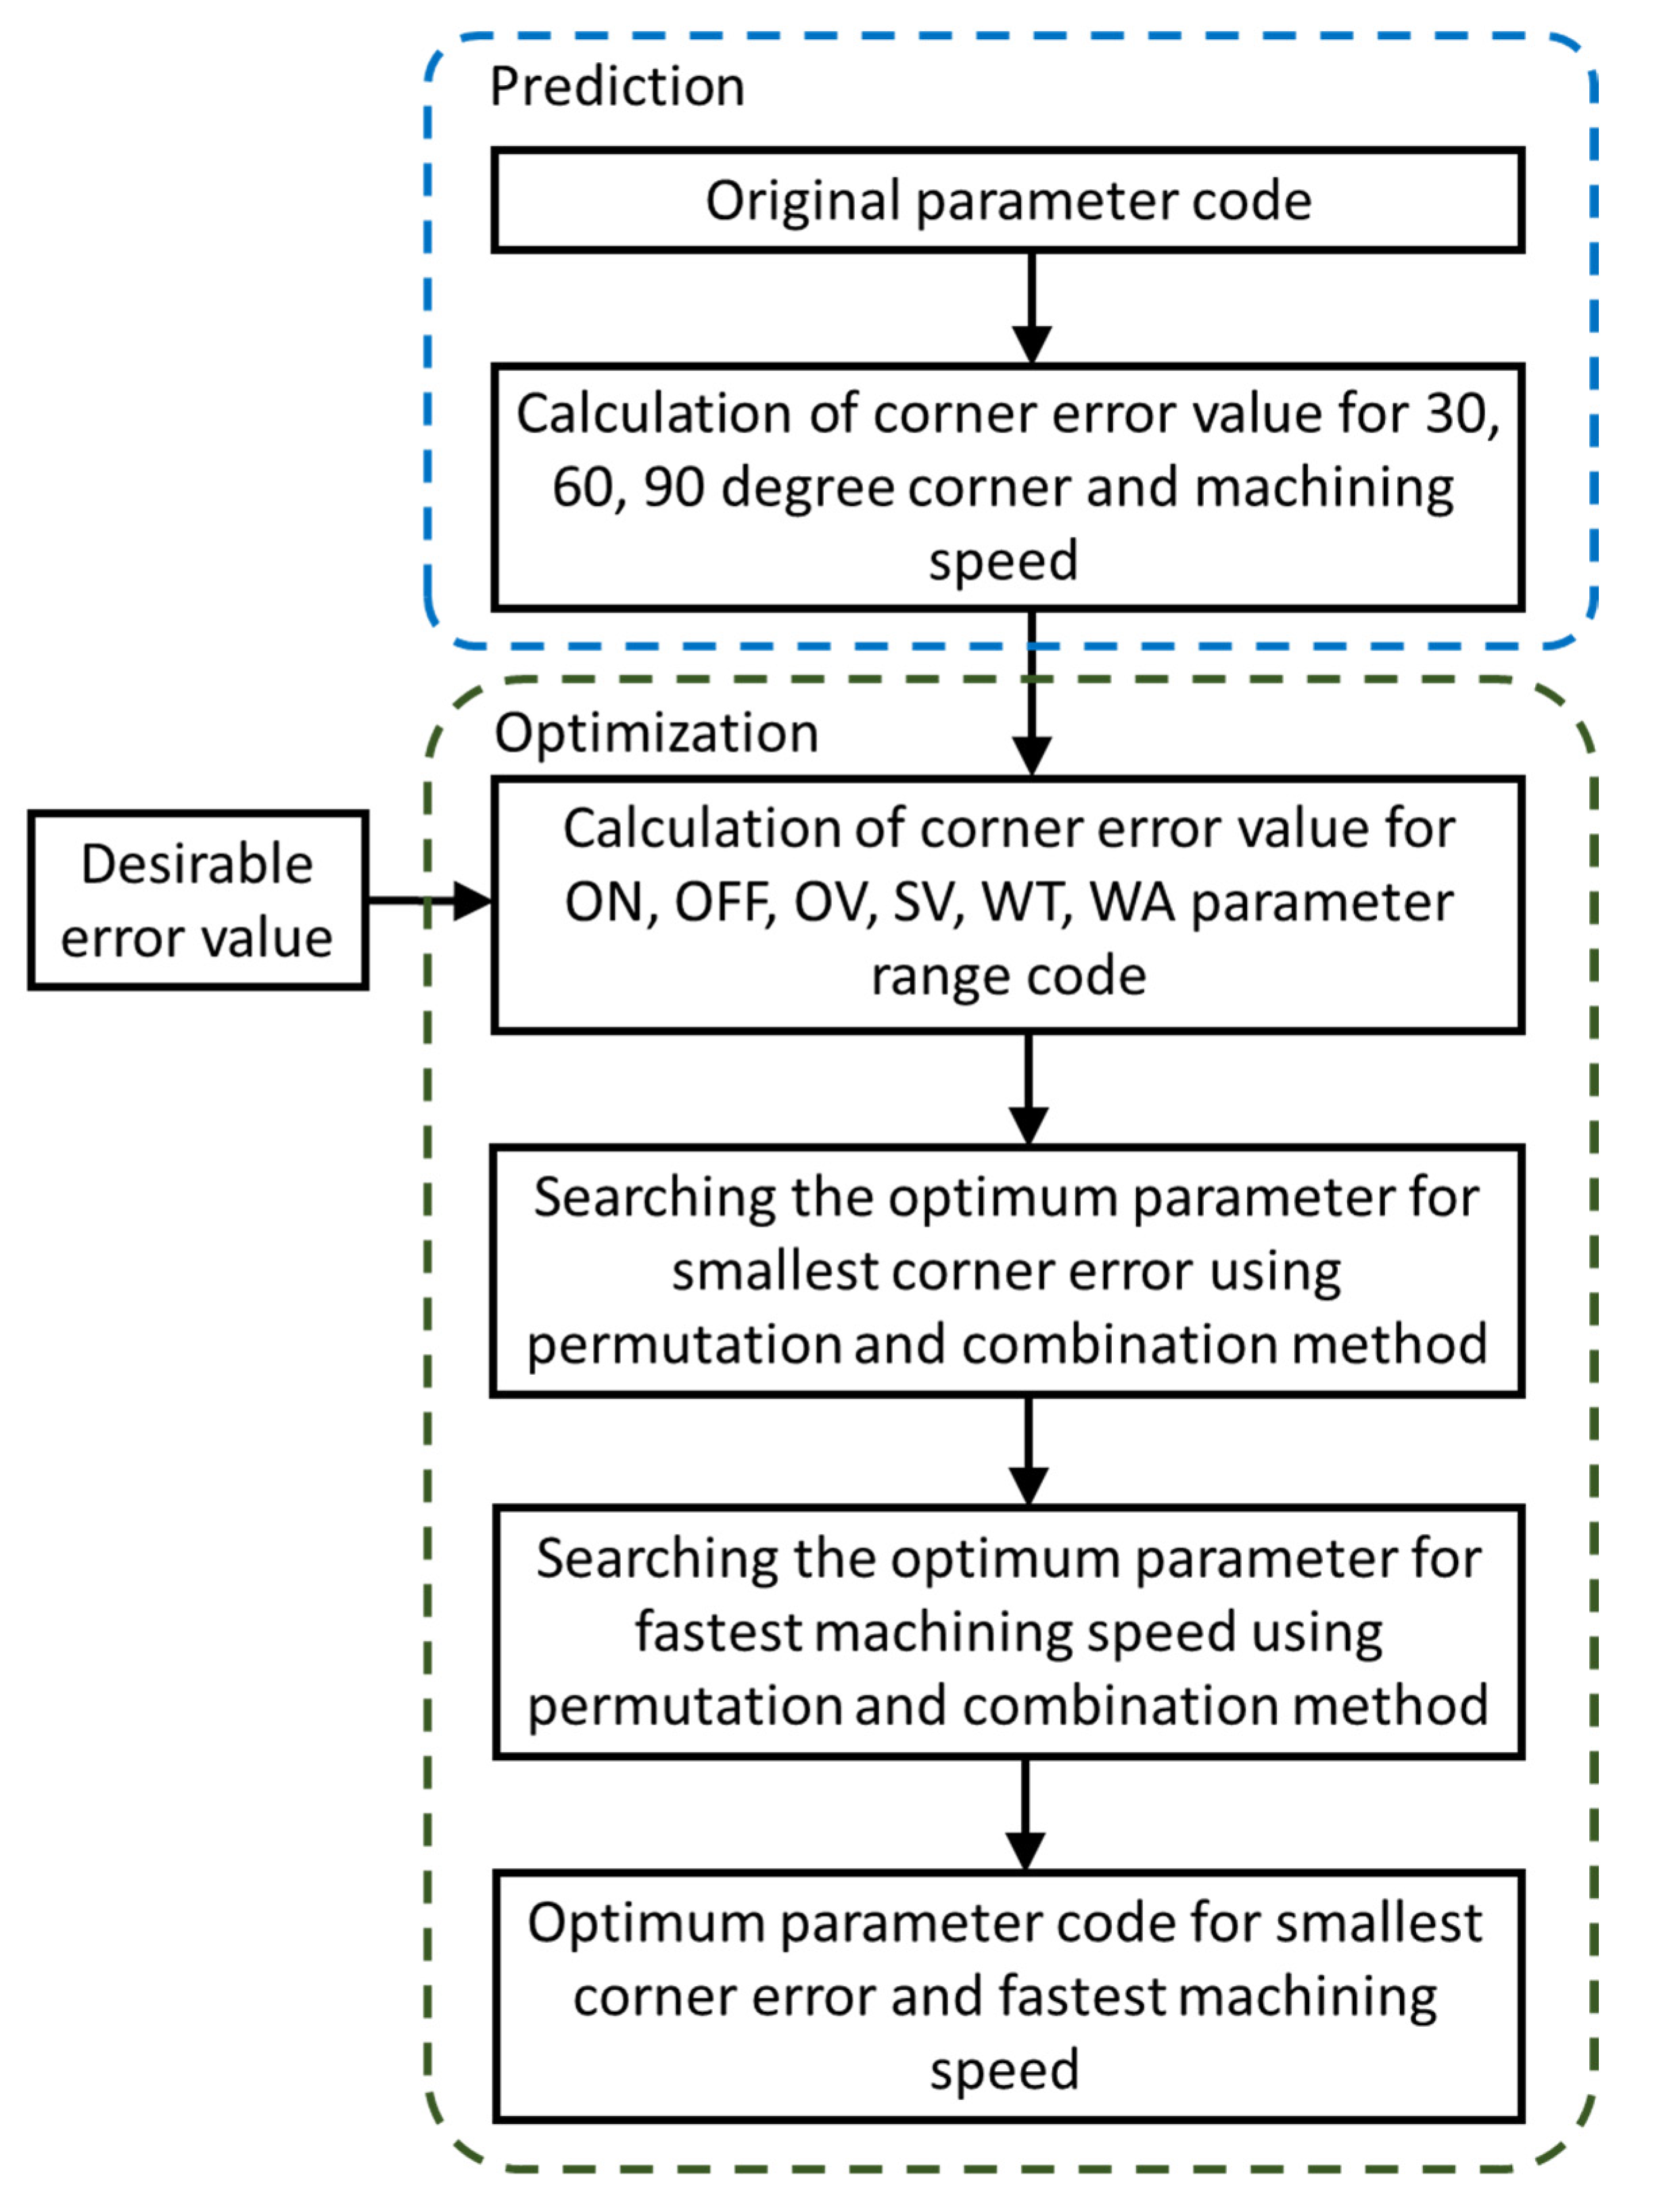
Figure 9 shows the prediction and optimization algorithm. Firstly, the original machining parameters were brought into the regression Equations (3)–(6) to calculate and predict the corner error for 30, 60, 90 degree corners and machining speed. For the optimization, the parameters ranges of ON, OFF, OV, SV, WT, and WA were brought into the regression Equations (3)–(5) to obtain all the corner error values. Furthermore, we used the permutation and combination method, combined with the experimental response surface corner error value data, to select a set of parameters with the corner error that meets the user’s desirable error value. Subsequently, we brought these parameters into the regression Equation (6) to perform a comparison and search for the optimum parameter combination for the fastest machining speed, and then determined these parameters as the best parameter combination for the smallest corner error and fastest machining speed.
The human–machine interface (HMI) was designed according to the developed algorithm and became the corner error and machining speed prediction and optimization system. The system can predict the corner error and machining speed value according to the original input parameter setting code, and then optimize the machining parameter setting code for smallest corner error for 30, 60, and 90 degree corners and for the fastest machining speed according to the user’s desirable corner error. The C# programming language was used to develop the HMI as shown in Figure 10. Through this friendly HMI, the user can smoothly complete the HMI operation. The step by step HMI operation was designed as follows:
  • Input the machining parameters code (shown at area 1 in Figure 10), then choose the predict button. The system will calculate the corner error value for 30°, 60°, 90° corners and the machining speed (shown at area 2 in Figure 10) based on regression Equations (3)–(6). The system also calculates and displays the smallest corner error values. (Area 3 in Figure 10.)
  • Check whether the predicted error value is within the allowable error range. If the predicted error value is larger than the tolerance error, optimization process will be executed.
  • Input the desirable corner error value or use the smallest corner error value calculated by the system (shown at area 3 in Figure 10) into the required accuracy (shown at area 4 in Figure 10) and choose the optimization button.
  • For corner optimization, the system will extract the value in the required accuracy textbox and store it in another variable. Furthermore, use “For Loop” to bring all the parameter ranges into the regression Equations (3)–(5) to calculate all parameter sets, and then store the calculation results in the temporary array matrix 1. Subsequently, use “Foreach” statement to compare the stored calculation results in the temporary array matrix 1 one by one to search for the parameters set that meets the desirable corner error value, and store these parameters in the array matrix 2.
  • Afterward, the parameters in the array matrix 2 are brought into the machining time regression equation (Equation (6)), and the system calculates the machining time and searches the parameters set for the fastest machining time, and then displays them on the optimized parameters (shown at area 4 in Figure 10).
  • Finally, the best parameters can be stored in a CSV format.
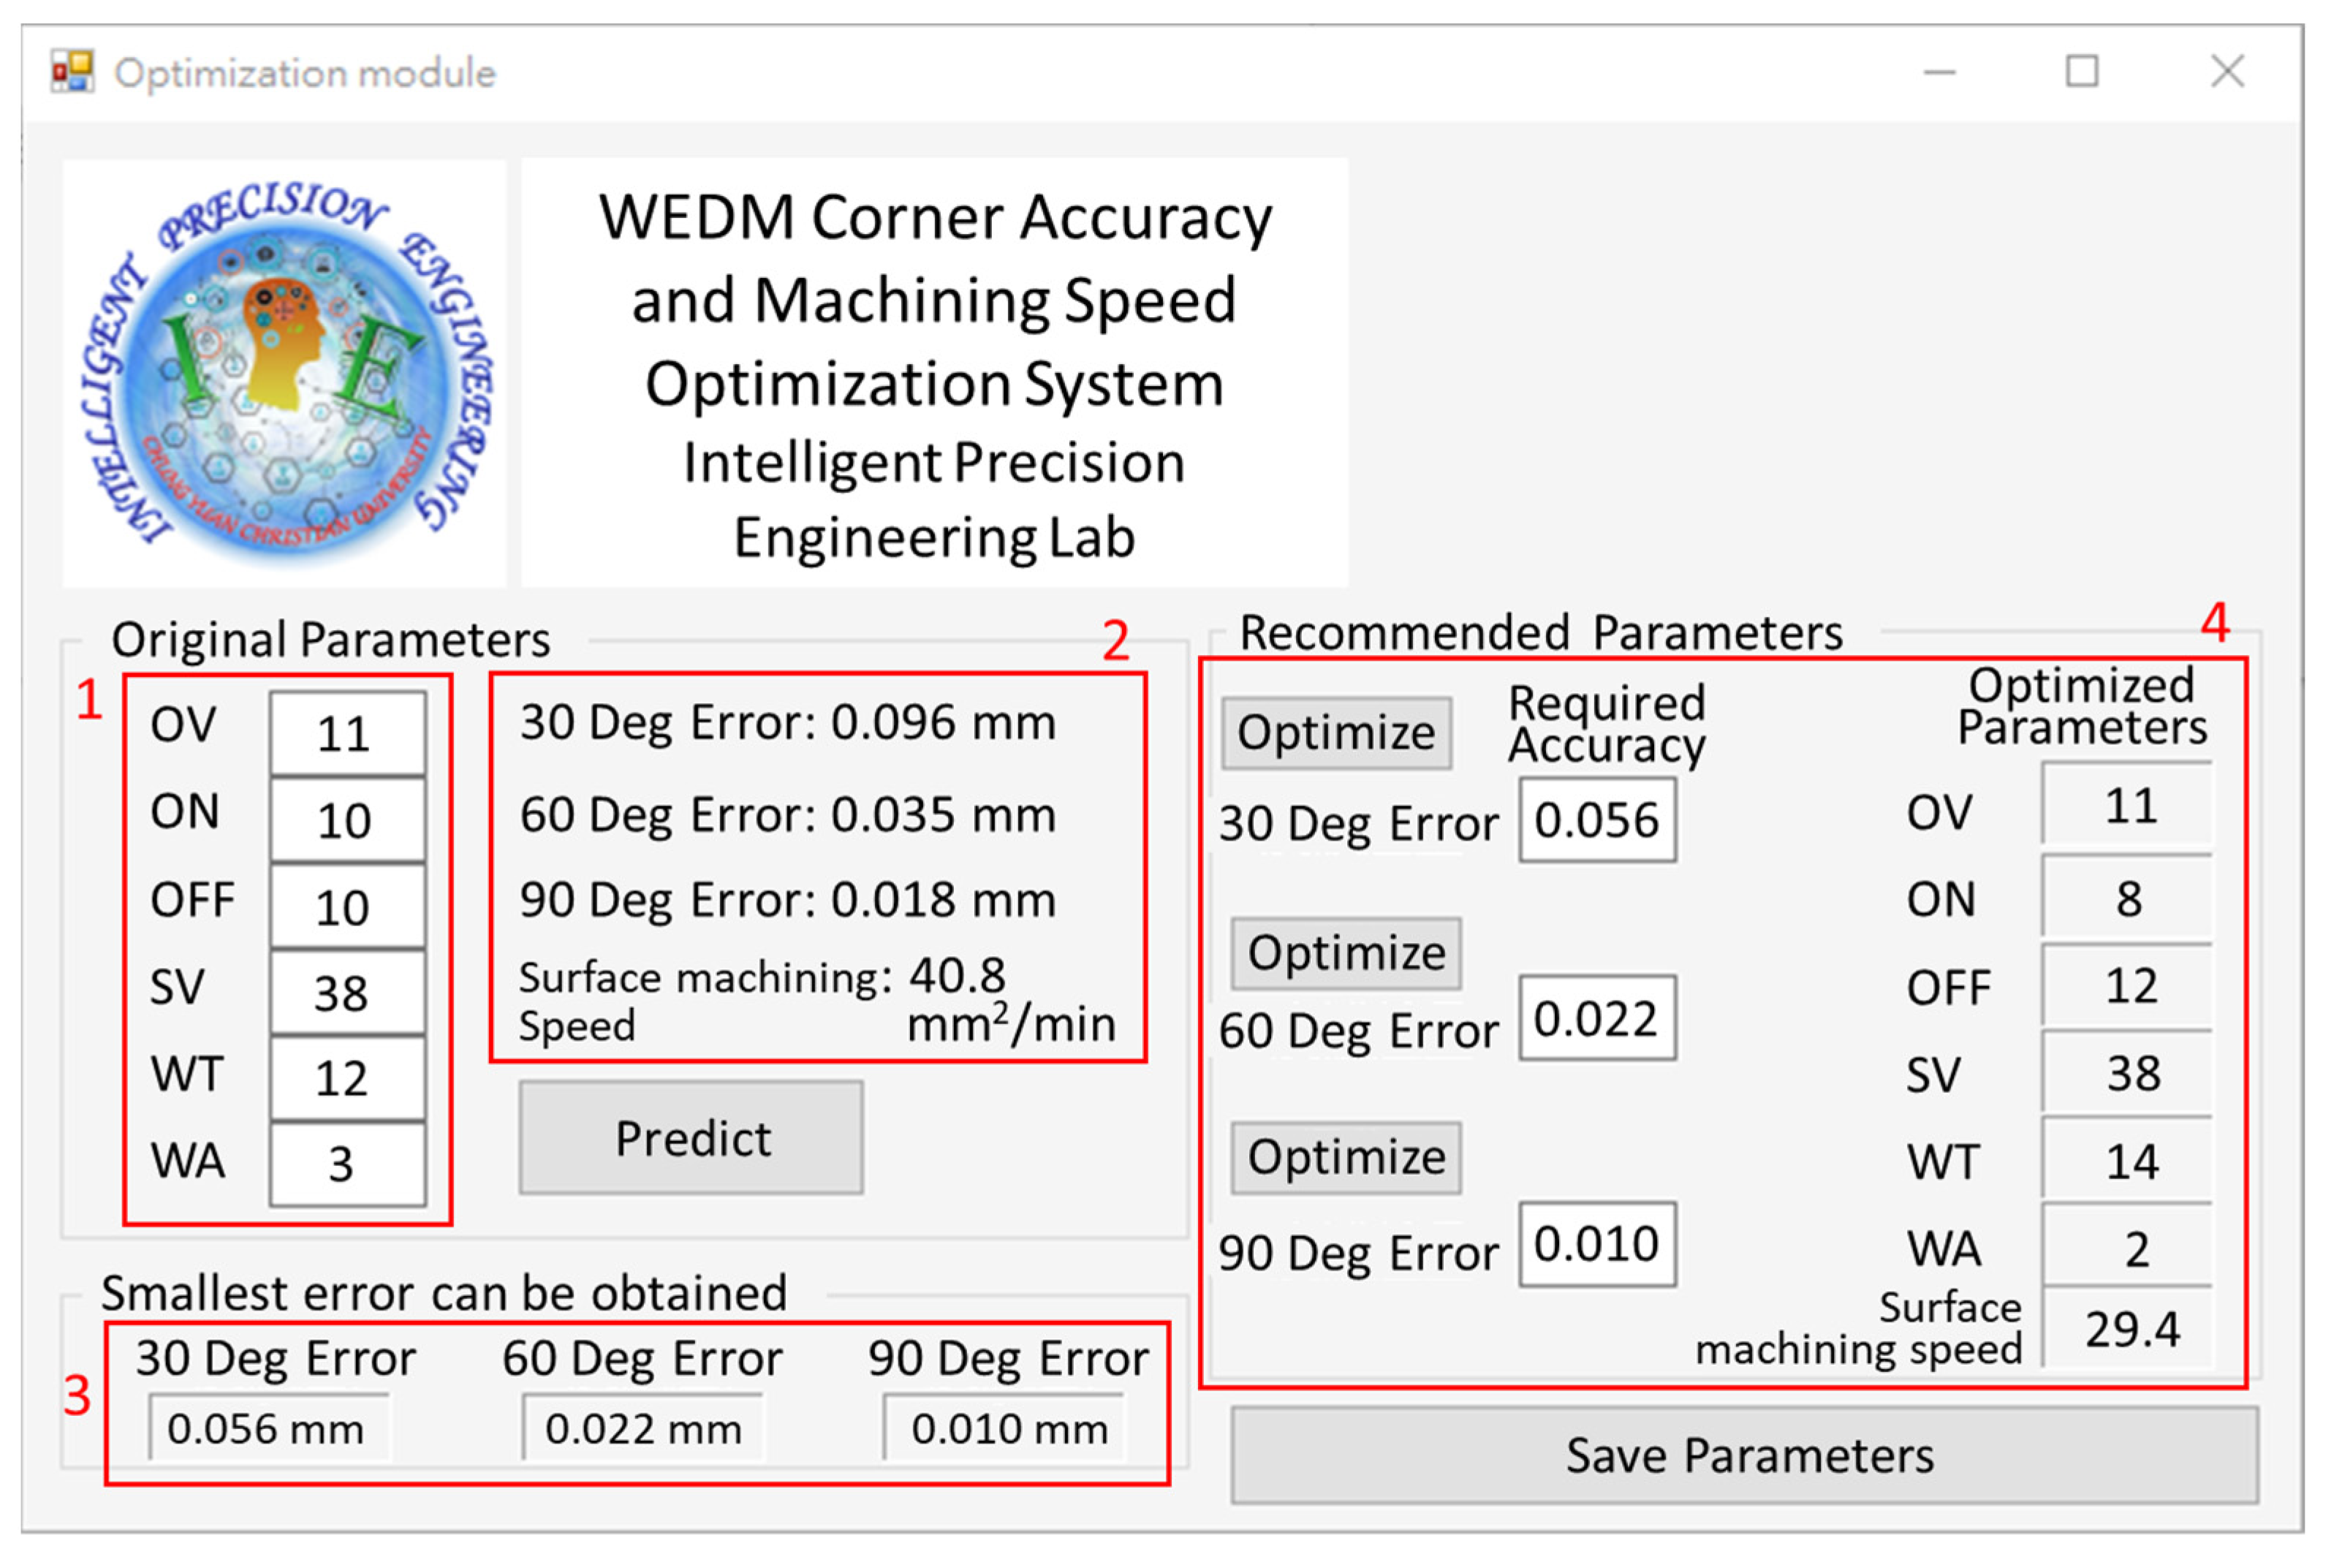
Figure 10. WEDM corner accuracy and machining speed optimization human–machine interface.
Applsci 12 10324 g010

5. Verification Experiments

The verification experiments were carried out to verify the proposed optimization method and system. The corner error verification was mainly to control the corner accuracy error. The verification experiment was divided into two parts. The first part used the developed optimization HMI to obtain the optimal machining parameters. The second part performed the machining using the original parameters and the optimized parameters. Furthermore, the corner errors were measured and compared. Table 12 shows the original parameters and the optimized parameters for the 30, 60, and 90 degree corners that were obtained through the developed optimization system.
After we performed machining using the original parameters, the corner errors were measured, and they showed that the corner errors of the 30, 60, and 90 degree corners were 0.091, 0.030, and 0.018 mm, respectively. Meanwhile, the predicted corner errors calculated by the proposed system were 0.096, 0.035, and 0.018 mm, respectively. Therefore, the accuracies were 94%, 86%, and 99%, respectively, as shown in Table 13.
The corner errors for the 30, 60, and 90 degree corners that resulted from the conducted machining using the optimized parameters were 0.056, 0.024, and 0.011 mm, respectively. Meanwhile, the predicted corner errors calculated by the system were 0.056, 0.022, and 0.010 mm, respectively. Hence, the accuracies were 99%, 91%, and 90%, respectively, as shown in Table 14.
It can be seen from the Table 13 and Table 14 that the difference between the measured and predicted value is very small, which indicates the regression equation obtained after analysis has high accuracy prediction. Table 15 shows the comparison corner error values before and after optimization. It can be seen the corner errors decrease for the 30, 60, and 90 degree corners. In other words, the corner accuracy increased by 39%, 20%, and 33%, respectively, as shown in Table 15.

6. Conclusions

In this study, the optimization of machining parameters to obtain the smallest corner error and fastest machining speed was proposed. The experiments with different machining parameters such as pulse-on time, pulse-off time, open circuit voltage, servo voltage, wire tension, and flushing pressure were conducted. Three different corner degrees of 30, 60, and 90 were chosen for the experiment. The response surface methodology (RSM) was used to analyze and investigate the effect of each parameter on the corner error and machining speed. It was found that for machining 30° and 60° corners, the corner error was mainly due to the effect of the pulse-on time (ON) parameter, followed by the wire tension (WT) parameter. Meanwhile, when machining a 90° corner, the corner error was mainly affected by the wire tension (WT) parameter, followed by the pulse-on time (ON). In addition, when machining different corner angles, the main parameters affected will be different. In terms of machining speed, the pulse-on time (ON) and open circuit voltage (OV) parameters had an influence on corner error and machining speed. Although the wire tension parameter improved the corner accuracy, it had the smallest effect on the machining speed. Meanwhile, the pulse-off time (OFF) parameter had less influence on the corner error.
The machining parameter data combined with the response surface value and the algorithm were used to determine the optimal machining parameters. A corner error and machining speed optimization system with a human–machine interface was built using the C# language program. The results of the verification experiments showed that the corner errors of 30, 60 and 90 degrees before optimization were 0.091, 0.030, and 0.018 mm, respectively, while the corner errors after optimization were 0.056, 0.024, and 0.011 mm, respectively. It can be concluded that the corner errors of 30, 60 and 90 degrees before and after optimization were increased by 39%, 20%, and 33%, respectively. In terms of prediction accuracy of the system, the prediction accuracy of 30, 60, and 90 degrees was 99%, 91%, and 90%, which proves that the proposed method can effectively improve the corner machining accuracy.
The proposed optimization system in this study was used for WEDM rough machining corner error prediction. Therefore, the extension of the proposed optimization system for finishing machining is underway. In addition, the diameter wire and taper shape factors can be included in the future research.

Author Contributions

Conceptualization, S.-M.W. and J.-X.W.; methodology, S.-M.W. and J.-X.W.; software, J.-X.W.; validation, J.-X.W. and H.G.; formal analysis, S.-M.W., J.-X.W. and H.G.; investigation, S.-M.W. and J.-X.W.; resources, S.-M.W. and J.-X.W.; data curation, J.-X.W., R.-Q.T. and H.G.; writing—original draft preparation, S.-M.W. and H.G.; writing—review and editing, S.-M.W. and H.G.; visualization, J.-X.W., R.-Q.T. and H.G.; supervision, S.-M.W. All authors have read and agreed to the published version of the manuscript.

Funding

This research was funded by the Ministry of Science and Technology, grant number MOST 110-2221-E-005-063, MOST 111-2221-E-005 -080 -MY2, and MOST 111-2218-E-005-011.

Conflicts of Interest

The authors declare no conflict of interest.

References

  1. Bhattacharya, A.; Batish, A.; Bhatt, G. Material transfer mechanism during magnetic field-assisted electric discharge machining of AISI D2, D3 and H13 die steel. Proc. Inst. Mech. Eng. Manuf. 2015, 229, 62–74. [Google Scholar] [CrossRef]
  2. Sanchez, J.A.; Rodil, J.L.; Herrero, A.; Lopez de Lacalle, L.N.; Lamikiz, A. On the influence of cutting speed limitation on the accuracy of wire-EDM corner-cutting. J. Mater. Process. Technol. 2007, 182, 574–579. [Google Scholar] [CrossRef]
  3. Selvakumar, G.; Sarkar, S.; Mitra, S. Experimental Investigation on die corner accuracy for wire electrical discharge machining of monel 400 alloy. Proc. IMechE Part B J. Eng. Manuf. 2012, 226, 1694–1704. [Google Scholar] [CrossRef]
  4. Saravanan, M.; Babu, A.S. Parametric optimization of increasing corner accuracy in WEDM on Inconel 625. J. Chem. Pharm. Sci. 2015, 9, 443–447. [Google Scholar]
  5. Han, F.; Zhang, J.; Soichiro, I. Corner error simulation of rough cutting in wire EDM. Precis. Eng. 2007, 31, 331–336. [Google Scholar] [CrossRef]
  6. Hsue, W.J.; Liao, Y.S.; Lu, S.S. Fundamental geometry analysis of wire electrical discharge machining in corner cutting. Int. J. Mach. Tools Manuf. 1999, 39, 651–667. [Google Scholar] [CrossRef]
  7. Dekeyser, W.L.; Snoeys, R. Geometrical accuracy of wire-EDM. In Proceedings of the 9th International Symposium on Electro Machining, Nagoya, Japan, 10–14 April 1989. [Google Scholar]
  8. Obara, H.; Kawai, T.; Ohsumi, T.; Hatano, M. Combined power and path control method to improve corner accuracy of rough cuts by wire EDM (1st report). Int. J. Electr. Mach. 2003, 8, 27–32. [Google Scholar]
  9. Obara, H.; Kawai, T.; Ohsumi, T.; Hatano, M. Combined power and path control method to improve corner accuracy of rough cuts by wire EDM (2nd report). Int. J. Electr. Mach. 2003, 8, 33–38. [Google Scholar]
  10. Chaudhari, R.; Prajapati, P.; Khanna, S.; Vora, J.; Patel, V.K.; Pimenov, D.Y.; Giasin, K. Multi-response optimization of Al2O3 nanopowder-mixed wire electrical discharge machining process parameters of nitinol shape memory alloy. Materials 2022, 15, 2018. [Google Scholar] [CrossRef]
  11. Pandey, G.K.; Patel, P.B.; Kumar, A.; Niranjan, R.S.; Katiyar, V.; Chandra, A.K. Effect of different wire materials on WEDM performance of bio-compatible material. Prod. Eng. Arch. 2022, 28, 50–55. [Google Scholar] [CrossRef]
  12. Chen, Z.; Zhou, H.; Wu, C.; Zhang, G.; Yan, H. A new wire electrode for improving the machining characteristics of high-volume fraction SiCp/Al composite in WEDM. Materials 2022, 15, 4098. [Google Scholar] [CrossRef] [PubMed]
  13. Elyass, W.M.; Sharma, V.; Kantak, G.; Alam, M.M. Performance investigation of wireEDM process parameters. IOP Conf. Ser. Mater. Sci. Eng. 2022, 1224, 012001. [Google Scholar] [CrossRef]
  14. Puri, A.B.; Bhattacharyya, B. An analysis and optimization of the geometrical inaccuracy due to wire lag phenomenon in WEDM. Int. J. Mach. Tools Manuf. 2003, 43, 151–159. [Google Scholar] [CrossRef]
  15. Lodhi, B.K.; Agarwal, S. Optimization of machining parameters in WEDM of AISI D3 steel using Taguchi technique. Procidia CIRP 2014, 14, 194–199. [Google Scholar] [CrossRef] [Green Version]
  16. Kam, M.; Demirtas, M. Analysis of tool vibration and surface roughness during turning process of tempered steel samples using Taguchi method. Proc. Inst. Mech. Eng. E J. Process. Mech. Eng. 2021, 235, 1429–11438. [Google Scholar] [CrossRef]
  17. Singh, V.; Pradhan, S.K. Optimization of WEDM parameters using Taguchi technique and response surface methodology in machining of AISI D2 steel. Procidia Eng. 2014, 97, 1597–1608. [Google Scholar] [CrossRef] [Green Version]
  18. Kam, M.; Ipekci, A.; Argun, K. Experiment investigation and optimization of machining process of deep cryogenically treated and tempered steels in electrical discharge machining process. Proc. Inst. Mech. Eng. E J. Process. Mech. Eng. 2022, 236, 1927–1935. [Google Scholar] [CrossRef]
  19. Kam, M. Effect of deep cryogenic treatment on machinability, hardness and microstructure in dry turning process of tempered steels. Proc. Inst. Mech. Eng. E J. Process. Mech. Eng. 2021, 235, 927–936. [Google Scholar] [CrossRef]
  20. Mir, M.J.; Sheikh, K.; Singh, B.; Malhotra, N. Modeling and analysis of machining parameters for surface roughness in powder mixed EDM using RSM approach. Int. J. Eng. Sci. Technol. 2012, 4, 45–52. [Google Scholar] [CrossRef]
  21. Doreswamy, D.; Shreyas, D.S.; Bhat, S.K.; Rao, R.N. Optimization of material removal rate and surface characterization of wire electric discharge machined Ti-6Al-4V alloy by response surface method. Manuf. Rev. 2022, 9, 15. [Google Scholar] [CrossRef]
  22. Saha, A.; Mondal, S.C. Multi-objective optimization in WEDM process of nanostructured hardfacing materials through hybrid techniques. Measurement 2016, 94, 46–59. [Google Scholar] [CrossRef]
  23. Kumar, S.S.; Uthayakumar, M.; Kumaran, S.T.; Parameswaran, P.; Mohandas, E.; Kempulraj, G.; Ramesh Babu, B.S.; Natarajan, S.A. Parametric optimization of wire electrical discharge machining on aluminum-based composites through grey relational analysis. J. Manuf. Process. 2015, 20, 33–39. [Google Scholar] [CrossRef]
  24. Chalisgaonkar, R.; Kumar, J. Multi-response optimization and modeling of trim cut WEDM operation of commercially pure titanium (CPTi) considering multiple user’s preference. Eng. Sci. Technol. Int. J. 2015, 18, 125–134. [Google Scholar] [CrossRef]
  25. Myersm, R.H.; Montgomery, D.C.; Anderson-cook, C.M. Response Surface Methodology: Process and Product Optimization Using Designed Experiment; John Wiley and Sons, Inc.: Hoboken, NJ, USA, 2009. [Google Scholar]
  26. Ferreira, S.L.C.; Bruns, R.E.; Ferreira, H.S.; Matos, G.D.; David, J.M.; Brandão, G.C.; da Silva, E.G.P.; Portugal, L.A.; dos Reis, P.S.; Souza, A.S.; et al. Box-Behnken design: An alternative for the optimization of analytical methods. Anal. Chim. Acta 2007, 597, 179–186. [Google Scholar] [CrossRef] [PubMed]
  27. Amini, M.; Younesi, H.; Bahramifar, N.; Lorestani, A.A.Z.; Ghorbani, F.; Daneshi, A.; Sharifzadeh, M. Application of response surface methodology for optimization of lead biosorption in an aqueous solution by aspergillus niger. J. Hazard. Mater. 2008, 154, 694–702. [Google Scholar]
  28. Kalavathy, M.H.; Regupathi, I.; Pillai, M.G.; Miranda, L.R. Modelling, analysis and optimization of adsorption parameters for H3PO4 activated rubber wood sawdust using response surface methodology (RSM). Colloids Surf. B 2009, 70, 35–40. [Google Scholar] [CrossRef]
  29. Le Man, H.; Behera, S.K.; Park, H.S. Optimization of operational parameters for ethanol production from Korean food waste leachate. Int. J. Environ. Sci. Technol. 2010, 7, 157–164. [Google Scholar] [CrossRef] [Green Version]
  30. Singh, M.A.; Joshi, K.; Hanzel, O.; Singh, R.; Sajgalik, P.; Marla, D. Influence of open voltage and servo voltage during Wire-EDM of silicon carbides. Procedia CIRP Conf. Electro Phys. Chem. Mach. 2020, 95, 285–289. [Google Scholar] [CrossRef]
  31. Vala, U.H.; Sama, M.R. A review on different effects on flushing of dielectric fluid in WEDM. Int. J. Adv. Res. Sci. Eng. 2017, 6, 37–44. [Google Scholar]
  32. Mondal, S.K.; Saha, A.K.; Sinha, A. Removal of ciprofloxacin using modified advanced oxidation processes: Kinetics, pathways and process optimization. J. Clean. Prod. 2018, 171, 1203–1214. [Google Scholar] [CrossRef]
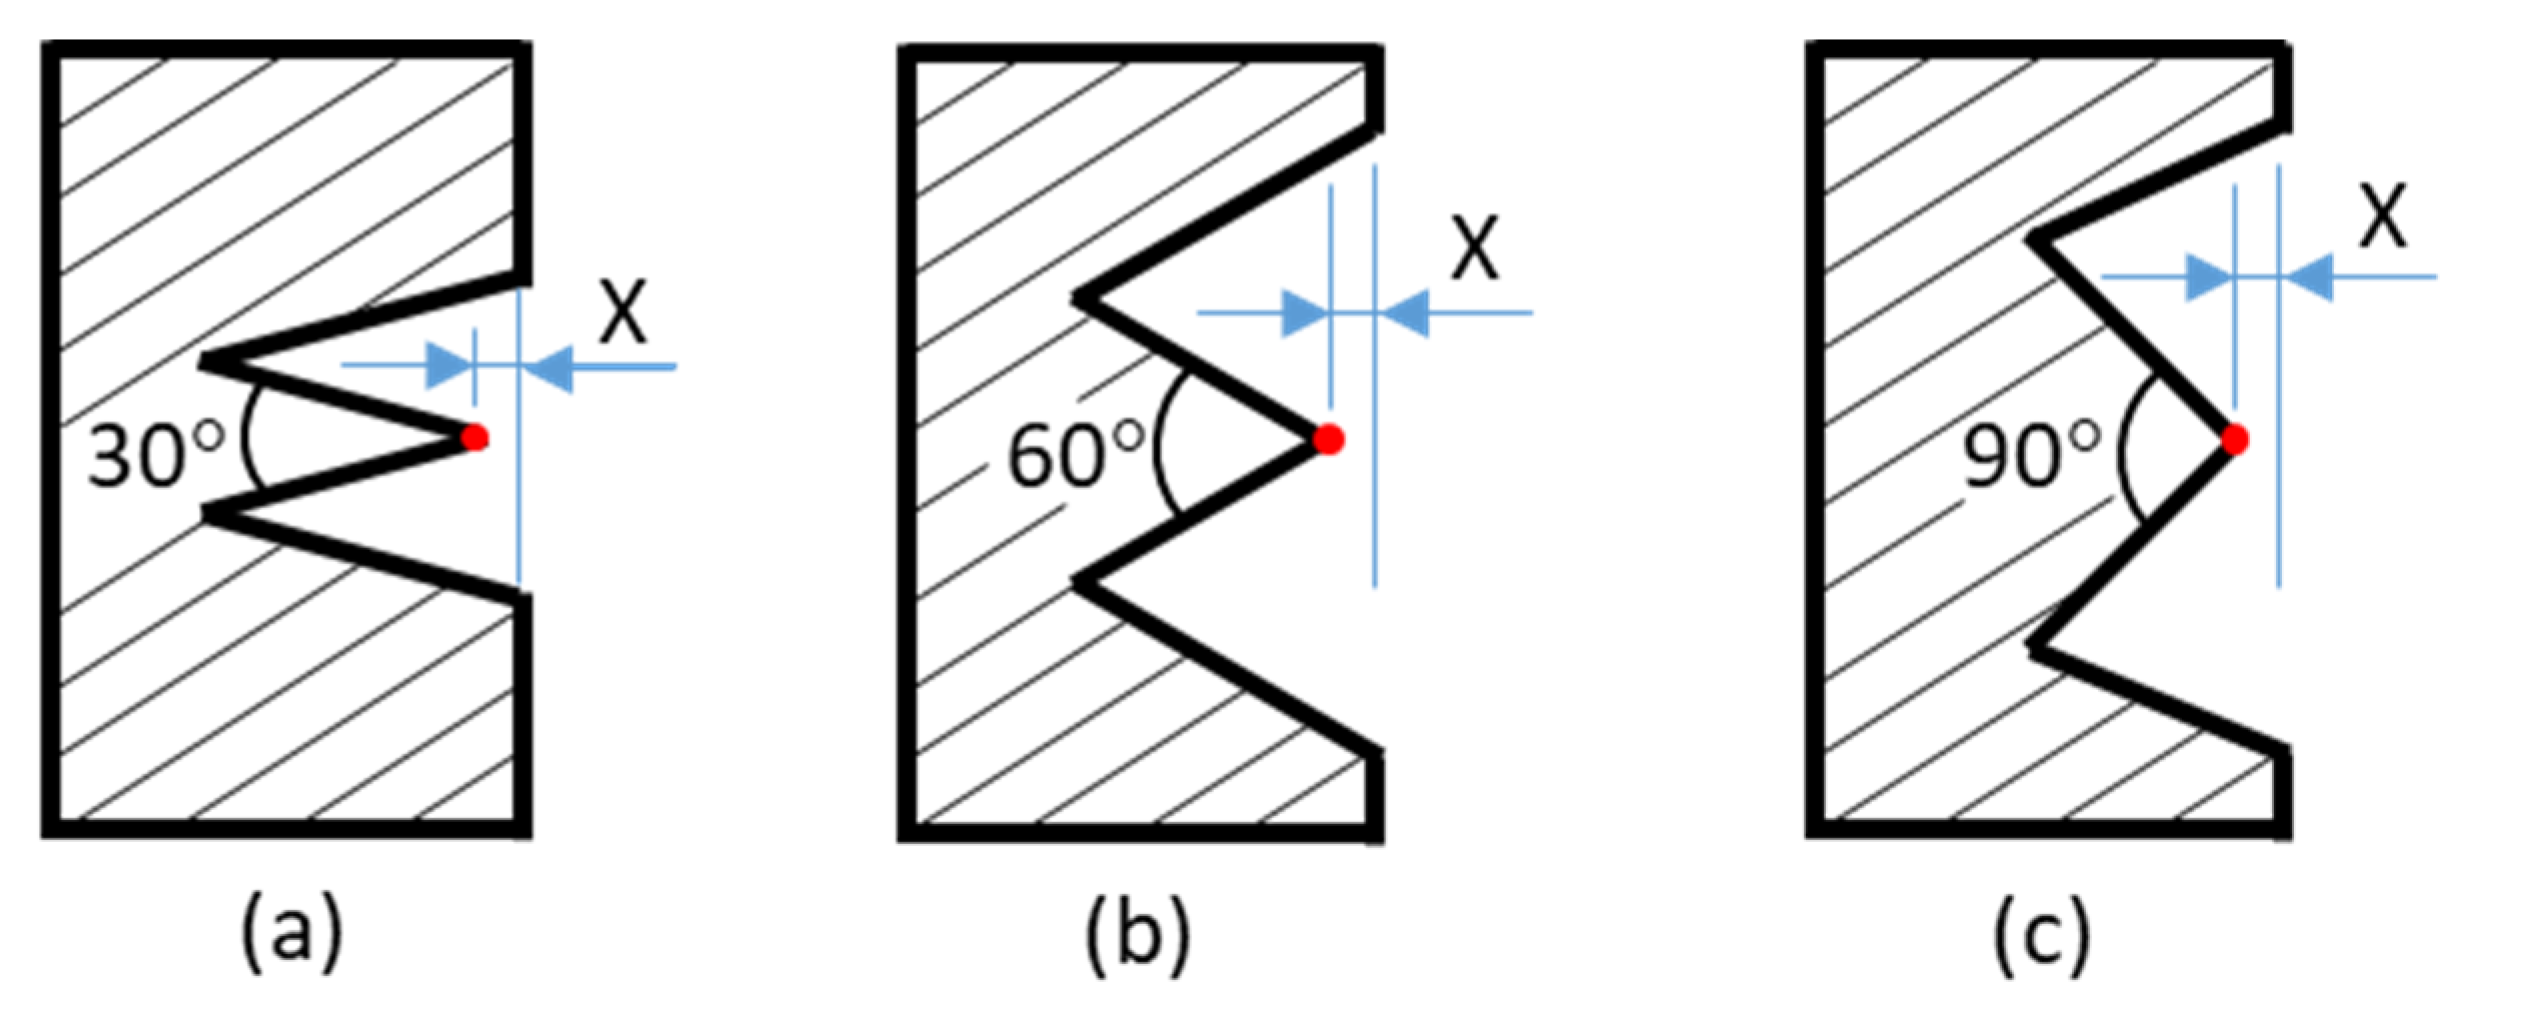
Figure 1. Corner error measurement (a) 30°, (b) 60°, (c) 90°.
Applsci 12 10324 g001
Figure 2. Flowchart of experiment.
Applsci 12 10324 g002
Figure 3. Pareto chart response surface model for 30° corner.
Applsci 12 10324 g003
Figure 4. 2D contour and 3D surface plots corner error for 30° corner.
Applsci 12 10324 g004
Figure 5. 2D contour and 3D surface plots corner error for 60° corner.
Applsci 12 10324 g005
Figure 6. 2D contour and 3D surface plots corner error for 90° corner.
Applsci 12 10324 g006
Figure 7. 2D contour and 3D surface plots for machining speed.
Applsci 12 10324 g007
Figure 8. The optimization plot for (a) 30°, (b) 60°, (c) 90°, and (d) machining speed.
Applsci 12 10324 g008aApplsci 12 10324 g008b
Figure 9. Algorithm of prediction and optimization for corner error and machining speed.
Applsci 12 10324 g009
Table 1. Machining parameters with three levels.
ParameterLevel (Code)Code Level/Value Range
LowMidHigh
OV911131–32 (level)/50–140 V
ON810121–24 (level)/50–1200 ns
OFF810124–50 (level)/4–50 μs
SV36384016–75 (level)/16–75 V
WT1012141–20 (level)/300–2200 g
WA2341–8 (level)/increase or decrease proportionally
Table 2. Experiment design based on Box–Behnken RSM.
OVONOFFSVWTWA
11101038123
1310838124
9101238122
1110840122
1181238143
11121038144
910838124
13101238122
13101036143
9121036123
13101238124
9101040103
11101038123
981040123
1112838103
1381040123
11121238143
11101038123
11101236122
9101036103
1110836124
9121040123
981036123
1181038102
1181038104
1181038144
13101040103
11101038123
13101040143
1381036123
11121038142
9101040143
1310838122
11101240122
11101038123
11121038104
11101236124
118838143
1110836122
1181238103
11101038123
11101240124
9101036143
910838122
13121036123
118838103
13101036103
1181038142
9101238124
1110840124
1112838143
11121238103
11121038102
13121040123
Table 3. ANOVA results of quadratic response surface model for 30° corner.
SourceSum of SquaresdfMean SquareF-Valuep-Value (Prob > F)Remarks
Model0.008290270.00030733.31<0.0001Significant
ON0.00522810.005228567.18<0.0001Significant
OFF0.00007610.0000768.280.0079Significant
OV0.00018810.00018820.410.0001Significant
SV0.00007710.0000778.360.0077Significant
WT0.00170210.001702184.68<0.0001Significant
WA0.00015410.00015416.670.0004Significant
ON OFF0.00001810.0000181.950.1741
ON OV0.00000210.0000020.170.6813
ON SV0.00001110.0000111.150.2943
ON WT0.00001510.0000151.640.2115
ON WA0.00000010.0000000.000.9969
OFF OV0.00000110.0000010.060.8028
OFF SV0.00000010.0000000.050.8177
OFF WT0.00000010.0000000.000.9523
OFF WA0.00000010.0000000.020.8930
OV SV0.00000010.0000000.001.0000
OV WT0.00000010.0000000.000.9847
OV WA0.00000310.0000030.360.5530
SV WT0.00000310.0000030.340.5654
SV WA0.00000810.0000080.870.3601
WT WA0.00000310.0000030.360.5526
ON20.00007010.0000707.640.0103Significant
OFF20.00026310.00026328.54<0.0001Significant
OV20.00005610.0000566.120.0203Significant
SV20.00009110.0000919.840.0042Significant
WT20.00047810.00047851.85<0.0001Significant
WA20.00003710.0000374.030.0552
Residual0.000240260.000009
Lack-of-Fit0.000191210.0000090.940.5919
Pure Error0.00004850.000010
Cor. Total0.00852953
Table 4. ANOVA results of quadratic response surface model for 60° corner.
SourceSum of SquaresdfMean SquareF-Valuep-Value (Prob > F)Remarks
Model0.001396270.0000527.95<0.0001Significant
ON0.00064710.00064799.50<0.0001Significant
OFF0.00002810.0000284.270.0490Significant
OV0.00003610.0000365.530.0266Significant
SV0.00002210.0000223.390.0770
WT0.00019610.00019630.22<0.0001Significant
WA0.00001010.0000101.500.2316
ON OFF0.00000110.0000010.170.6808
ON OV0.00002910.0000294.480.0440Significant
ON SV0.00000010.0000000.010.9226
ON WT0.00000510.0000050.690.4130
ON WA0.00000110.0000010.210.6478
OFF OV0.00001310.0000131.940.1760
OFF SV0.00000310.0000030.480.4943
OFF WT0.00000210.0000020.290.5965
OFF WA0.00000210.0000020.340.5623
OV SV0.00000210.0000020.310.5839
OV WT0.00000010.0000000.010.9307
OV WA0.00000010.0000000.080.7858
SV WT0.00000010.0000000.080.7837
SV WA0.00000010.0000000.080.7837
WT WA0.00000010.0000000.050.8297
ON20.00000510.0000050.720.4024
OFF20.00005110.0000517.880.0094Significant
OV20.00000810.0000081.220.2799
SV20.00021910.00021933.69<0.0000Significant
WT20.00010210.00010215.630.0005Significant
WA20.00000010.0000000.060.8056
Residual0.000169260.000007
Lack-of-Fit0.000151210.0000072.040.2197
Pure Error0.00001850.000004
Cor. Total0.00156553
Table 5. ANOVA results of quadratic response surface model for 90° corner.
SourceSum of SquaresdfMean SquareF-Valuep-Value (Prob > F)Remarks
Model0.000586270.0000225.15<0.0001Significant
ON0.00011510.00011527.19<0.0001Significant
OFF0.00002910.0000296.810.0149Significant
OV0.00007510.00007517.780.0003Significant
SV0.00003810.0000389.000.0059Significant
WT0.00019710.00019746.82<0.0001Significant
WA0.00003510.0000358.260.0080Significant
ON OFF0.00000110.0000010.270.6097
ON OV0.00000010.0000000.060.8025
ON SV0.00000010.0000000.000.9840
ON WT0.00000010.0000000.020.8870
ON WA0.00000210.0000020.560.4621
OFF OV0.00000310.0000030.650.4288
OFF SV0.00000010.0000000.030.8646
OFF WT0.00000110.0000010.160.6910
OFF WA0.00000010.0000000.000.9501
OV SV0.00000010.0000000.120.7332
OV WT0.00000110.0000010.270.6097
OV WA0.00000010.0000000.040.8470
SV WT0.00001110.0000112.640.1162
SV WA0.00000210.0000020.470.4969
WT WA0.00000110.0000010.290.5979
ON20.00000510.0000051.280.2685
OFF20.00000010.0000000.010.9144
OV20.00001010.0000102.420.1318
SV20.00005610.00005613.310.0012Significant
WT20.00000110.0000010.350.5615
WA20.00000310.0000030.670.4195
Residual0.000110260.000004
Lack-of-Fit0.000094210.0000041.470.3562
Pure Error0.00001550.000003
Cor. Total0.00069553
Table 6. Pulse-on time (ON) vs. corner error.
Corner DegreeON Parameter (Code)
Corner Error (mm)
810 12
30°0.0760.0910.101
60°0.0290.0340.041
90°0.0180.0220.023
Table 7. Pulse-off time (OFF) vs. corner error.
Corner DegreeOFF Parameter (Code)
Corner Error (mm)
810 12
30°0.1030.0930.088
60°0.0400.0380.035
90°0.0270.0250.024
Table 8. Open circuit voltage (OV) vs. corner error.
Corner DegreeOV Parameter (Code)
Corner Error (mm)
911 13
30°0.0900.0930.099
60°0.0350.0350.040
90°0.0200.0200.021
Table 9. Servo voltage (SV) vs. corner error.
Corner DegreeSV Parameter (Code)
Corner Error (mm)
363840
30°0.0920.0940.097
60°0.0310.0350.042
90°0.0170.0180.024
Table 10. Wire tension (WT) vs. corner error.
Corner DegreeWT Parameter (Code)
Corner Error (mm)
101214
30°0.1020.0900.086
60°0.0360.0340.025
90°0.0290.0210.017
Table 11. Flushing pressure (WA) vs. corner error.
Corner DegreeWA Parameter (Code)
Corner Error (mm)
234
30°0.0890.0980.109
60°0.0350.0360.037
90°0.0230.0240.025
Table 12. Original parameters and optimized parameters obtained from the developed optimization system.
Parameter30° Corner60° Corner90° Corner
Original ParameterOptimized ParameterOriginal ParameterOptimized ParameterOriginal ParameterOptimized Parameter
OV111011111111
ON108108108
OFF101110101012
SV383738383838
WT121412141214
WA323232
Table 13. Corner error using original parameter.
Corner DegreePredicted Corner Error (mm)Measured Corner Error (mm)Prediction Accuracy (%)
300.0960.09194
600.035 0.03086
900.0180.01899
Table 14. Corner error using optimized parameters.
Corner DegreePredicted Corner Error (mm)Measured Corner Error (mm)Prediction Accuracy (%)
300.0560.05699
600.0220.02491
900.0100.01190
Table 15. Comparison of corner error values before and after optimization of parameters.
Corner DegreeCorner Error before Optimization (mm)Corner Error after Optimization (mm)Improvement Accuracy (%)
300.0910.05639
600.0300.02420
900.0180.01133
Publisher’s Note: MDPI stays neutral with regard to jurisdictional claims in published maps and institutional affiliations.