
Machine Learning-Based Classification of Mushrooms Using a Smartphone Application


Abstract
1. Introduction
2. Materials and Methods
2.1. Mushroom Images
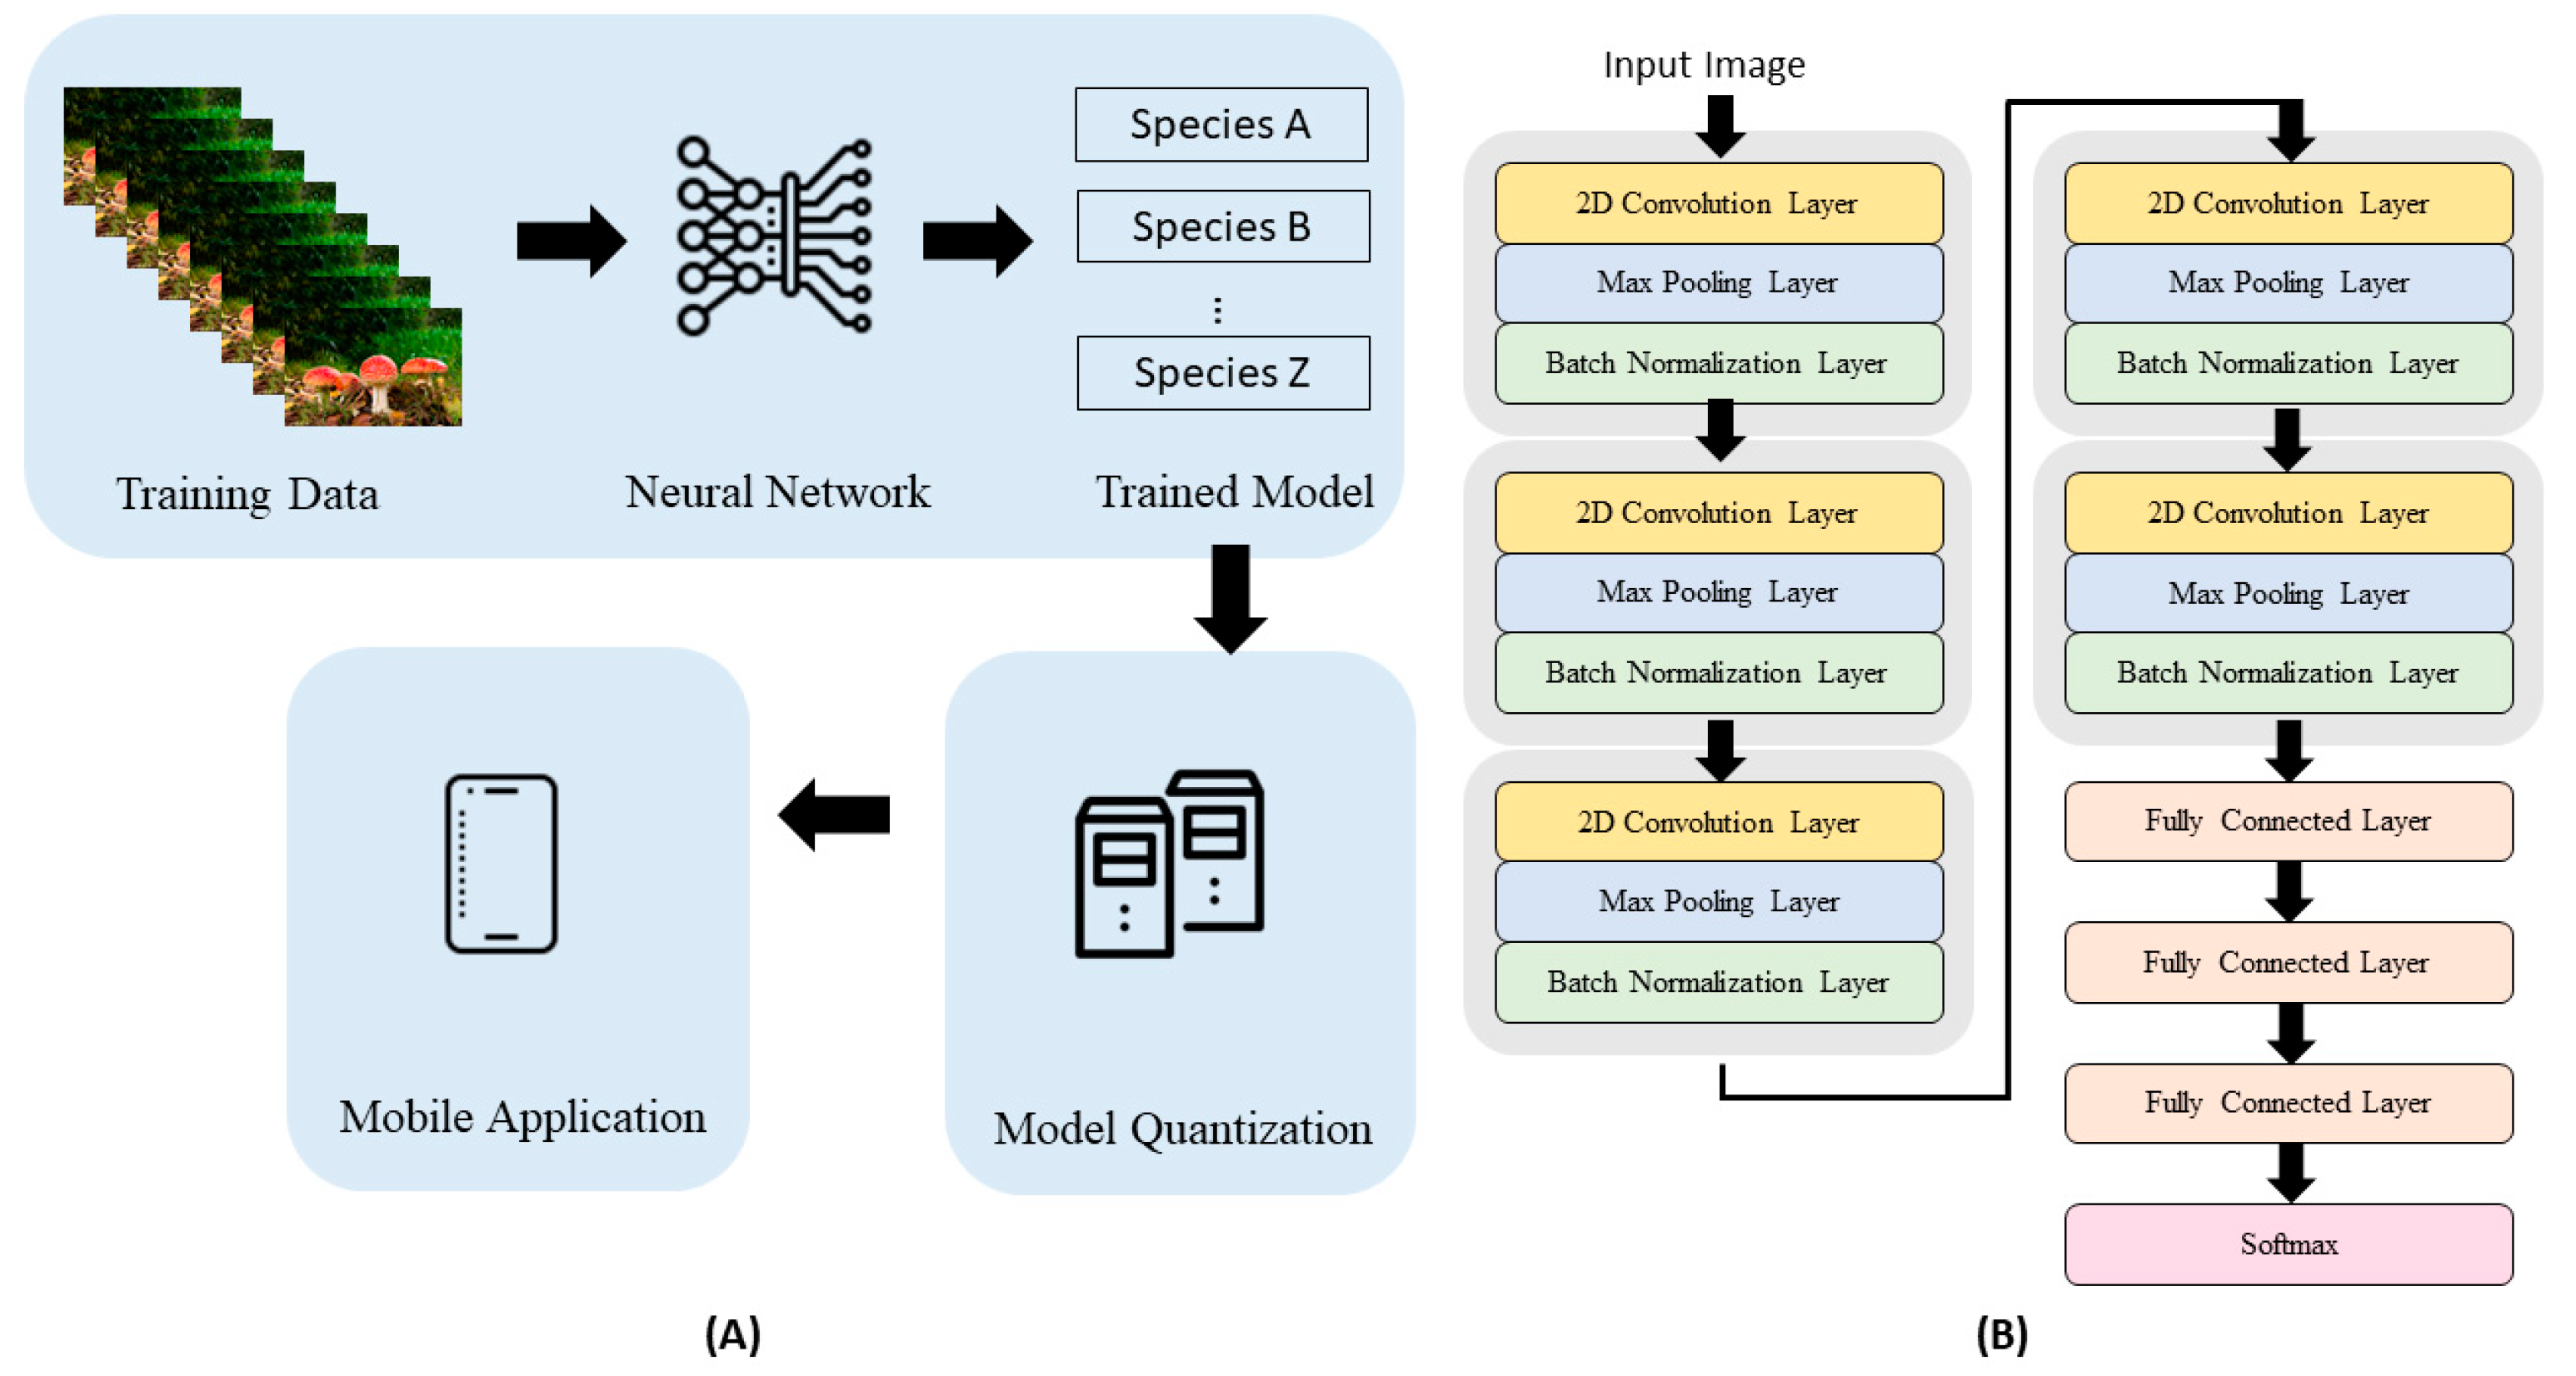
2.2. Machine Learning Algorithm
2.3. Classifier Training and Testing
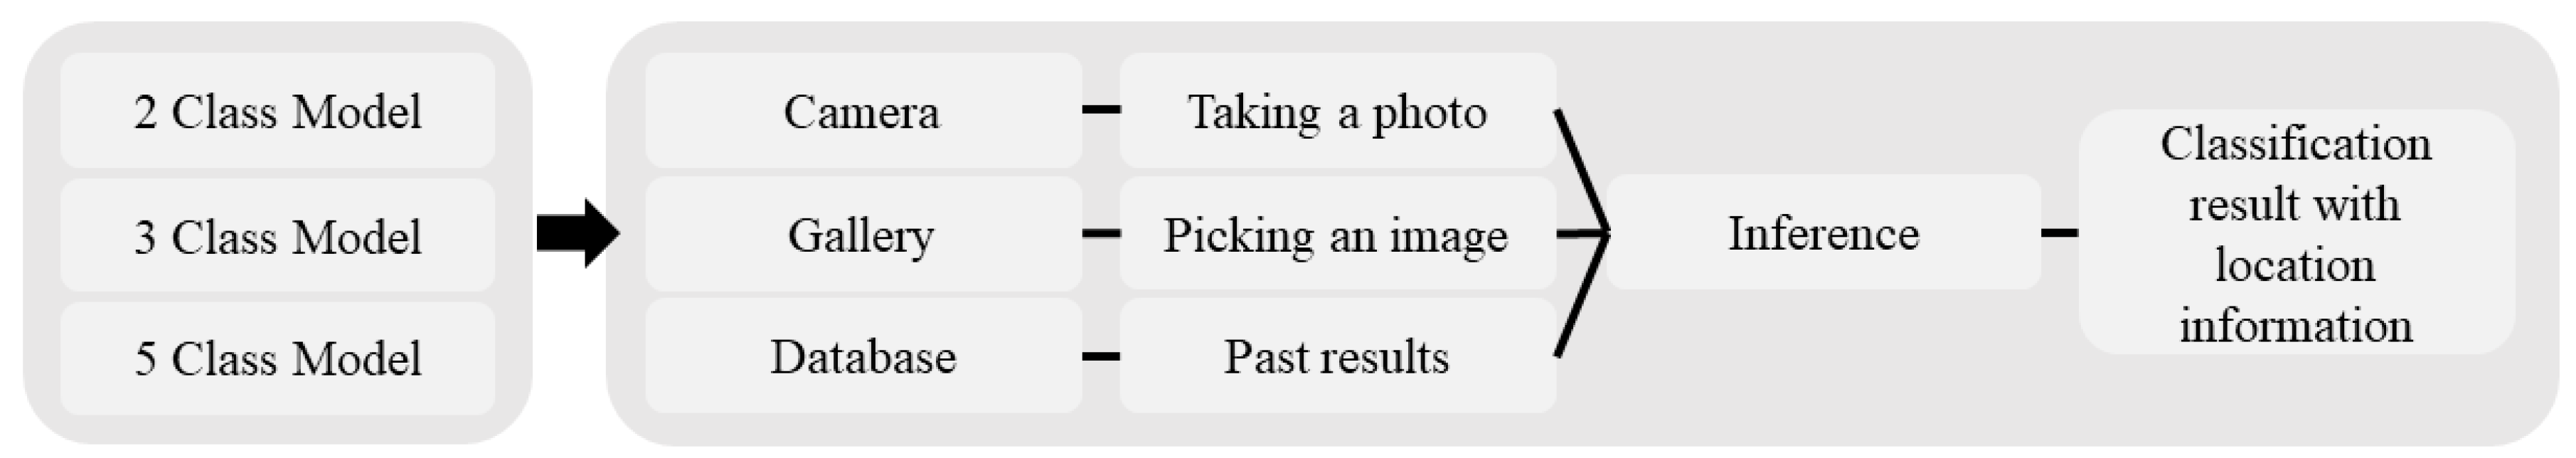
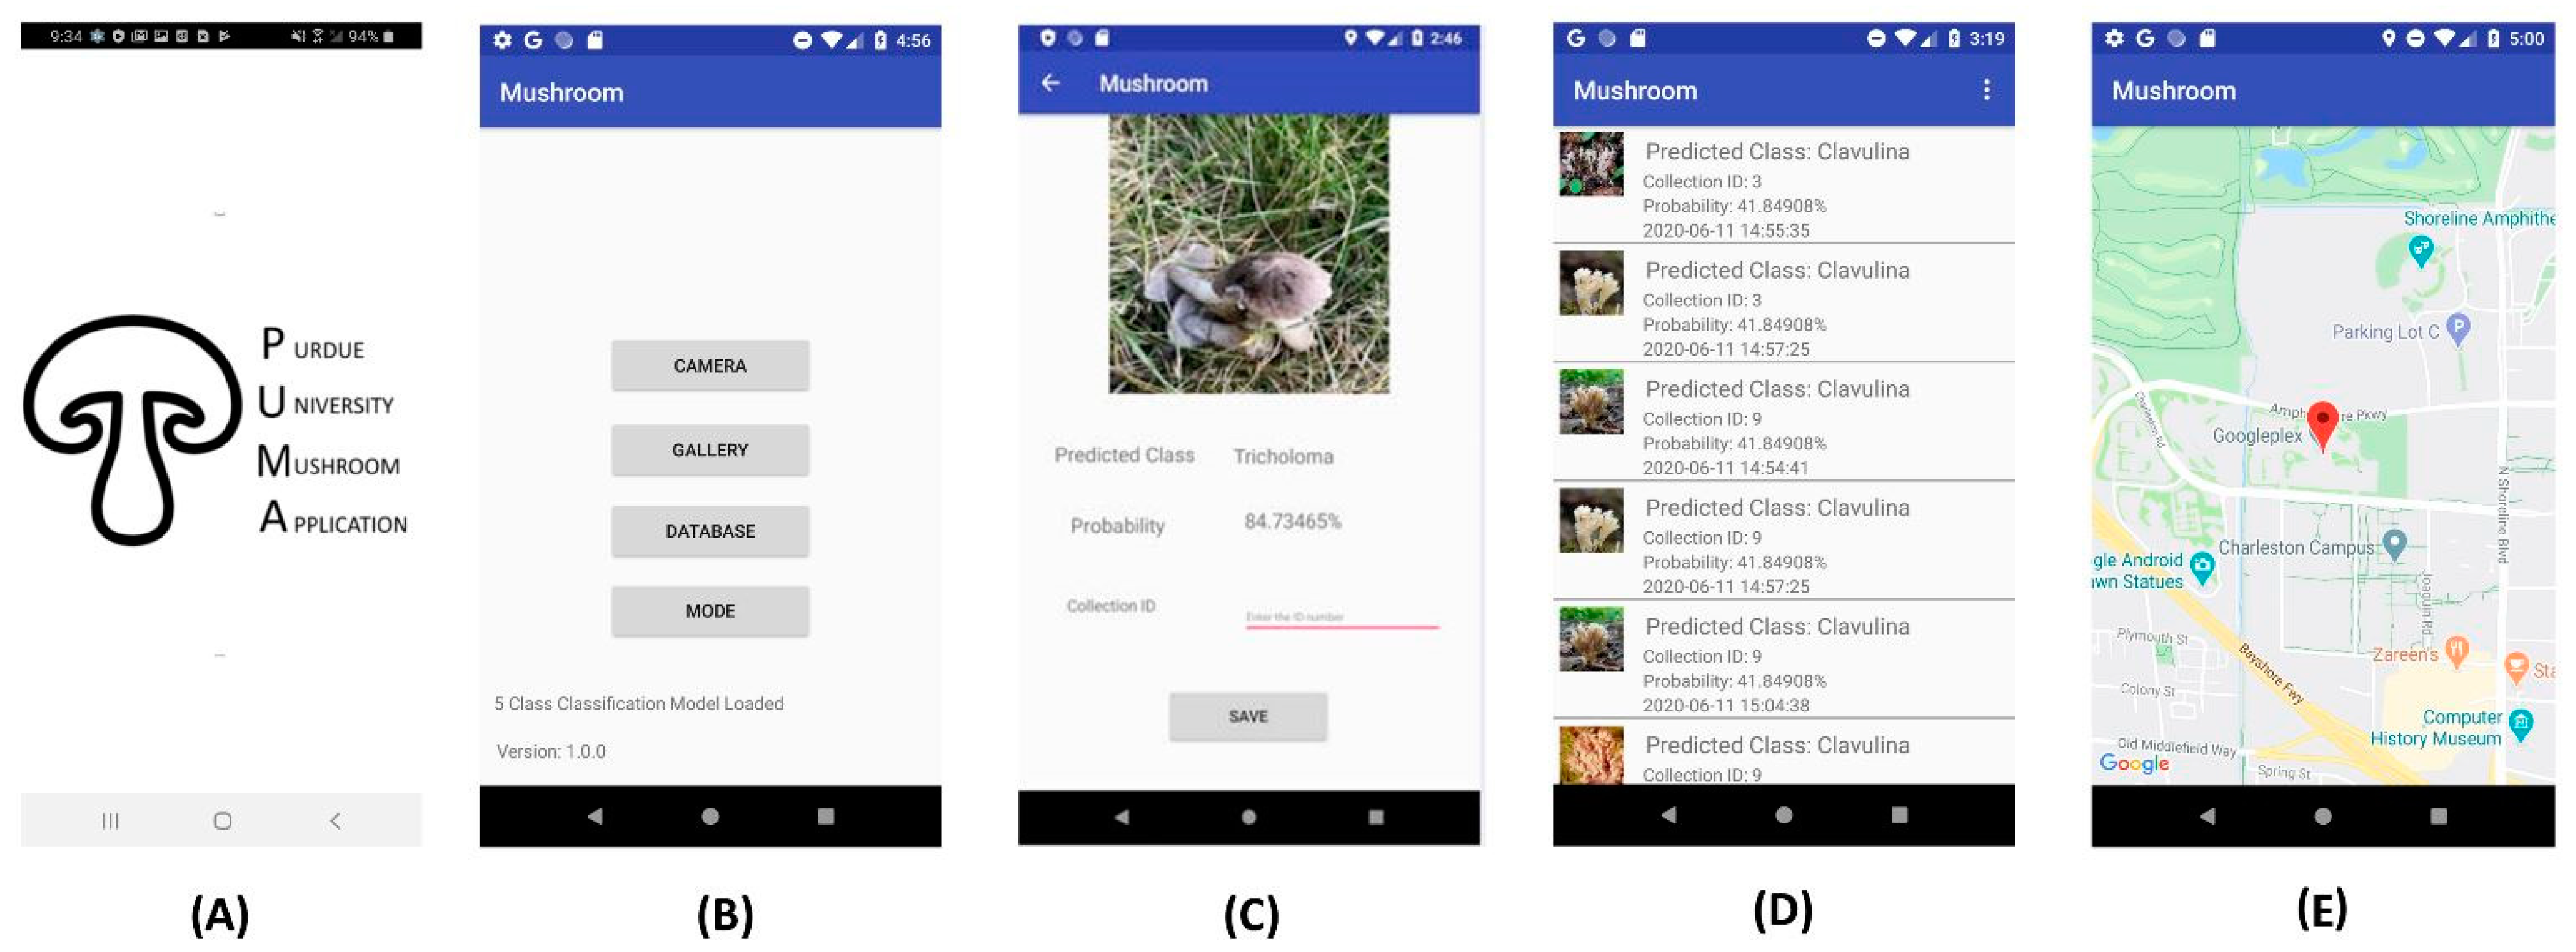
2.4. Mobile App Development and Testing
3. Results
3.1. Model Training
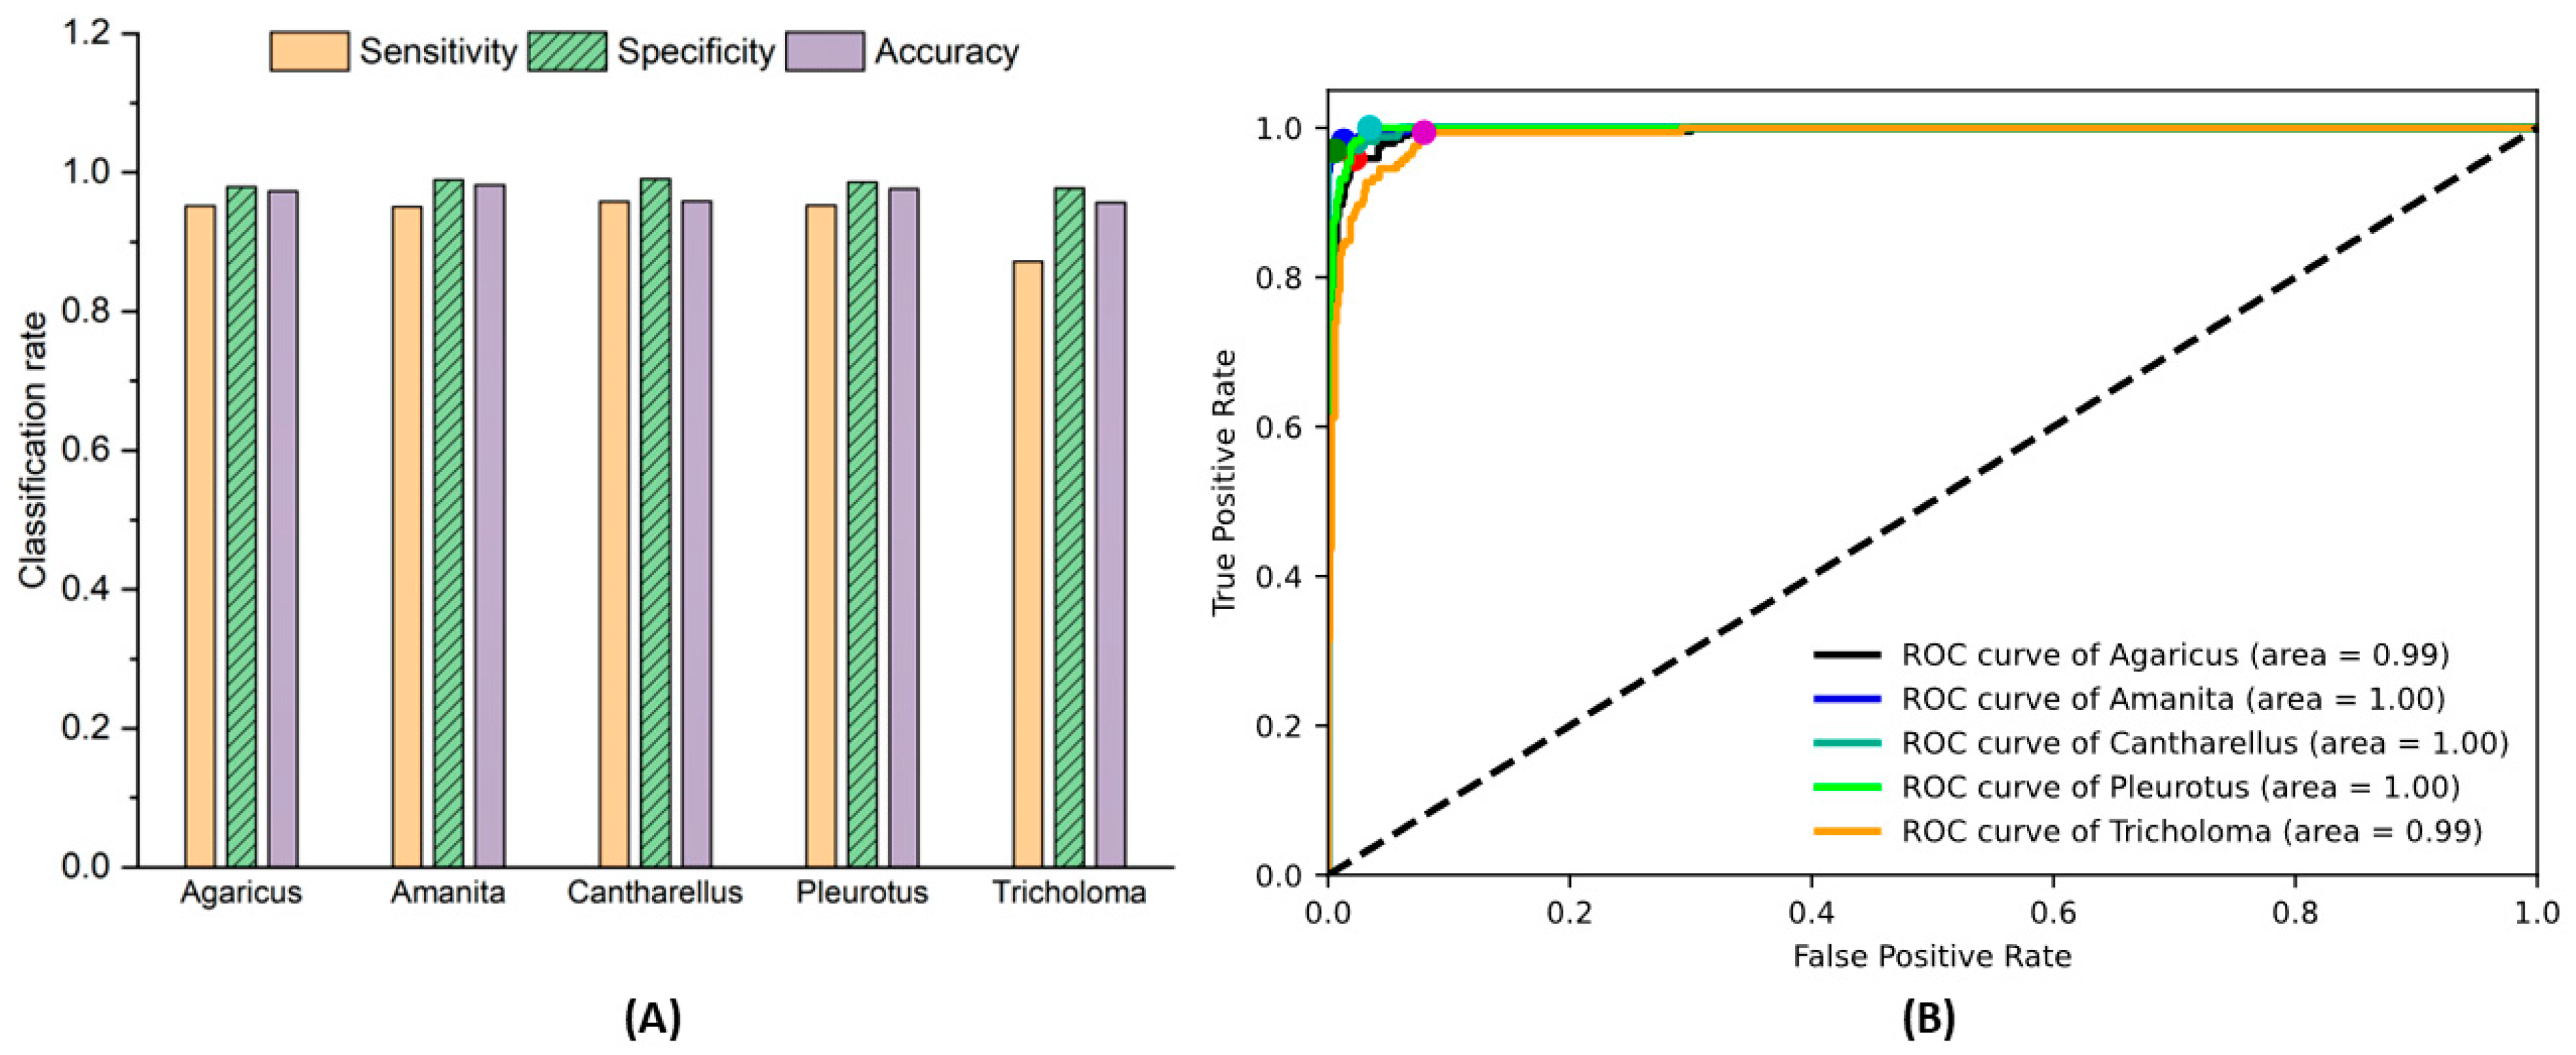
3.2. Model Testing
3.3. Mobile App
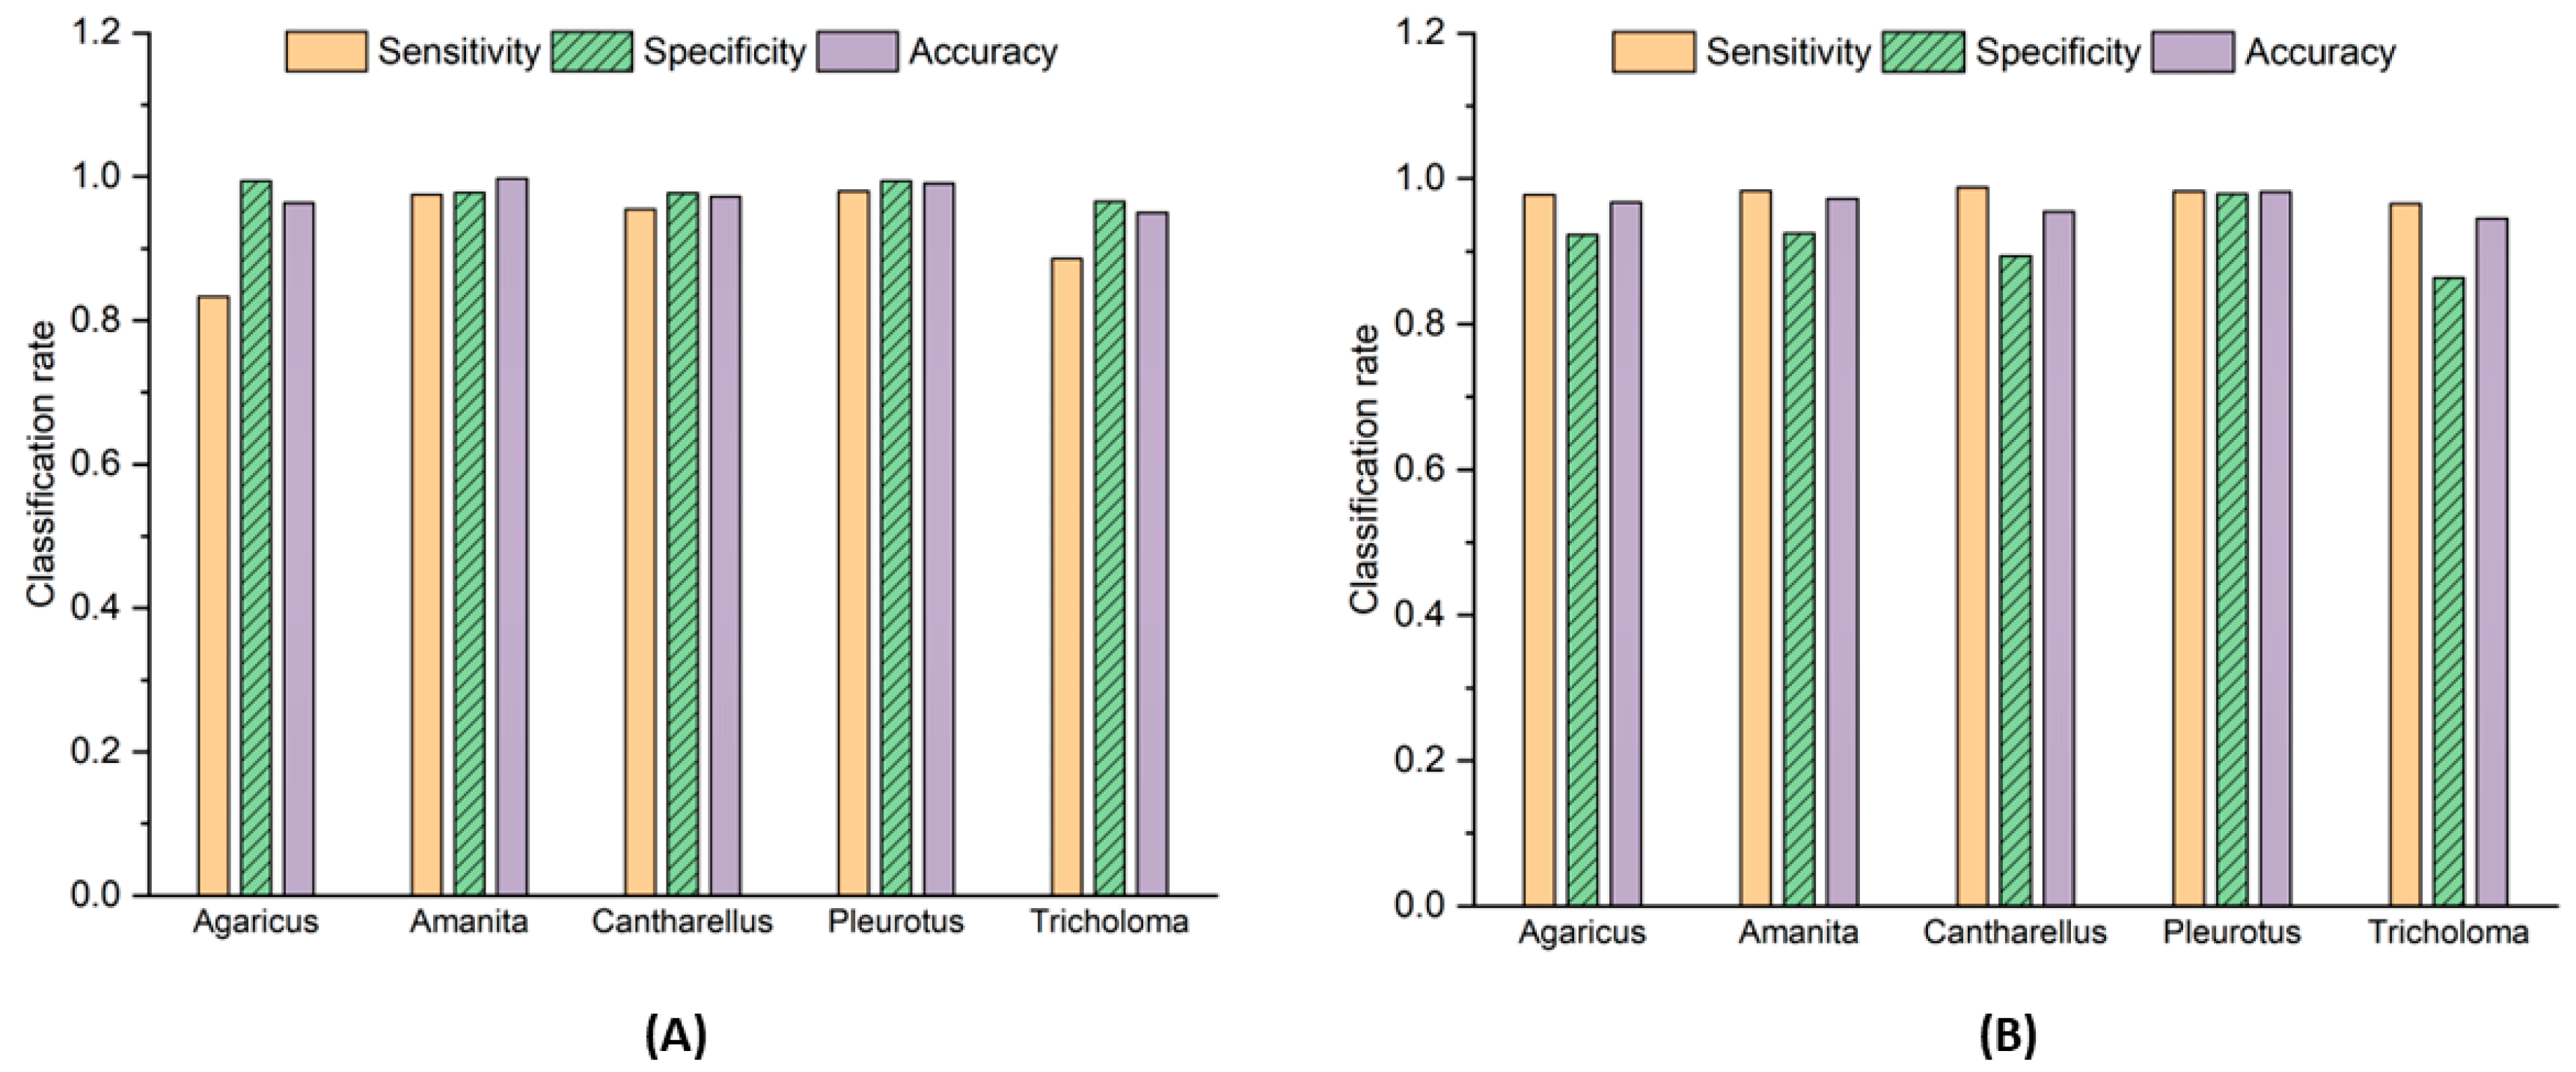
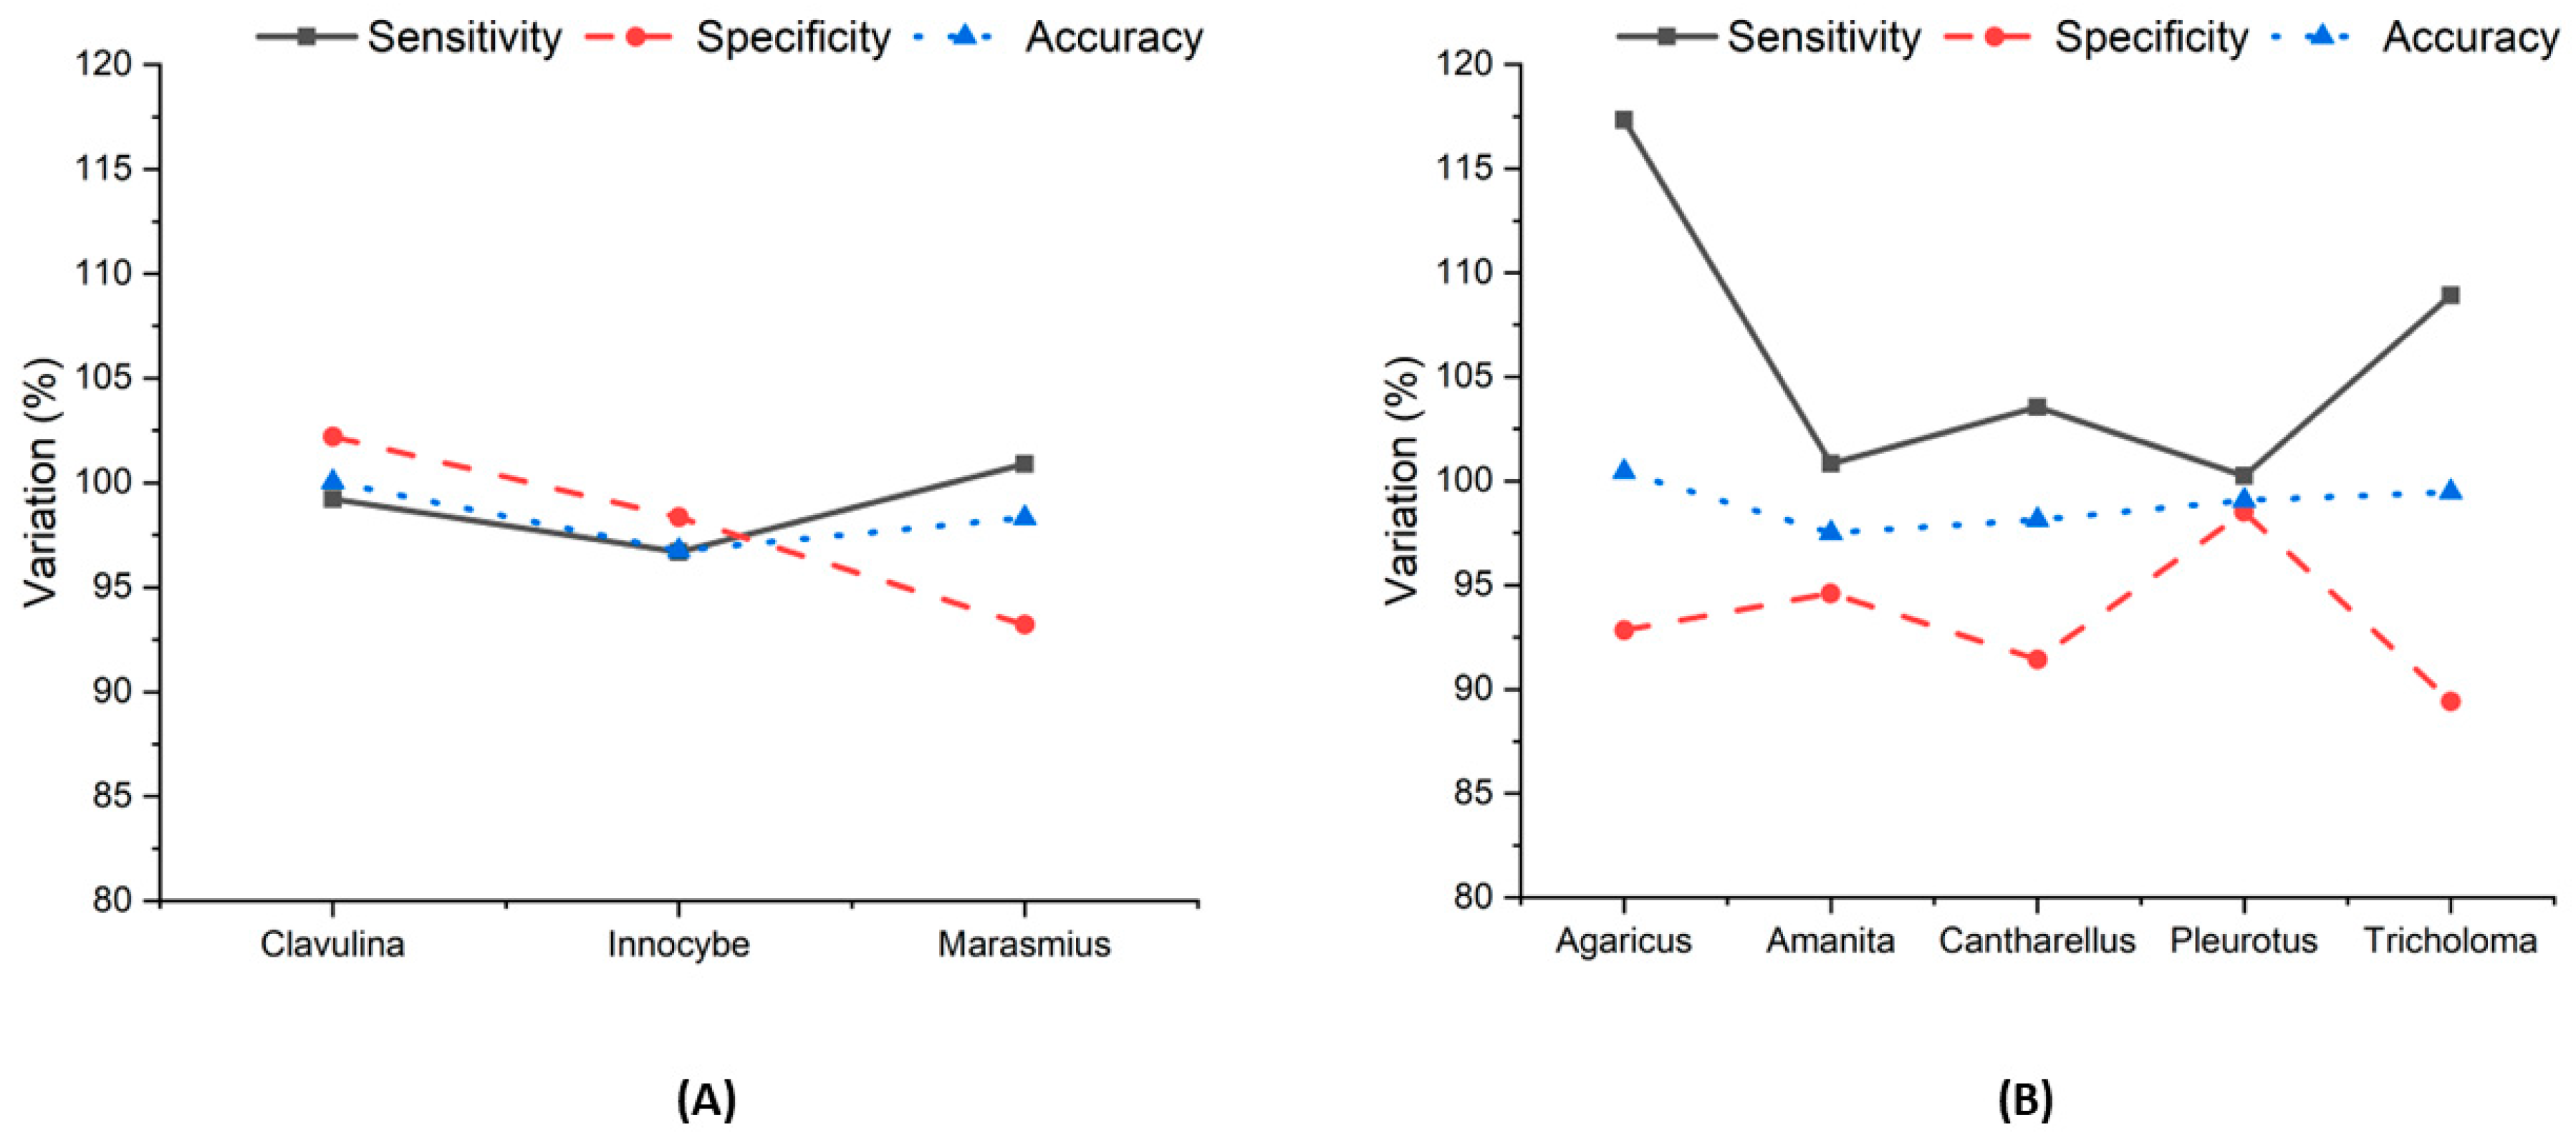
3.4. Inter-Platform Comparison
3.5. Inter-Phone Comparison
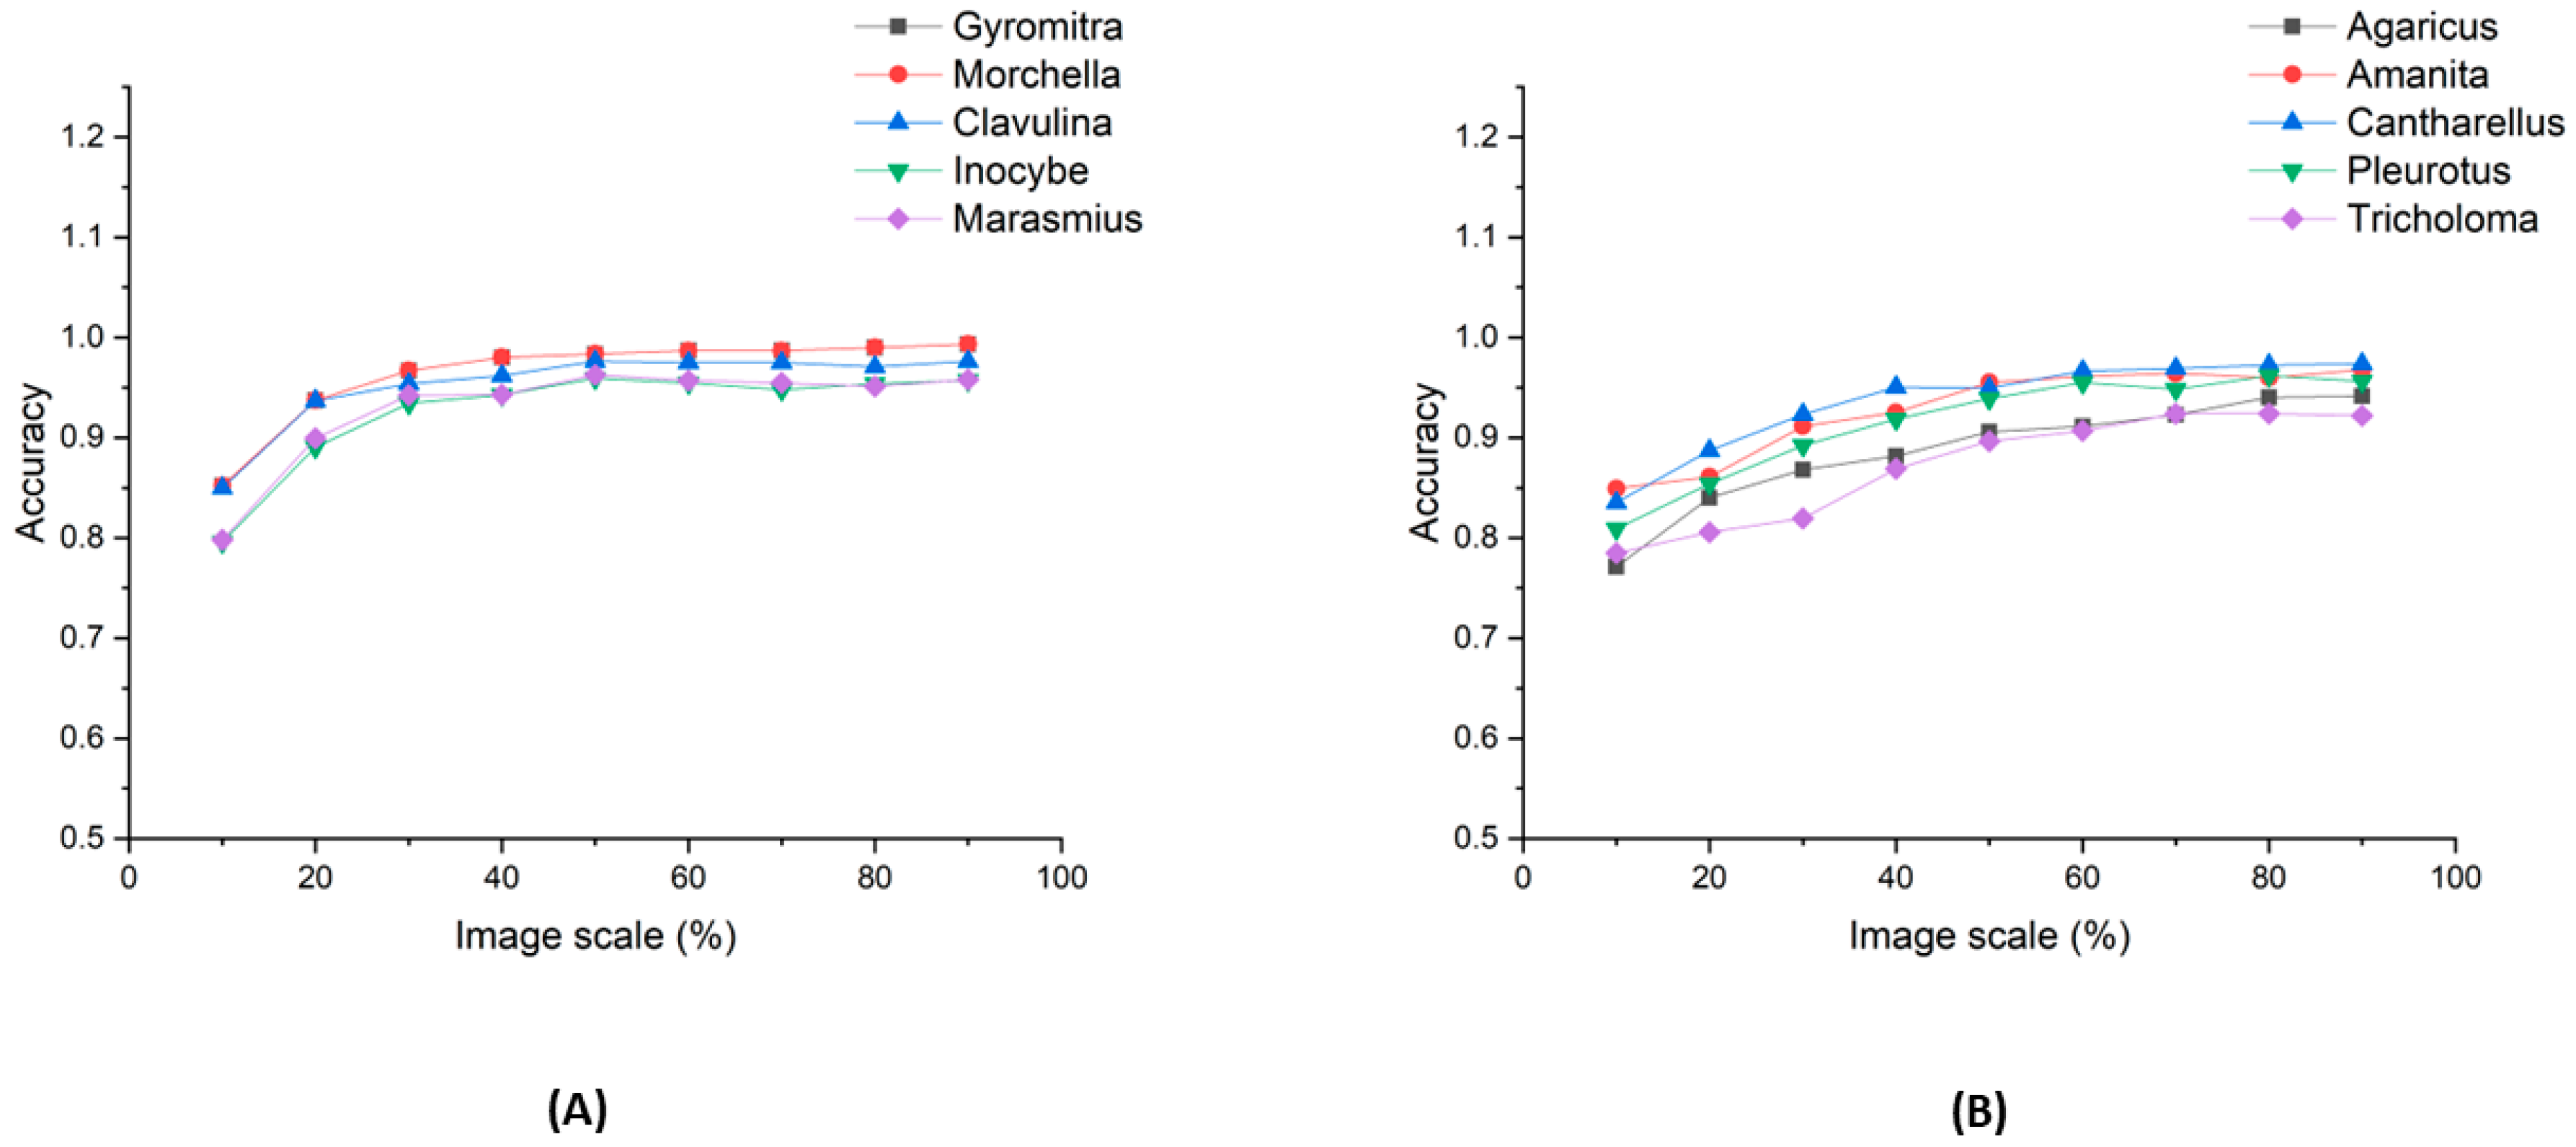
3.6. Image-Scaling Effect
4. Discussion
Supplementary Materials
Author Contributions
Funding
Institutional Review Board Statement
Informed Consent Statement
Data Availability Statement
Acknowledgments
Conflicts of Interest
References
- Satora, L.; Pach, D.; Ciszowski, K.; Winnik, L. Panther cap Amanita pantherina poisoning case report and review. Toxicon 2006, 47, 605–607. [Google Scholar] [CrossRef] [PubMed]
- Giusti, G.; Carnevale, A. A case of fatal poisoning by Gyromitra esculenta. Arch. Toxicol. 1974, 33, 49–54. [Google Scholar] [CrossRef] [PubMed]
- Brandenburg, W.E.; Ward, K.J. Mushroom poisoning epidemiology in the United States. Mycologia 2018, 110, 637–641. [Google Scholar] [CrossRef]
- Jung, Y.; Kim, J.; Awofeso, O.; Kim, H.; Regnier, F.; Bae, E. Smartphone-based colorimetric analysis for detection of saliva alcohol concentration. Appl. Opt. 2015, 54, 9183–9189. [Google Scholar] [CrossRef] [PubMed]
- Rateni, G.; Dario, P.; Cavallo, F. Smartphone-based food diagnostic technologies: A review. Sensors 2017, 17, 1453. [Google Scholar] [CrossRef] [PubMed]
- Silva, A.F.S.; Rocha, F.R. A novel approach to detect milk adulteration based on the determination of protein content by smartphone-based digital image colorimetry. Food Control 2020, 115, 107299. [Google Scholar] [CrossRef]
- Sumriddetchkajorn, S.; Chaitavon, K.; Intaravanne, Y. Mobile device-based self-referencing colorimeter for monitoring chlorine concentration in water. Sens. Actuators B Chem. 2013, 182, 592–597. [Google Scholar] [CrossRef]
- Anand, R.K.; Rahn, K.L.; Rhoades, T.D. Alternating Current Voltammetry at a Bipolar Electrode with Smartphone Luminescence Imaging for Point-of-Need Sensing. ChemElectroChem 2020, 7, 1172–1181. [Google Scholar]
- Jung, Y.; Coronel-Aguilera, C.; Doh, I.-J.; Min, H.J.; Lim, T.; Applegate, B.M.; Bae, E. Design and application of a portable luminometer for bioluminescence detection. Appl. Opt. 2020, 59, 801–810. [Google Scholar] [CrossRef]
- Kim, H.; Jung, Y.; Doh, I.-J.; Lozano-Mahecha, R.A.; Applegate, B.; Bae, E. Smartphone-based low light detection for bioluminescence application. Sci. Rep. 2017, 7, 40203. [Google Scholar] [CrossRef]
- Li, S.; Liu, J.; Chen, Z.; Lu, Y.; Low, S.S.; Zhu, L.; Cheng, C.; He, Y.; Chen, Q.; Su, B. Electrogenerated chemiluminescence on smartphone with graphene quantum dots nanocomposites for Escherichia Coli detection. Sens. Actuators B Chem. 2019, 297, 126811. [Google Scholar] [CrossRef]
- Zhu, Z. Smartphone-based apparatus for measuring upconversion luminescence lifetimes. Anal. Chim. Acta 2019, 1054, 122–127. [Google Scholar] [CrossRef] [PubMed]
- Das, A.J.; Wahi, A.; Kothari, I.; Raskar, R. Ultra-portable, wireless smartphone spectrometer for rapid, non-destructive testing of fruit ripeness. Sci. Rep. 2016, 6, 32504. [Google Scholar] [CrossRef] [PubMed]
- Wang, Y.; Liu, X.; Chen, P.; Tran, N.T.; Zhang, J.; Chia, W.S.; Boujday, S.; Liedberg, B. Smartphone spectrometer for colorimetric biosensing. Analyst 2016, 141, 3233–3238. [Google Scholar] [CrossRef]
- Zhang, C.; Cheng, G.; Edwards, P.; Zhou, M.-D.; Zheng, S.; Liu, Z. G-Fresnel smartphone spectrometer. Lab Chip 2016, 16, 246–250. [Google Scholar] [CrossRef]
- Fan, Z.; Geng, Z.; Fang, W.; Lv, X.; Su, Y.; Wang, S.; Chen, H. Smartphone Biosensor System with Multi-Testing Unit Based on Localized Surface Plasmon Resonance Integrated with Microfluidics Chip. Sensors 2020, 20, 446. [Google Scholar] [CrossRef]
- Lertvachirapaiboon, C.; Kiyokawa, I.; Baba, A.; Shinbo, K.; Kato, K. Colorimetric determination of hydrogen peroxide based on localized surface plasmon resonance of silver nanoprisms using a microchannel chip. Anal. Lett. 2019, 52, 1939–1950. [Google Scholar] [CrossRef]
- Masson, J.-F. Portable and field-deployed surface plasmon resonance and plasmonic sensors. Analyst 2020, 145, 3776–3800. [Google Scholar] [CrossRef]
- Udrea, A.; Mitra, G.; Costea, D.; Noels, E.; Wakkee, M.; Siegel, D.; de Carvalho, T.; Nijsten, T. Accuracy of a smartphone application for triage of skin lesions based on machine learning algorithms. J. Eur. Acad. Dermatol. Venereol. 2020, 34, 648–655. [Google Scholar] [CrossRef]
- Pinky, N.J.; Islam, S.M.; Rafia, S.A. Edibility Detection of Mushroom Using Ensemble Methods. Int. J. Image Graph. Signal Process. 2019, 11, 55. [Google Scholar] [CrossRef]
- Verma, S.; Dutta, M. Mushroom classification using ANN and ANFIS algorithm. IOSR J. Eng. 2018, 8, 94–100. [Google Scholar]
- UC Irvine Machine Learning Repository. Available online: http://archive.ics.uci.edu/ml (accessed on 11 January 2022).
- He, K.; Zhang, X.; Ren, S.; Sun, J. Deep residual learning for image recognition. In Proceedings of the IEEE Conference on Computer Vision and Pattern Recognition, Las Vegas, NV, USA, 27–30 June 2016. [Google Scholar]
- Download Image. Available online: https://download-all-images.mobilefirst.me/ (accessed on 11 January 2022).
- Agarap, A.F. Deep learning using rectified linear units (relu). arXiv 2018, arXiv:1803.08375. [Google Scholar]
- Clevert, D.-A.; Unterthiner, T.; Hochreiter, S. Fast and accurate deep network learning by exponential linear units (elus). arXiv 2015, arXiv:1511.07289. [Google Scholar]
- Krizhevsky, A.; Sutskever, I.; Hinton, G.E. Imagenet classification with deep convolutional neural networks. In Proceedings of the Advances in Neural Information Processing Systems, Lake Tahoe, NV, USA, 3–6 December 2012. [Google Scholar]
- Cross Entropy Loss. Available online: https://pytorch.org/docs/master/generated/torch.nn.CrossEntropyLoss.html (accessed on 11 January 2022).
- Kingma, D.P.; Ba, J. Adam: A method for stochastic optimization. arXiv 2014, arXiv:1412.6980. [Google Scholar]
- Reddi, S.J.; Kale, S.; Kumar, S. On the convergence of adam and beyond. arXiv 2019, arXiv:1904.09237. [Google Scholar]
- Akova, F.; Dundar, M.; Davisson, V.J.; Hirleman, E.D.; Bhunia, A.K.; Robinson, J.P.; Rajwa, B. A machine-learning approach to detecting unknown bacterial serovars. Stat. Anal. Data Min. 2010, 3, 289–301. [Google Scholar] [CrossRef]
- Rajwa, B.; Dundar, M.M.; Akova, F.; Bettasso, A.; Patsekin, V.; Dan Hirleman, E.; Bhunia, A.K.; Robinson, J.P. Discovering the unknown: Detection of emerging pathogens using a label-free light-scattering system. Cytom. Part A 2010, 77A, 1103–1112. [Google Scholar] [CrossRef]


| Total | Training | Testing | ||
|---|---|---|---|---|
| 2-class model | Gyromitra | 238 | 190 | 48 |
| Morchella | 238 | 190 | 48 | |
| 3-class model | Clavulina | 497 | 369 | 128 |
| Inocybe | 497 | 369 | 128 | |
| Marasmius | 497 | 369 | 128 | |
| 5-class model | Agaricus | 257 | 215 | 42 |
| Amanita | 328 | 288 | 40 | |
| Cantharellus | 453 | 409 | 44 | |
| Pleurotus | 399 | 349 | 50 | |
| Tricholoma | 456 | 412 | 44 |
| Pixel 2 | Nexus 5 | Galaxy s8 | Galaxy Note 20 | ||
|---|---|---|---|---|---|
| Gyromitra | sensitivity | 0.9362 | 0.9167 | 0.9167 | 1 |
| specificity | 0.9184 | 0.9167 | 0.9167 | 0.9231 | |
| accuracy | 0.9271 | 0.9167 | 0.9167 | 0.9583 | |
| Morchella | sensitivity | 0.9184 | 0.9167 | 0.9167 | 0.9231 |
| specificity | 0.9362 | 0.9167 | 0.9167 | 1 | |
| accuracy | 0.9271 | 0.9167 | 0.9167 | 0.9583 |
| Pixel 2 | Nexus 5 | Galaxy s8 | Galaxy Note 20 | ||
|---|---|---|---|---|---|
| Clavulina | sensitivity | 0.9921 | 0.9453 | 1 | 1 |
| specificity | 0.9922 | 0.9922 | 0.9922 | 0.9922 | |
| accuracy | 0.9922 | 0.9766 | 0.9948 | 0.9948 | |
| Inocybe | sensitivity | 0.9466 | 0.9609 | 0.9545 | 0.9618 |
| specificity | 0.9843 | 0.9377 | 0.9921 | 0.9921 | |
| accuracy | 0.9714 | 0.9455 | 0.9792 | 0.9818 | |
| Marasmius | sensitivity | 0.9606 | 0.8992 | 0.9762 | 0.9764 |
| specificity | 0.9729 | 0.9727 | 0.9806 | 0.9844 | |
| accuracy | 0.9688 | 0.9481 | 0.9792 | 0.9818 |
| Pixel 2 | Nexus 5 | Galaxy s8 | Galaxy Note 20 | ||
|---|---|---|---|---|---|
| Agaricus | sensitivity | 0.9189 | 0.9231 | 0.9231 | 0.9231 |
| specificity | 0.9669 | 0.9777 | 0.9777 | 0.9831 | |
| accuracy | 0.9587 | 0.9679 | 0.9679 | 0.9724 | |
| Amanita | sensitivity | 0.925 | 0.925 | 0.925 | 0.9487 |
| specificity | 0.9831 | 0.9831 | 0.9831 | 0.9831 | |
| accuracy | 0.9725 | 0.9725 | 0.9725 | 0.977 | |
| Cantharellus | sensitivity | 0.875 | 0.8936 | 0.8936 | 0.8936 |
| specificity | 0.9882 | 0.9883 | 0.9883 | 0.9882 | |
| accuracy | 0.9633 | 0.9679 | 0.9679 | 0.9677 | |
| Pleurotus | sensitivity | 0.9792 | 0.9792 | 0.9792 | 0.9792 |
| specificity | 0.9824 | 0.9824 | 0.9824 | 0.9822 | |
| accuracy | 0.9817 | 0.9817 | 0.9817 | 0.9816 | |
| Tricholoma | sensitivity | 0.8444 | 0.8636 | 0.8636 | 0.8636 |
| specificity | 0.9653 | 0.9655 | 0.9655 | 0.9653 | |
| accuracy | 0.9404 | 0.945 | 0.945 | 0.9447 |
Publisher’s Note: MDPI stays neutral with regard to jurisdictional claims in published maps and institutional affiliations. |
© 2022 by the authors. Licensee MDPI, Basel, Switzerland. This article is an open access article distributed under the terms and conditions of the Creative Commons Attribution (CC BY) license (https://creativecommons.org/licenses/by/4.0/).
Share and Cite
Lee, J.J.; Aime, M.C.; Rajwa, B.; Bae, E. Machine Learning-Based Classification of Mushrooms Using a Smartphone Application. Appl. Sci. 2022, 12, 11685. https://doi.org/10.3390/app122211685
Lee JJ, Aime MC, Rajwa B, Bae E. Machine Learning-Based Classification of Mushrooms Using a Smartphone Application. Applied Sciences. 2022; 12(22):11685. https://doi.org/10.3390/app122211685
Chicago/Turabian StyleLee, Jae Joong, M. Catherine Aime, Bartek Rajwa, and Euiwon Bae. 2022. "Machine Learning-Based Classification of Mushrooms Using a Smartphone Application" Applied Sciences 12, no. 22: 11685. https://doi.org/10.3390/app122211685
APA StyleLee, J. J., Aime, M. C., Rajwa, B., & Bae, E. (2022). Machine Learning-Based Classification of Mushrooms Using a Smartphone Application. Applied Sciences, 12(22), 11685. https://doi.org/10.3390/app122211685