Article

A Novel Strategy for Computing Routing Paths for Software-Defined Networks Based on MOCell Optimization

by
Jose E. Gonzalez-Trejo
1,*,
Raul Rivera-Rodriguez
2,*,
Andrei Tchernykh
3,
Jose E. Lozano-Rizk
2,
Salvador Villarreal-Reyes
1,
Alejandro Galaviz-Mosqueda
4 and
Jose L. Gonzalez Compean
5
1
Centro de Investigacion Cientifica y de Educacion Superior de Ensenada, Electronics and Telecommunications Department, Ensenada 22860, Mexico
2
Centro de Investigacion Cientifica y de Educacion Superior de Ensenada, Telematics Division, Ensenada 22860, Mexico
3
Centro de Investigacion Cientifica y de Educacion Superior de Ensenada, Computer Science Department, Ensenada 22860, Mexico
4
Monterrey Unit, Centro de Investigacion Cientifica y de Educacion Superior de Ensenada, Apocada 66629, Mexico
5
Centro de Investigación y de Estudios Avanzados del I.P.N. (Cinvestav Tamaulipas), Victoria City 87130, Mexico
*
Authors to whom correspondence should be addressed.
Appl. Sci. 2022, 12(22), 11590; https://doi.org/10.3390/app122211590
Submission received: 1 October 2022 / Revised: 10 November 2022 / Accepted: 11 November 2022 / Published: 15 November 2022
(This article belongs to the Special Issue Novel Algorithms and Protocols for Networks, Volume II)

Abstract

:
Software-defined networking (SDN) is the fastest growing and most widely deployed network infrastructure due to its adaptability to new networking technologies and intelligent applications. SDN simplifies network management and control by separating the control plane from the data plane. The SDN controller performs the routing process using the traditional shortest path approach to obtain end-to-end paths. This process usually does not consider the nodes’ capacity and may cause network congestion and delays, affecting flow performance. Therefore, we evaluate the most conventional routing criteria in the SDN scenario based on Dijkstra’s algorithm and compare the found paths with our proposal based on a cellular genetic algorithm for multi-objective optimization (MOCell). We compare our proposal with another multi-objective evolutionary algorithm based on decomposition (MOEA/D) for benchmark purposes. We evaluate various network parameters such as bandwidth, delay, and packet loss to find the optimal end-to-end path. We consider a large-scale inter-domain SDN scenario. The simulation results show that our proposed method can improve the performance of data streams with TCP traffic by up to 54% over the traditional routing method of the shortest path and by 33% for the highest bandwidth path. When transmitting a constant data stream using the UDP protocol, the throughput of the MOCell method is more than 1.65% and 9.77% for the respective paths.

Graphical Abstract

1. Introduction

In recent years, there has been a rapid expansion of the Internet and the continuous development of information and communication technologies such as 5G [1], cloud computing [2], Internet of Things (IoT) [2,3], and Big Data [4]. However, the evolution of these technologies requires network operators and Internet service providers (ISPs) to adopt new strategies and technologies to meet the emerging traffic demands that cannot be met by traditional networks.
The traditional network design originated as a simple distributed system to provide best-effort packet communication services in a reliable environment using network devices to forward packets and make routing decisions by implementing packet routing rules. The traffic accounts for routing tables on devices such as switches/routers.
However, with the rapid evolution of networks, the constant increase in devices and the excessive consumption of bandwidth lead to specific performance problems such as a higher rate of packet loss, a more significant increase in end-to-end transmission delay, and, in the worst case, network collapse [5].
Software-defined networking (SDN) is an emerging centralized network architecture technology that differs from traditional networks by decoupling the control plane from the data plane [6]. The data plane is responsible only for forward and switch data and consists of the network’s physical infrastructure, such as switches and routers, both physical and virtual, accessible through an open interface. The control layer is the essential layer of the architecture, consisting of SDN controllers that centralize the intelligence and management of the network and provide a global view of the network [7,8]. SDN has a third layer, the application layer, which provides users with services such as traffic engineering, quality of service, and network security.
The SDN architecture also has two communication interfaces that allow the controllers to interact with the other layers:
  • Southbound interface: Provides a communication environment between the controller and communication devices. Installs the appropriate flow rules in the device forwarding table. OpenFlow [9] is the open-source community’s most widely implemented Southbound interface standard.
  • Northbound interface: Provides communication between the SDN controller and network applications running on the application plane. This communication is critical, as each network application’s requirements can be very different. Applications can communicate with the SDN using various APIs, such as ad hoc and REST APIs, to request network resources or services according to their needs.
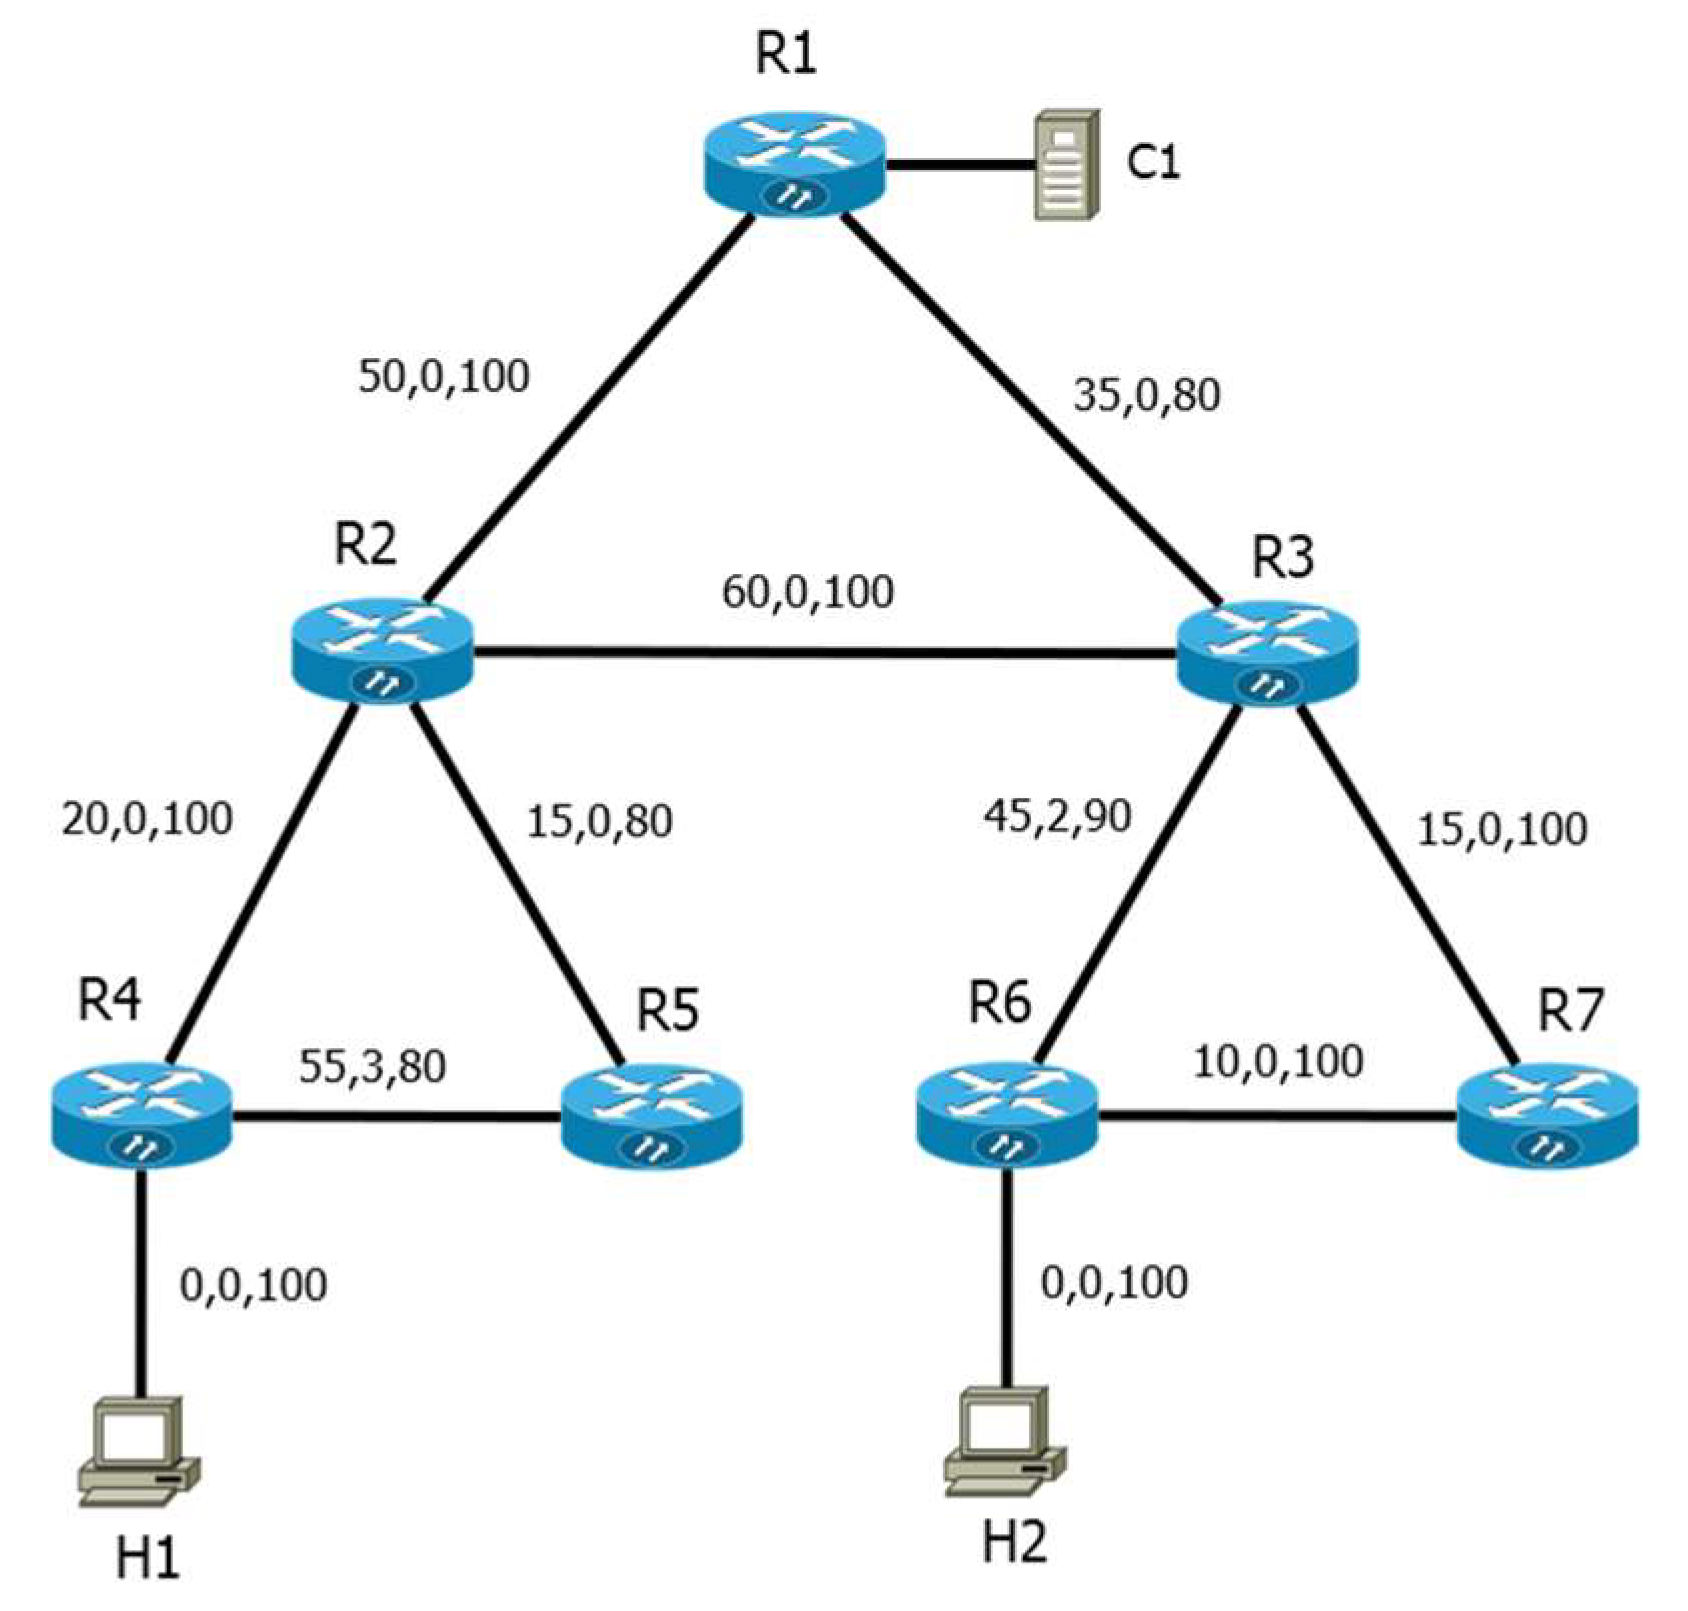
SDN promises to solve several problems in traditional networks due to its flexibility. However, there are still some open problems and challenges, such as the design of routing algorithms that guarantee QoS. The SDN controller typically employs the shortest path method when an application requires the transfer of a flow between end-to-end networks [10]. As the variety of services increases, so do the requirements for service improvement, which include latency, bandwidth, packet loss rate, and network stability. The conventional best-effort routing algorithm results in the network architecture having certain constraints in order to optimize the performance parameters for the diversity of demands [11]. Figure 1 shows an example of a data flow that requires a path with a bandwidth of more than 80 Mbps and a delay of less than 7 ms. In the case of the traditional routing algorithm based on the shortest path, the traffic flows along the path R1,R2,R3,R7, which has the following values: bandwidth = 70 Mbps and delay = 8 ms. This does not meet the criteria for bandwidth service. This path may result in poor service performance and cause problems such as congestion. Therefore, it is helpful to consider different criteria for selecting a good path. For example, using the highest bandwidth path (R1,R2,R5,R6,R7) results in a bandwidth of 90 and a delay of 6, which meets the data flow requirements.
These problems can be avoided by effectively routing flows while considering available network parameters and QoS requirements. The selection of paths in the routing process must evaluate the network conditions through the multiple available metrics, which can be represented as objectives. The goals may conflict in this type of problem, and each purpose has a different solution. With more than one optimization criterion, this routing process is known as a multi-objective optimization problem (MOP) [12].
Discovering paths that provide QoS in a network according to different data flow requirements is a difficult problem, which is usually solved optimally using heuristic algorithms [13], especially those based on integer linear programming, game theory, and evolutionary algorithms (EA). Algorithms based on game theory and approximation are usually computationally intensive. Therefore, these two methods are usually not suitable for providing acceptable solutions. On the other hand, EAs search for global optima by developing an iterative search within a finite time. They have proven to provide high-quality solutions to the problem within a limited computation time [14]. Genetic algorithms (GA) are a family of models of EAs. They have emerged as a method for optimizing difficult search problems based on the principle of genetic selection, such as inheritance mutation, selection, and crossover. Their advantage is that they can handle large search spaces and generate multiple solutions in a single pass, which is suitable for this type of QoS routing optimization for SDN [15].
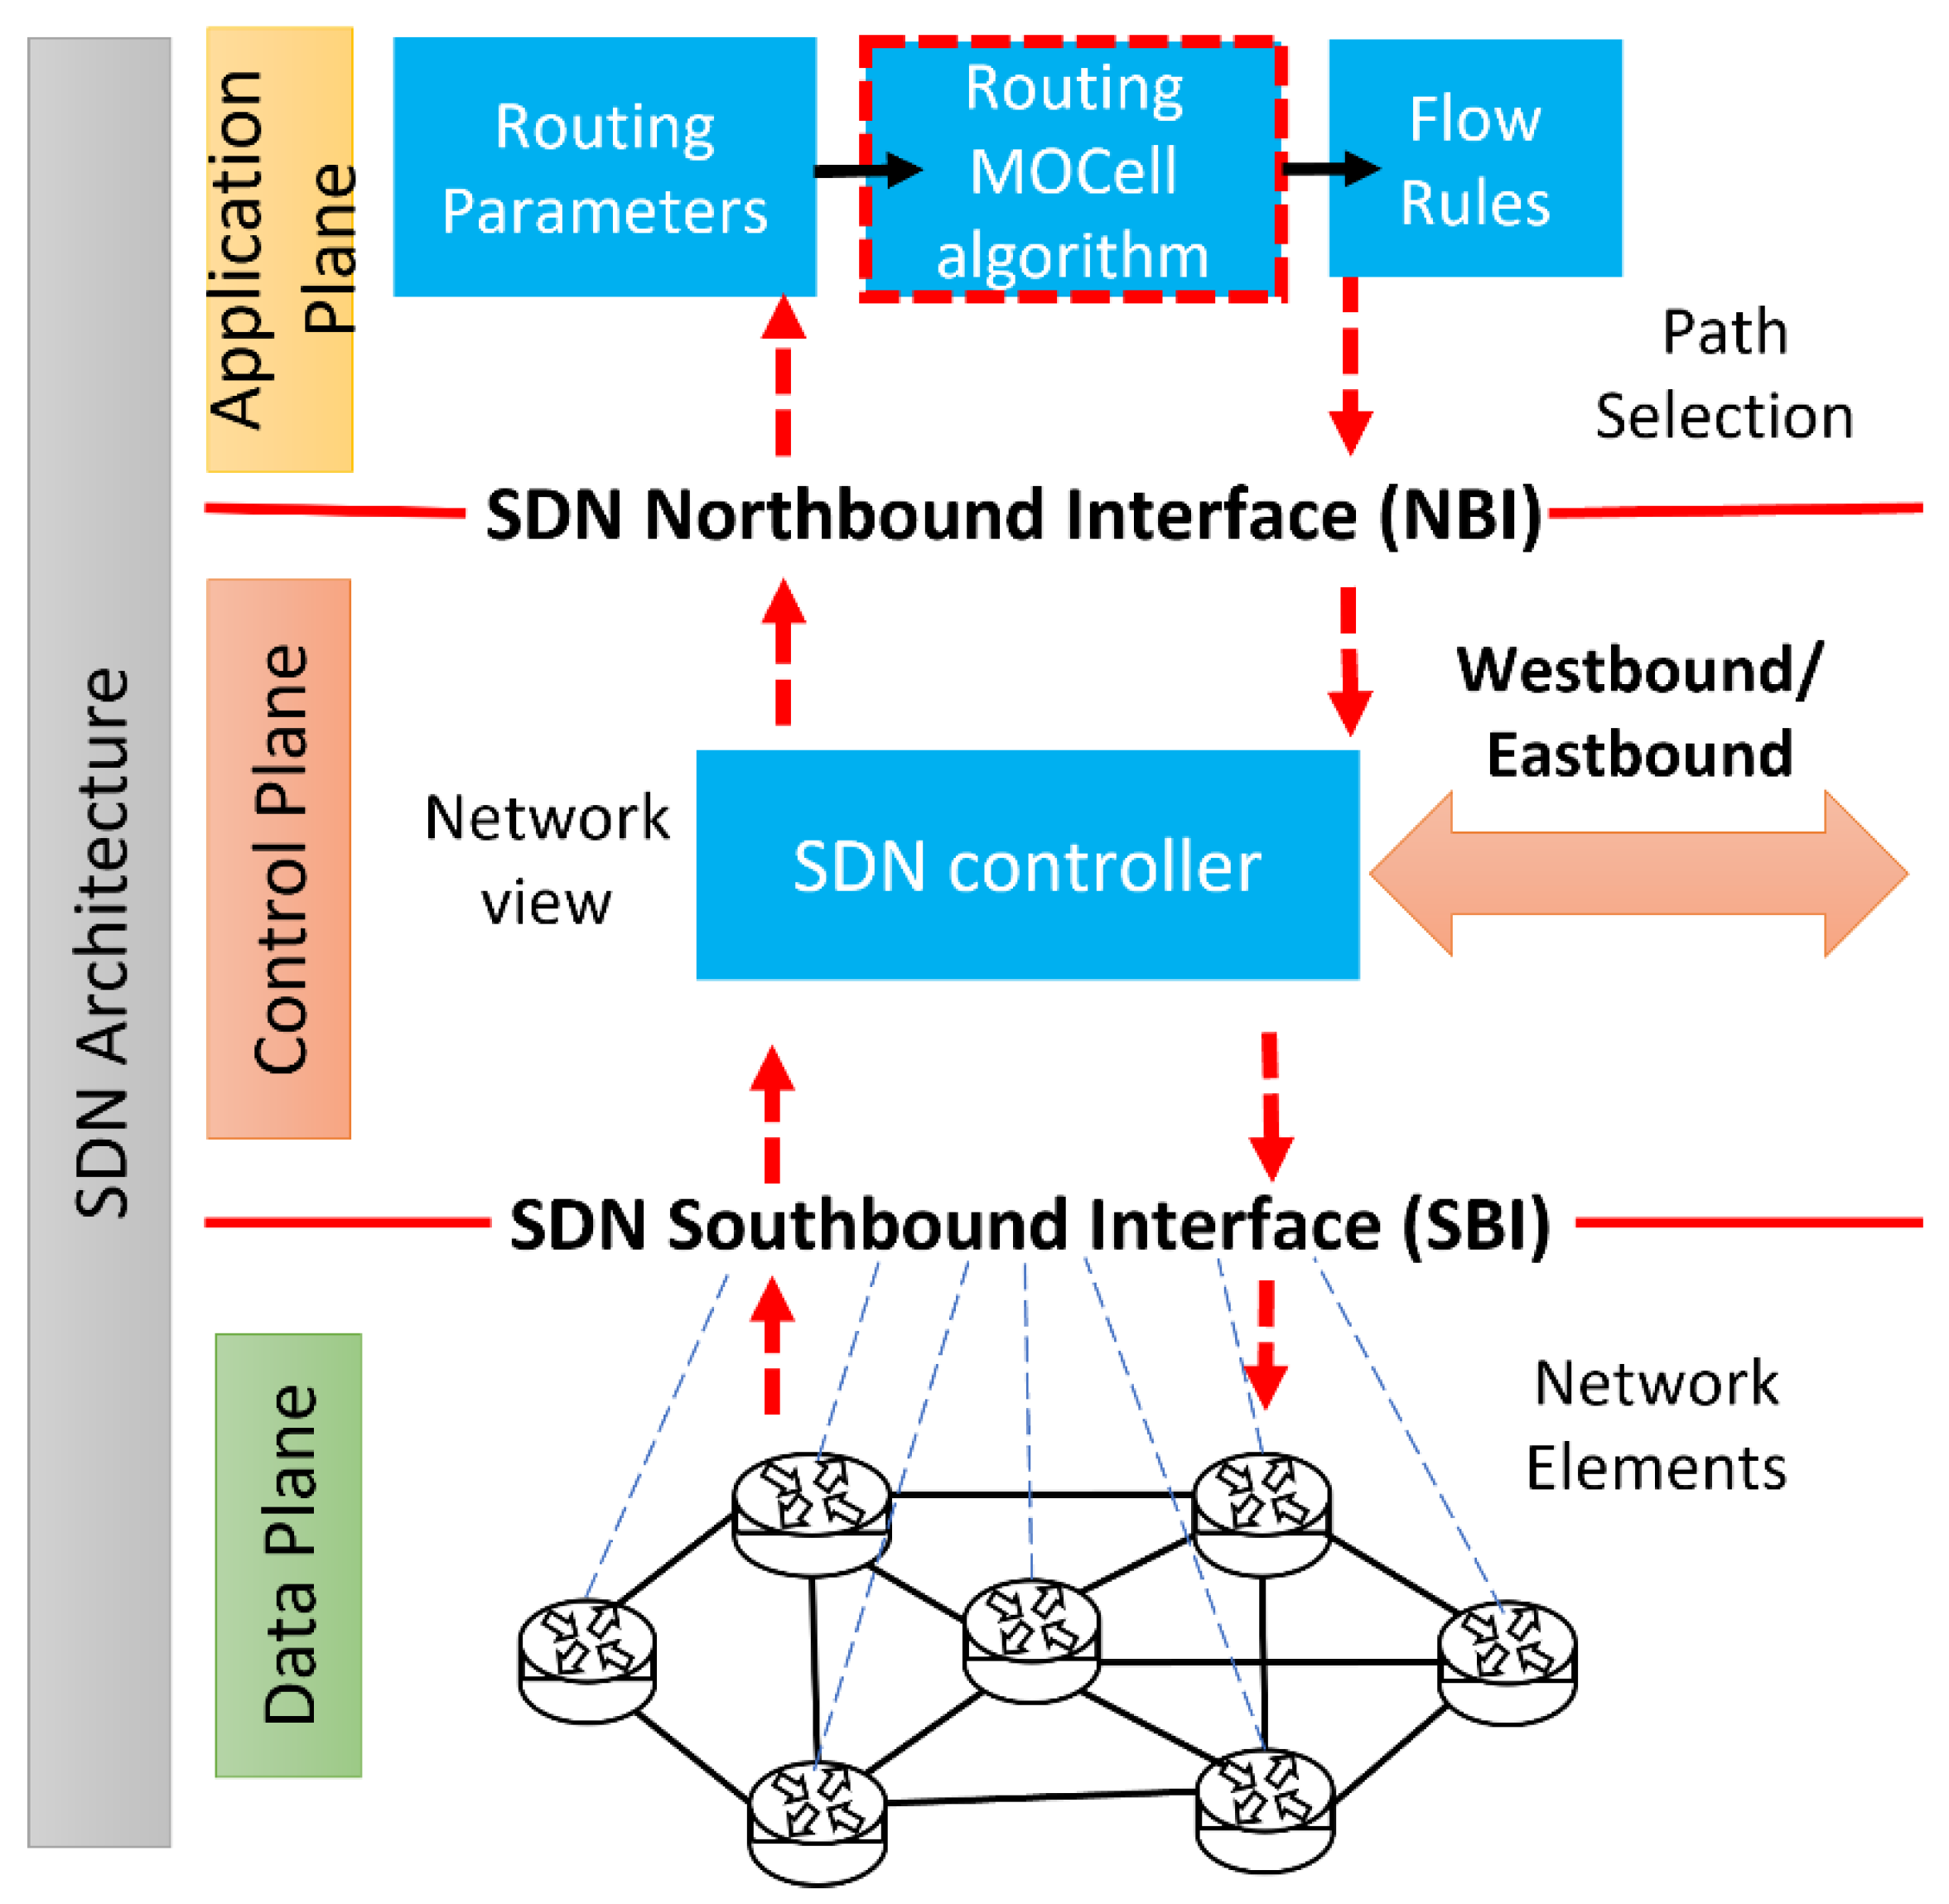
Our proposal (Figure 2) resides in the application plane and communicates with the SDN controller using the REST API provided by the Northbound interface. We use these SDN capabilities to create, query, and delete flow rules on OpenFlow (OF) switches, in order to forward data flow according to the path established by our path selection proposal or optimization criteria, based on a cellular genetic algorithm for multi-objective optimization (MOCell).
The main contributions of our proposal are as follows:
  • An SDN strategy for routing data flows based on QoS that considers an inter-domain approach and compares its performance with traditional routing algorithms in the context of SDN.
  • Using MOCell, the routing strategy considers some of the most critical network parameters: available bandwidth, delay, and packet loss.
The MOCell algorithm differs from conventional methods in evaluating multiple possible solutions from the first iteration. Its population is structured into small neighborhoods that generate high-quality solutions. They are fed back with the non-dominant solutions stored in each iteration. This algorithm has shown better performance in extensive testing than the NSGA-II and SPEA2 algorithms, which are widely recognized and used in practice [16].
Alongside this research, we set aside for future work the analysis of time complexity and computational delay. The fastest output results and least computational effort will likely be the result of Dijkstra’s algorithm, rather than the MOCell method. However, the network performance results of this work presented in Section 4 show how the MOCell method obtains better results than Dijkstra’s algorithm and the multi-objective evolutionary algorithm based on decomposition (MOEA/D). Additionally, the stationary state of the SDN network connection processes allows the implementation and evaluation of the MOCell method for a new inter-domain routing proposal.
The rest of the article is organized as follows: Related work is presented in Section 2. Section 3 presents our proposed system and describes the experimental setup. In Section 4, the performance evolution is presented, and the results are discussed. Finally, Section 5 describes the conclusions of the work and future directions.

2. Related Work

This section describes the research works on routing proposals to improve the quality of service (QoS) implemented in the SDN architecture. We describe the works according to the network parameters considered for QoS improvement, the use of SDN architecture resources, and their contribution depending on a single domain or multiple.
In OpenQoS [17], the authors developed an architecture that classifies incoming data streams into multimedia or data streams and provides quality service support for the different multimedia streams, considering the application’s requirements. Their proposed algorithm focuses on the shortest path according to the delay as a constraint, while for data streams, it provides the best possible path according to the controller (hops).
In CECT [18], a network congestion avoidance scheme was proposed in which resources are reallocated based on data flow requirements. It should be noted that the routing algorithm uses a secondary genetic algorithm when there is a congestion problem. Therefore, the data streams are reallocated according to the minimum bandwidth required by the application. Jungmin et al. [19] proposed a method based on distributed data centers in an SDN cloud that guarantees bandwidth allocation for critical applications through priority queues in each network device. In AmoebaNet [20], a service is proposed that guarantees the QoS of services on campus or local area networks based on SDN and facilitates the transfer of large-scale scientific data (Big Data) depending on the application. The algorithm is based on the bandwidth constraint to calculate the end-to-end network path. Bastam et al. [21] proposed a dynamic method for traffic engineering in SDN data centers based on a linear propagation model and decomposition techniques to partition the flow allocation problem by determining the available capacity of paths for the redirection of the flows. In VSDN [22], the authors proposed an architecture within a domain for video transmission over SDN. This architecture includes a routing module and a network topology monitor that verifies network conditions. The authors monitored bandwidth, jitter, and link delay network parameters to forward data packets using a constraint-based routing algorithm. In PRIME-Q [23], a multi-domain routing method with end-to-end quality of service is presented, which considers privacy in a multi-domain SDN network. The algorithm can classify path flows according to three categories of QoS, bandwidth, delay, and the combination of both parameters in an optimization function.
In QosComm [24], the authors designed a strategy for routing data flows among an SDN-based distributed data center according to the application’s QoS requirements. The algorithm selects the path with the minimum delay that satisfies the application requirements based on bandwidth, packet loss rate, and jitter. Li et al. [25] proposed a QoS-compatible routing method based on an evolutionary algorithm for multi-objective optimization (NSGA-II). This method considers the bandwidth threshold required by a flow and minimizes the parameter delay and packet loss. These parameters are determined by monitoring the network regularly to avoid bottlenecks, unlike most previous studies based on the assumption of the same domain.
In VQoSRR [26], a video streaming adaptive QoS-based routing and resource reservation scheme is proposed that shifts traffic to an alternate path when the QoS is violated, which satisfies video demands and enhances user experience more effectively than best-effort networks. In Civanlar et al. [27], the authors proposed a multi-domain design where each domain has an SDN controller, which shares the summarized topology of their domain. Each controller has end-to-end decision-making capabilities, and the flow decision selection is based on the effective bandwidth theory of the martingale process.
In MCEAACO-QSRP [28], the authors designed a multi-objective optimization strategy based on adaptive ant colonies to guarantee the quality of service in the industrial Internet of Things (IoT), considering the QoS constraints of delay, security, and power consumption.
Li-Sheng et al. [13] proposed a routing algorithm based on a multi-objective genetic algorithm for the QoS of the optical burst communication network. The algorithm takes the parameters of the minimization of delay, bandwidth, and packet loss.
As a summary of the reviewed works (Table 1), we can argue that the most implemented routing model to guarantee QoS is focused on the available bandwidth parameter [18,19,20,21,26,27]. VSDN [22] and PRIME-Q [23] classified flows according to the multimedia flows’ required bandwidth and delay parameters. PRIME-Q has the particularity of offering three options: the first is path selection with maximum available bandwidth; the second is path selection with the minimum delay; and the third is both network parameters as restrictions. Another approach is to reallocate resources when a congestion problem occurs [18,19,21,27], where the parameter to consider when improving the QoS is the bandwidth available in the network, without considering the delay and packet loss that may occur on the links, except for OpenQoS [17], which obtains a better performance by giving higher priority to delay than bandwidth. On the other hand, multi-objective techniques have been implemented to meet the requirements of multiple QoS parameters such as bandwidth, delay, packet loss, and jitter [24,25,28,29]. These methods focus on optimizing one objective function, while the other parameters satisfy the minimum requirements of the data streams. Our routing proposal differs mainly by considering the minimization of these parameters, which gives us a set of feasible and balanced solutions since they are non-dominated solutions.

3. Materials and Methods

3.1. Problem Formalization

Generally, a network topology can be represented as a directed graph G ( V ,   E ) , where V represents all nodes in the network and E represents all of the connections between the nodes. n = | V |   is the number of nodes and m = | E |   is the number of edges in the network. Each connection e ( i , j )   ϵ   E has associated properties, such as λ e , the available bandwidth, μ e , the delay, and ρ e , the packet loss. The status and measurements of the network are updated when a routing request is made, in order to obtain the better accuracy of the available resources and to choose a path that satisfies the QoS parameters [29,30].
The path search problem must solve a path P from a source node s to a destination node d that satisfies the values of different network parameters. We define the following function for a path P :
Hops path computes the number of links between s and d node. For this case, the cost of each link is assigned to 1.
h ( P ) = u , v P e
The bandwidth path is the minimum available bandwidth between s to d node, and the cost metric of each link is set to be inversely proportional to the bandwidth capacity of that link.
λ ( P ) = m i n e P {   1 λ e }
The delay path is the total path delay.
μ ( P ) = e ϵ P e μ
The packet loss path is the percentage of packets lost in comparison with the number of packages sent (0 means no packet loss).
ρ ( P ) = 1 e ϵ P ( 1 e ρ )
The delay function is additive, while the bandwidth function is concave, and the packet loss function is multiplicative but can be converted to an additive function by taking the logarithm of the ratio; with this parameter, we can provide network QoS.
Table 2 shows the network parameters described as variables.
To evaluate path performance, we consider throughput [31] (Equation (5)) as a performance measure that refers to the successful delivery of data E s , t over a communication channel; in our case, a path where E s , t is the received data d r x from source s t x excluding retransmitted data r d a t a during the entire observation time T t .
t h = E s , t T t
where
E s , t = s t x ( d r x r d a t a )   s t x

3.2. QoS Routing

The shortest path algorithm determines the path with the lowest connection cost, specified by a value inversely proportional to the available bandwidth of each connection. Dijkstra’s algorithm is usually used for this type of search. In our case, we create variations of the shortest path using Dijkstra’s algorithm to consider the path metrics with the lowest bandwidth cost and minimum hops, delay, and packet loss. [32].
  • The minimum hops path computes the shortest path with the minimum number of links between the source and destination node.
H = m i n   ( h ( P ) )
  • Minimum cost of available bandwidth path:
B = m i n ( λ ( P ) )
  • Minimum delay path:
D = m i n ( μ ( P ) )
  • Minimum packet loss path:
P L = m i n ( ρ ( P ) )

3.3. Dijkstra’s Algorithm

Dijkstra’s algorithm (Algorithm 1) is widely used in the shortest path routing algorithm. It is based on a set of candidate neighbor nodes, and the calculation to identify the shortest path between a source s and a destination d ; in other words, it computes the shortest paths to all destinations [33].
For the path calculation with Dijkstra’s algorithm, we need to calculate the cost between two nodes i ,   j and the path with the least cost to node j , where j   ( j i ) . We can represent this as two parameters:
d t i , j = l i n k   c o s t   b e t w e e n   n o d e   i   a n d   n o d e   j
D t i , j = c o s t   o f   t h e   m i n i m u m   c o s t   p a t h b e t w e e n   n o d e   i   a n d   n o d e   j
Dijkstra’s algorithm uses two lists to specify the minimum cost of nodes, one containing the computed nodes of the permanent list S and another for the nodes still missing from the provisional list S . At each iteration, the algorithm computes the shortest path from a neighboring node k to node i with the lowest cost to node i . The list S is incremented by adding the computed node. In contrast, the list S is decremented by removing the nodes that are added to S.
Our work evaluated the shortest path using different QoS parameters (B, D, PL, Equations (8)–(10)). We use Dijkstra’s algorithm, modifying the minimum cost of the links with the metric we want to evaluate, and select the path that corresponds to the source and destination of the data flow.
Algorithm 1. Dijkstra’s shortest path algorithm (centralized approach)
1:        S = {i}         //permanent list; start with source node i
2:        S’ = N\{i}   // tentative list (of the rest of the nodes)
3:        F i n d   k   ϵ   S such that D i k =   m i n m ϵ S D i m //identify a neighboring node k not in the list S with the minimum cost path from i.
4:               S = S U {K} //Add k to the permanent list S
5:               S’ = S’\{K} //Drop k from the tentative list S’
6:                                    if S’ = ø //if S’ is empty stop
7:                                             end
8:               For j ϵ   N k ∩ S’ do //consider the list of neighboring N k , of the intermediary k.
9:                                              D t i , j = min ( D t i j ,     D t i k + d t k j ) //check for improvement in the minimum cost path
10:                                    return to step 3,

3.4. Multi-Constrained Optimal Path (MCOP)

The problem in this work considers three conflicting objectives that must be optimized simultaneously. The general formula of a MOP (multi-objective problem) [34] is as follows:
Find a vector X * = [ x 1 * ,   x 2 * , ,   x n * ] T , where m inequality constraints g i ( x ) 0 , i = 1 ,   2 ,   ,   m ,   p equation constraints h i ( x ) = 0 , i = 1 ,   2 ,   ,   p , and minimizing the function f ( x ) = [ f 1 ( x ) , f 2 ( x ) , f k ( x ) ] T are satisfied, and where x = [ x 1 , x 2 , x n ] T is the decision variable vector.
The solution for an MOP may not be clear-cut because the objectives often conflict and cannot be met simultaneously, so no solution minimizes all objectives. The key is to construct the evaluation function for the objective problem. Two main approaches are usually used to formulate these functions. The first is to combine all of the objectives into a single objective using a feasible method or to select a particular objective and consider the other objectives as constraints. The second is to determine a representative set for all non-dominated solutions, called the Pareto front. For this case study, we consider approaching the problem using both approaches. We use the weighted sum for the first method and, for the second, the MOCell genetic algorithm. The forms are described in more detail below:
  • The weighted sum method [35] is the sum of the values corresponding to the different objectives, each multiplied by a weighted coefficient. This method provides a weight for the various network parameters that can be used as a cost for path computation. We use it as a fitness function for our proposed routing method.
w B , D , P L = m i n x X i = 1 k w i f i ( x ) = m i n e p ( u , v ) ϵ p w k ( u , v )
2.
The method based on Pareto dominance determines all non-dominated solutions that satisfy the conditions defined for the problem S (feasible region). Any point x   ϵ   S is a feasible solution. The feasible region is defined as follows [36]: Given 3 vectors u = ( u i ,   , u k ) , v = ( v i ,   , v k ) , and w = ( w ,   , w k ) , we say that u dominates v and v dominates w (denoted by u < v   a n d   u < w ), if and only if u is less than v and w .
Each vector in the Pareto set has some correspondence in objective function space, obtaining the so-called Pareto front. Formally:
Pareto optimality: A solution X * ϵ   S is Pareto optimal if and only if it is non-dominated by any other solution X ϵ   S .
Pareto optimal set: For a given MOP, f ( x ) is the Pareto optimal set, and p s is defined as follows:
p S = { x     S | x     S   f   ( x )     f   ( x ) }
Pareto front: For a given MOP, f ( x ) , and Pareto optimal set, p S , the Pareto front, p F , is defined as follows:
p F =   { f ( x )   ϵ   k |   x     p * }
MOPs can have a Pareto front composed of a possibly infinite number of solutions. The algorithms that use stochastic techniques, such as metaheuristics, aim to find an approximation p F , which represents the actual Pareto front.
To solve our problem with our proposed method, we need to find the path with the minimum end-to-end delay (D), packet loss (PL), and minimum cost of available bandwidth (B), as represented in Equation (16). The values of the functions are normalized to the minimum cost of delay and bandwidth for the QoS of the application.
M i n e p   ( B , D , P L )

3.5. MOCell-Based QoS Optimal Path

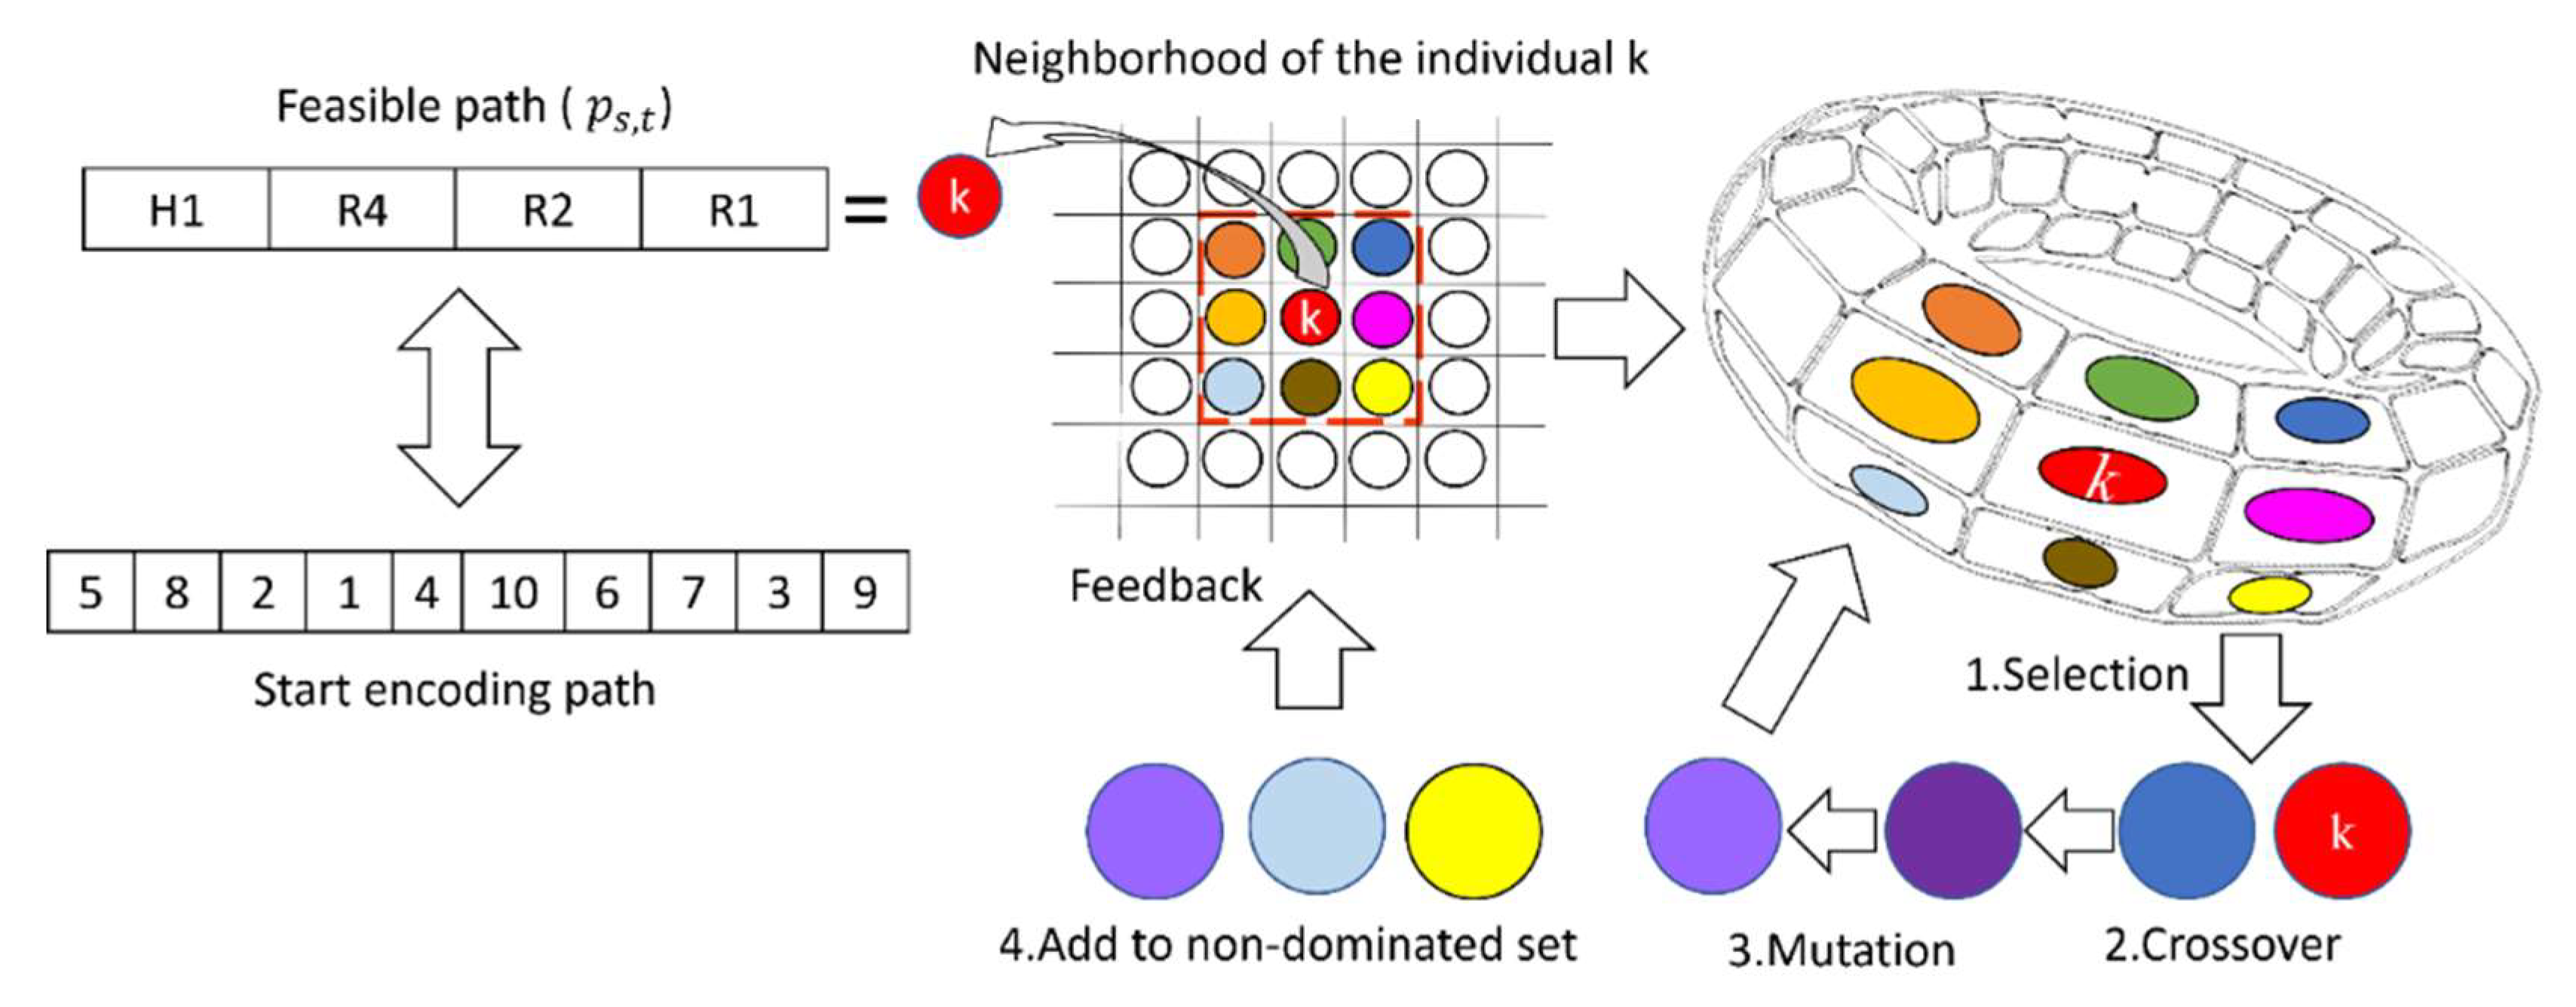
In this work, we consider the implementation of cellular GA for path selection considering the QoS of flows, particularly MOCell. The main feature of this algorithm is the distribution of its population in small neighborhoods, where each individual (possible solution to the problem) can be recombined only in the surrounding cells (neighborhood cells). Neighborhoods can be grouped with 4, 8, and 16 neighbors, with eight neighbors being the default configuration in the MOCell algorithm [37]. The population is represented on a two-dimensional toroidal grid so that everyone has the same number of neighbors. The main idea is to explore the search space further since overlapping neighborhoods cause a slow spread of solutions in the population. At the same time, genetic operators exploit each neighborhood (see Figure 3). MOCell maintains a file that stores the non-dominated solutions found in each iteration; the grouping distance of NSGA-II [38] is used to compute them. MOCell differs from other genetic algorithms by maintaining a diverse solution set and a feedback mechanism of non-dominant solutions to replace individuals in the population after each generation.
The genetic algorithms [39] start from a set (population) of potential solutions (individuals). The best solutions are selected according to a fitness function through a selection process to assign the parents of each neighborhood and carry out the crossover and mutation processes in order to find better solutions to the problem (Algorithm 2 introduces the MOCell pseudocode).
Algorithm 2. Pseudocode of metaheuristic based on MOCell
1:        data = parameters           //initial parameter MOCell
2:        pop = solution                  // Create an initial population
3:        grip = (pop)                      //distribute the population in a toroidal grip.
4:        P F = [] //create pareto front = empty
5:        While (terminal Condition = = false) do
6:                  For individual ϵ pop do
7:                              neighborhood = (individual) //everyone individual builds a neighborhood
8:                              parents = (neighborhood) //selection parents
9:                              offspring = recombination (data, parents) //crossover
10:                              offspring = mutation (data, offspring)
11:                              pop = replacement ([parents], offspring)
12:                               P F = insert (Offspring)
13:                  End
14:        pop = feedback (ParetoFront)
15:        End
One of the simplest methods for generating routing paths is random search. This involves using arrays of random integers to symbolize different paths. The population is generated by randomly assigning different priority IDs for each device, considering the size of the topology, as well as validating the path with the decoding process mentioned above. All individuals are distributed in a toroidal grid.
For the generation of an encoded path, a chain is created containing the total number of randomly ordered network devices. The positions of the numbers represent the genes (priority IDs) that make up a chromosome (pathway). The first gene represents the source path, and to determine the path of a chromosome is necessary to decode the sequence using the adjacency matrix of the topology. For example, in the coding process of a routing path between H1 and R1 of the network topology, as shown in Figure 4, the following procedure is defined:
Coding:
  • Generated a chain with 10 elements corresponding to network nodes.
  • Filled the string with random numbers from 1 to 10.
  • Created a chromosome: 5 8 2 1 4 10 6 7 3 9.
Decoding:
Table 3 shows the network adjacency matrix used to perform this procedure. The genes’ value is defined from highest to lowest to determine the order of the path, as shown below:
(1) The path is initialized on H1 towards R4, as it is the only adjacent node.
(2) R4 has two adjacent nodes: R2 with an ID = 8 and R5 with an ID = 4. The selected node has the highest ID—in this case, R2.
(3) In R2, R1 is chosen because it has the highest value ID.
(4) The decoding process is completed; the path reaches the proposed destination node (R1).
(5) Path: H1, R4, R2, R1.
In genetic algorithms, to improve the characteristics of solutions (chromosomes), crossover operators are used in each generation. In the MOCell algorithm, a single-point crossover (SPX) between two parents without the point from the origin and destination was used to conserve the path [40]. For this method, a cut-off point between both parents is selected, and an element of the solution vector is selected randomly to assign it as a cut-off point. The genes of both parents are exchanged between the parents’ genes, providing two new descendants with information about parental genetics.
In genetic algorithms, an additional operator is used to avoid falling local optima and maintain genetic diversity from one population to another, called the mutation operator. We employ the swap mutation operator, which proposes the random selection of a pair of genes in the chromosome and the exchange of values between them [41]. Figure 5 shows the operators used.
Fitness function representation: The optimization problem is formulated with three objective functions, f 1 , f 2 , and f 3 , represented by QoS parameters such as delay, packet loss, and available bandwidth, respectively. The purpose of the first is to minimize the cost of delay and latency covered by a specific path. The purpose of the second is to minimize the loss of data, and that of the third is to minimize the loss of quality of service when the demand for bandwidth consumption is not satisfactory for the correct functionality of the flow.
The f 1 function (Equation (9)) consists of the summation of all delay costs for the path. The QoS parameters, such as delay, have an additive metric composition rule for the end-to-end path.
The f 2 function (Equation (10)) indicates the packet loss on the path, represented as the sum of the data losses in the links.
The f 3 function (Equation (8)) consists of the bandwidth parameter; the end-to-end path selects the minimum capacity bandwidth of the network links.
We consider a standard configuration for the algorithm parameters: a population size of 100 for domains A and B and 400 for domain C, considering twice the number of individuals concerning the number of nodes in each domain; a neighborhood size of 8; and the tournament selection method with a crossover probability pc of 0.6 and operator SPX and a mutation pm of 0.6 with operator swap.

3.6. MOEA/D QoS Optimal Path

The multi-objective evolutionary algorithm based on decomposition (MOEA/D) [42] decomposes a MOP into a set of scalar optimization subproblems using N uniformly distributed weight vectors, w i , each of which is iteratively optimized using recombination operators (crossover and mutation). Each normalized weight vector is uniformly distributed in T regions, called neighboring subproblems, and the objective is to find a Pareto-optimal solution along each reference neighborhood. The child solutions replace the parent solutions of the subproblems if their cost, w , is better than the previous cost. An important aspect of the algorithm is the choice of the decomposition method. According to Zhang and Li [43], three common decomposition methods are implemented: weighted sum, Tchebysheff, and penalty-based boundary interaction. For simplicity, in this paper, we focus only on the weighted sum approach according to Equation (13). The problem is divided into three weight vectors using the weighted sum method, where each neighborhood is assigned a network parameter priority using weight vectors, w (Algorithm 3, introduces MOEA/D pseudocode).
Algorithm 3. Pseudocode of metaheuristics based on MOEA/D
1:        data = parameters          // Initial parameter MOEA/D
2:        pop = solution              // Create an initial population
3:         W (t = 0)                       // Initialize Weight vectors
4:        T = w i   ϵ   W ( t )              //Calculate neighborhoods by the weight vectors
5:        P F = [] //create pareto front = empty
6:        While (terminal Condition==false) do
7:                   For neighborhood ϵ pop do//everyone Weight vector builds a neighborhood
8:                             For individual ϵ neighborhood do
9:                                        parents = (neighborhood) //selection parents by neighborhood
10:                                        offspring = recombination (data, parents) //crossover
11:                                        offspring = mutation (data, offspring)
12:                                        pop = replacement (parents, offspring)
13:                                        P F   = Insert (Offspring)
14:                              End
15:                   End
16:        pop = feedback (Pareto Front)
17:        End

3.7. Simulation Model

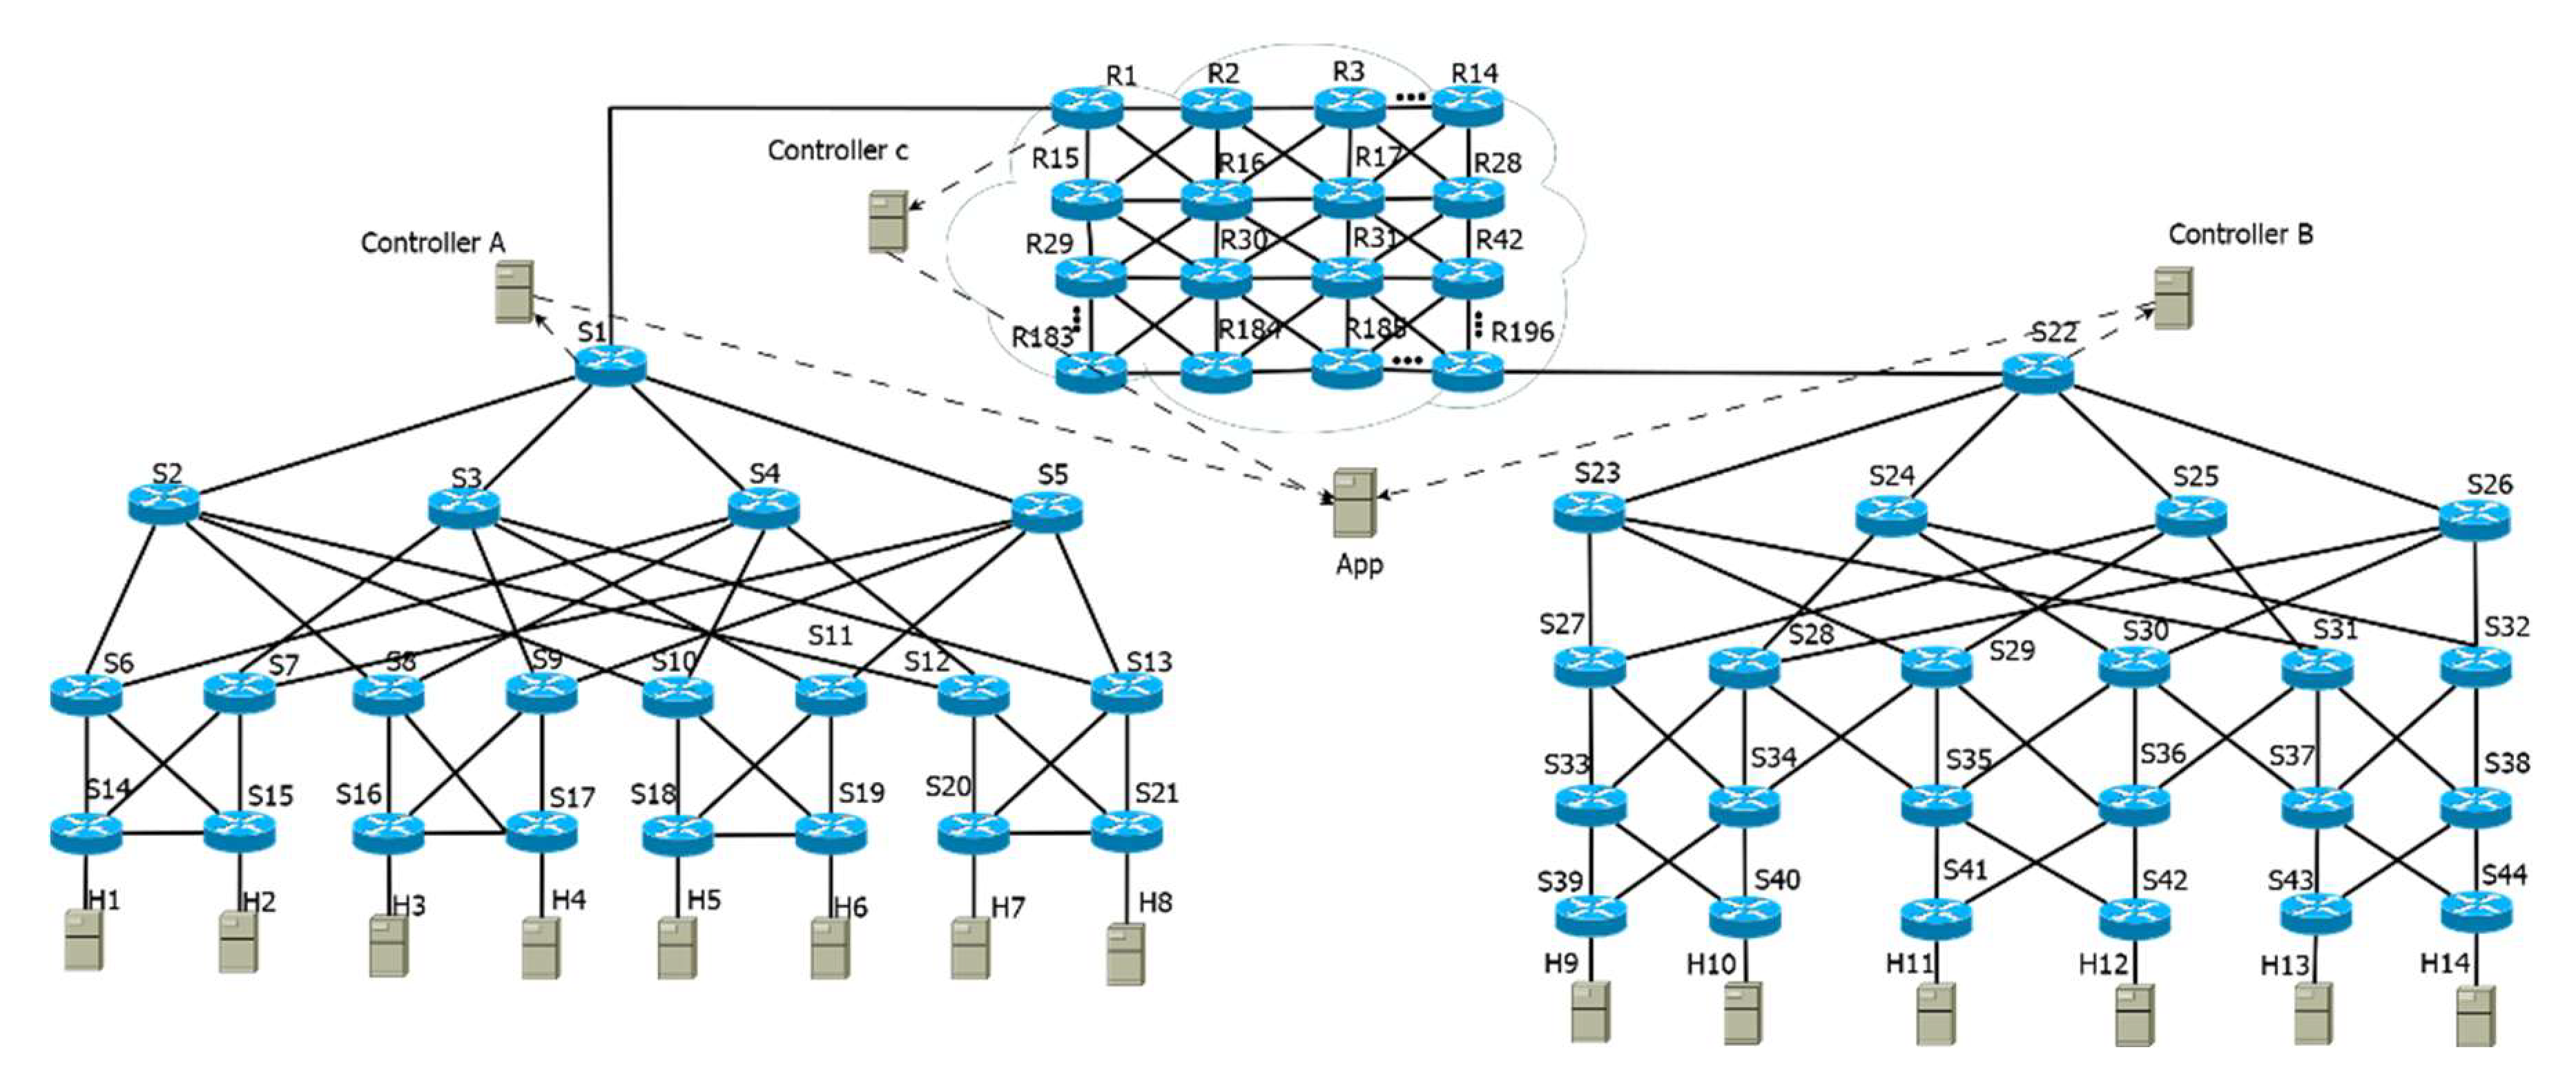
The simulation model implements a network topology that considers the transfer of data flows from host to host among SDN-based distributed clouds. In our research, the experimental configuration considers an extreme network topology where a very dense cloud is considered for communication between two data centers, presenting a three-tier data center topology. This topology consists of the access layer to connect hosts, an aggregation layer to connect access switches, and a core layer at the root where the network controller is located. At the same time, the intermediate cloud presents a topology in the form of a mesh to provide a challenge for the appropriate path selection process due to the multiple alternatives that can arise in scenarios containing networks with a large number, such as IoT networks.
Figure 6 shows the topology used in the simulation model. It is based on three domains, where two data centers are connected by a cloud, defined as Domain A, Domain B, and Domain C (cloud). Each domain has an SDN network controller. Domains A and B comprise a distributed topology with 29 nodes, while Domain C represents a topology with 196 nodes. The link values define a particular state that an ISP might have with bandwidth, delay, and packet loss metrics.

3.8. Experiment Setup

The path selection process and the MOCell algorithm implementation were developed in the MATLAB programming language. We used the OpenDayLight (ODL) controller with the RESTCONF module. The distributed data topology was designed using the Mininet simulator [20]. Mininet is one of the most used platforms in the literature for SDN emulation due to its compatibility and flexibility with other applications and controllers. For the simulation environment, we configured a virtual machine with a Linux Debian 9 operating system with 12 CPUs, 16 RAM, and 100 GB of disk space (NLSAS disks). Below is a list of the software specifications and tools used:
  • Linux Debian 9;
  • Mininet 2.3;
  • OpenDayLight (ODL) SDN Controller;
  • MATLAB 2021 for MOCell-based code;
  • Python 3 for REST API communication scripts;
  • Iperf for data stream transfers performance.
The ODL controllers for Domains A, B, and C were configured according to the simulated network topology (Figure 6) and the link parameters (bandwidth, packet loss, and delay) corresponding to the values in Appendix A. We simulated each domain along with its SDN controller, and they were configured to connect with the Mininet simulator.
The network topology was divided into three domains. Controllers A, B, and C managed the domains, respectively. Since the domains were separate, each controller had its own domain status and network information. Therefore, it was necessary to implement an application that coordinates the controllers to establish the routing process that allows communication among them.

4. Evaluation

In contrast to problems where we only try to satisfy a simple objective and where optimality is given by a single minimal solution, in the multi-objective problem, we strive to find the set of non-dominated solutions that satisfy the constraints associated with path selection according to QoS criteria and simultaneously optimize two or more features. For each domain, 30 independent runs of the genetic algorithm were performed with a breakpoint of 500 generations. Figure 7 shows the initial and final populations for each implementation of the MOCell in the three independent domains. The values are normalized to the maximum value found for the scores of each parameter and domain. A significant decrease was observed in the space of better solutions representing higher QoS parameters. As for the path selection of the non-dominated solutions, it is possible to consider a priority order of the functions according to the flow requirements. In this case, we choose the delay first, packet loss second, and bandwidth third, according to the performance of the different algorithms evaluated in Table 4 and their flows, as shown in Figure 8 and Figure 9.
The experiment measured data transmission between the end-to-end hosts of data centers H1 and H14. We compared traditional data forwarding based on the shortest path algorithm and the highest available bandwidth. We also considered the path with the lowest delay, the lowest packet loss, a weighting criterion, and our MOCell routing proposal. We used the IPERF [44] application to test network performance with the connection-oriented protocol (TCP) and connectionless protocol (UDP). Our method queries the SDN controller to obtain the network’s topology and compute the paths from one end to the other. Table 4 shows the network paths for hosts from source to destination according to their optimization value and all QoS parameters used in this work.
Each test was performed under the same conditions as the experiment, where the total availability of the network was used for path selection according to the parameters in Table A1, Table A2 and Table A3 from Appendix A.
The following steps were defined for the execution of the test:
  • Design and execute the network topology with three domains (A, B, and C) and an external controller per domain.
  • Execute network performance tests between the end nodes with IPERF according to the optimization parameter.
  • Transfer the traffic during the specified period.
  • Repeat the experiment using data stream forwarding according to the optimization parameter.
  • Obtain results.
An inter-domain approach was used to evaluate the data flow performance between two hosts. IPERF was used to generate TCP and UDP traffic between hosts H1 and H14 to simulate a scenario where an application transfers data among hosts.
The test used several optimization criteria to select the path (these are described in Table 4). Paths shared by host-to-host routing methods have different network metrics. Our proposal computes and configures the path considering all available QoS parameters in the network. The algorithm can be configured depending on the requirements of a particular application, but in this case, the path minimizes the parameters considered.

Network Performance

We use the IPERF tool to evaluate the performance of different routing methods between the extreme nodes of our network topology, from H1 to H14. The values of the IPERF tool were configured with standard TCP traffic and UDP parameters and a time interval of 200 s for each data transmission. We executed the experiment 30 times.
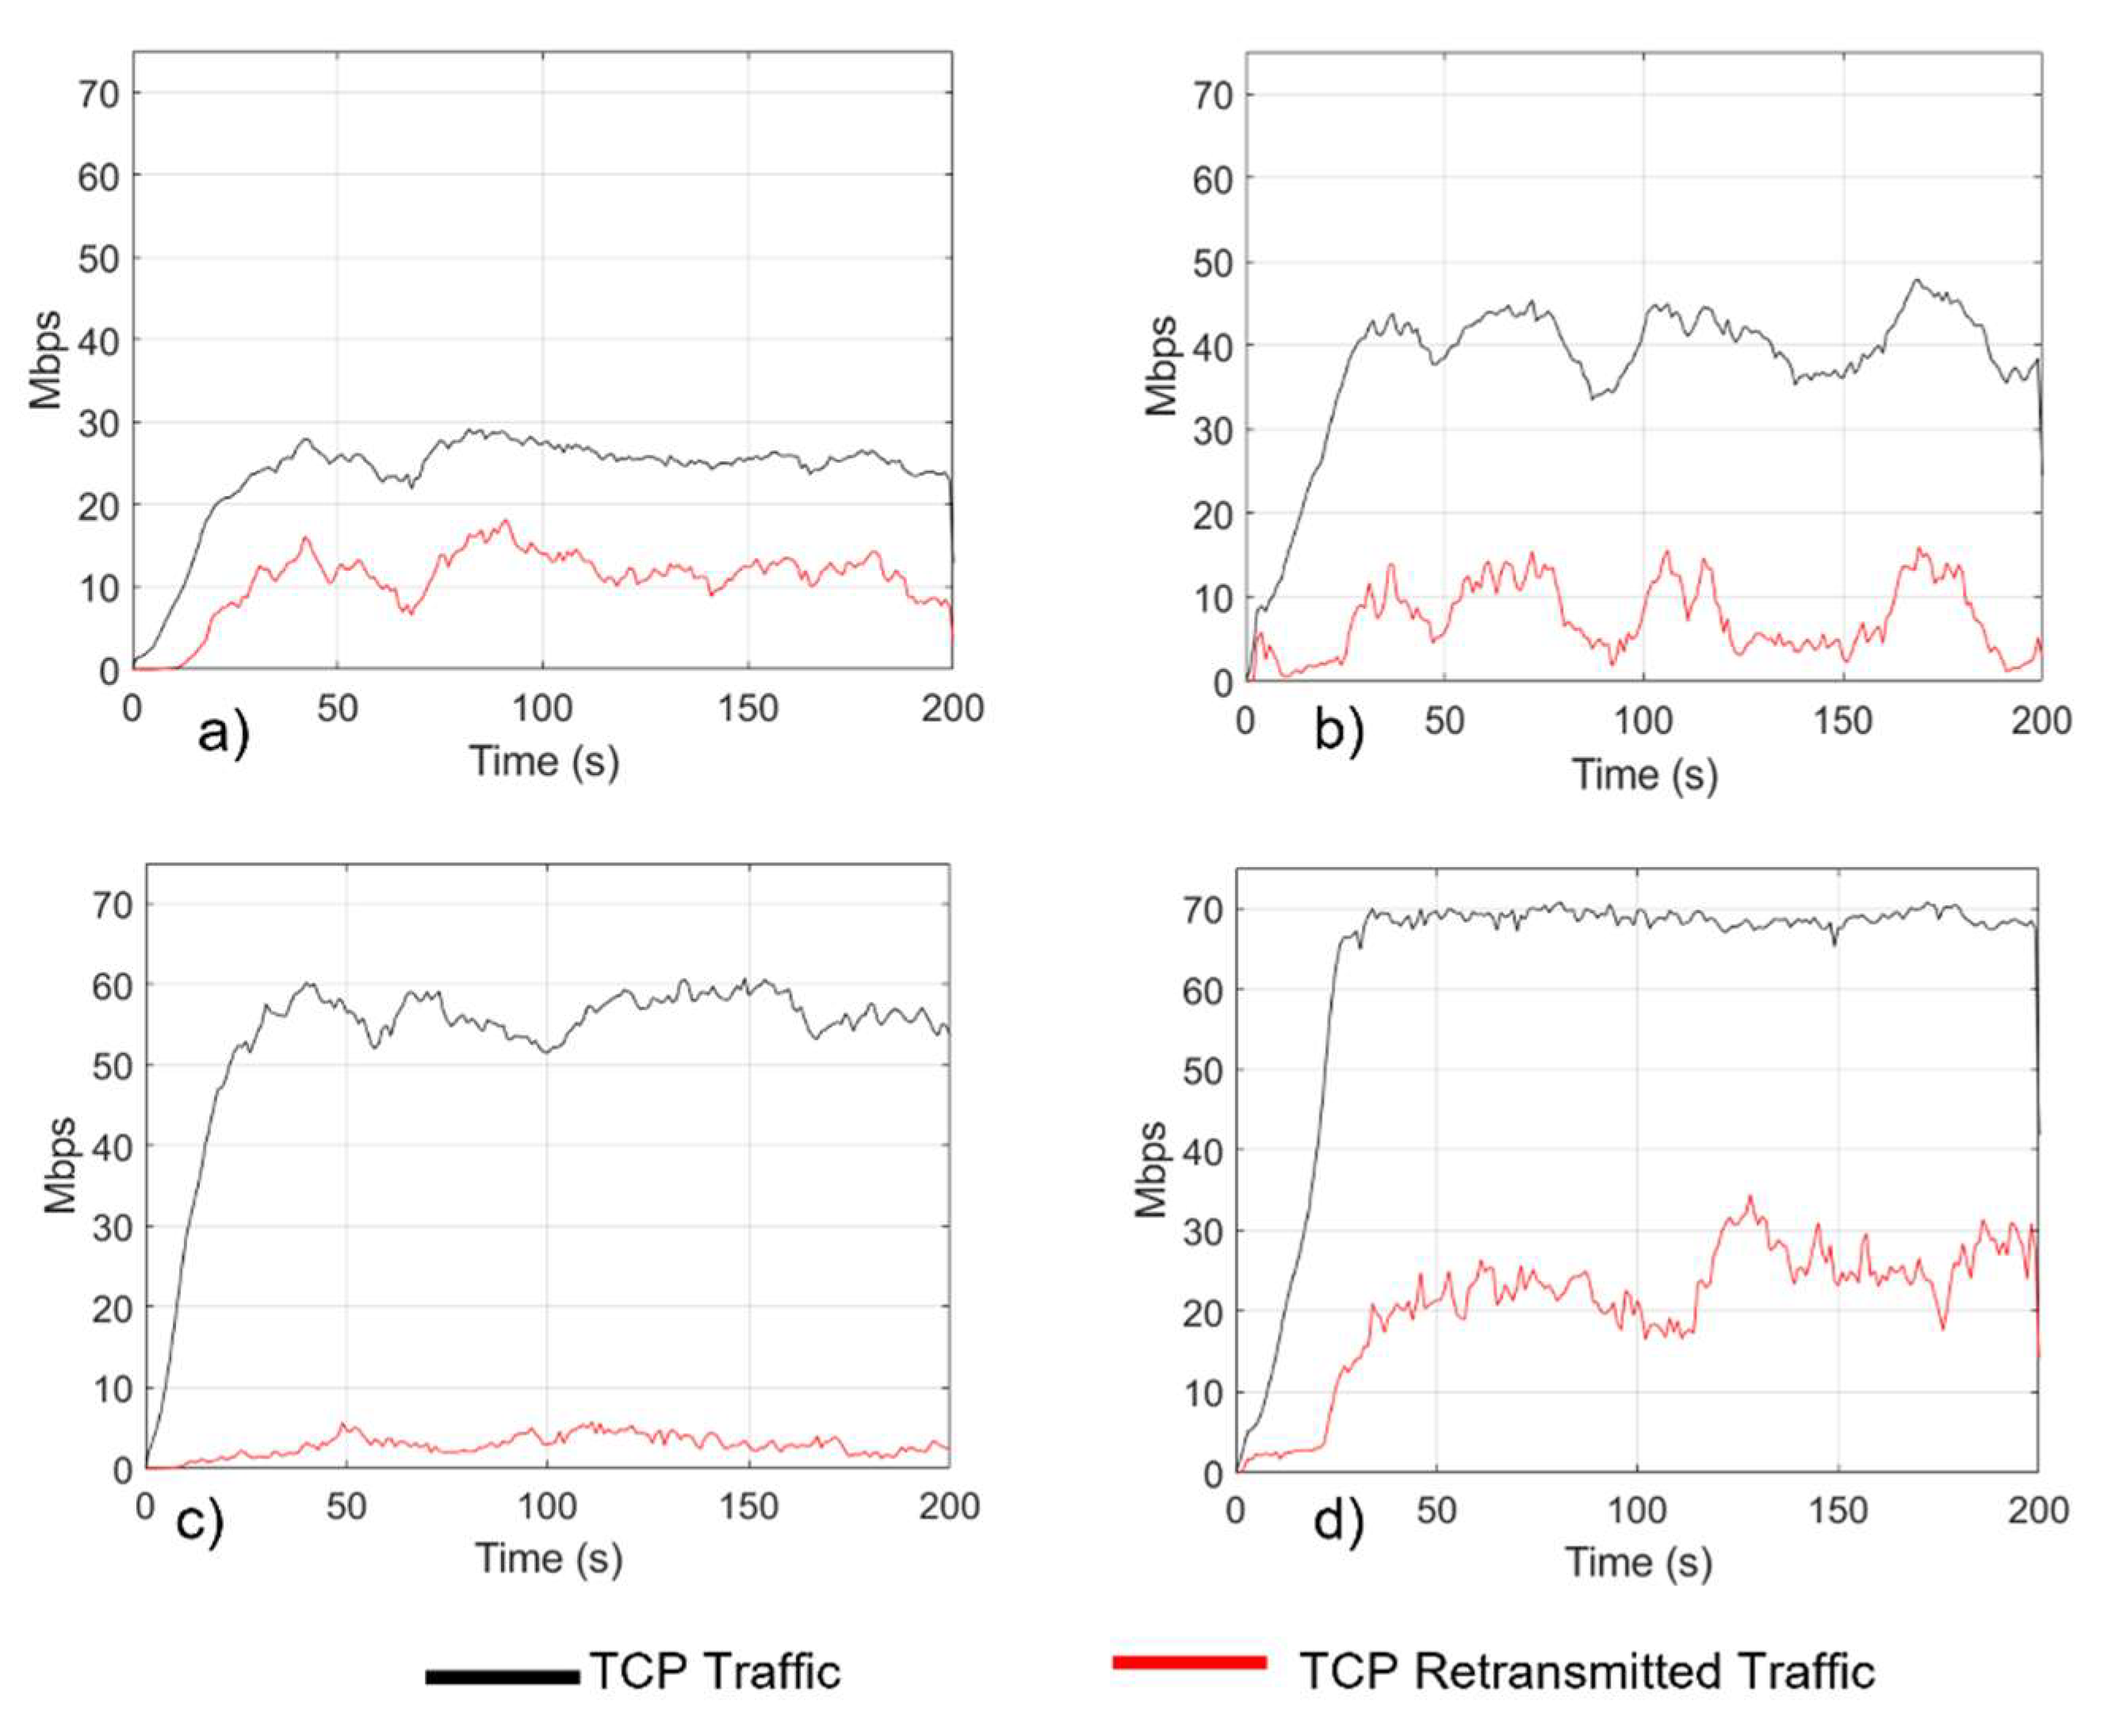
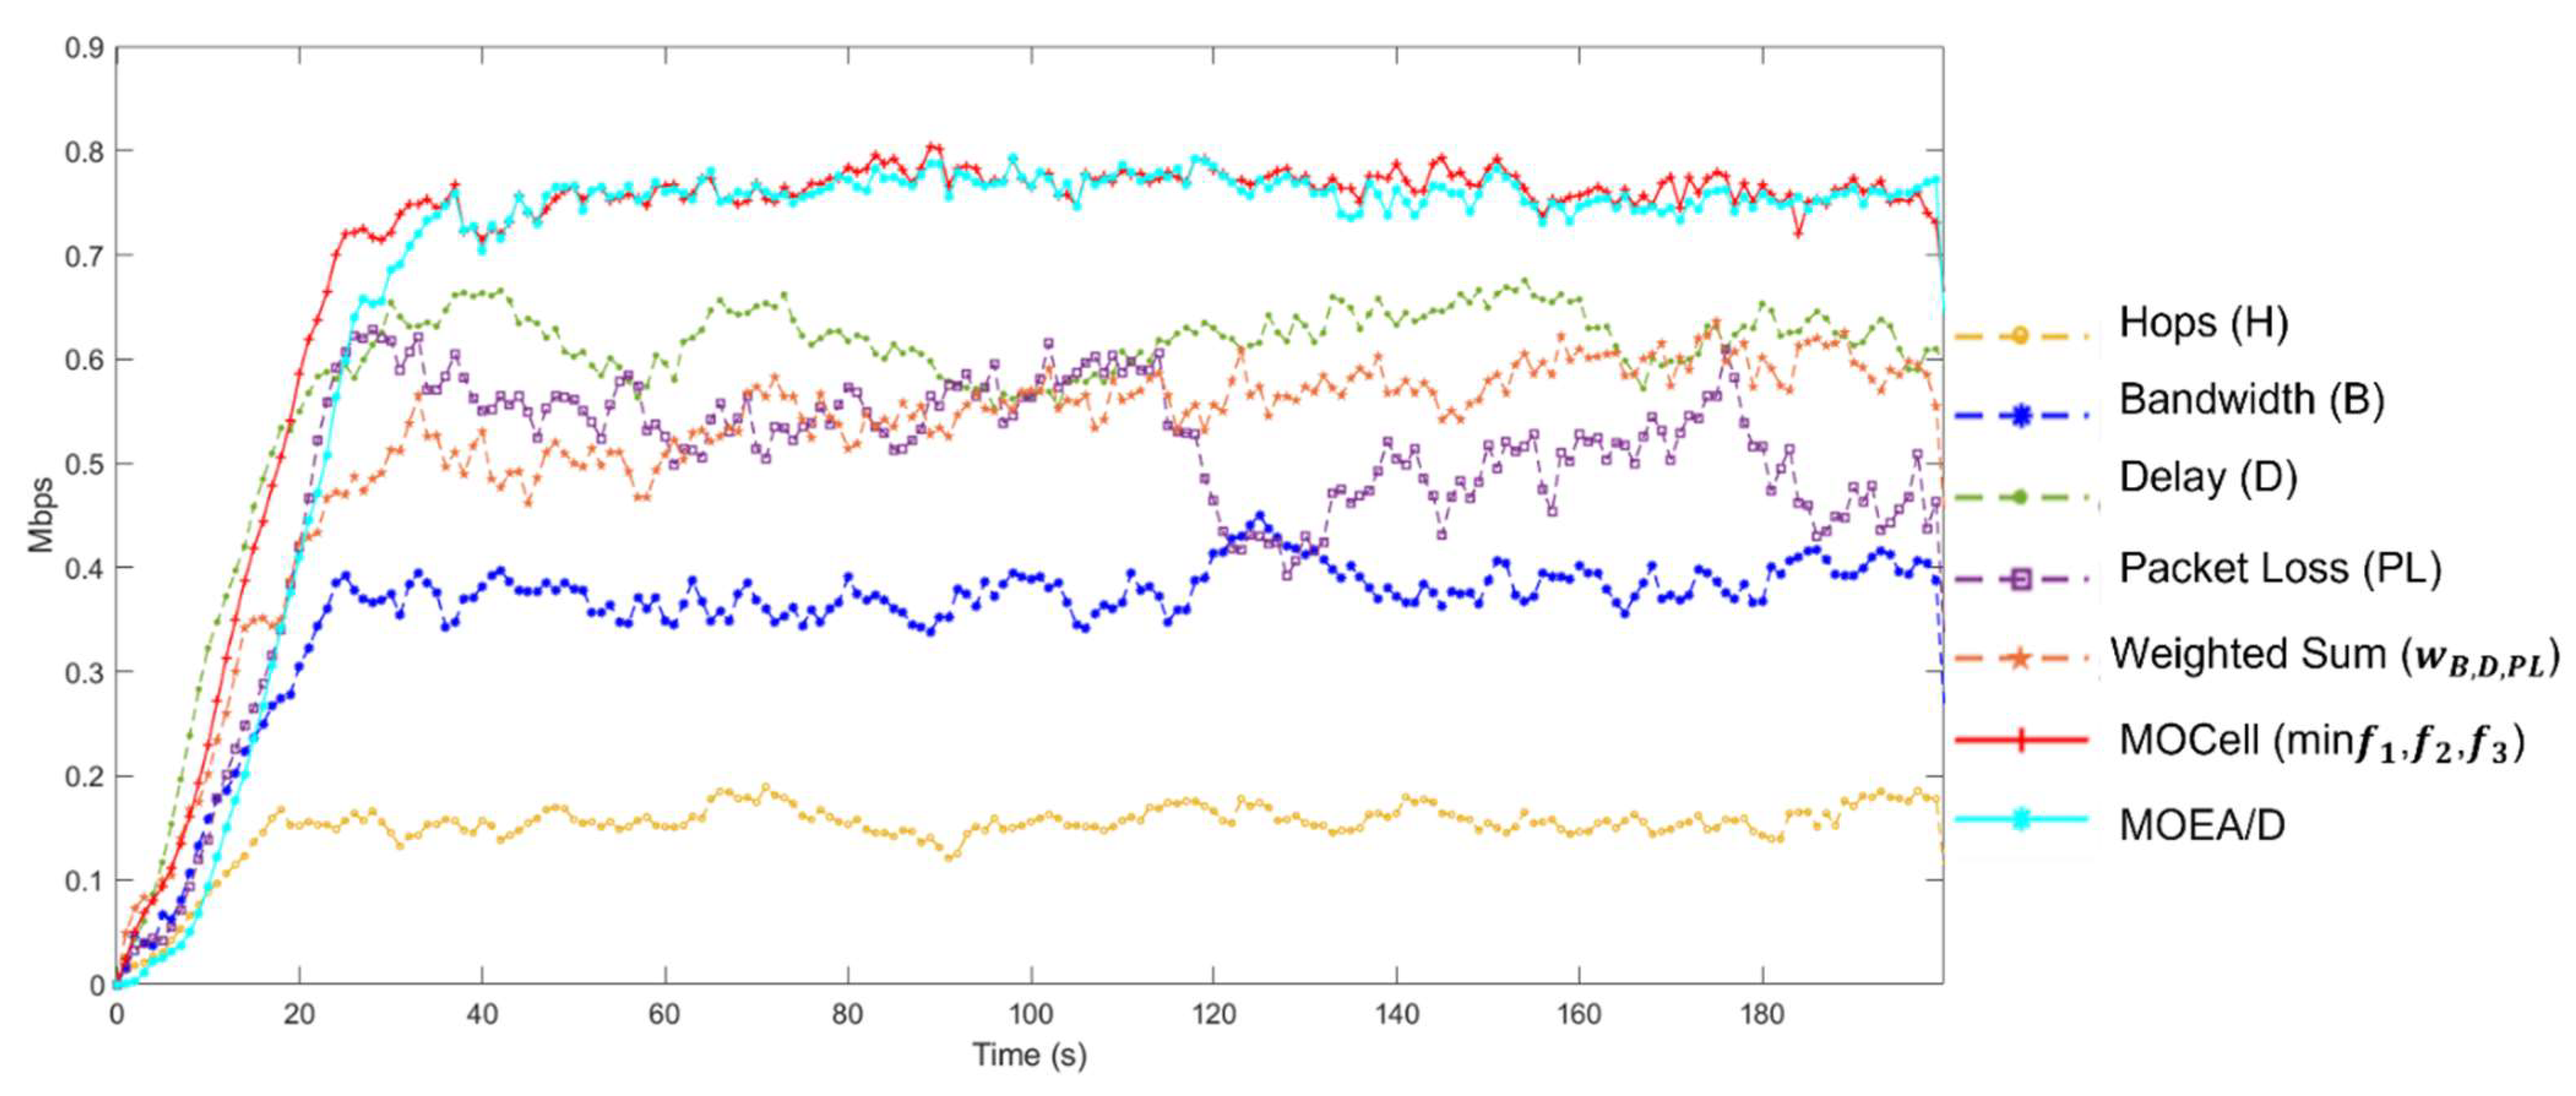
Figure 8 and Figure 9 show the first experiment where the traffic of the paths was evaluated with the IPERF tool and the Wireshark tool [45] based on the maximum possible data transfer rate for TCP traffic. The graphs show in black the total traffic transmitted in the experiment, and the traffic in red represents retransmitted packets that affect the network performance, such as data packets that arrive in a different order from which they were sent or the re-sending of packets that were damaged or lost during their initial transmission. We obtained the best performance with our proposed method since it minimized all of the parameters represented in Equation (16). For evaluating path selection based on MOCell, we considered the multi-objective functions in order of priority as f 1 < f 2   < f 3 , as described in Equations (8)–(10).
This evaluated comparison between algorithms shows the capacity of the selected path for each. Next, we discuss each algorithm regarding the chosen path and how it affects the network performance results.
As seen in Table 4, the average data transfer speeds of the traditional methods are slower (minimum hops 23.8 Mbps and maximum available bandwidth 38 Mbps) than the path selected by our method (66.9 Mbps), as were the paths with the lowest delay (53.4 Mbps) and packet loss (63.1 Mbps). For the test, we used the exact Dijkstra search algorithm to show the efficiency of different paths with optimization criteria according to the parameters usually implemented in traditional routing: fewer hops and higher bandwidth. We also added the path with the minimum delay and data loss.
The path with the H (fewest hops, most frequent routing) had the lowest average data transfer rate because it had little effective traffic. A significant portion of its traffic had to be retransmitted because its path went through several nodes where there would have been significant losses, making it the worst path in this test.
The path with B (the highest available bandwidth) had the highest number of hops and a high probability of packet loss and delay because it had to go through many nodes to reach its destination.
The path with PL (the least packet loss) had a higher traffic transfer rate than the previous paths. However, it was the path with the most packet retransmissions due to packet delays, significantly affecting performance.
The path with w B , D , P L (weighted sum), considered the weight by the available metrics, achieved better performance than the traditional methods.
From the obtained results, we can see that an evolutionary algorithm (MOCell and MOEA/D) can improve the routing-related aspects by evaluating multiple available paths for establishing routing flows and evaluating their QoS parameters.
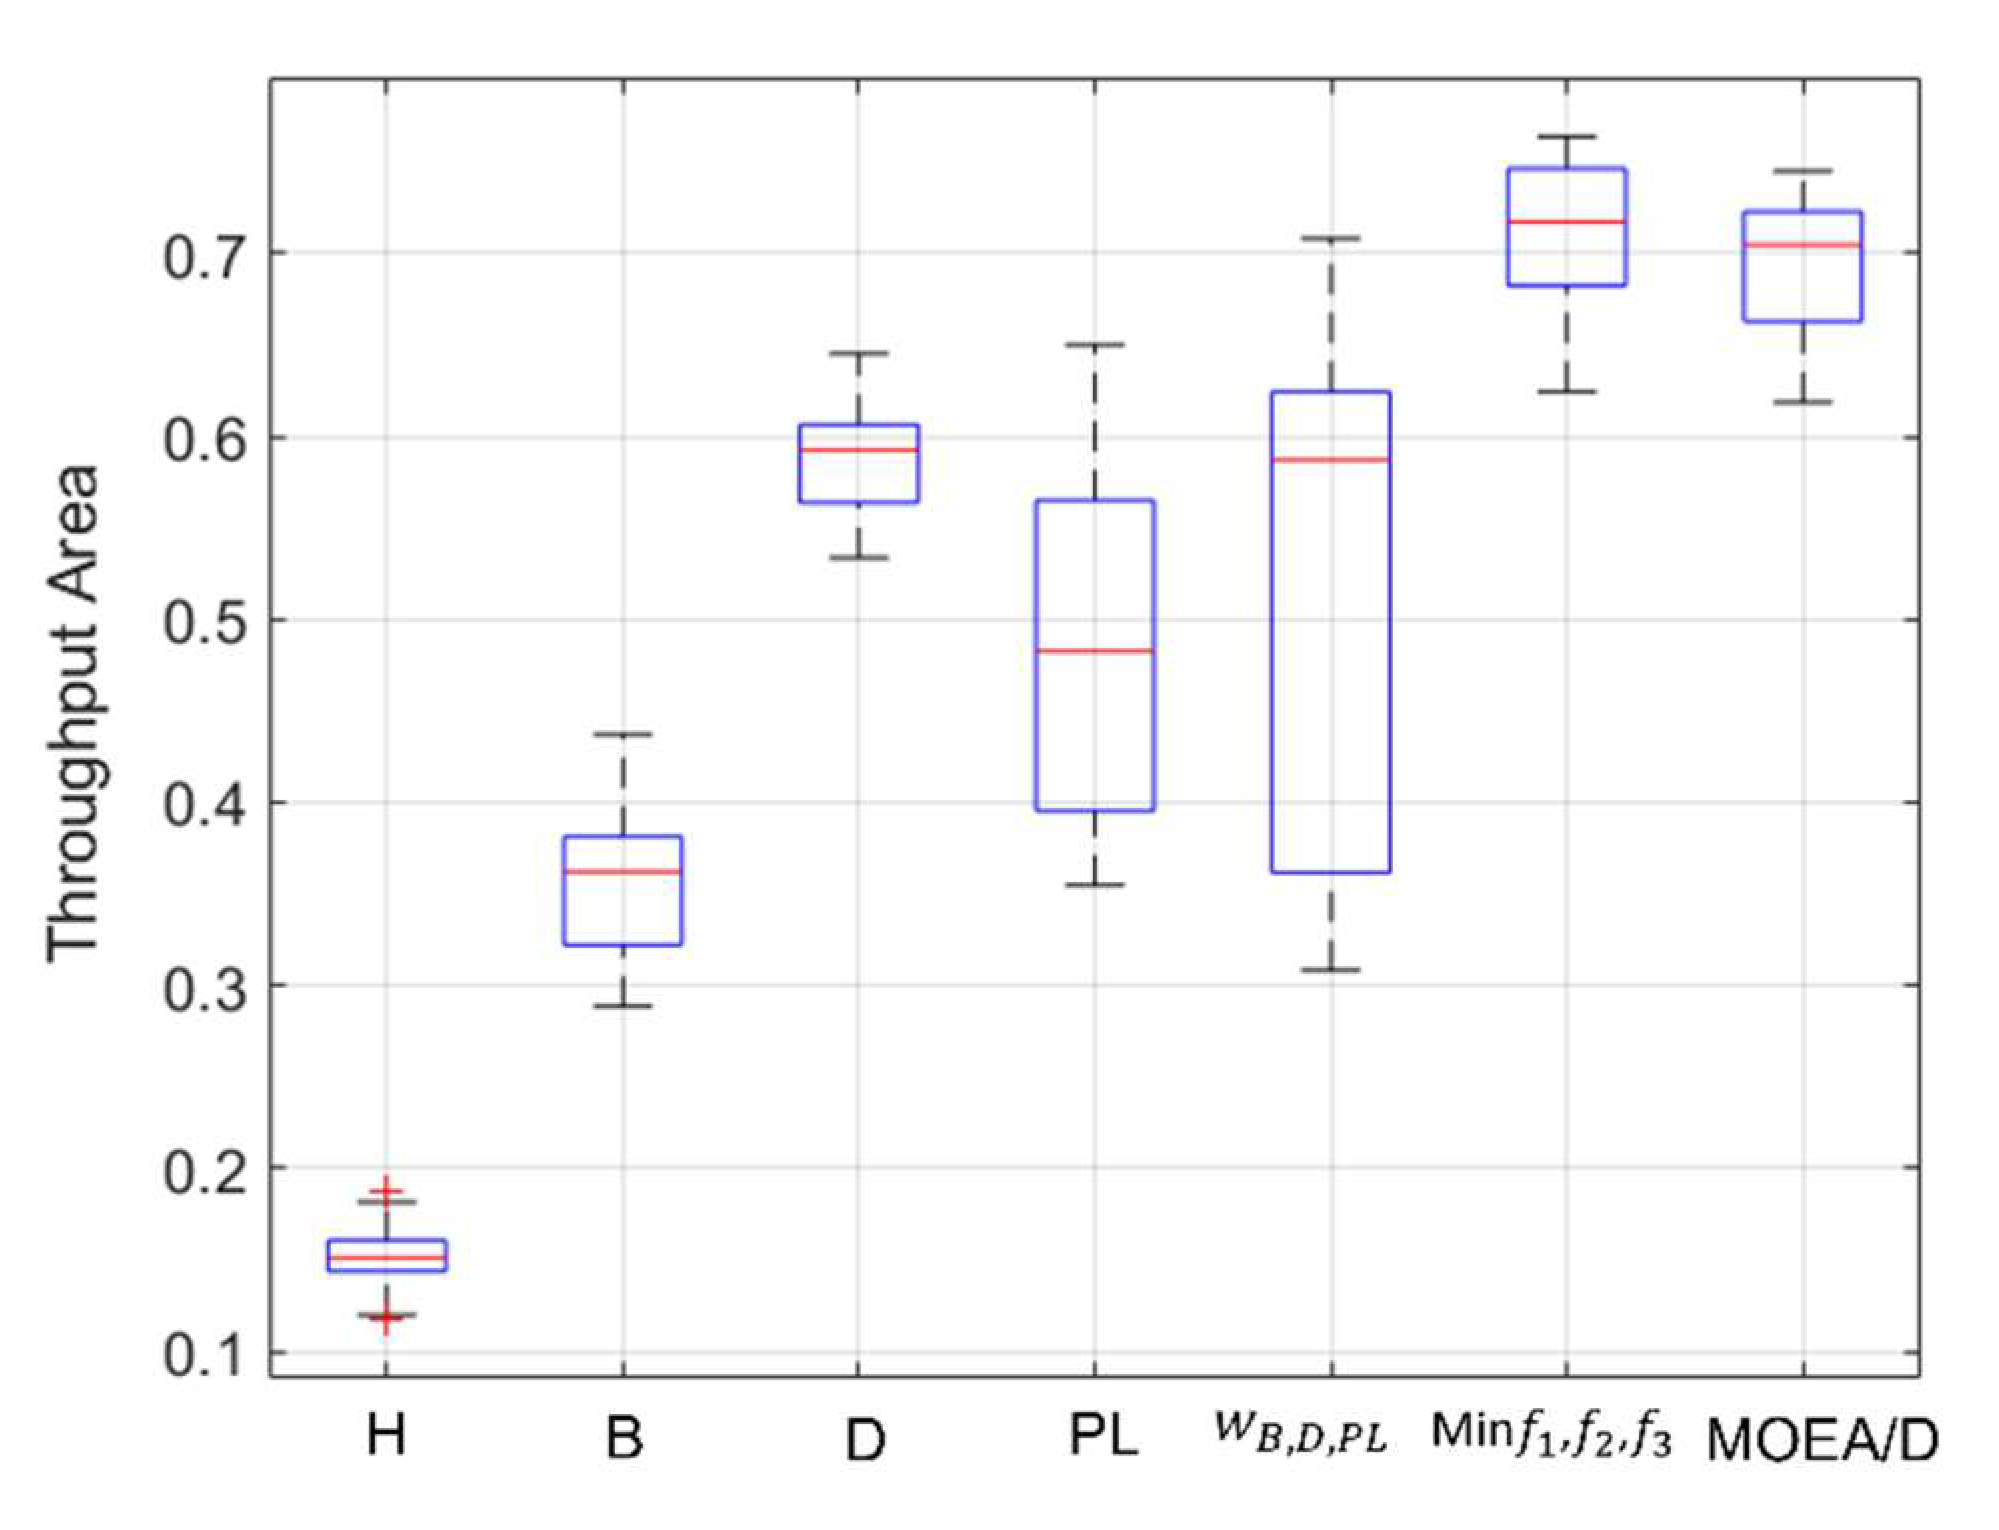
The path performance is determined by the amount of data successfully transmitted during the cycle period (Equation (5)). We can evaluate the throughput in terms of the maximum data transmission capacity in the network to normalize the throughput size of each path and calculate the area enclosed by the throughput function (Figure 10) using the Riemann sum [46]. We find that the path proposed by M i n f 1 , f 2 , f 3 (MOCell) can exploit 71.08% of the network throughput on average, and MOEA/D can exploit 69.23%, while the paths selected by the other techniques had values below 55.99% (see Figure 10). The MOCell-based routing path improves by more than 54% on average compared with the traditional routing method with fewer hops (H) and by 35.44% for the path with the highest available bandwidth (B), in the case of the network topology presented in this paper. Finally, in the case of the evolutive algorithms, MOCell had a 1.85% higher throughput than the MOEA/D method when using the same parameters and metrics for mutations, generations, and the method of selecting individuals by tournament; in this way, a fair evaluation was obtained.
The path chosen by the MOCell method shows slightly better performance than the MOEA/D method, especially in the first 30 s of transmission, since it converges earlier. After this period, both methods show similar performance.
Figure 11 and Table 5 show the values of the throughput area (normalized by the maximum capacity) of 30 independent runs of the Mininet experiment for each path selected by the algorithms. This graph shows that the w B , D , P L (weighted sum) and PL (packet loss) paths have a larger standard deviation in their performance than the other paths. The selected path using the minimum delay algorithm (D) leads to a higher median without considering the paths of the MOCell and MOEA/D methods.
From the results, it can be concluded that both packet loss and delay are related to not only the available bandwidth but also the low speed of the network, as is usually considered when assigning paths and QoS for the data streams. Retransmissions of packets in transit lead to poor or slow network performance, and low throughput indicates problems such as increased latency and possible congestion.
As mentioned earlier, minimizing all of the factors that affect end-to-end link performance is essential to improve the speed and efficiency of data transfer. It is critical to leverage the various parameters in the network to improve network performance and provide a better quality of service. Our proposal can improve the routing-related aspects by evaluating multiple available paths to set up routing flows and evaluate their QoS requirements.
The second experiment was performed with UDP traffic between nodes at the ends of topology H1 to H14. As mentioned above, the performance of the paths selected by the different algorithms presented is evaluated in this experiment. In this case, the data transmission consisted of a constant flow of UDP traffic with a bandwidth of 45 Mbps for 200 s and the standard configuration of the IPERF tool. The network state corresponded to the first experiment’s conditions, and the initial conditions were restarted for each evaluated case in the Mininet simulator.
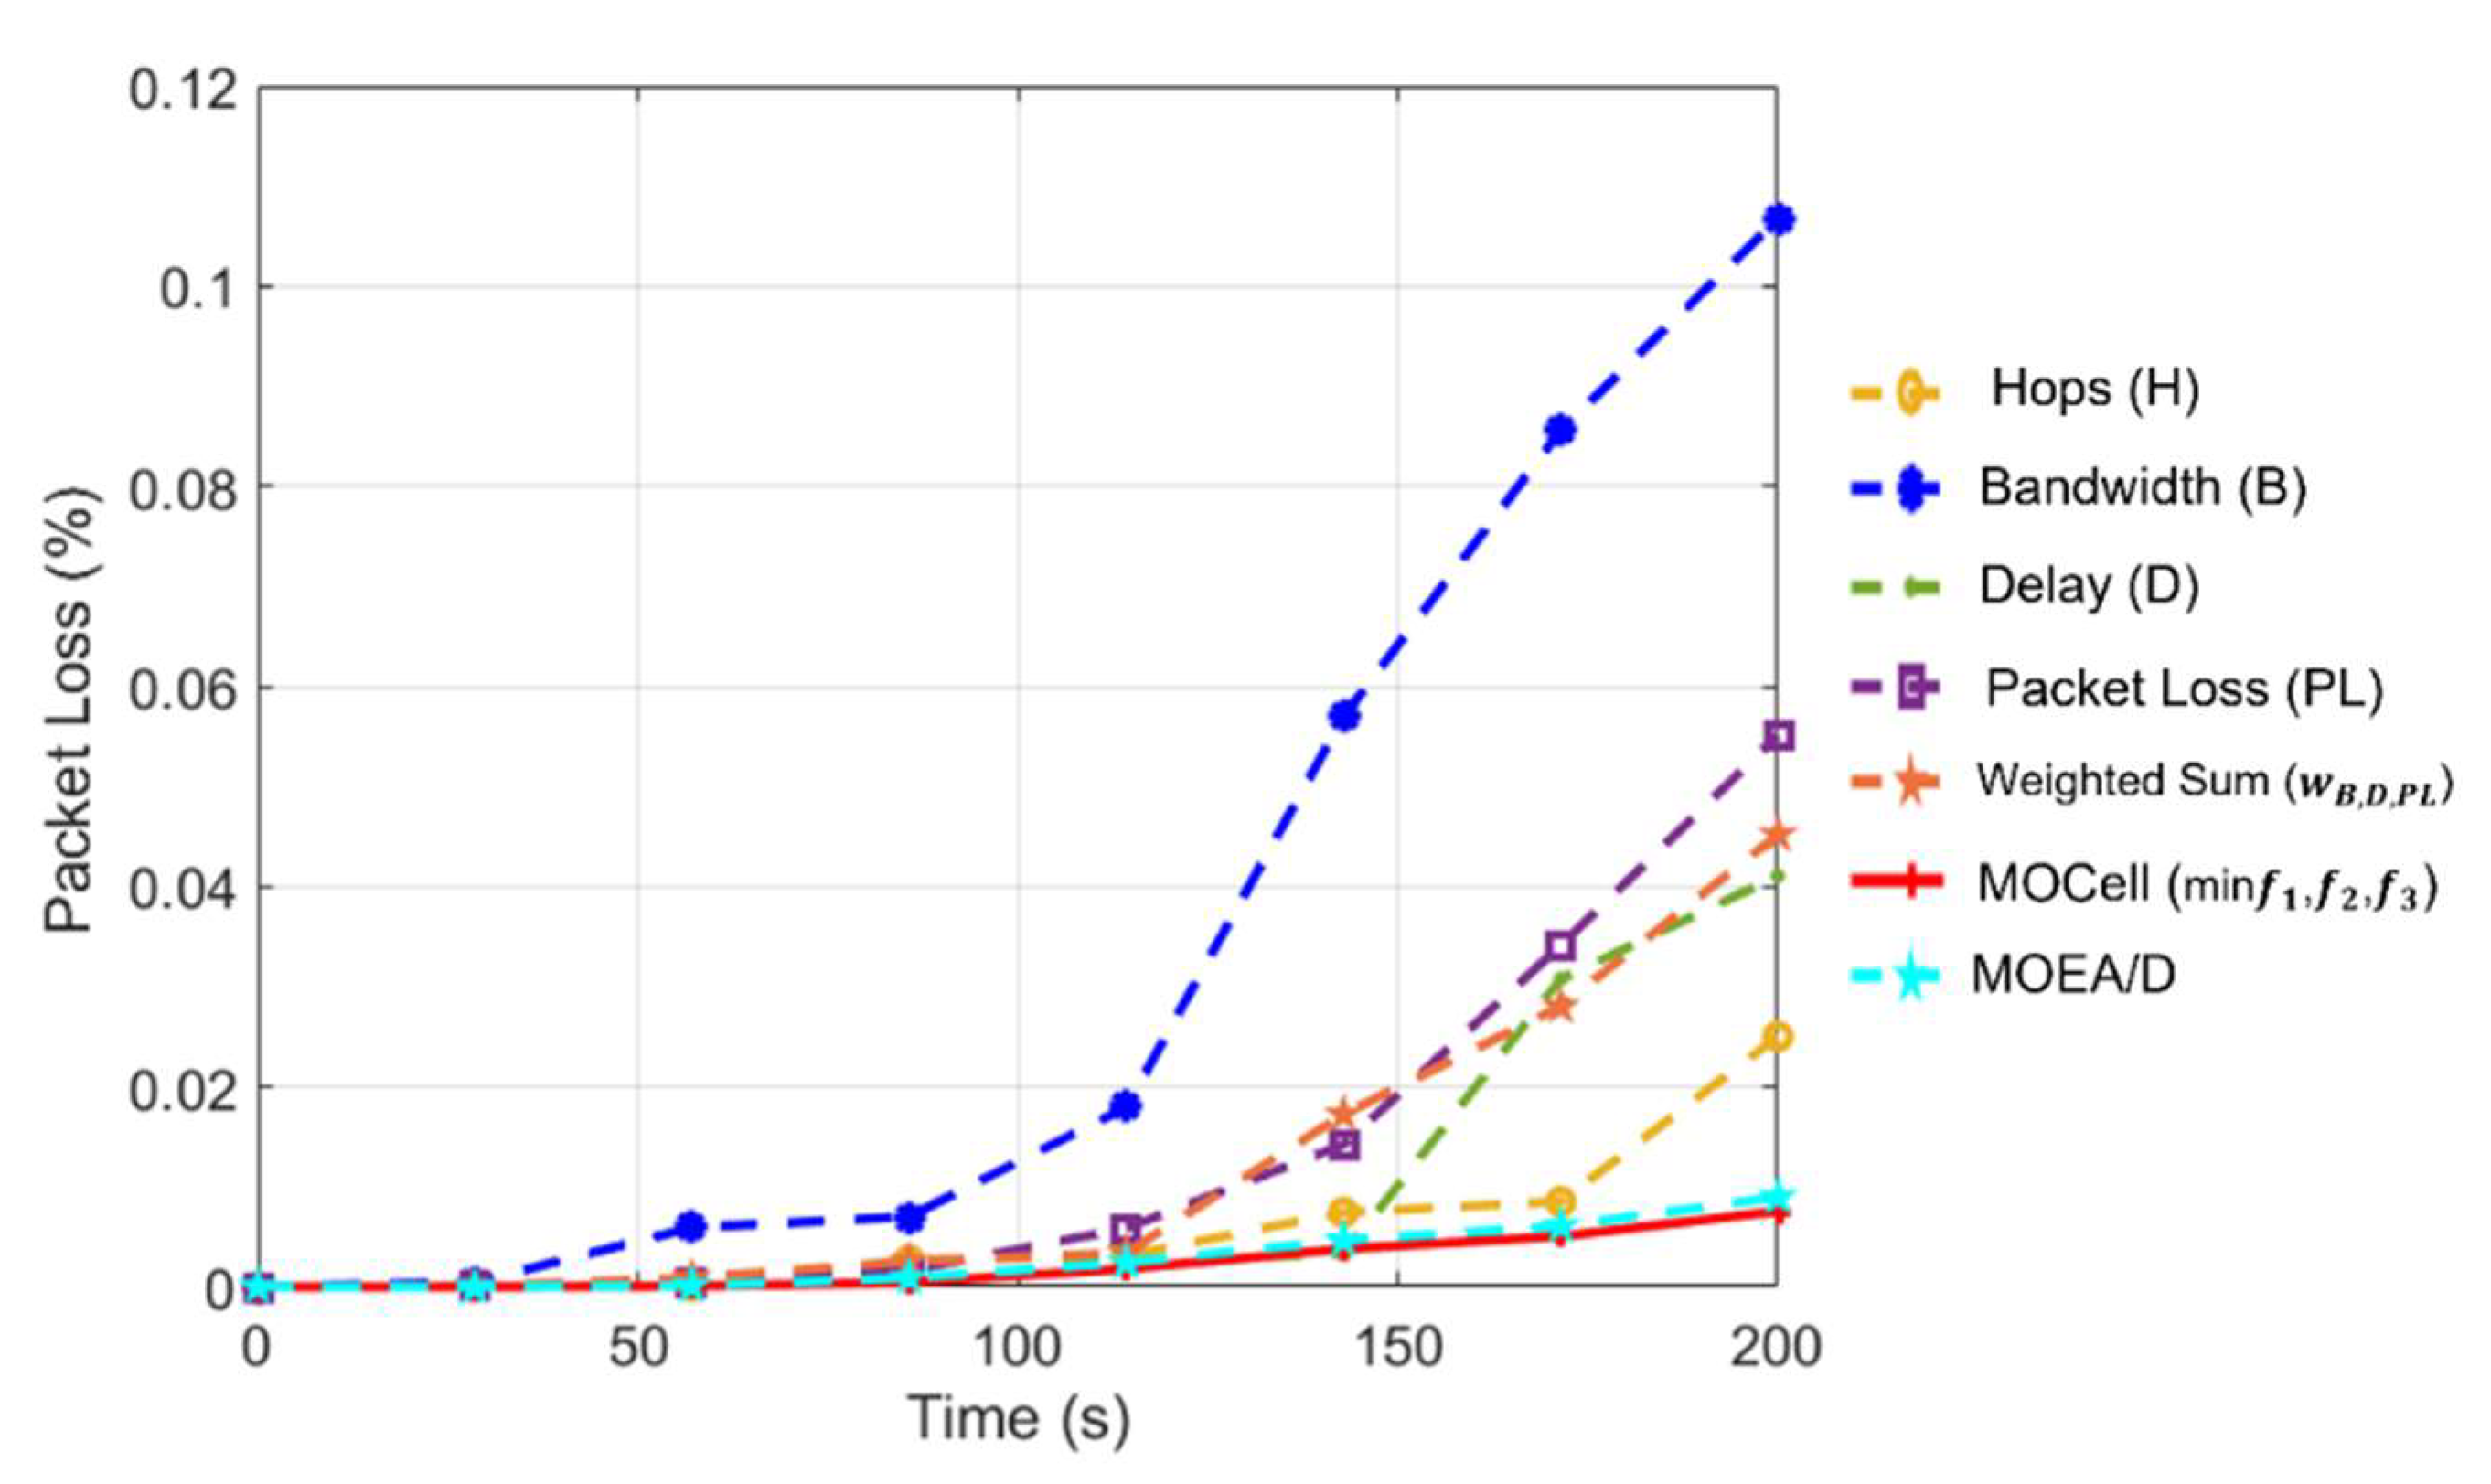
Table 4 shows that the capacities of the paths selected by each of the evaluated algorithms perfectly covered the required bandwidth per UDP flow; however, the performance of each path varied due to the other network parameters involved. Table 6 shows the average values for the performance of the paths, and Figure 12 presents a graph of the lost packets.
The most critical path is chosen by the widest path, B, although it has the highest bandwidth capacity to divert flows, followed by the path PL. However, this path consists of the links with the lowest losses. This severe drawback is a result of this path selecting connections with high jitter values. It should be remembered that a packet that takes longer than the time specified by the waiting window is usually considered to be a lost packet, as well as packets that arrive out of order.
The weighted sum method has the same effect. This method states that even if we consider different parameters for path selection, it is necessary to properly determine the weights of the metrics to obtain a balanced path. We can solve these optimization problems using evolutive algorithms, which provide a set of non-dominated paths and consider multiple metrics. The MOCell method reaches a throughput of 99.09%, which is only 0.07% better than MOEA/D and, compared with the other algorithms, 1.6% higher than path H , 3.2% higher than path D , 3.6% higher than path w B , D , P L , 4.6% higher than path P L , and 9.77% higher than path B . Link capacity is a necessary network parameter to guarantee QoS. However, this is not sufficient to provide adequate service in all cases. Therefore, it is advisable to never lose sight of the other parameters available in the network and to use more than one criterion in the routing process to improve the quality of service and enhance the quality of experience.

5. Conclusions and Future Work

This document provides an overview of the routing algorithms used in the SDN network controller, including their quantitative performance characteristics, such as the number of hops, available bandwidth, delay and packet loss, and their throughput, considering a large-scale multi-domain network topology. This work suggests that the proposal of a genetic algorithm in the routing process can significantly improve network performance. Minimizing the cost of network metrics and reducing the likelihood of selecting connections with few resources or poor link performance can significantly reduce data flow performance or, in the worst case scenario, cause congestion. The experiments in this work show that our proposal based on the MOCell algorithm provides optimal routing by having a global view of the network and abstracting its QoS metrics. The proposed MOCell method adapts to any routing constraint, while the standard algorithms in the controller do not consider any of these essential properties to improve the routing service.
Managing a centralized environment as in SDN can significantly enhance the routing process by improving path selection and providing better service. Evolutionary algorithms and their variants take advantage of this problem because they are scalable and can find reasonable solutions during the first run, which helps networks to meet QoS requirements and improves network performance.
In future work, we will consider optimizing the algorithm for different population sizes, as well as different crossover and mutation methods. Similarly, we will evaluate the performance of the MOCell algorithm in more detail compared with other evolutionary algorithms such as NSGA-II and MOEA/D, considering convergence time and diversity of solutions. In the evaluation of other evolutionary algorithms, both their convergence to the Pareto front and the dispersion of the set of found solutions are evaluated, while in this paper we focus exclusively on the selection of a path from the solutions found by the methods. Therefore, we consider it appropriate to use other metrics such as cardinality, accuracy, and diversity to evaluate the performance of evolutionary multi-objective algorithms.

Author Contributions

Conceptualization, J.E.G.-T., R.R.-R., A.T. and J.E.L.-R.; methodology, J.E.G.-T., A.T. and R.R.-R.; software, J.E.L.-R.; validation, R.R.-R. and A.G.-M.; formal analysis, A.T.; investigation, J.E.L.-R., A.T., R.R.-R. and J.E.L.-R.; resources, R.R.-R.; data curation, J.E.G.-T. and R.R.-R.; writing—original draft preparation, J.E.G.-T. and R.R.-R.; writing—review and editing, R.R.-R., J.E.L.-R. and S.V.-R.; visualization, J.E.L.-R.; supervision, R.R.-R., J.E.L.-R. and J.L.G.C.; project administration, R.R.-R.; funding acquisition, R.R.-R. All authors have read and agreed to the published version of the manuscript.

Funding

This research was funded by “CICESE Research Center” and “The Council for Science and Technology of Mexico” (CONACYT), No. CVU: 765196.

Institutional Review Board Statement

Not applicable.

Data Availability Statement

The data presented in this study are available on request from the corresponding author. The data are not publicly available due to the large size of the dataset required to maintain a public repository.

Conflicts of Interest

The authors declare no conflict of interest.

Appendix A

Table A1. Controller A link metrics in the simulation model. Metrics: delay (ms), packet loss (%), and bandwidth (Mbps).
Link (S)MetricsLink (S)MetricsLink (S) MetricsLink (S) Metrics
1,210,0,973,1316,0.003,826,153,0,8111,1822,0,80
1,35,0,944,613,0,887,143,0,7911,1923,0,76
1,48,0,994,87,0,977,152,0,8512,137,0,80
1,53,0,934,1016,0,908,l99,0,7812,2021,0.003,100
2,618,0.002,934,1218,0.001,968,1618,0.002,9612,2112,0,77
2,812,0,905,717,0,848,1712,0,8713,206,0,80
2,1024,0.001,985,99,0,929,167,0,7613,2121,0.001,79
2,128,0,915,1121,0.002,949,1714,0,8314,158,0,83
3,711,0,865,1315,0,9710,1111,0,8016,177,0,80
3,921,0.004,976,78,0,8210,1813,0,8318,196,0,80
3,119,0,956,1423,0,8610,199,0,8220,219,0,79
H1-H80,0,100
Table A2. Controller B link metrics in the simulation model. Metrics: delay (ms), packet loss (%), and bandwidth (Mbps).
Link (S)MetricsLink (S) MetricsLink (S)MetricsLink (S)Metrics
22,232,0,9425,298,0,9329,3518,0,8233,407,0,92
22,244,0,9625,3113,0.001,9129,3612,0,8734,395,0,83
22,252,0,9826,289,0,9230,355,0,9434,4012,0,95
22,2616,0,9926,3012,0.001,8930,361,0.001,8635,415,0.002,84
23,278,0.001,9126,3218,0,9430,373,0,9735,424,0,96
23,2915,0,9327,337,0.002,9331,364,0.001,9336,412,0,87
23,3112,0.001,9527,3412,0,8731,376,0,9636,427,0,93
24,282,0,9228,3311,0,8831,382,0,9937,436,0,92
24,l07,0.001,9428,346,0,9332,3720,0,9437,443,0,94
24,3212,0,9728,352,0,9732,385,0.001,8638,435,0,94
25,2712,0,9829,3415,0.002,9733,393,0.002,8238,443,0.001,95
H9-H140,0,100
Table A3. Controller C link metrics in the simulation model. Metrics: delay (ms), packet loss (%), and bandwidth (Mbps).
Link (R)MetricsLink (R)MetricsLink (R)MetricsLink (R)Metrics
1,22,0,8947,482,0,8946,602,0,9792,1063,0.001,93
1,152,0.001,8647,601,0,8546,613,0,86137,1523,0,86
1,161,0,9147,613,0,9392,1071,0,9838,1393,0,100
2,33,0,9747,621,0,8593,943,0,93138,1513,0,86
2,151,0,9748,492,0.001,9493,1061,0,100138,1524,0.001,85
2,162,0.001,9448,612,0,9993,1072,0.001,92138,1532,0,86
2,174,0.001,9148,623,0,9793,1082,0,96139,1404,0.001,90
3,41,0.001,9848,631,0,9794,951,0.001,97139,1523,0,91
3,164,0,8749,502,0,8994,1072,0,96139,1531,0,97
3,174,0,9549,621,0,9394,1082,0.001,94139,1541,0,97
3,183,0,8649,631,0.001,9694,1094,0,90140,1531,0,97
4,51,0.001,8549,642,0,8695,963,0,87140,1543,0,85
4,171,0,9150,511,0,9795,1082,0,96141,1422,0.001,87
4,181,0,8450,631,0,9495,1092,0,98141,1663,0,91
4,194,0.001,8750,642,0.001,9595,1101,0,95141,1563,0.001,71
5,64,0.001,8250,651,0,9596,971,0.001,93142,1432,0.001,86
5,182,0,8251,521,0,9896,1094,0,85142,1553,0,98
5,194,0,9051,643,0,10096,1104,0.001,93142,1562,0,91
5,203,0.001,9451,653,0.001,9196,1112,0,88142,1572,0,91
6,72,0,9951,661,0,8697,984,0,95143,1442,0,89
6,194,0,9552,534,0.001,8597,1103,0,87143,1563,0,95
6,202,0,9452,653,0,9697,1112,0,88143,1574,0.001,96
6,212,0,8352,661,0.001,9097,1123,0,100143,1584,0,90
7,83,0,9652,674,0,8598,1111,0,98144,1454,0,94
7.201,0,8653,544,0,9698,1121,0,91144,1573,0,89
7,214,0,9553,662,0,9699,1002,0.001,83144,1584,0,85
7,222,0,8853,672,0.001,9699,1131,0,99144,1593,0,93
8,92,0.001,8953,681,0,8999,1143,0,76145,1464,0.001,96
8,212,0,9654,554,0.001,85100,1013,0,96145,1581,0,96
8,221,0,8454,671,0,93100,1132,0,87145,1593,0,98
8,233,0,8454,684,0,95100,1143,0,100145,1604,0,89
9,101,0,8354,693,0,85100,1153,0,85146,1471,0.001,96
9,223,0,8755,563,0.001,100101,1022,0.001,86146,1591,0,95
9,234,0,9555,682,0,92101,1141,0,99146,1601,0,100
9,244,0.001,8555,694,0.001,86101,1152,0,94146,1613,0,92
10,113,0.001,8855,701,0,91101,1161,0,92147,1483,0.001,96
10,231,0,9356,693,0.001,87102,1031,0.001,90147,1603,0,85
10,244,0,8056,703,0,85102,1151,0,89147,1611,0,100
10,251,0.001,8057,583,0,88102,1163,0,92147,1623,0,100
11,124,0.001,8857,712,0,78102,1173,0,100148,1493,0,94
11,243,0,8857,721,0,80103,1043,0,91148,1613,0,97
11,252,0,8658,593,0,94103,1163,0.001,97148,1622,0,92
11,261,0.001,9058,712,0,87103,1173,0,90148,1633,0,91
12,132,0,8958,723,0,88103,1182,0,96149,1501,0.001,96
12,253,0,8158,734,0,97104,1053,0.001,87149,1622,0,87
12,262,0,9659,601,0.001,87104,1171,0,92149,1631,0.001,90
12,273,0.001,9559,723,0,96104,1184,0,90149,1641,0,97
13,144,0.001,9159,731,0.001,95104,1192,0,91150,1511,0.001,100
13,261,0,8159,741,0,90105,1064,0,89150,1632,0,95
13,271,0,8260,612,0,86105,1182,0,97150,1641,0,87
13,281,0,9860,734,0,93105,1193,0,100150,1652,0,89
14,273,0,8660,743,0.001,93105,1202,0,91151,1521,0.001,91
14,282,0.001,8860,751,0,85106,1071,0.001,94151,1641,0,91
15,162,0.001,8661,624,0,96106,1192,0,98151,1654,0.001,99
15,293,0,8961,741,0,92106,1201,0,94151,1664,0,95
15,302,0.001,7261,752,0,88106,1213,0,92152,1531,0.001,92
16,174,0.001,9361,763,0,91107,1084,0,95152,1654,0,95
16,292,0,8662,631,0.001,97107,1202,0,90152,1663,0,93
16,304,0,9262,751,0,91107,1214,0,100152,1674,0,100
16,313,0,9362,762,0,92107,1223,0,94153,1541,0.001,92
17,183,0.001,9162,771,0,89108,1094,0,99153,1662,0,93
17,304,0,9163,643,0,98108,1211,0,95153,1673,0.001,94
17,314,0,9263,764,0,97108,1222,0.001,85153,1682,0,93
17,322,0,9463,773,0,100108,1232,0,90154,1674,0,98
18,192,0,9563,784,0,97109,1101,0.001,100154,1684,0,100
18,314,0,8664,652,0.001,86109,1221,0,100155,1562,0,72
18,323,0.001,9064,773,0,99109,1233,0,90155,1691,0,98
18,334,0,9064,784,0,87109,1244,0,85155,1701,0,70
19,201,0,9864,793,0,91110,1112,0.001,98156,1572,0.001,86
19,323,0,9665,663,0.001,93110,1232,0,96156,1693,0,98
19,334,0.001,8965,784,0,90110,1244,0,95156,1702,0,95
19,342,0,10065,793,0.001,97110,1253,0,91156,1713,0,100
20,212,0.001,8665,804,0,92111,1121,0,91157,1584,0,94
20,332,0,9766,673,0.001,87111,1244,0,94157,1702,0,88
20,344,0.001,9866,791,0,99111,1253,0,89157,1713,0.001,94
20,354,0,9366,804,0,88111,1262,0,89157,1724,0,91
21,224,0.001,9766,811,0,100112,1254,0.001,88158,1594,0.001,99
21,344,0,9367,682,0.001,92112,1263,0,88158,1712,0,95
21,353,0.001,9567,802,0,86113,1141,0.001,81158,1722,0,86
21,363,0,9767,813,0,89113,1271,0,81158,1732,0,94
22,231,0,9067,824,0,93113,1283,0.001,87159,1604,0,88
22,354,0,9268,694,0.001,91114,1153,0,95159,1722,0,99
22,363,0.001,10068,814,0,87114,1274,0,86159,1731,0,94
22,374,0,100,8768,823,0.001,100114,1283,0.001,98159,1742,0,91
23,244,0,8668,834,0,99114,1291,0,98160,1612,0.001,98
23,363,0,9969,702,0.001,88115,1163,0.001,92160,1732,0,93
23,373,0,8969,822,0,100115,1284,0,92160,1744,0,95
23,382,0,10069,832,0.001,92115,1292,0.001,85160,1754,0,92
24,253,0,10069,842,0,94115,1301,0,95161,1623,0,95
24,371,0,9570,851,0.001,94116,1174,0,92161,1741,0,96
24,383,0.001,9870,842,0,96116,1292,0,94161,1754,0,88
24,392,0,8671,722,0,70116,1303,0,91161,1763,0,86
25,263,0,9871,852,0,74116,1311,0,95162,1634,0.001,99
25,382,0,9571,863,0.001,95117,1181,0,89162,1753,0,94
25,394,0.001,9672,733,0,98117,1301,0,92162,1763,0.001,85
25,404,0,9172,851,0,96117,1313,0,90162,1771,0,94
26,274,0.001,10072,862,0,93117,1323,0,90163,1643,0,98
26,373,0,9072,873,0,94118,1194,0,87163,1764,0,88
26,404,0,9073,742,0.001,94118,1312,0,94163,1772,0.001,97
26,44,0,9173,861,0,98118,1323,0,96163,1783,0,92
27,283,0.001,9773,872,0,86118,1331,0,94164,1653,0.001,97
27,203,0,9673,883,0,92119,1202,0.001,90164,1771,0,91
27,414,0.001,9974,751,0,100119,1322,0,86164,1781,0.001,99
27,422,0,9174,873,0,86119,1334,0.001,87164,1791,0,95
28,414,0.001,9774,884,0.001,88119,1341,0,88165,1661,0,90
28,421,0,9674,894,0,97120,1214,0.001,91165,1781,0,91
29,303,0,9675,763,0,94120,1333,0,93165,1794,0,97
29,431,0,8475,884,0,95120,1344,0,91165,1803,0,87
29,442,0.001,8175,892,0,91120,1351,0.001,89166,1671,0,89
30,313,0,9075,903,0,90121,1223,0,89166,1791,0,85
30,432,0,8876,771,0.001,91121,1341,0,87166,1802,0,87
30,444,0.001,9976,893,0,98121,1354,0,88166,1813,0,91
30,451,0,8576,904,0.001,92121,1364,0,100167,1683,0,88
31,322,0,9176,914,0,94122,1233,0,86167,1804,0,95
31,442,0,9577,784,0,97122,1352,0,88167,1814,0.001,85
31,451,0,9577,902,0,92122,1363,0,91167,1824,0,94
31,461,0,8977,911,0.001,85122,1371,0.001,91168,1813,0.001,88
32,334,0,8577,924,0,99123,1242,0,98168,1823,0,93
32,451,0,8878,793,0.001,96123,1364,0,92169,1701,0.001,87
32,461,0,9478,912,0,89123,1373,0.001,99169,1832,0,99
32,472,0,9778,921,0.001,98132,1383,0,88169,1842,0,70
33,343,0.001,8978,931,0,99124,1252,0.001,98170,1711,0.001,94
33,461,0,9379,803,0,97124,1373,0,100170,1834,0,96
33,471,0.001,9879,921,0,89124,1384,0.001,85170,1843,0,100
33,483,0,8979,933,0,88124,1391,0,100170,1851,0,86
34,352,0.001,8979,942,0,85125,1261,0,97171,1724,0,97
34,474,0,9080,814,0,94125,1382,0,100171,1841,0,93
34,484,0,8680,934,0,100125,1394,0.001,94171,1851,0.001,99
34,491,0,9780,941,0.001,85125,1404,89,89171,1861,0,96
35,364,0,8680,954,0,98126,1391,94,84172,1731,0.001,94
35,481,0,8981,824,0,85126,1401,95,85172,1853,0.001,91
35,493,0.001,9581,942,0,93127,1283,0.001,91172,1861,0,97
35,501,0,8581,954,0.001,100127,1411,0,76172,1871,0.001,100
36,373,0,8881,962,0,93127,1422,0,85173,1742,0,92
36,491,0,9982,832,0,99128,1293,0.001,91173,1863,0.001,99
36,504,0,9682,952,0,93128,1414,0,96173,1872,0,89
36,514,0,8882,962,0.001,97128,1422,0.001,96173,1881,0,98
37,382,0.001,10082,971,0,86128,1433,0,98174,1752,0.001,99
37,504,0,9083,844,0,99129,1303,0.001,89174,1872,0.001,99
37,511,0,9083,961,0,85129,1424,0,99174,1884,0,90
37,522,0,9283,973,0,91129,1433,0.001,98174,1894,0,97
38,392,0.001,8983,983,0,97129,1444,0,85175,1764,0.001,97
28,512,0,9784,971,0.001,88130,131,2,0.001,86175,1884,0,95
38,524,0,9084,984,0,85130,1433,0,91175,1894,0,92
38,531,0,9785,861,0,90130,1443,0.001,91175,1902,0.001,95
39,403,0,9585,991,0,95130,1451,0,90176,1771,0.001,85
39,521,0,9485,1002,0.001,91131,1324,0.001,95176,1891,0.001,87
39,534,0.001,9086,872,0,92131,1441,0,88176,1901,0,86
39,541,0,8786,992,0,93131,1454,0.001,94176,1912,0,85
40,413,0.001,10086,1003,0.001,98131,1462,0,100177,1784,0,90
40,532,0,9886,1014,0,98132,1333,0.001,99177,1901,0.001,100
40,541,0,8987,882,0.001,94132,1452,0,86177,1913,0,93
40,554,0,8787,1001,0,93132,1462,0,96177,1921,0.001,94
41,424,0,9187,1014,0.001,93132,1471,0,84178,1793,0.001,94
41,544,0,9287,1021,0,87133,1343,0,98178,1911,0.001,85
41,554,0.001,8988,891,0,97133,1464,0,88178,1924,0,100
41,561,0,9888,1014,0,921331471,0,91178,1932,0,97
42,551,0,9688,1021,0.001,100133,1482,0,85178,1802,0,91
42,561,0,9888,1034,0,88134,1353,0,89179,1922,0.001,86
43,443,0,8789,904,0,96134,1473,0,93179,1931,0,98
43,571,0,8689,1021,0,86134,1481,0.001,95179,1941,0.001,86
43,581,0,7489,1032,0,91134,1493,0,88180,1811,0.001,97
44,453,0.001,9189,1042,0,99135,1362,0,86180,1931,0.001,98
44,572,0,8690,912,0,89135,1481,0,91180,1943,0,87
44,584,0,9390,1034,0,99135,1492,0,87180,1951,0.001,96
44,593,0,9390,1042,0,94135,1502,0,98181,1822,0,86
45,464,0.001,10090,1053,0,90136,1374,0.001,91181,1942,0.001,94
45,581,0,8891,921,0,96136,1491,0,88181,1953,0,85
45,592,0,8291,1042,0,95136,1503,0.001,98181,1961,0,99
45,602,0,9891,1052,0,95136,1513,0,99182,1951,0.001,96
46,474,0,8791,1062,0,94137,1384,0,82182,1961,0,85
46,594,0,10092,931,0.001,8992,1054,0,91195,1961,0,92

References

  1. Xu, Y.; Gui, G.; Gacanin, H.; Adachi, F. A Survey on Resource Allocation for 5G Heterogeneous Networks: Current Research, Future Trends, and Challenges. IEEE Commun. Surv. Tutor. 2021, 23, 668–695. [Google Scholar] [CrossRef]
  2. García-Tadeo, D.A.; Peram, D.R.; Kumar, K.S.; Vives, L.; Sharma, T.; Manoharan, G. Comparing the impact of Internet of Things and cloud computing on organisational behavior: A survey. Mater. Today Proc. 2022, 51, 2281–2285. [Google Scholar] [CrossRef]
  3. Laghari, A.A.; Wu, K.; Laghari, R.A.; Ali, M.; Khan, A.A. A Review and State of Art of Internet of Things (IoT). Arch. Comput. Methods Eng. 2022, 29, 1–19. [Google Scholar] [CrossRef]
  4. Hajjaji, Y.; Boulila, W.; Farah, I.R.; Romdhani, I.; Hussain, A. Big data and IoT-based applications in smart environments: A systematic review. Comput. Sci. Rev. 2021, 39, 100318. [Google Scholar] [CrossRef]
  5. Pavithra, H.; Srinivasan, G.N.; Swarnalatha, K.S. A Survey on Role of SDN in Implementing QoS in Routing in the Network. Lect. Notes Electr. Eng. 2022, 789, 361–366. [Google Scholar] [CrossRef]
  6. Manguri, K.H.; Omer, S.M. SDN for IoT Environment: A Survey and Research Challenges. ITM Web Conf. 2022, 42, 01005. [Google Scholar] [CrossRef]
  7. Amin, R.; Rojas, E.; Aqdus, A.; Ramzan, S.; Casillas-Perez, D.; Arco, J.M. A Survey on Machine Learning Techniques for Routing Optimization in SDN. IEEE Access 2021, 9, 104582–104611. [Google Scholar] [CrossRef]
  8. Alsaeedi, M.; Mohamad, M.M.; Al-Roubaiey, A.A. Toward Adaptive and Scalable OpenFlow-SDN Flow Control: A Survey. IEEE Access 2019, 7, 107346–107379. [Google Scholar] [CrossRef]
  9. Rudra, B.; Thanmayee, S. Architecture and Deployment Models-SDN Protocols, APIs, and Layers, Applications and Implementations. In Software Defined Internet of Everything; Springer: Cham, Switzerland, 2022; pp. 63–77. [Google Scholar] [CrossRef]
  10. Akin, E.; Korkmaz, T. Comparison of Routing Algorithms with Static and Dynamic Link Cost in Software Defined Networking (SDN). IEEE Access 2019, 7, 148629–148644. [Google Scholar] [CrossRef]
  11. Yang, S.; Tan, C.; Madsen, D.Ø.; Xiang, H.; Li, Y.; Khan, I.; Choi, B.J. Comparative Analysis of Routing Schemes Based on Machine Learning. Mob. Inf. Syst. 2022, 2022, 1–18. [Google Scholar] [CrossRef]
  12. Khadir, K.; Guermouche, N.; Guittoum, A.; Monteil, T. A Genetic Algorithm-Based Approach for Fluctuating QoS Aware Selection of IoT Services. IEEE Access 2022, 10, 17946–17965. [Google Scholar] [CrossRef]
  13. Cui, L.S.; Srivastava, G. QoS Routing Algorithm for OBS Networks Based on a Multi-Objective Genetic Algorithm. IEEE Access 2022, 10, 12047–12056. [Google Scholar] [CrossRef]
  14. Unger, T. Genetic Algorithms: A Survey of some Mathematical Models-Part I. Ir. Math. Soc. Bull. 2021, 0041, 57–71. [Google Scholar] [CrossRef]
  15. Zhang, D.; Shou, Y.; Xu, J. A mapreduce-based approach for shortest path problem in road networks. J. Ambient. Intell. Humaniz. Computing 2018, 41, 1–9. [Google Scholar] [CrossRef]
  16. Pradhan, D.; Wang, S.; Ali, S.; Yue, T.; Liaaen, M. CBGA-ES+: A Cluster-Based Genetic Algorithm with Non-Dominated Elitist Selection for Supporting Multi-Objective Test Optimization. IEEE Trans. Softw. Eng. 2021, 47, 86–107. [Google Scholar] [CrossRef]
  17. Egilmez, H.E.; Dane, S.T.; Bagci, K.T.; Tekalp, A.M. OpenQoS: An OpenFlow Controller Design for Multimedia Delivery with End-to-End Quality of Service over Software-Defined Networks. In Proceedings of the 2012 Asia Pacific Signal and Information Processing Association Annual Summit and Conference, Hollywood, CA, USA, 3–6 December 2012; pp. 1–8. [Google Scholar]
  18. Tajiki, M.M.; Akbari, B.; Shojafar, M.; Ghasemi, S.H.; Barazandeh, M.L.; Mokari, N.; Chiaraviglio, L.; Zink, M. CECT: Computationally efficient congestion-avoidance and traffic engineering in software-defined cloud data centers. Clust. Comput. 2018, 21, 1881–1897. [Google Scholar] [CrossRef] [Green Version]
  19. Son, J.; Buyya, R. Priority-Aware VM Allocation and Network Bandwidth Provisioning in Software-Defined Networking (SDN)-Enabled Clouds. IEEE Trans. Sustain. Comput. 2019, 4, 17–28. [Google Scholar] [CrossRef]
  20. Shah, S.A.R.; Noh, S.Y. A dynamic programmable network for large-scale scientific data transfer using AmoebaNet. Appl. Sci. 2019, 9, 4541. [Google Scholar] [CrossRef] [Green Version]
  21. Bastam, M.; Sabaei, M.; Yousefpour, R. A scalable traffic engineering technique in an SDN-based data center network. Trans. Emerg. Telecommun. Technol. 2018, 29, e3268. [Google Scholar] [CrossRef]
  22. Ejaz, S.; Iqbal, Z.; Shah, P.A.; Bukhari, B.H.; Ali, A.; Aadil, F. Traffic Load Balancing Using Software Defined Networking (SDN) Controller as Virtualized Network Function. IEEE Access 2019, 7, 46646–46658. [Google Scholar] [CrossRef]
  23. Joshi, K.D.; Kataoka, K. PRIME-Q: Privacy Aware End-To-End QoS Framework in Multi-Domain SDN. In Proceedings of the 2019 IEEE Conference on Network Softwarization (NetSoft), Paris, France, 24–28 June 2019; pp. 169–177. [Google Scholar] [CrossRef]
  24. Lozano-Rizk, J.E.; Nieto-Hipolito, J.I.; Rivera-Rodriguez, R.; Cosio-Leon, M.A.; Vazquez-Briseño, M.; Chimal-Eguia, J.C. QOSCOMM: A data flow allocation strategy among sdn-based data centers for iot big data analytics. Appl. Sci. 2020, 10, 7586. [Google Scholar] [CrossRef]
  25. Li, D.; Wang, X.; Jin, Y.; Liu, H. Research on QoS routing method based on NSGAII in SDN. J. Phys. Conf. Ser. 2020, 1656, 012027. [Google Scholar] [CrossRef]
  26. Elbasheer, M.O.; Aldegheishem, A.; Alrajeh, N.; Lloret, J. Video Streaming Adaptive QoS Routing with Resource Reservation (VQoSRR) Model for SDN Networks. Electronics 2022, 11, 1252. [Google Scholar] [CrossRef]
  27. Lee, G.; Lee, C.; Roh, B. QoS Support Path Selection for Inter-Domain Flows Using Effective Delay and Directed Acyclic Graph in Multi-Domain SDN. Electronics 2022, 11, 2245. [Google Scholar] [CrossRef]
  28. Li, C.; Liu, Y.; Xiao, J.; Zhou, J. MCEAACO-QSRP: A Novel QoS-Secure Routing Protocol for Industrial Internet of Things. IEEE Internet Things J. 2022, 9, 18760–18777. [Google Scholar] [CrossRef]
  29. Guck, J.W.; van Bemten, A.; Reisslein, M.; Kellerer, W. Unicast QoS Routing Algorithms for SDN: A Comprehensive Survey and Performance Evaluation. IEEE Commun. Surv. Tutor. 2018, 20, 388–415. [Google Scholar] [CrossRef]
  30. Amalarethinam, D.I.G.; Mercy, P. An analysis on quality of service (Qos) based routing in internet of things (IOT). Int. J. Adv. Sci. Technol. 2020, 29, 139–163. [Google Scholar]
  31. Naing, M.T.; Khaing, T.T.; Maw, A.H. Evaluation of TCP and UDP Traffic over Software-Defined Networking. In Proceedings of the 2019 International Conference on Advanced Information Technologies (ICAIT), Yangon, Myanmar, 6–7 November 2019. [Google Scholar] [CrossRef]
  32. Ray, P.P. A survey on cognitive packet networks: Taxonomy, state-of-the-art, recurrent neural networks, and QoS metrics. J. King Saud Univ. Comput. Inf. Sci. 2022, 34, 5663–5683. [Google Scholar] [CrossRef]
  33. Medhi, D.; Ramasamy, K. Network Flow Models. In Network Routing, 2nd ed.; Elsevier: Amsterdam, The Netherlands, 2018; pp. 114–157. [Google Scholar] [CrossRef]
  34. Peña, D.; Tchernykh, A.; Nesmachnow, S.; Massobrio, R.; Feoktistov, A.; Bychkov, I.; Radchenko, G.; Drozdov, A.Y.; Garichev, S.N. Operating cost and quality of service optimization for multi-vehicle-type timetabling for urban bus systems. J. Parallel Distrib. Comput. 2019, 133, 272–285. [Google Scholar] [CrossRef]
  35. Li, H.; Zhang, L. An efficient solution strategy for bilevel multiobjective optimization problems using multiobjective evolutionary algorithm. Soft Comput. 2021, 25, 8241–8261. [Google Scholar] [CrossRef]
  36. Hua, Y.; Liu, Q.; Hao, K.; Jin, Y. A Survey of Evolutionary Algorithms for Multi-Objective Optimization Problems with Irregular Pareto Fronts. IEEE/CAA J. Autom. Sin. 2021, 8, 303–318. [Google Scholar] [CrossRef]
  37. Nebro, A.J.; Durillo, J.J.; Luna, F.; Dorronsoro, B.; Alba, E. MOCell: A cellular genetic algorithm for multiobjective optimization. Int. J. Intell. Syst. 2009, 24, 726–746. [Google Scholar] [CrossRef] [Green Version]
  38. Deb, K.; Pratap, A.; Agarwal, S.; Meyarivan, T. A fast and elitist multiobjective genetic algorithm: NSGA-II. IEEE Trans. Evol. Comput. 2002, 6, 182–197. [Google Scholar] [CrossRef] [Green Version]
  39. Tian, Y.; Si, L.; Zhang, X.; Cheng, R.; He, C.; Tan, K.C.; Jin, Y. Evolutionary Large-Scale Multi-Objective Optimization: A Survey. ACM Comput. Surv. 2022, 54, 1–34. [Google Scholar] [CrossRef]
  40. AEiben, E.; Smith, J.E. Natural Computing Series Introduction to Evolutionary Computing; Springer: Berlin/Heidelberg, Germany, 2015. [Google Scholar]
  41. Harrison, K.R.; Garanovich, I.L.; Weir, T.; Boswell, S.G.; Elsayed, S.M.; Sarker, R.A. Evolutionary and Memetic Computing for Project Portfolio Selection and Scheduling: An Introduction. In Adaptation, Learning, and Optimization; Springer: Cham, Switzerland, 2022; Volume 26. [Google Scholar] [CrossRef]
  42. Lavinas, Y.; Aranha, C.; Ochoa, G. Search Trajectories Networks of Multiobjective Evolutionary Algorithms. In International Conference on the Applications of Evolutionary Computation, Madrid, Spain, 20–22 April 2022; Springer: Cham, Switzerland, 2022; pp. 223–238. [Google Scholar] [CrossRef]
  43. Zhang, Q.; Li, H. MOEA/D: A multiobjective evolutionary algorithm based on decomposition. IEEE Trans. Evol. Comput. 2007, 11, 712–731. [Google Scholar] [CrossRef]
  44. Kumar, V.; Jangir, S.; Patanvariya, D.G. Traffic Load Balancing in SDN Using Round-Robin and Dijkstra Based Methodology. In Proceedings of the 2022 International Conference for Advancement in Technology (ICONAT), Goa, India, 21–22 January 2022. [Google Scholar] [CrossRef]
  45. Tanner, N.H. Wireshark. In Cybersecurity Blue Team Toolkit; John Wiley & Sons: New York, NY, USA, 2019. [Google Scholar] [CrossRef]
  46. Ergene, Ö.; Özdemir, A.Ş. Understanding the definite integral with the help of Riemann sums. Particip. Educ. Res. 2021, 9, 445–465. [Google Scholar] [CrossRef]
Figure 1. Traditional routing. Metrics: delay (ms), packet loss (%), and bandwidth (Mbps).
Applsci 12 11590 g001
Figure 2. Routing architecture for SDN.
Applsci 12 11590 g002
Figure 3. MOCell algorithm.
Applsci 12 11590 g003
Figure 4. Example topology. Metrics: delay (ms), packet loss rate (%), and bandwidth (Mbps).
Applsci 12 11590 g004
Figure 5. Genetic operators.
Applsci 12 11590 g005
Figure 6. Experimental topology.
Applsci 12 11590 g006
Figure 7. Set of non-dominated solutions obtained by the multi-objective cellular genetic algorithm MOCell. (a) Domain A, (b) Domain B, and (c) Domain C.
Applsci 12 11590 g007
Figure 8. Evaluation of the path capacity using TCP traffic. The paths were selected according to the following methods: (a) H (hops), (b) B (bandwidth), (c) D (delay), and (d) P L (packet loss).
Applsci 12 11590 g008
Figure 9. Evaluation of the path capacity using TCP traffic. The paths were selected according to the following multi-objective methods: (a) w B , D , P L (weighted sum), (b) M i n f 1 , f 2 , f 3 (MOCell), and (c) MOEA/D.
Applsci 12 11590 g009
Figure 10. TCP throughput ( t h ) comparison of routing paths.
Applsci 12 11590 g010
Figure 11. TCP performance of paths. Time interval 200 s. STDEV: H = 0.01847, B = 0.04224, D = 0.02953, P L = 0.09682, w B , D , P L = 0.13832, M i n f 1 , f 2 ,   f 3 = 0.03777, and MOEA/D = 0.04104.
Applsci 12 11590 g011
Figure 12. UDP packet loss, STDEV: H = 0.00834, B = 0.03683, D = 0.01754, P L = 0.01709, w B , D , P L = 0.01343, M i n f 1 , f 2 , f 3 = 0.00258, and MOEA/D = 0.0021.
Applsci 12 11590 g012
Table 1. Comparison of QoS routing methods.
ReferenceNetwork ParametersPath SelectionDomain
[17]Bandwidth, Delay, JitterMin delay and bandwidth as constraintsSingle
[18]BandwidthMin bandwidthSingle
[19]BandwidthMax bandwidthInter-domain
[20]BandwidthMax bandwidthSingle
[21]BandwidthMax bandwidthSingle
[22]Bandwidth, Delay, JitterMax bandwidth and delay as constraintsSingle
[23]Bandwidth, Delay(1) Max bandwidth, (2) min delay, and (3) max bandwidth and delay as constraintsInter-domain
[24]Bandwidth, Delay, Jitter, Packet LossApplication requirements as constraintInter-domain
[25]Bandwidth, Delay, Jitter, Packet LossApplication requirements as constraintSingle
[26]BandwidthBandwidth as constraintSingle
[27]BandwidthBandwidth as constraintInter-domain
[28]Delay, Security, Power ConsumptionApplication requirements as constraintSingle
[13]Bandwidth, Delay, Packet LossMin delay and application requirements as constraintsSingle
MOCell RoutingBandwidth, Delay, Packet LossMin (bandwidth, delay, and packet loss)Inter-domain
Table 2. Description of the network parameters used.
VariableDescription
G (V,E)Represents communication network topology.
V Sets all nodes in the network.
E Sets all links between nodes.
n = | V | Number of nodes.
m = | E | Number of edges in the network.
λ e The available bandwidth on a link.
μ e The delay on a link.
ρ e The packet loss on a link.
s Source node.
d Destination node.
P Path from a source node to a destination node.
h ( P ) Computes the number of links for a path.
λ ( P ) Computes the minimum available bandwidth link on a path.
μ ( P )   Computes the total path delay.
  ρ ( P ) Computes the percentage of packets lost concerning the number of packages sent.
Table 3. Example topology adjacencies matrix for coding representation. The path source: H1 and destination: R1. The hops of H1-R1 are highlighted.
Chromosome58214106739
NodesR1R2R3R4R5R6R7H1H2H3
R11100000000
R21011000000
R31100011000
R40100100100
R50101000000
R60010001010
R70010010001
H10001000000
H20000010000
H30000001000
Table 4. Results of routing paths and network parameters.
MetricPathH
(Hops)
B
(Mbps)
D
(ms)
PL
(0–1)
Data Rate (Mbps)
H H1-S14-S6-S2-S1-R1-R16-R31-R46-R61-R76-R91-R106-R121-R136-R151-R166-R181-R196-S22-S26-S32-S38-S44-H142478130 5.5   ×   10 3 23.8
B H1-S14-S6-S2-S1-R1-R16-R31-R45-R46-R59-R72-R73-R86-R101-R114-R129-R142-R155-R169-R156-R171-R172-R187-R174-R161-R147-R162-R163-R164-R178-R193-R180-R181-R196-S22-S24-S32-S37-R31-R38-S44-H144286166 3.7   ×   10 3 38
D H1-S14-S7-S3-S1-R1-R16-R31-R46-R33-R47-R62-R77-R91-R106-R120-R135-R150-R164-R179-R180-R195-R196-S22-S24-S30-S37-S44-H14287958 2.6   ×   10 3 53.5
P L H1-S14-S7-S5-S1-R1-R2-R3-R17-R30-R43-R58-57-R72-R85-R99-R114-R129-R144-R145-R160-R174-R189-R190-R191-R192-R193-R194-R195-R196-S22-S26-S32-S37-S44-H143574138063.1
w B , D , P L H1-S14-S7-S5-S1-R1-R2-R17-R32-R47-R48-R62-R77-R90-R104-R103-R116-R131-R146-R147-R162-R177-R192-R193-R194-R195-R196-S22-S24-S28-S35-S30-S37-S44-H14347985 3   ×   10 3 64.4
MOCell ( M i n f 1 , f 2 , f 3 ) H1-S14-S7-S5-S1-R1-R15-R29-R43-R57-R72-R86-R85-R100-R115-R130-R117-R118-R133-R148-R149-R164-R179-R194-R195-R196-S22-S24-S28-S35-S30-S37-S44-H14337975 2   ×   10 3 66.9
MOEA/D H1-S14-S7-S5-S1-R1-R2-R3-R18-R33-R48-R63-R98-R92-R107-R121-R134-R149-R164-R178-R193-R194-R195-R196-S22-S24-S28-S35-S30-S37-S44-H14317980 2   ×   10 3 66.37
Table 5. Routing Paths Throughput Areas.
AlgorithmMedian Area
H   (Hops) 0.1511
B   (Bandwidth) 0.3622
D   (Delay) 0.5924
P L (Packet Loss) 0.4825
w B , D , P L (Weighted sum) 0.5872
M i n f 1 , f 2 , f 3 (MOCell) 0.7174
MOEA/D 0.7046
Table 6. Performance summary of UDP flow between H1 and H14.
AlgorithmData Rate (Mbps)Jitter (ms)Packet Loss (%)Throughput
H 43.831.0810.0250.9749
B 40.561.9580.10670.8932
D 43.100.9520.04100.9589
P L 42.581.710.05500.9449
w B , D , P L 43.61.3250.45190.9548
M i n f 1 , f 2 , f 3 44.560.9860.00900.9909
MOEA/D44.480.9940.00970.9902
Publisher’s Note: MDPI stays neutral with regard to jurisdictional claims in published maps and institutional affiliations.