Article

Numerical Simulation of Airflow Distribution in a Pregnant Sow Piggery with Centralized Ventilation

1
Institute of Facility Agriculture, Guangdong Academy of Agricultural Sciences, Guangzhou 510640, China
2
College of Engineering, South China Agricultural University, Guangzhou 510642, China
3
Guangdong Academy of Agricultural Sciences, Guangzhou 510642, China
4
Maoming Branch, Guandong Laboratory for Lingnan Modern Agriculture, Maoming 525000, China
5
Key Laboratory of Modern Agricultural Intelligent Equipment in South China, Ministry of Agriculture and Rural Affairs, Guangzhou 510642, China
6
South China Intelligent Agriculture Public R&D (Research & Development) Platform, Ministry of Agriculture and Rural Affairs, Guangzhou 510642, China
*
Author to whom correspondence should be addressed.
Appl. Sci. 2022, 12(22), 11556; https://doi.org/10.3390/app122211556
Submission received: 22 October 2022 / Revised: 10 November 2022 / Accepted: 11 November 2022 / Published: 14 November 2022
(This article belongs to the Special Issue Applications of Computer Science in Agricultural Engineering)

Abstract

:

Featured Application

In this study, a computational fluid dynamics (CFD) model was developed for a pregnant sow piggery with centralized ventilation to reveal the distribution of temperature, humidity, and airflow velocity. After verifying the CFD model, the location of the air outlets and the velocity at the air inlets was also examined to obtain the optimal structure and control parameters. The average values, non-uniformity coefficient, and comfort levels were used to evaluate the performance of the piggery under these different parameters.

Abstract

(1) Background: The thermal environment in a pregnant sow piggery is affected by physical parameters such as air temperature, relative humidity, and airflow velocity. However, it is challenging to conduct experimental studies due to the high cost. (2) Methods: Computational fluid dynamics (CFD) was used to study the distribution characteristics of airflow in a pregnant sow piggery with centralized ventilation. (3) Results: The results show that the maximum difference between the simulated and experimental temperature was less than 1.54 °C, and the simulated and tested relative humidity difference was less than 10% RH. Incorporation of a middle air outlet is beneficial for increasing the uniformity of temperature distribution, as studied by comparing the temperature and humidity uniformity coefficient of the two air outlet locations, but the uniformity of humidity distribution will be reduced. With an increase in velocity, the temperature shows a downward trend and the relative humidity shows an upward trend. (4) Conclusions: The most suitable position for the outlet is the middle, with an associated airflow velocity of 0.5 m/s. This study revealed the variation in flow field distribution and air distribution in the pregnant sow piggery as a consequence of changes in ventilation structure, which has certain significance as a reference for the optimization of airflow in intensive pregnant sow piggeries.

1. Introduction

China is the world’s largest pork producing and consuming country, with both pork production and sales exceeding 50 million tons in 2018 [1]. Affected by the African swine fever epidemic, the pork production capacity declined rapidly thereafter, resulting in huge losses for China’s pork industry. According to a statistics report by the Ministry of Agriculture and Rural Affairs of China [2,3], pig stocks in 400 monitored counties decreased by 38.7% in August 2019 compared with the same period in 2018. Among them, the number of breeding pigs in October 2019 was approximately 20.7 million, 37.9% lower than that the corresponding period in 2018 [2,4]. Pork production in 2019 was 42.55 million tons, which was down 21.3% [1,3]. African swine fever has had a major influence on the pork production capacity, the stable production of pork, and promoting the transformation and upgrading of breeding structures, which are economically important in China [5]. Studies have shown that the contribution rate of the breeding environment to pork production benefits reaches 30–40% [6] under the same conditions of breed, feed, and feeding method, thus confirming that the piggery breeding environment plays an important role in the pork production process [7].
Airflow distribution is important in livestock houses and affects the indoor temperature and humidity, convective heat transfer, and pollutant gaseous emissions [8]. The thermal environment of a piggery is affected by physical parameters such as air temperature, relative humidity, air velocity, and turbulence [9], among which air temperature has the greatest impact on pigs [10,11]. Pigs need to maintain a constant body temperature for their normal physiological activities [12]. Humidity plays an important role when combined with high temperature in piggeries [13]. Carroll et al. [14] found that inappropriate temperatures may increase the likelihood, severity, and duration of diseases. Myer et al. [15] found that the food intake of pigs is reduced by high temperature and humidity. Considering centralized pig-rearing systems, mechanical ventilation is essential for providing an environment with suitable temperature and humidity for pigs, especially in summer [16]. In tropical and subtropical areas, a wet curtain fan is the first choice for ventilation and cooling in piggeries, achieving satisfactory results [17,18,19,20,21]. Scholars at home and abroad have made important contributions to optimizing the ventilation process in piggeries in terms of longitudinal ventilation, air intake position, and velocity [22,23,24].
Experimental methods have been used to study the flow field distribution in piggeries by investigating the changes in the environment inside the piggery (including air temperature, air velocity, relative humidity, and gas concentration) [25,26]. However, in the context of African swine fever and COVID-19, testing is high in cost and time-consuming [27], with disadvantages such as biosecurity risks, limited measurement points, measurement errors, poor environmental conditions, and instability [28,29]. Wind tunnel and scale model experiments are widely used in aerodynamic research, but they must meet similarity criteria such as for geometric, boundary, and Reynolds number [25] similarity, which requires additional time and cost. With the development of computational science, the complex flow interaction and flow field distribution observed in animal buildings can now be more comprehensively simulated [30]. Computational fluid dynamics (CFD) simulation provides an alternative method to overcome the shortcomings of traditional tests, scale models, and wind tunnel tests, and it has been widely used in the analysis of livestock buildings [31,32,33]. Cheng Qiongyi et al. used CFD to simulate the distribution of airflow and temperature in chicken coops and found that the uniformity of airflow and temperature distribution increases with an increase in air inlet position and distance from the chicken coop, but the range of influence on the environment inside the coop was limited [34]. Li et al. [35] used CFD to predict the airflow distribution in piggeries with comparison of five turbulence models and found that the applicability of the turbulence model depends on the specific situation.
In the majority of the CFD studies on livestock buildings, the presence of animals is generally ignored [36,37]. However, they may significantly affect airflow patterns as well as temperature and concentration profiles. Therefore, it is necessary to include the animals in such studies, as this is closer to real situations. Some researchers have conducted CFD simulations of livestock buildings, including detailed pig models of realistic sizes [38]. However, detailed pig modeling has not yet been applied to CFD simulations of the great numbers of pigs in commercial piggeries because ordinary desktop or professional workstation computers do not have the computational power necessary to handle such simulations with their extremely high grid numbers [33]. Therefore, simplification has been applied in which parts of the pig body such as the tail, ears, and legs are omitted from the model to save computational costs while maintaining simulation accuracy [39]. A simplified pig model has been used to establish a prediction model of air velocity in animal-occupied areas by omitting some pig components in a simulation study of the convective heat transfer between pigs and their surroundings [35]. However, simplified pig models where small parts have been omitted still produce high mesh numbers, leading to heavy calculations or poor mesh quality due to the irregular shape of the pig used to reduce mesh numbers. Therefore, simple geometric models have been adopted to further replace simplified models, such as cylinders, ellipsoids, and spheres [38,40]. Li et al. investigated the convective heat transfer coefficients of chickens using CFD simulation and showed that similar coefficients were obtained when using spheroid and simplified chicken models [41]. Mondaca et al. found that the average heat flux of cows could be adequately simulated through an assembly of spheres, cylinders, and six cylinders [42]. Li et al. compared an actual pig model with a cylindrical model, and the results showed that the convective heat transfer coefficients of the two models were strongly correlated [43]. Therefore, simplifying the individual pig to a regularly shaped object is effective as computational efficiency and accuracy can be ensured.
In this study, a CFD model of a pregnant sow piggery with centralized ventilation was constructed for simulation and analysis of the airflow distribution with determination of the distribution of temperature, humidity, and airflow velocity. This study has certain significance as a reference for the structure and flow field optimization of pregnant sow piggeries.

2. Materials and Methods

2.1. Test Piggery

The test piggery is located in Zhanyi City, Yunnan Province, China (25°91′ N, 103°7′ E). The piggery covers an area of 33.6 hm2 and has a total construction area of 8.7 m2. The designed production scale is 180,000 commercial pig seedlings, 70,000 seedlings, and 10,500 basic pigs. There are four production lines in the breeding farm, and each production line carries out a complete set of breeding, pregnancy, and delivery processes along with other production processes. A centralized ventilation design is adopted, the piggery buildings are all closed, and fully automatic feeding, environmental control, washing, dung scraping, and other forms of production equipment are employed.
The tested pregnant sow piggery is arranged in the second production line of the breeding farm, which is located at an altitude of 2040 m. The overall size of the piggery is 164.5 m in length, 30.1 m in width, and 4 m in height. During the testing period, the cohort consisted of 2054 pregnant sows (556 in units 1–7, 560 in units 8–14, 394 in units 15–21, and 544 in units 22–28) from the first trimester to day 112 of the pregnancy. As shown in Figure 1a, there are a total of 28 units in the piggery, and each unit has two columns of limit bars, totaling 80 units. One variable frequency fan is installed in one unit of each pitch, with a total of 14 variable frequency fans. The maximum air volume of the piggery is 24,300 m3/h. The width of the middle aisle is 1 m. Figure 1 shows the schematic diagram of the piggery.

2.2. Model Parameter Measurement

The model parameters were measured on 12 August 2018. On that day, the temperature outside the piggery was 21~26 °C, and the relative humidity was 35~97%, which are typical for the climate in southwest China in summer. The temperature, relative humidity, and velocity of the environments inside and outside the piggery were measured using a hot-wire anemometer and a hygrometer. A thermal imager was used to measure the surface temperature of the enclosure structure and the body surface temperature of the pigs and piglets. The technical parameters of the sensors are shown in Table 1.
The distribution points measured in the piggery as the conditions for subsequent simulation validation are shown in Figure 2. A wireless multi-source multi-node monitoring system [44,45,46] was adopted, which was composed of multiple monitoring sensor nodes and a master node. The monitoring sensor node was a temperature and humidity integrated sensor, and the arranged height (H) was 60 and 150 cm, respectively. Sensor nodes were symmetrically arranged in the area corresponding to the pigs’ heads in the middle of units 1 and 2 at every two intervals until they reached the middle area of unit 25 and unit 26. Five sensor nodes were arranged in each column at two heights. Wireless sensor modules at a height of 150 cm were arranged in the area above the pig’s heads, two in each column, and arranged in the middle of limit columns No. 13 and 26 to monitor the changes in temperature, humidity, and gas velocity at a position above the pigs’ heads. Sensor nodes at a height of 60 cm were arranged in the front area of the pigs’ heads, three in each column, and arranged in the middle of limit column Nos. 10, 20, and 30 to monitor the changes in temperature, humidity, and gas velocity at the horizontal position of pigs’ heads. Sensor nodes were placed at a height of 150 cm in cells 5, 10, 15, 20, and 25 to monitor the changes in heat and gas concentration above the pigs’ tails. At the same time, two wireless sensor nodes were placed outside the piggery and behind the wet curtain.
The non-uniformity coefficient was introduced as an index for evaluation of the distribution of temperature and humidity in the piggery [47]. The absolute uniformity can be expressed as follows:
S = i n | ( t i t n ) / t n |
where ti is the temperature of the ith measuring point (°C); and tn represents the average temperature of n measuring points (°C).
Although the non-uniformity coefficient in the piggery can reflect the overall uniformity of the temperature and humidity field in the piggery to a certain extent, it is widely used in the evaluation of structural parameters and the performance of livestock and poultry houses. However, as a result of pregnancy, the piggery integral space is larger and individual pigs have a small range of activity, and the overall uneven coefficient of the temperature and humidity field therefore cannot be used to fully express the pigs’ individual living areas of comfort; thus, we proposed using the pigs’ individual area (as shown in Figure 3) of the temperature and humidity field uniformity as a gauge of the pigs’ individual life comfort. As shown in Figure 3, five positions near an individual pig were selected as the positions for detection of its body surface comfort, and its comfort was evaluated by calculating the non-uniformity coefficient. In order to accurately express the universality of the comfort of the pigs in the piggery, pigs in the front (X = −9.92 m), middle (X = −2.02 m), and back (X = 7.04 m) sections were selected as the study pigs, and the influence of ventilation velocity on the individual comfort of the pigs in the piggery was explored by calculating the non-uniformity coefficient of the surface temperature and humidity field of the pigs under different velocities.

3. CFD Numerical Model

3.1. Basic Governing Equation

3.1.1. Mass Conservation Equation

The fluid flow problem in the pregnant sow piggery satisfies the law of conservation of mass; that is, the increase in mass in the fluid element per unit time is equal to the net mass flowing into the element at the same time interval:
ρ f t + · ( ρ f υ ) = S m
where ρf is the fluid density (kg/m3); = ( x , y , z ) represents the vector operator; t denotes time (s); υ stands for the velocity (m/s); and Sm refers to the mass source term (kg/m3·s).

3.1.2. Momentum Conservation Equation

Based on the law of conservation of momentum, the rate of change in fluid momentum in a micro element with respect to time is equal to the sum of all external forces acting on the micro element:
ρ f υ t + · ( ρ f υ υ ) = p + ρ f g + F
where p is pressure (Pa); g represents the gravity term (N/m3); and F is the external force (N/m3).

3.1.3. Energy Conservation Equation

t ( ρ f E f ) + · ( υ ( ρ f E f + p ) ) = · k e f f · T i h i J i + S i h
where Ef is the total fluid energy (J); keff denotes the thermal conductivity (W/m·K); T represents the temperature (K); hi refers to the specific enthalpy (J/kg); J i stands for diffusion flux (kg/m2 s); and S i h depicts the total entropy (W/m3).

3.1.4. Component Transport Equation

In order to study the distribution law of the humidity field and flow field in the pregnant sow piggery, the transport equation based on component mass fraction was employed [48], and the equation is
( ρ f Y i ) t + · ( ρ f υ Y i ) = · J i + ρ f g + S i
where Yi is the mass fraction of component i, which is the mass fraction of water vapor in this study. During the test, the relative humidity measured at the inlet was 99%, and the value converted into mass fraction is 0.0156. Si represents the water vapor mass source term (kg/m3·s).

3.2. Numerical Model Preprocessing

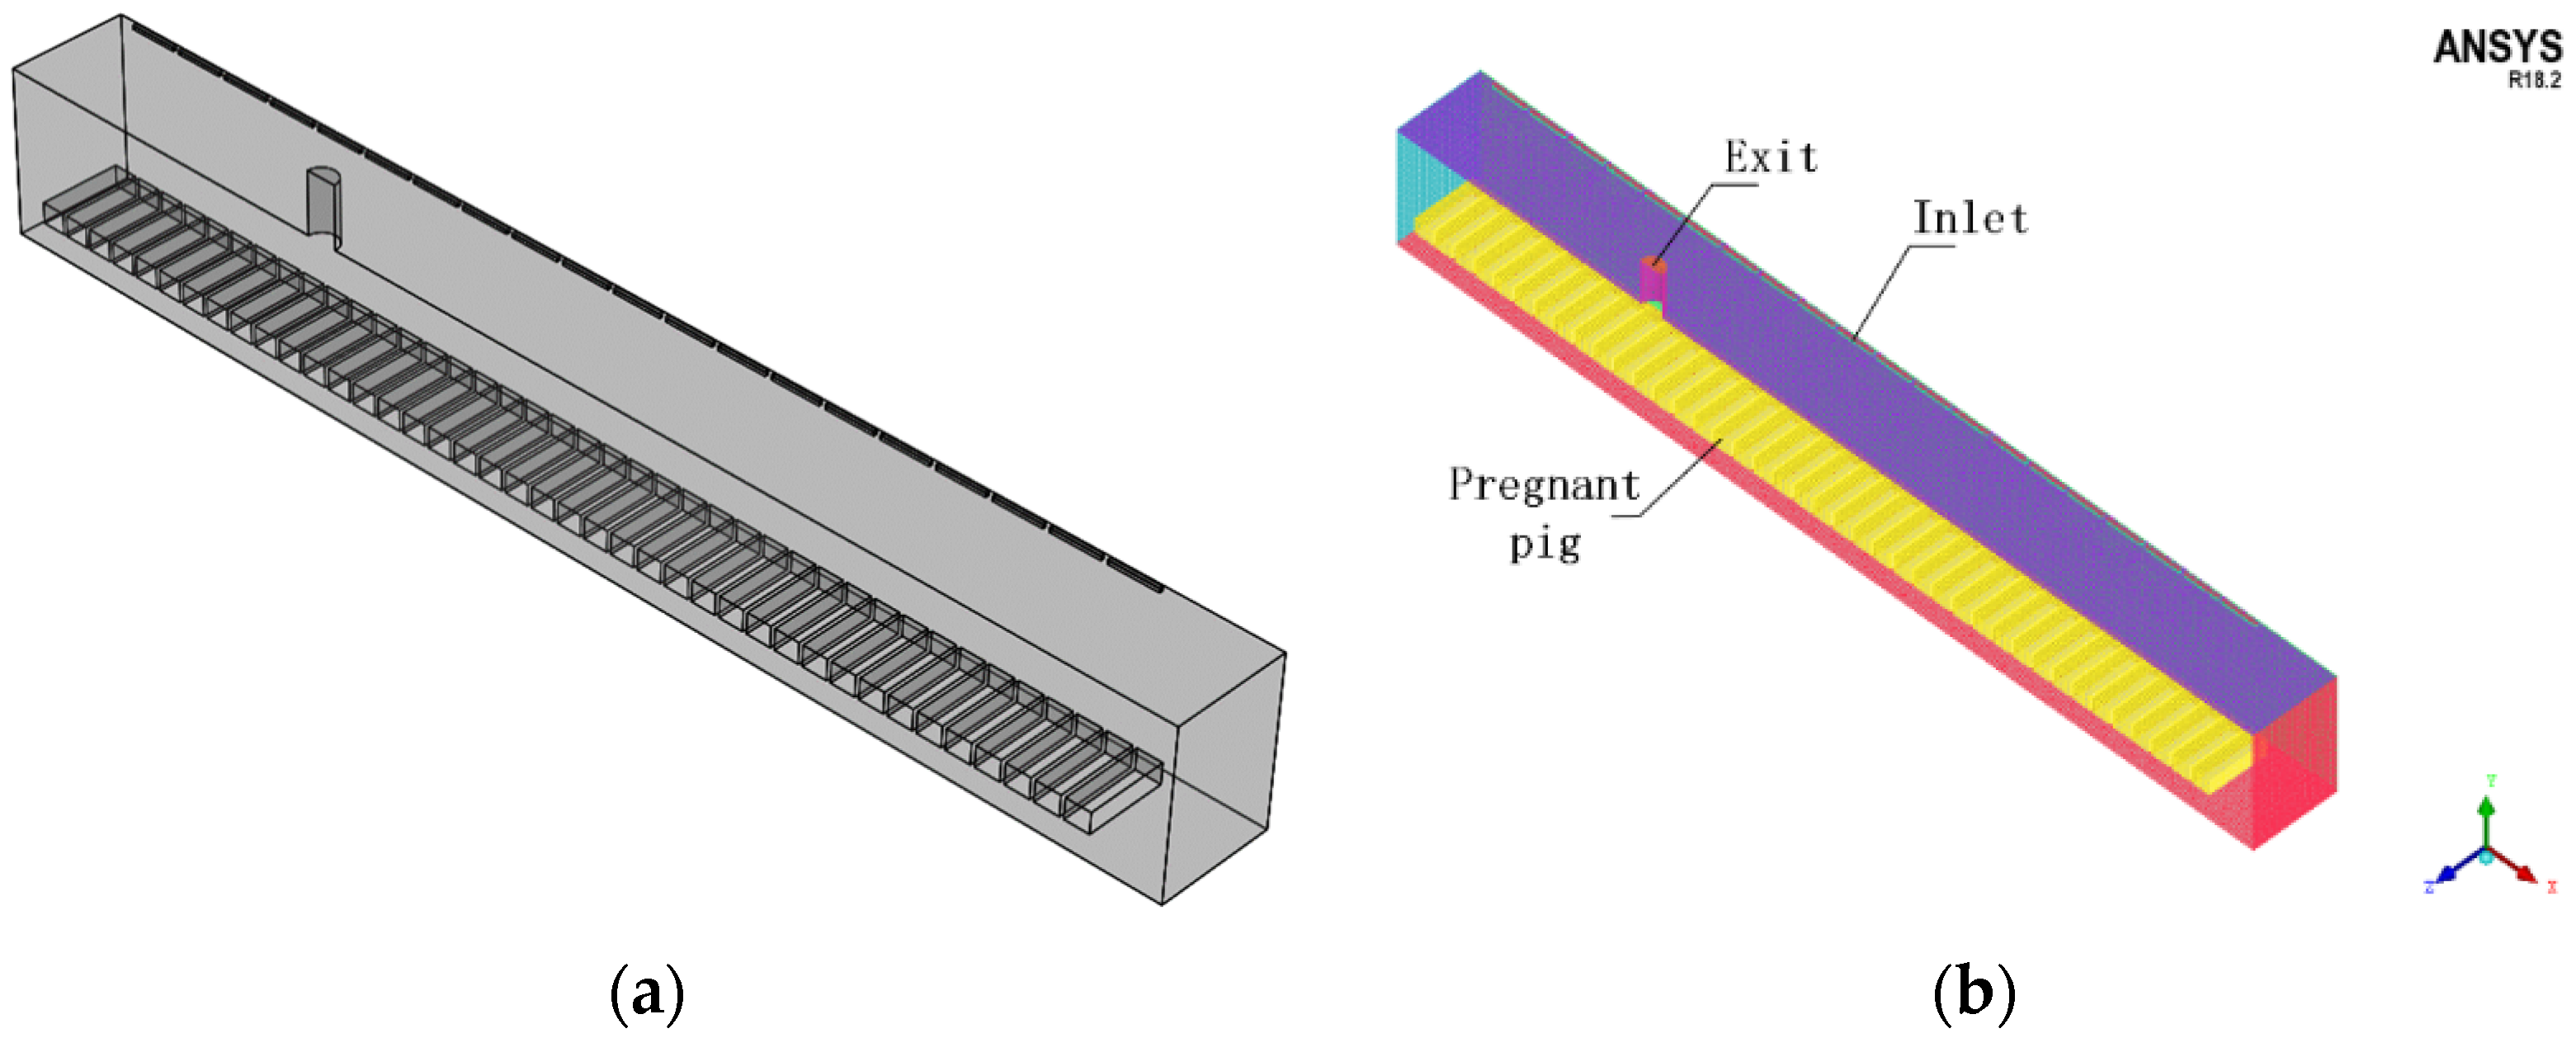
To improve the computational efficiency and save computer simulation time, only half of the temperature, humidity, and velocity fields of the unit were solved in the simulation solution, with the rest obtained by symmetry. SolidWorks 2016 was used to establish a physical model of the pregnant sow piggery (Figure 4a), and the structures of the limit column, manure leakage floor, and pregnant sows were simplified, with a pregnant sow assumed to be a cuboid with the same three-dimensional size as in reality [49]. ICEM CFD and Fluent in ANSYS 18.2 were used for grid discretization and numerical iteration respectively. As tetrahedral grids have good adaptability but a large number of grids, whereas hexahedral grids have a small number of grids and high computational accuracy, ICEM CFD was used for discretization of the model into an unstructured grid dominated by hexahedra (Figure 4b), and local encryption was performed on the intakes, outtakes, and surfaces of the pregnant pigs. The number of divided grid nodes was 371,890, and the overall number of grids was 446,817.

3.3. Setting and Solving Boundary Conditions

To simplify the model and improve the simulation efficiency, the following assumptions are made for the model [50,51]:
(1)
The gas in the piggery is a Newtonian fluid;
(2)
The gas in the piggery is incompressible in the flow process and conforms to the Boussinesq assumption;
(3)
Water vapor does not condense on the solid walls;
(4)
There is good airtightness in the piggery.
In this simulation study, since the outside temperature of the piggery was relatively stable and the negative pressure fan operated continuously during the test, a steady-state simulation was adopted [12].
The Reynolds number was solved for the pregnant sow piggery model [52,53] according to empirical Equation (6):
R e = ρ ν d / μ
where Re (Reynolds number) is the number of similarity criteria to characterize the influence of viscosity in fluid mechanics; ρ stands for the fluid density (taken as 1.225 kg/m3); v refers to the speed (0.197 m/s); d denotes the characteristic diameter (0.3 m); and μ represents the dynamic viscosity coefficient (17.9 × 10⁻⁶ Pa·s). The Reynolds number was found to be approximately 2022, which was identified as a high turbulence state, and a turbulence model should therefore be selected for simulation. Lin Jiayong et al. [33] simulated the distribution law of the internal environment of a male piggery based on the standard k-ε turbulence model, and the results showed good agreement between the simulated and experimental values for the velocity field and temperature field, and convergence of the standard k-ε was easier. In this study, the standard k-ε turbulence model was used to simulate the temperature, humidity, and velocity fields of the pregnant sow piggery.
The 20 air intakes in the piggery were all set as speed inlets in Fluent. The outlet boundary condition was set as a pressure outlet. The enclosure structure was set as a non-slip wall, and the thermal boundary condition was set as temperature. Considering that the thermogenesis of pigs ultimately acts in the maintenance of body temperature, the pig body temperature was as a constant, and the surface temperature was obtained using a thermal imager, ignoring the respiratory heat of pigs. Due to the large space in the piggery, the pig surface had little influence on the flow field in the piggery, so its surface was set as a smooth wall. The specific set boundary conditions are shown in Table 2.

4. Results

4.1. Test Validation

Figure 5a shows the comparison between the test temperature and the simulated temperature at each measuring point. Among them, the maximum deviation between the simulated temperature and the experimental value did not exceed 1.54 °C, the relative error is 0.28–5.99%, and the average relative error is only 3.06%. Figure 5b shows the comparison between the test and simulation values of relative humidity at each measurement point. As shown in Figure 5b, the maximum difference between the simulated and test value for relative humidity is less than 10% RH, and the relative error is 0.06–13.14%, with an average relative error of 7.68%. From the comparison results, it can be found that the simulated temperature value is lower than the experimental value, which may be because the respiratory heat of pigs was not considered in the simulation process. However, the simulated value of relative humidity is higher than the test value. As the simulated value of temperature is lower than the test value, the relative humidity value of water vapor with the same mass will be higher when the temperature is low. According to Equation (1), the uniformity coefficient of the temperature field and the relative humidity field of the piggery is 0.0908 and 0.0976, respectively. The relative error of the simulation results is within a reasonable range: among the five temperature and humidity measuring points, and humidity exceeds 10% at only two nodes, and the error of all temperature measuring points is less than 6%. Therefore, the results show that the simulation is reliable and can be used to accurately predict airflow distribution in the piggery.

4.2. Piggery Environmental Assessment

4.2.1. Temperature Distribution

Figure 6a shows the temperature distribution in the five planes in which the longitudinal section (X) of the piggery is X = −9.92 m, X = −6.1 m (the section where the fan is located), X = −2.02 m, X = 2.62 m, and X = 7.04 m. The temperature of most region ranges from 24.66 °C to 27.03 °C, but the temperature of corridor ranges from 27.63 °C to 30 °C. As can be seen in Figure 6a, low-temperature fresh air enters the piggery from the air supply outlet, and after undergoing heat exchange with the pregnant pig and the air in the piggery, is discharged from the outlet. The temperature in the aisle is higher, and is close to the body temperature of the pregnant pigs. This may be due to the fresh air entering the piggery from the top ceiling and partially leaving the piggery from the top ceiling, forming a circular vortex dead angle on the aisle position. Therefore, the temperature at the tail of the pregnant pigs, namely, the aisle, is higher. This also explains, to a certain extent, the rationality of arranging the air outlet above the pigs’ heads.
Figure 6b shows the temperature distribution of the three planes in which the cross-section (Z) of the piggery is: Z = −2.5 m, Z = 0 m (the section where the fan is located), and Z = 2.5 m. As shown in the cross-sections of the three positions in Figure 7b, the temperature on the cross-section of the passage is relatively high, ranging from 24 to 27 °C, whereas the temperature on both sides is between 22 and 26 °C. The reason for this may be that the cross-sections at the two side positions have fresh air with low temperature, which fully exchanges heat with the air on these two sections, so the temperature remains relatively low. In the area where the pregnant pigs are located, the temperature is basically maintained at 22–24 °C, which is suitable.
Figure 6c shows the temperature gradient distribution of the outlet section in the piggery. The temperature above the pigs and in the aisle is approximately 28.22 °C to 30 °C. It can be seen from the figure that the temperature gradient near the wall is larger, which may be caused by the higher temperature of the wall and the lower temperature of the air in the piggery. In the center of the piggery, the temperature gradient is small and the temperature is high, which may be due to the presence of an air-circulation dead zone at this position, resulting in insufficient heat exchange such that the temperature in this area is maintained within a high range.

4.2.2. Humidity Distribution

Figure 7a shows the relative humidity distribution maps of the longitudinal sections of the piggery for the following five planes: X = −9.92 m, X = −6.1 m (the section where the fan is located), X = −2.02 m, X = 2.62 m, and X = 7.04 m. As can be seen from the figure, the relative humidity in most regions ranges from 79.98% to 83.32%, which was suitable for pig. The relative humidity of each section gradually decreases with the increase in height due to the wet air blowing downward and gradually accumulating below, but the middle area is not supplemented by fresh wet air, so the humidity in the middle area of the piggery is low.
Figure 7b shows the relative humidity distribution in the three planes with the cross-section of the piggery as Z = −2.5 m, Z = 0 m (the section where the fan is located), and Z = 2.5 m. The relative humidity in most regions ranges from 76.65% to 86.66%, and the high relative humidity is mainly concentrated in the fan outlet area. It can be seen from the figure that there is a high relative humidity value for the outlet area because this is where all the wet air converges and drains out of the piggery. In the negative half of the X-axis, the average value of the overall relative humidity is low because wet air circulates more slowly and the water vapor diffusion rate is therefore also low. However, the pattern on the positive side of the X-axis is opposite to that of the negative side. The average humidity is higher on both sides than in the middle section. This is because the air supply outlet is close to the two sides but far away from the middle section. The two sides are the control area of the air outlet, so the relative humidity value is higher, between 70% and 85%.

4.2.3. Velocity Distribution

Figure 8a shows the airflow velocity distribution in the five planes of the intercepted longitudinal sections of the piggery: X = −9.92 m, X = −6.1 m (the section where the fan is located), X = −2.02 m, X = 2.62 m, and X = 7.04 m. The velocity of most region ranges from 0.04m/s to 0.10 m/s, and the velocity below the draught is higher than the other region. It can be seen from the figure that the speed at the outlet is the fastest because the sum of the areas of all the air intakes is greater than the area of the air outlet. According to the law of mass conservation, the mass flow rate at the outlet is higher than that at the air inlet, so the velocity at the outlet is greater. There is an obvious vortex on a section of the air outlet. The reason for this may be that the fresh air moves toward the direction of the air outlet after it arrives at the pregnant pig from the air inlet.
Figure 8b shows the airflow velocity distribution in the three planes with the cross-section of the piggery as Z = −2.5 m, Z = 0 m (the section where the fan is located), and Z = 2.5 m. As can be seen from the figure, the airflow velocity in the head area of the pregnant pigs is approximately 0.06 m/s, which meets the standards for the living comfort of the pigs. From the outlet section, it can be seen that there is a small jet above the pig tail height, and the jet direction is pointing to the direction of the fan, indicating that negative pressure ventilation plays an important role in guiding the velocity flow field in the piggery. The velocity on the two side sections is uniform, and there are no positions with obvious speed differences. The reason for this is that the two side sections are close to the air inlet section, and the air inlet is tightly and evenly arranged such that the velocity uniformity on the two sides is satisfactory. Airflow generally appears at the lower part of the fan and the air inlet, and the airflow in the area near the height of the pregnant pigs in the whole piggery is below 0.08 m/s, which meets the national standard requirements for the comfortable environment of pregnant pigs.

4.3. The Effect of Exit Position

As mentioned above, in the X-axis direction with the fan section as the symmetry plane, the temperature and humidity distribution does not show a symmetry phenomenon because the outlet is not on the symmetry plane of the pregnant sow piggery unit. To explore the influence of the air outlet location on the of temperature and humidity in the piggery, the location of the air outlet was changed to the symmetric section of the piggery unit and studied using CFD simulation analysis. By comparing the non-uniformity coefficient of the original outlet, the advantages and disadvantages of the two air outlet methods were analyzed.
Figure 9a–e shows the temperature and humidity field and the velocity field distribution when the air outlet is in the middle of the cell. The temperature of most regions ranges from 25.25 °C to 26.44 °C. As can be seen from the figure, the temperature and humidity fields and the velocity fields show good symmetry in the X-axis direction with the section of the outlet as the symmetry plane (as seen in Figure 9a–c), which is the biggest difference from the original pregnant sow piggery. Table 3 is the results from comparison of data for the two types of outlet positions. It can be seen from the table that when the outlet position is in the middle of the piggery unit, the average temperature is 24.89 °C, higher than 24.71 °C for the original position.
When the outlet was located in the middle of the pregnant sow piggery unit, the non-uniformity coefficient was 0.086, which is lower than 0.091 at the original position, indicating that there is greater temperature field uniformity when the outlet was located in the middle of the piggery unit than at the original position. When the outlet was located in the middle of the piggery unit, the relative humidity was 79.76%, which is lower than 80.62% for the original position. In addition, when the air outlet was located in the middle of the piggery unit, the humidity non-uniformity coefficient was also higher than that in the original position, 0.127 and 0.098, respectively, indicating that the relative humidity distribution was more uneven when the air outlet was located in the middle of the pregnant sow piggery unit.

4.4. The Effect of Velocity

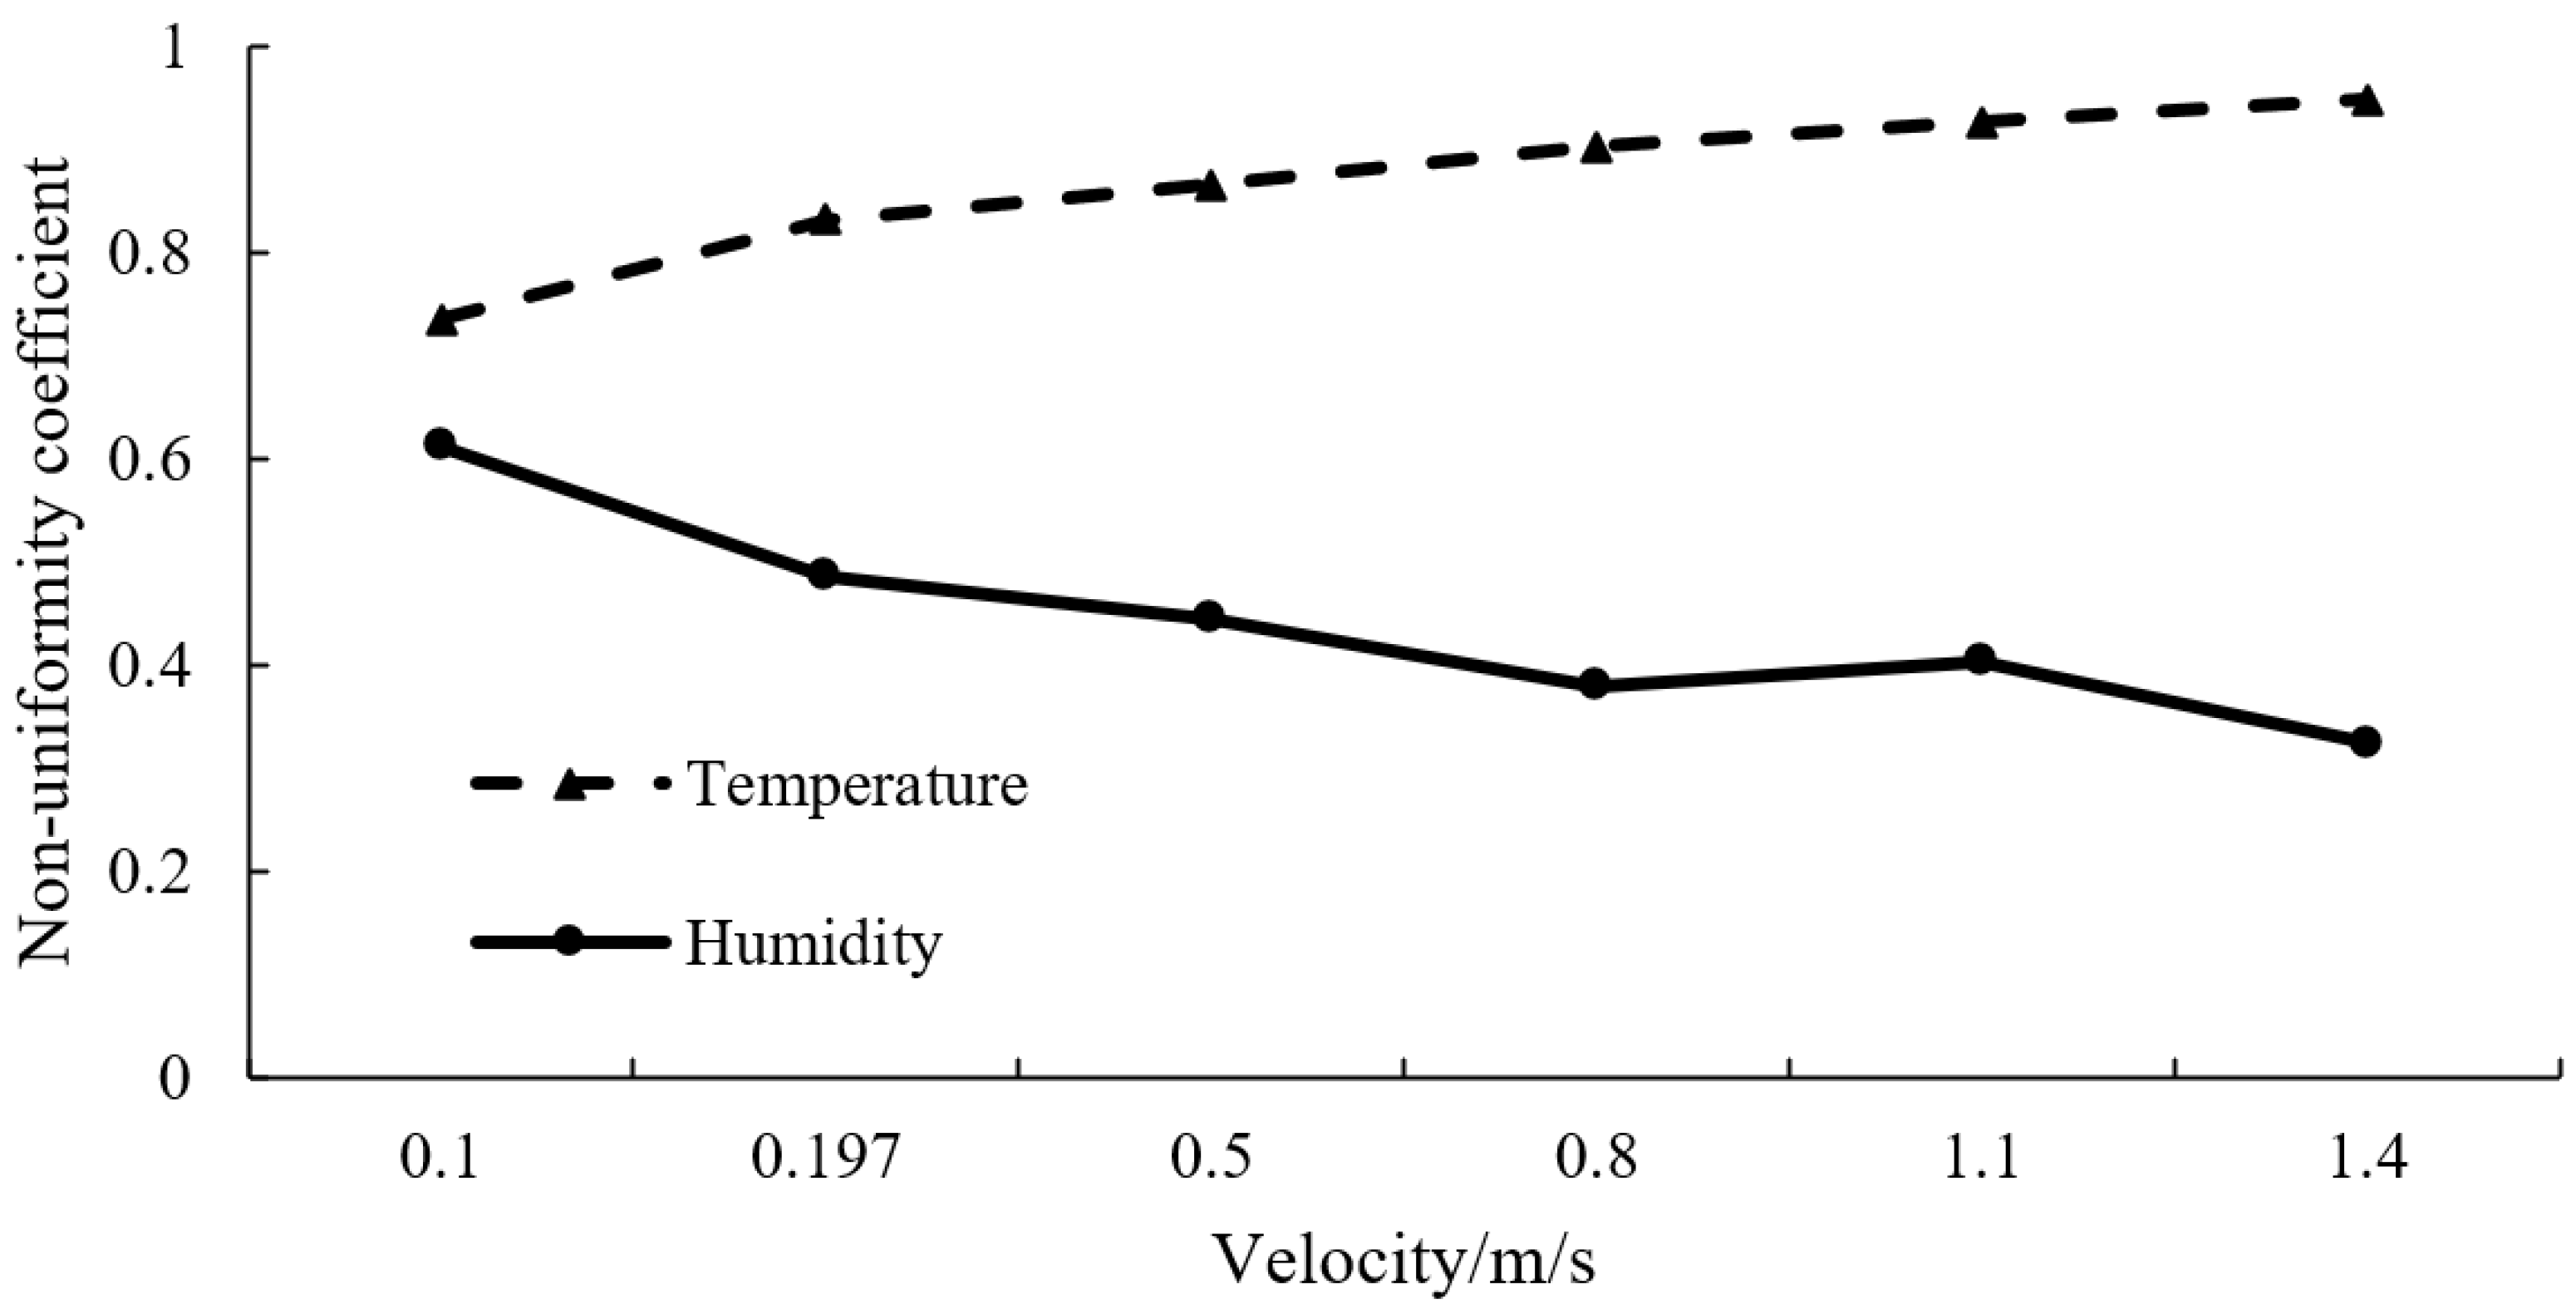
Insufficient air circulation in the piggery will lead to a decrease in air quality in some areas and affect the uniformity of temperature and humidity distribution. In addition, one of the ways to speed up air circulation in the piggery is to increase the velocity at the air inlet. In this study, six velocities were selected to explore the influence of each on average temperature, average relative humidity, and temperature and humidity uniformity. The results are shown in Figure 10a,b. Figure 10a is the temperature variation under different velocities. When the velocity is increased from 0.1 to 1.4 m/s, the average temperature in the piggery decreases by 1.31 °C. As can be seen from the figure, with an increase in velocity, the average inner temperature presents a trend of gradual decline. This may be due to the increase in velocity, inner air circulation speed, low air temperature continuous heat exchange with the air in the piggery, and the removal of the inner heat, resulting in a temperature drop.
Figure 10b shows the change in relative humidity under different velocities. It can be seen from the figure that the average relative humidity in the piggery keeps rising with the increase in velocity. This may be because the increase in velocity leads to the intensification of air circulation in the piggery and an increase in water vapor entering the piggery at the same time, leading to an increase in the average humidity in the piggery. When the velocity is increased from 0.1 to 1.4 m/s, the average relative humidity in the piggery increases by approximately 6.6%. Compared with the cooling effect of 1.31 °C, the increase in relative humidity in the piggery was more obvious. With the increase in velocity, the relative humidity of the non-uniform coefficient changes, and with the change in temperature, the non-uniformity coefficient is consistent. The main reason for this may be that at the pregnant pig head area, there is an increase in velocity and significantly lower relative humidity, but the relative humidity rise due to air circulation eddy current is not obvious at this high inner position, so the difference between the upper and the lower values increase; thus, the uniformity of relative humidity in the piggery is reduced. As can be seen from the figure, when the velocity is 0.5 m/s, the indoor relative humidity is higher, the coefficient of relative humidity unevenness is lower, and there is greater uniformity of indoor relative humidity.

4.5. Evaluation of Body Surface Comfort of Pigs

Figure 11 shows the differences in body surface comfort of pigs under different velocities. As shown in the picture, with an increase in velocity, the temperature of the inner pigs increases and a gradually flattening out occurs with individual uneven coefficients of average, showing that the pig individual body surface temperature difference is higher and their comfort level is lower. The reason for this is that when the velocity is higher, the head area of the pigs cools faster and is maintained at a certain temperature. However, the tail area of the pig cannot exchange heat with the cold air in a timely manner due to the air vortex, resulting in a high temperature, so the non-uniformity coefficient increases. The pattern is the opposite for relative humidity, where an increase in velocity results in a gradual decrease in the humidity non-uniformity coefficient of pigs in the piggery, indicating that there was little variation in relative humidity of the pigs’ body surface and therefore good uniformity, which may be caused by the enhanced diffusion ability of water vapor. With the increase in velocity, there is a corresponding increase in the water vapor entering the piggery at the same time, resulting in a higher concentration of water vapor that ultimately results in enhancement of its diffusion ability. Saturated water vapor reaches the ground and diffuses along the pig’s body to the tail, and the higher the velocity, the higher the degree of water vapor diffusion, so the relative humidity of different areas on the pig’s body surface is uniform.

5. Discussion

The temperature in the outlet section is uniform for each section (Figure 6). The reason for this may be that the short path of fresh air from when it enters the piggery to discharge. For the same given ventilation time, this means there is more circulation, so the temperature field on the outlet section is uniform. Using the outlet section as the center and advancing it to both sides of the X-axis, the farther away from the outlet section, the poorer the temperature uniformity. This may be because there is a lower circulation rate at locations far away from the outlet section and, therefore, heat is not fully exchanged with the air in the piggery, leading to a generally higher temperature. For the outlet cross-section plane of symmetry, the inner temperature distribution does not present a symmetrical distribution phenomenon. This may be because the inner mass flow of the two sides does not match, the shaft is half the size in the X-axis direction for a higher mass flow rate, and according to the principle of diffusion, it has a higher export diffusion rate, with a higher cycle number, so its temperature was lower than that of the other side. Similar results were obtained in another study [52].
The relative humidity in the area above the passage showed a trend of gradual increase (Figure 7). This is because there is a vortex dead zone below the passage, and it is difficult for water vapor to reach this area. However, the area above the passage is where wet air confluences, so the relative humidity value in this area is higher. The relative humidity of the air inlet area at the top is above 90%. The relative humidity gradually decreases from the air inlet to the aisle, and the relative humidity in the aisle is only approximately 60%. In the area near the floor of the piggery, the relative humidity distribution is mostly around 80%. By observing the distance between each section and the fan, it can be found that the further away the section is from the fan, the lower the average relative humidity in the section. The closer the section is to the fan, the higher the average relative humidity in the section, which may be because the velocity near the fan is higher, the water vapor is quickly removed from the piggery, and the high humidity air is constantly supplemented.
The air in the middle area of the section cannot exchange mass with fresh air, and the air quality in this area is poor (Figure 8). Taking the outlet cross-section on the X-axis half shaft as a starting point, the greater the distance from the outlet cross-section, the larger the difference in velocity distribution on the cross-section, and the vortex is most obvious in the region at X = 7.04 m. Away from the location of the outlet cross-section, the air circulation cycle is longer, and the air in this area is older and of poor quality. However, due to the high vertical position of the vortex, the air quality in this area does not affect the breathing quality of the pregnant pigs. However, in the area near the outlet section, there is a small difference in airflow velocity, so the overall distribution is uniform. Due to the difference in the mass flow rate of the air inlet on the positive and negative half axes, the airflow in the negative half axis of the X-axis is poor, so the average velocity in the X = −9.92 m section is lower than that in the symmetric plane of the air outlet section, and the vortex is more obvious. The speed above the head of the pregnant pigs is greater, which ensures that the pregnant pigs can breathe fresh air and also explains the rationality of the air intake layout to a certain extent.
The trend of temperature non-uniformity coefficient is opposite to that of the average temperature (Figure 9). Based on the above temperature and humidity data, a more uniform temperature field can be obtained when the air outlet is located in the middle of the piggery unit, considering the priority of temperature control. The results are similar to those in a study on a laying hen house [24]. Therefore, it makes sense to place the exit fan in the middle of the piggery for better airflow distribution.
With the increase in velocity (Figure 10), the average temperature comes increasingly closer to the air inlet temperature. However, with the increase in velocity, the inner non-uniform coefficient presents an upward trend after first falling, that is, its evenness increases after first decreasing. This may be because the velocity is larger and the temperature of the head area of the pig is low, but the decline in temperature of the inner high position is not obvious, leading to an increased difference between the upper and the lower values, thereby reducing temperature uniformity. Considering the average temperature in the piggery and the coefficient of temperature non-uniformity, an optimal velocity of 0.5 m/s can be selected because, at this setting, the average temperature in the piggery is low and the uniformity is more suitable.
From the above results, it can be seen that CFD can be effectively used to help us understand the air distribution inside the piggery, including in terms of velocity, temperature, and humidity. When designing and building a piggery, the location of the air outlets must be considered. When running a piggery, it is necessary to consider which velocity is most suitable for the comfort of the pigs and the uniformity of temperature and humidity inside the piggery toward improving the welfare of the pigs.

6. Conclusions

A CFD model of a centralized ventilation pregnant sow piggery with a ceiling air intake and a central air exhaust was developed, and the following conclusions were obtained:
(1)
The CFD model was used to simulate the temperature and humidity distribution in the piggery. The maximum difference between the simulated and the experimental temperature values was less than 1.54 °C, and the relative error ranged from 0.28% to 5.99%, with an average relative error of 3.06%. The maximum difference between the simulated and the tested relative humidity values was less than 10% RH, and the relative error ranged from 0.06% to 13.14%, with an average relative error of 7.68%. Therefore, good agreement between the simulation and test results was demonstrated.
(2)
The temperature and humidity fields and the uniformity coefficient of the two air outlet locations were compared. When the temperature field is given priority, positioning the air outlet in the middle of the unit will help to increase the uniformity of the temperature field but will reduce the uniformity of the humidity field.
(3)
With an increase in the air speed in the inlet, the temperature showed a downward trend while the relative humidity showed an upward trend; however, the uniformity of the two both increased first and then decreased. Considering the temperature and the humidity, along with the corresponding non-uniformity coefficient, the ventilation speed of 0.5 m/s was selected as the optimal inlet speed for the pregnant sow piggery.
(4)
With an increase in the velocity at the air inlet, the uniformity of the temperature distribution on the body surface of pregnant pigs decreases, while the uniformity of the relative humidity distribution increases.
In this study, the coupling simulation of airflow in the pregnant sow piggery was carried out to obtain the characteristics of temperature and humidity distribution and air organization in the piggery, which has certain reference significance for the optimization of airflow in piggeries with centralized ventilation.

Author Contributions

Conceptualization, X.W. and Z.Z.; methodology, H.L.; software, X.W.; validation, X.W., B.L. and E.L.; formal analysis, J.G.; investigation, Y.J.; resources, B.L.; data curation, X.W.; writing—original draft preparation, X.W.; writing—review and editing, Z.Z. and E.L.; visualization, J.G.; supervision, H.L.; project administration, H.L.; funding acquisition, B.L. and Z.Z. All authors have read and agreed to the published version of the manuscript.

Funding

The Project of Collaborative Innovation Center of GDAAS-XTXM202201; the Innovation Fund Project of Guangdong Academy of Agricultural Sciences (202202); the Youth Tutorial Program of Guangdong Academy of Agricultural Sciences (R2021QD-023); Independent Research Project of Maoming Laboratory (2021ZZ003); Key Research and Development Program of Guangdong Province (2019B020225001); the Key Laboratory of Modern Agricultural Intelligent Equipment in South China, Ministry of Agriculture and Rural Affairs, P.R. China (HNZJ202209).

Institutional Review Board Statement

Not applicable.

Informed Consent Statement

Not applicable.

Data Availability Statement

Not applicable.

Conflicts of Interest

The authors declare no conflict of interest.

References

  1. Hu, H.; Ge, Y. Impact of African Swine Fever on Pig Production and Market. Chin. J. Anim. Sci. 2020, 56, 168–172. [Google Scholar]
  2. Ministry of Agriculture and Rural Affairs of China. The Ministry of Agriculture and Rural Affairs of China Holds a Regular Press Conference on the Pig Production Situation in October. Available online: http://www.gov.cn/xinwen/2019-11/22/content_5454733.htm (accessed on 22 November 2019).
  3. Zhu, Z.; Li, M.; Zhang, X. Analysis on effects of African swine fever on China’s pig market and industry development. Trans. Chin. Soc. Agric. Eng. (Trans. CSAE) 2019, 35, 205–210, (In Chinese with English Abstract). [Google Scholar] [CrossRef]
  4. Nie, Y.; Qiao, J. Impact of African Swine Fever on the Development of Pig Industry in China. J. Agric. Sci. Technol. 2019, 21, 11–17. [Google Scholar]
  5. The State Council of China. Opinions on the Key Work of “Agriculture, Rural Areas and Farmers” to Ensure the Realization of Comprehensive Well-Off Society as Scheduled. Available online: http://www.moa.gov.cn/nybgb/2020/202002/202004/t20200414_6341529.htm (accessed on 5 February 2020).
  6. Huang, C.; Li, Y.; Xu, Z. Effect of Piggery Air and Airbone Harmful Substances on Health of Pig Community and Its Controlling Technology. Acta Ecol. Anim. Domastici 2012, 33, 80–84. [Google Scholar]
  7. Xie, Q.; Ni, J.-Q.; Bao, J.; Liu, H. Simulation and verification of microclimate environment in closed swine piggery based on energy and mass balance. Trans. Chin. Soc. Agric. Eng. (Trans. CSAE) 2019, 35, 148–156, (In Chinese with English Abstract). [Google Scholar] [CrossRef]
  8. Takai, H.; Nimmermark, S.; Banhazi, T.; Norton, T.; Jacobson, L.D.; Calvet, S.; Hassouna, M.; Bjerg, B.; Zhang, G.-Q.; Pedersen, S.; et al. Airborne pollutant emissions from naturally ventilated buildings: Proposed research directions. Biosyst. Eng. 2013, 116, 214–220. [Google Scholar] [CrossRef] [Green Version]
  9. Bjerg, B.; Rong, L.; Zhang, G. Computational prediction of the effective temperature in the lying area of pig pens. Comput. Electron. Agric. 2018, 149, 71–79. [Google Scholar] [CrossRef]
  10. Spoolder, H.A.M.; Aarnink, A.A.J.; Vermeer, H.M.; van Riel, J.; Edwards, S.A. Effect of increasing temperature on space requirements of group housed finishing pigs. Appl. Anim. Behav. Sci. 2012, 138, 229–239. [Google Scholar] [CrossRef]
  11. Zeng, Z.; Zeng, F.; Han, X.; Elkhouchlaa, H.; Yu, Q.; Lü, E. Real-Time Monitoring of Environmental Parameters in a Commercial Gestating Sow House Using a ZigBee-Based Wireless Sensor Network. Appl. Sci. 2021, 11, 972. [Google Scholar] [CrossRef]
  12. Wang, K.; Li, K.; Li, W.; Lin, J.; Lou, Z.; Zhu, X. CFD simulation of indoor hygrothermal environment and particle matter of weaned pig building. Trans. Chin. Soc. Agric. Mach. 2017, 48, 270–278, (In Chinese with English Abstract). [Google Scholar]
  13. Huynh, T.T.T.; Aarnink, A.J.A.; Gerrits, W.J.J.; Heetkamp, M.J.H.; Canh, T.T.; Spoolder, H.A.M.; Kemp, B.; Verstegen, M.W.A. Thermal behaviour of growing pigs in response to high temperature and humidity. Appl. Anim. Behav. Sci. 2005, 91, 1–16. [Google Scholar] [CrossRef]
  14. Carroll, J.A.; Burdick, N.C.; Chase, C.C., Jr.; Coleman, S.W.; Spiers, D.E. Influence of environmental temperature on the physiological, endocrine, and immune responses in livestock exposed to a provocative immune challenge. Domest. Anim. Endocrinol. 2012, 43, 146–153. [Google Scholar] [CrossRef] [Green Version]
  15. Myer, R.; Bucklin, R. Influence of Hot-Humid Environment on Growth Performance and Reproduction of Swine; Institute of Food and Agricultural Sciences, University of Florida: Gainesville, FL, USA, 2018. [Google Scholar]
  16. Vitt, R.; Weber, L.; Zollitsch, W.; Hörtenhuber, S.; Baumgartner, J.; Niebuhr, K.; Piringer, M.; Anders, I.; Andre, K.; Hennig-Pauka, I.; et al. Modelled performance of energy saving air treatment devices to mitigate heat stress for confined livestock buildings in Central Europe. Biosyst. Eng. 2017, 164, 85–97. [Google Scholar] [CrossRef]
  17. Valiño, V.; Perdigones, A.; Iglesias, A.; Garcia, J.L. Effect of temperature increase on cooling systems in livestock farms. Clim. Res. 2010, 44, 107–114. [Google Scholar] [CrossRef]
  18. Xuan, Y.M.; Xiao, F.; Niu, X.F.; Huang, X.; Wang, S.W. Research and application of evaporative cooling in China: A review (I)—Research. Renew. Sustain. Energy Rev. 2012, 16, 3535–3546. [Google Scholar] [CrossRef]
  19. Justino, E.; Nääs, I.; Carvalho, T.; Neves, D.; D’Alessandro Salgado, D. The impact of evaporative cooling on the thermoregulation and sensible heat loss of sows during farrowing. Eng. Agric. 2014, 34, 1050–1061. [Google Scholar] [CrossRef]
  20. Rigo, E.J.; Nascimento, M.; Silva, N. Performance and thermoregulation of lactating sows housed in different locations inside a shed with an evaporative cooling system in a tropical environment. Arq. Bras. Med. Vet. Zootec. 2019, 71, 1750–1758. [Google Scholar] [CrossRef] [Green Version]
  21. Qi, F.; Shi, Z.; Huang, J.; Li, H. Determination of maximum ventilation and evaluation on the performance of the cooling system for commercial piggerys in different climate zones. Trans. Chin. Soc. Agric. Eng. 2021, 37, 202–209, (In Chinese with English Abstract). [Google Scholar]
  22. Wiegert, J.G.; Knauer, M.T.; Shah, S.B. Effect of pad cooling on summer barn environment and finishing pig temperature. J. Anim. Sci. 2017, 95 (Suppl. 2), 35. [Google Scholar] [CrossRef]
  23. Dağtekin, M.; Karaca, C.; Yildiz, Y.; Başçetinçelik, A.; Paydak, Ö. The effects of air velocity on the performance of pad evaporative cooling systems. Afr. J. Agric. Res. 2011, 6, 1813–1822. [Google Scholar]
  24. Cheng, Q.; Feng, H.; Meng, H.; Zhou, H. CFD study of the effect of inlet position and flap on the airflow and temperature in a laying hen house in summer. Biosyst. Eng. 2021, 203, 109–123. [Google Scholar] [CrossRef]
  25. Yi, Q.; Janke, D.; Thormann, L.; Zhang, G.; Amon, B.; Hempel, S.; Nosek, S.; Hartung, E.; Amon, T. Airflow Characteristics Downwind a Naturally Ventilated Pig Building with a Roofed Outdoor Exercise Yard and Implications on Pollutant Distribution. Appl. Sci. 2020, 10, 4931. [Google Scholar] [CrossRef]
  26. Xie, Q.; Ni, J.-Q.; Bao, J.; Su, Z. Correlations, variations, and modelling of indoor environment in a mechanically-ventilated pig building. J. Clean. Prod. 2021, 282, 124441. [Google Scholar] [CrossRef]
  27. Wang, X.; Wu, J.; Yi, Q.; Zhang, G.; Amon, T.; Janke, D.; Li, X.; Chen, B.; He, Y.; Wang, K. Numerical evaluation on ventilation rates of a novel multi-floor pig building using computational fluid dynamics. Comput. Electron. Agric. 2021, 182, 106050. [Google Scholar] [CrossRef]
  28. Seo, I.; Lee, I.; Moon, O.; Hong, S.; Hwang, H.; Bitog, J.; Kwon, K.; Ye, Z.; Lee, J. Modelling of internal environmental conditions in a full-scale commercial pig house containing animals. Biosyst. Eng. 2012, 111, 91–106. [Google Scholar] [CrossRef]
  29. Qin, C.; Wang, X.; Zhang, G.; Yi, Q.; He, Y.; Wang, K. Effects of the slatted floor layout on flow pattern in a manure pit and ammonia emission from pit-A CFD study. Comput. Electron. Agric. 2020, 177, 105677. [Google Scholar] [CrossRef]
  30. Gautam, K.R.; Rong, L.; Iqbal, A.; Zhang, G. Full-scale CFD simulation of commercial pig building and comparison with porous media approximation of animal occupied zone. Comput. Electron. Agric. 2021, 186, 106206. [Google Scholar] [CrossRef]
  31. Wang, X.; Zhang, G.; Choi, C.Y. Evaluation of a precision air-supply system in naturally ventilated freestall dairy barns. Biosyst. Eng. 2018, 175, 1–15. [Google Scholar] [CrossRef]
  32. Rong, L.; Aarnink, A.J.A. Development of ammonia mass transfer coefficient models for the atmosphere above two types of the slatted floors in a pig house using computational fluid dynamics. Biosyst. Eng. 2019, 183, 13–25. [Google Scholar] [CrossRef]
  33. Yeo, U.-H.; Lee, I.-B.; Kim, R.-W.; Lee, S.-Y.; Kim, J.-G. Computational fluid dynamics evaluation of pig house ventilation systems for improving the internal rearing environment. Biosyst. Eng. 2019, 186, 259–278. [Google Scholar] [CrossRef]
  34. Cheng, Q.; Mu, Y.; Li, B. CFD simulation of influence of air supply location on airflow and temperature in stacked-cage hen piggery with tunnel ventilation. Trans. Chin. Soc. Agric. Eng. (Trans. CSAE) 2019, 35, 192–199, (In Chinese with English Abstract). [Google Scholar]
  35. Li, H.; Rong, L.; Zhang, G. Reliability of turbulence models and mesh types for CFD simulations of a mechanically ventilated pig house containing animals. Biosyst. Eng. 2017, 161, 37–52. [Google Scholar] [CrossRef]
  36. Blanes-Vidal, V.; Guijarro, E.; Balasch, S.; Torres, A. Application of computational fluid dynamics to the prediction of airflow in a mechanically ventilated commercial poultry building. Biosyst. Eng. 2008, 100, 105–116. [Google Scholar] [CrossRef]
  37. Bustamante, E.; García-Diego, F.J.; Calvet, S.; Estellés, F.; Beltrán, P.; Hospitaler, A.; Torres, A.G. Exploring Ventilation Efficiency in Poultry Buildings: The Validation of Computational Fluid Dynamics (CFD) in a Cross-Mechanically Ventilated Broiler Farm. Energies 2013, 6, 2605–2623. [Google Scholar] [CrossRef] [Green Version]
  38. Kwon, K.-S.; Lee, I.-B.; Zhang, G.Q.; Ha, T. Computational fluid dynamics analysis of the thermal distribution of animal occupied zones using the jet-drop-distance concept in a mechanically ventilated broiler house. Biosyst. Eng. 2015, 136, 51–68. [Google Scholar] [CrossRef]
  39. Xin, Y.; Rong, L.; Wang, C.; Li, B.; Liu, D. CFD study on the impacts of geometric models of lying pigs on resistance coefficients for porous media modelling of the animal occupied zone. Biosyst. Eng. 2022, 222, 93–105. [Google Scholar] [CrossRef]
  40. Li, H.; Rong, L.; Zong, C.; Zhang, G. Assessing response surface methodology for modelling air distribution in an experimental pig room to improve air inlet design based on computational fluid dynamics. Comput. Electron. Agric. 2017, 141, 292–301. [Google Scholar] [CrossRef]
  41. Li, H.; Rong, L.; Zong, C.; Zhang, G. A numerical study on forced convective heat transfer of a chicken (model) in horizontal airflow. Biosyst. Eng. 2016, 150, 151–159. [Google Scholar] [CrossRef]
  42. Li, H.; Rong, L.; Zhang, G. Study on convective heat transfer from pig models by CFD in a virtual wind tunnel. Comput. Electron. Agric. 2016, 123, 203–210. [Google Scholar] [CrossRef]
  43. Mondaca, M.R.; Choi, C.Y. An Evaluation of Simplifying Assumptions in Dairy Cow Computational Fluid Dynamics Models. Trans. ASABE 2016, 59, 1575–1584. [Google Scholar] [CrossRef]
  44. Zeng, Z.; Dong, B.; Lv, E.; Xia, J.; Wu, P.; Shen, H. Design and experiment of wireless multi-point and multi-source remote monitoring system for pig house environment. Trans. Chin. Soc. Agric. Mach. 2020, 51, 332–340, (In Chinese with English Abstract). [Google Scholar]
  45. Lü, E.; Lu, H.; Wang, G.; Zeng, Z.; Xia, J.; Guo, J.; Wang, Y.; Dong, B.; Wu, P. One Multi-Point Wireless Intelligent Monitoring System and Method for Livestock and Poultry Breeding Environmental Parameters. China Invention Patent CN201910281334.3, 9 April 2019. [Google Scholar]
  46. Lü, E.; Lu, H.; Wang, G.; Zeng, Z.; Xia, J.; Guo, J.; Wang, Y.; Dong, B.; Wu, P. One Environment Multi-Source Information Sensing and Early Warning System and Method. China Invention Patent CN201910281348.5, 9 April 2019. [Google Scholar]
  47. Xie, R.; Tang, H.; Tao, W.; Liu, G.; Liu, K.; Wu, J. Optimization of cold-plate location in refrigerated vehicles based on simulation and test of no-load temperature field. Trans. Chin. Soc. Agric. Eng. (Trans. CSAE) 2017, 33, 290–298, (In Chinese with English Abstract). [Google Scholar]
  48. Guo, J.; Wei, X.; Du, X.; Ren, J.; Lü, E. Numerical simulation of liquid nitrogen injection in a container with controlled atmosphere. Biosyst. Eng. 2019, 187, 53–68. [Google Scholar] [CrossRef]
  49. Lin, J.; Liu, J.; Meng, Q.; Lei, M.; Tong, Y.; Gao, Y. Numerical CFD simulation and verification of summer indoor temperature and airflow field in boar building. Trans. Chin. Soc. Agric. Eng. (Trans. CSAE) 2016, 32, 207–212, (In Chinese with English Abstract). [Google Scholar]
  50. Cheng, X.; Mao, H.; Ni, J. Numerical prediction and CFD modeling of relative humidity and temperature for greenhouse-crops system. Trans. Chin. Soc. Agric. Mach. (Trans. CSAM) 2011, 42, 173–179, (In Chinese with English Abstract). [Google Scholar]
  51. Liu, Y.; Zeng, Z.; Guo, J.; Lü, E.; Meng, Q. Numerical simulation and experimental verification of effect of CO2 enrichment on flow field of greenhouse. Trans. Chin. Soc. Agric. Eng. (Trans. CSAE) 2015, 31, 194–199, (In Chinese with English Abstract). [Google Scholar]
  52. Zeng, Z.; Wei, X.; Lv, E.; Liu, Y.; Yi, Z.; Guo, J. Numerical simulation and experimental verification of temperature and humidity in centralized ventilated delivery pigsty. Trans. Chin. Soc. Agric. Eng. (Trans. CSAE) 2020, 36, 210–217, (In Chinese with English Abstract). [Google Scholar]
  53. Guo, J.; Liu, Y.; Lü, E. Numerical Simulation of Temperature Decrease in Greenhouses with Summer Water-Sprinkling Roof. Energies 2019, 12, 2435. [Google Scholar] [CrossRef]
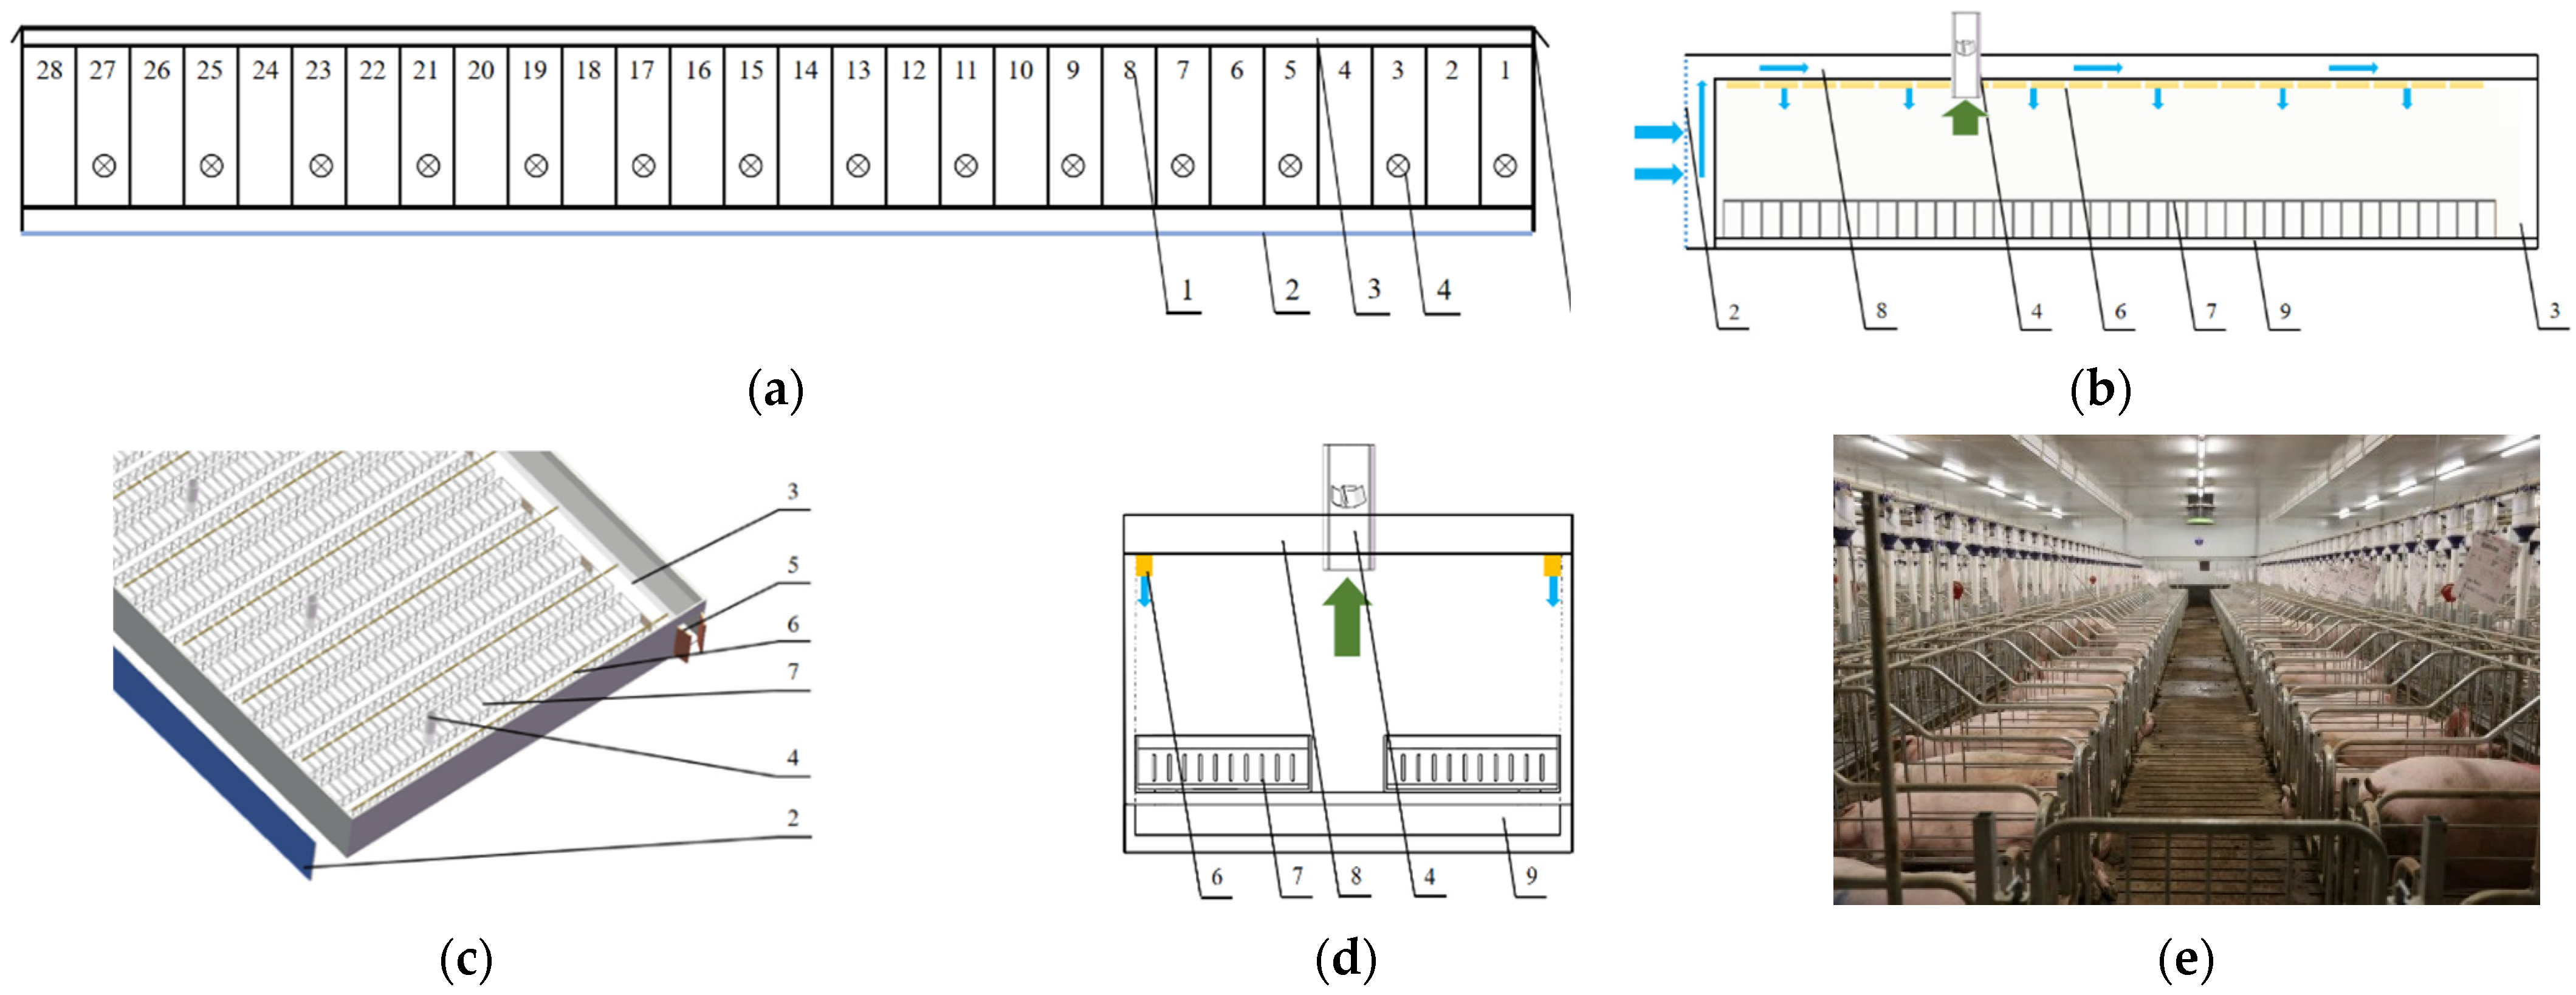
Figure 1. Pregnant sow piggery layout: (a) piggery plane graph; (b) piggery air distribution profile; (c) graphic model of piggery interior; (d) schematic diagram of piggery transverse section; (e) transverse section image of piggery. Note: 1. number of pregnancy units; 2. wet curtain; 3. aisle; 4. frequency conversion fan; 5. door; 6. air intake; 7. limit column; 8. ceiling cavity; 9. manure pit.
Applsci 12 11556 g001
Figure 2. Schematic diagram of sensor layout in the pregnant sow piggery. Note: Height of nodes No. 0–13 in the figure is 150 cm; height of nodes No. 16–34, 37, and 38 is 60 cm; height of nodes No. 14, 15, 39, 40, 42, and 47 is 150 cm; height of nodes No. 43 and 44 behind the wet curtain is 100 cm; height of nodes No. 44 and 45 outdoors is 100 cm.
Applsci 12 11556 g002
Figure 3. Location map for the pig body surface comfort test (unit: m).
Applsci 12 11556 g003
Figure 4. Piggery model: (a) piggery model drawing; (b) grid model.
Applsci 12 11556 g004
Figure 5. Measured value compared with simulated value: (a) comparison of measured and simulated temperature; (b) comparison of measured and simulated humidity.
Applsci 12 11556 g005
Figure 6. Temperature distribution in different (a) longitudinal and (b) horizontal sections; (c) temperature gradient variation in different horizontal sections.
Applsci 12 11556 g006aApplsci 12 11556 g006b
Figure 7. Humidity distribution in different (a) longitudinal and (b) horizontal sections.
Applsci 12 11556 g007
Figure 8. Velocity distribution in different (a) longitudinal and (b) horizontal sections.
Applsci 12 11556 g008
Figure 9. Airflow distribution of (a) temperature, (b) humidity, and (c) velocity in longitudinal sections and of (d) temperature, (e) humidity, and (f) velocity in horizontal sections.
Applsci 12 11556 g009aApplsci 12 11556 g009b
Figure 10. Effect of different velocities on (a) temperature and (b) relative humidity.
Applsci 12 11556 g010
Figure 11. Difference in body surface comfort of pigs under different velocities.
Applsci 12 11556 g011
Table 1. Technical parameters of the sensors.
NameType/CompanyRange/Precision
Thermal anemometertesto 425
Teto Group, German
0–20 m/s
0.03 m/s + 5%
ThermohydrographCENTER 310
Taiwan Qunte Co., Ltd, China
−20–60 °C
0–100%
Thermal imagerFLIR T400
Phil Corporation, America
−20–120 °C
Sensitivity < 0.045 °C
Table 2. Boundary condition settings.
Boundary ConditionBoundary TypeOptionNumerical Value
Building envelopeNon-slip boundaryTemperatureCeiling: 26.8 °C
Floor: 22.3 °C
Wall: 26.8 °C
Pregnant pigNon-slip boundaryTemperature37.5 °C
Air intakeVelocity inletVelocity0.197 m/s
Temperature21.1 °C
Relative humidity99%
Mass reaction0.0156
Fan exportPressure outletTemperature
Humidity
Mass fraction
23.7 °C
70%
0.0109
Table 3. Results for comparison of the two outlet positions.
Outlet PositionAverage Temperature [°C]Temperature Non-Uniformity CoefficientAverage HumidityHumidity Non-Uniformity Coefficient
Original location24.710.09180.62%0.098
Middle24.890.08679.76%0.127
Publisher’s Note: MDPI stays neutral with regard to jurisdictional claims in published maps and institutional affiliations.