Article

Probabilistic Model of Drying Process of Leek

1
Institute of Mechanical Engineering, Warsaw University of Life Sciences, 02-787 Warsaw, Poland
2
Faculty of Agriculture and Biotechnology, Bydgoszcz University of Science and Technology, 85-796 Bydgoszcz, Poland
3
Institute of Wood Sciences and Furniture, Warsaw University of Life Sciences, 02-787 Warsaw, Poland
4
Institute of Economics and Finance, Warsaw University of Life Sciences, 02-787 Warsaw, Poland
*
Author to whom correspondence should be addressed.
Appl. Sci. 2022, 12(22), 11761; https://doi.org/10.3390/app122211761
Submission received: 17 October 2022 / Revised: 16 November 2022 / Accepted: 17 November 2022 / Published: 19 November 2022
(This article belongs to the Special Issue Applications of Computer Science in Agricultural Engineering)

Abstract

:
Convective drying is the most common drying method, and mathematical modelling of the dewatering process is an essential part of it, playing an important role in the development and optimization of drying devices. Modelling of the leek drying process can be difficult as the specific structure of this vegetable, in which the slices of leek are delaminated into uneven single rings at different times during drying and the material surface changes more than in other vegetables. This study aimed at proposing a theoretical model for leek convective drying, based on the theoretical laws of heat and mass exchange, which should take into account the observed random process disturbances in the form of random coefficients of this model. The paper presents a non-linear model of water content changes with a random coefficient n. Values of the coefficient n, which were considered to be a random variable, were obtained using the Monte Carlo method, using the inversed distribution function as a probabilistic method. The non-linear model of water content changes when a random n coefficient gives a good approximation of the measurements of water content changes to approximately 1–2 kg H2O/kg d.m.

1. Introduction

Food drying is one of the oldest and most effective ways of processing agricultural products (vegetables, fruits). It can be carried out using various methods, such as: drying in the sun [1], convective drying [2] (which is the most common), microwave drying [3], vacuum drying [4] or infrared drying [5] and also combinations of these methods. Drying is a process of the simultaneous diffusion of water from the material and the transfer of heat into the material in order to reduce the moisture content, as well as the water and microbiological activity in the material. This, in turn, extends the durability period of dried products [6,7]. An essential aspect of the drying process is its mathematical modelling, which provides tools for predicting the rate and efficiency of drying under various conditions [8].
Leeks (Allium ampeloprasum L.) have a different structure than, for example, root vegetables, and behave slightly differently during drying. They are dried in the form of slices, which can be treated as solid cylinders at the beginning of drying. During drying, due to the more intensive water exchange through the cross-sectional surface and the drying shrinkage [9,10], the slices delaminate into single rings. Therefore, the phenomenon of uneven heating of the slices, due to the penetration of heat into the dried particles, also occurs. It is difficult to determine the extent to which the drying process is influenced by the dominant external or internal exchange conditions because the heat and mass transport in the cut particles depends largely on the condition and type of its surface. The above considerations make it difficult to formulate models for the leek drying process and to verify them with a satisfactory accuracy in a wide measuring range.
Leek, alongside carrot, celery and parsley, is one of the basic ingredients of mirepoix. Similar to garlic and onion, leek belongs to the Allium genus. Leek has many uses, mainly in medicine and cooking, and is consumed as a vegetable and medicinal herb [11]. It is rich in nutrients, such as vitamins (A, B, C, K), minerals (calcium, iron, potassium, magnesium) and folic acid [12,13]. Leek has many pro-health properties, is a source of bioactive and chemo-protective compounds [14,15,16], has antibacterial and antioxidant activities [13,17,18,19], reduces the risk of gastrointestinal diseases [11] and cancer [20,21] and the health benefits from their consumption are confirmed [11,14,21,22,23]. Dried leek powder can be added to wheat pasta [24,25].
In the literature, there is a lot of research referring to the modelling of drying of agricultural products; however, issues relating to the drying of vegetables and fruits are still extensively researched. Many authors describe drying kinetics of fruits and vegetables such as: apple [26,27,28], orange [29], peach [30], pineapple, mango [31,32], banana [28], apple pomace [33], carrot [34,35,36], parsley [37,38] celery [39,40], red beet [41,42], tomato [31,43,44], onion [31,37,45], garlic [46,47,48], pumpkin [49,50], courgette [51] and others. However, the studies on analysis of leek drying process are very scarce. Only a few researchers have studied the drying process of leek, namely, through: convection drying [40,52,53], microwave heat treatment [54], vacuum drying [55].
Mathematical models used to describe the drying of agricultural products can be divided into three categories: theoretical models, semi-theoretical models and empirical models. Theoretical models are based on the overall laws of heat and mass transfer and can explain phenomena taking place during drying [56,57]. Authors describe the drying process of biological materials in different ways and they use models of only the second period, only the first drying period or the first and then the second drying period [58].
In the studies on the leek drying process, researchers used semi-empirical models, in which only the conditions of internal water diffusion onto the body’s surface play a decisive role [40,52,53].
The goal of this work was to formulate an explanation of convective drying process of the leek, based on the laws of physics (heat and mass transfer), which should take the form of a deductive model, taking into account the observed random disturbances of the process, in the form of random coefficients of this model. The research hypothesis was put forward in paper: “Leek is a product with a high initial water content; therefore, from the beginning of its drying, the process will be determined by the conditions of external heat and mass exchange. The deductive model of water content changes in leek slices should contain random coefficients”.

2. Materials and Methods

2.1. Materials

Leeks purchased on the local market, originating from the same source, were used for the research. The leek stalks were washed and cut into slices (treated as solid cylinders) 4, 8 and 12 mm thick, using a cutting machine. In order to determine changes in the leeks’ water content, changes in the mass of the samples were examined. The measurements were carried out in a laboratory dryer, KCW-100 (Poland) [59], at five drying temperatures: 40, 50, 60, 70 and 80 °C. In a few cases, the leek samples were separated into single cylinders and were dried in this way from the beginning. Each measurement was repeated 3 times. The initial mass of the sample was approximately 100 g. The air velocity in the dryer was less than 0.01 m/s, which means that the leek slices dried under natural convection conditions. During drying, the mass of the sample was recorded using computer software, until the moment when the mass did not change.
The water content was determined from the formula:
u = ( M M s ) M s  
where Ms (dry mass) was determined by the dryer-weight method in accordance with the standard (PN-EN 13183-1: 2004) by drying the samples at 105 °C, until the dry mass was obtained.
The initial water content of the leeks ranged between 7 and 11 kg H2O/kg d.m. (from 88 to 92% w.b.).

2.2. Mathematical Modelling of Drying Process

According to convection drying theory, the dehydration of materials with a high initial water content, in the first period of drying, is determined by the conditions of external heat and mass exchange. Therefore, changes in the water content of leek (from the initial water content to the critical one) can be described by the model that results from solving the heat balance equation [60]. A theoretical model of the drying rate is a solution to the differential equation:
d u d τ = A ( u ) α M s r ( t t A )
where: u is the water content of dried product (kg H2O/·kg dry matter); τ is the drying time (min); A is the surface area of dry product (m2); α is the heat transfer coefficient (kJ/m2 min K); r is the heat of water vaporization (kJ/kg); t is the drying air temperature (°C); tA is the surface temperature of dried material (°C).
In the case of an anisotropic contraction of the body, the surface changes can be described by the relationship [61]:
A ( u ) = A 0 1 b u u 0 + b 2 / 3 n
where b is shrinkage coefficient and can be calculated from the formula:
b = ρ 0 ρ s ( 1 + u 0 ) 0.85 1 + u 0
where ρ is density of solid particle (kg/m3).
By entering the drying rate coefficient designation k0 as:
k 0 = α A 0 r M s t t A = d u ( τ ) d τ
and integrating the Equation (2), the non-linear theoretical model of the kinetics of convective drying of vegetables was obtained, based on theory of drying solid bodies, which can describe the drying process until the water content reaches a critical value:
u τ = u 0 1 1 b 1 1 b N u 0 k 0 τ N b 1 b
where N is equal 3n/(3n − 2). The value of exponent N in Equation (6) was selected empirically for the measurement of changes in water content to ensure the model approximated the measurement results as closely as possible. First, the coefficient n was selected, then the coefficient N was calculated. The measure of model fit was a relative error not greater than 5%.
A pseudorandom number generator in the Excel package was used to simulate the random coefficient in the model (6).

3. Results and Discussion

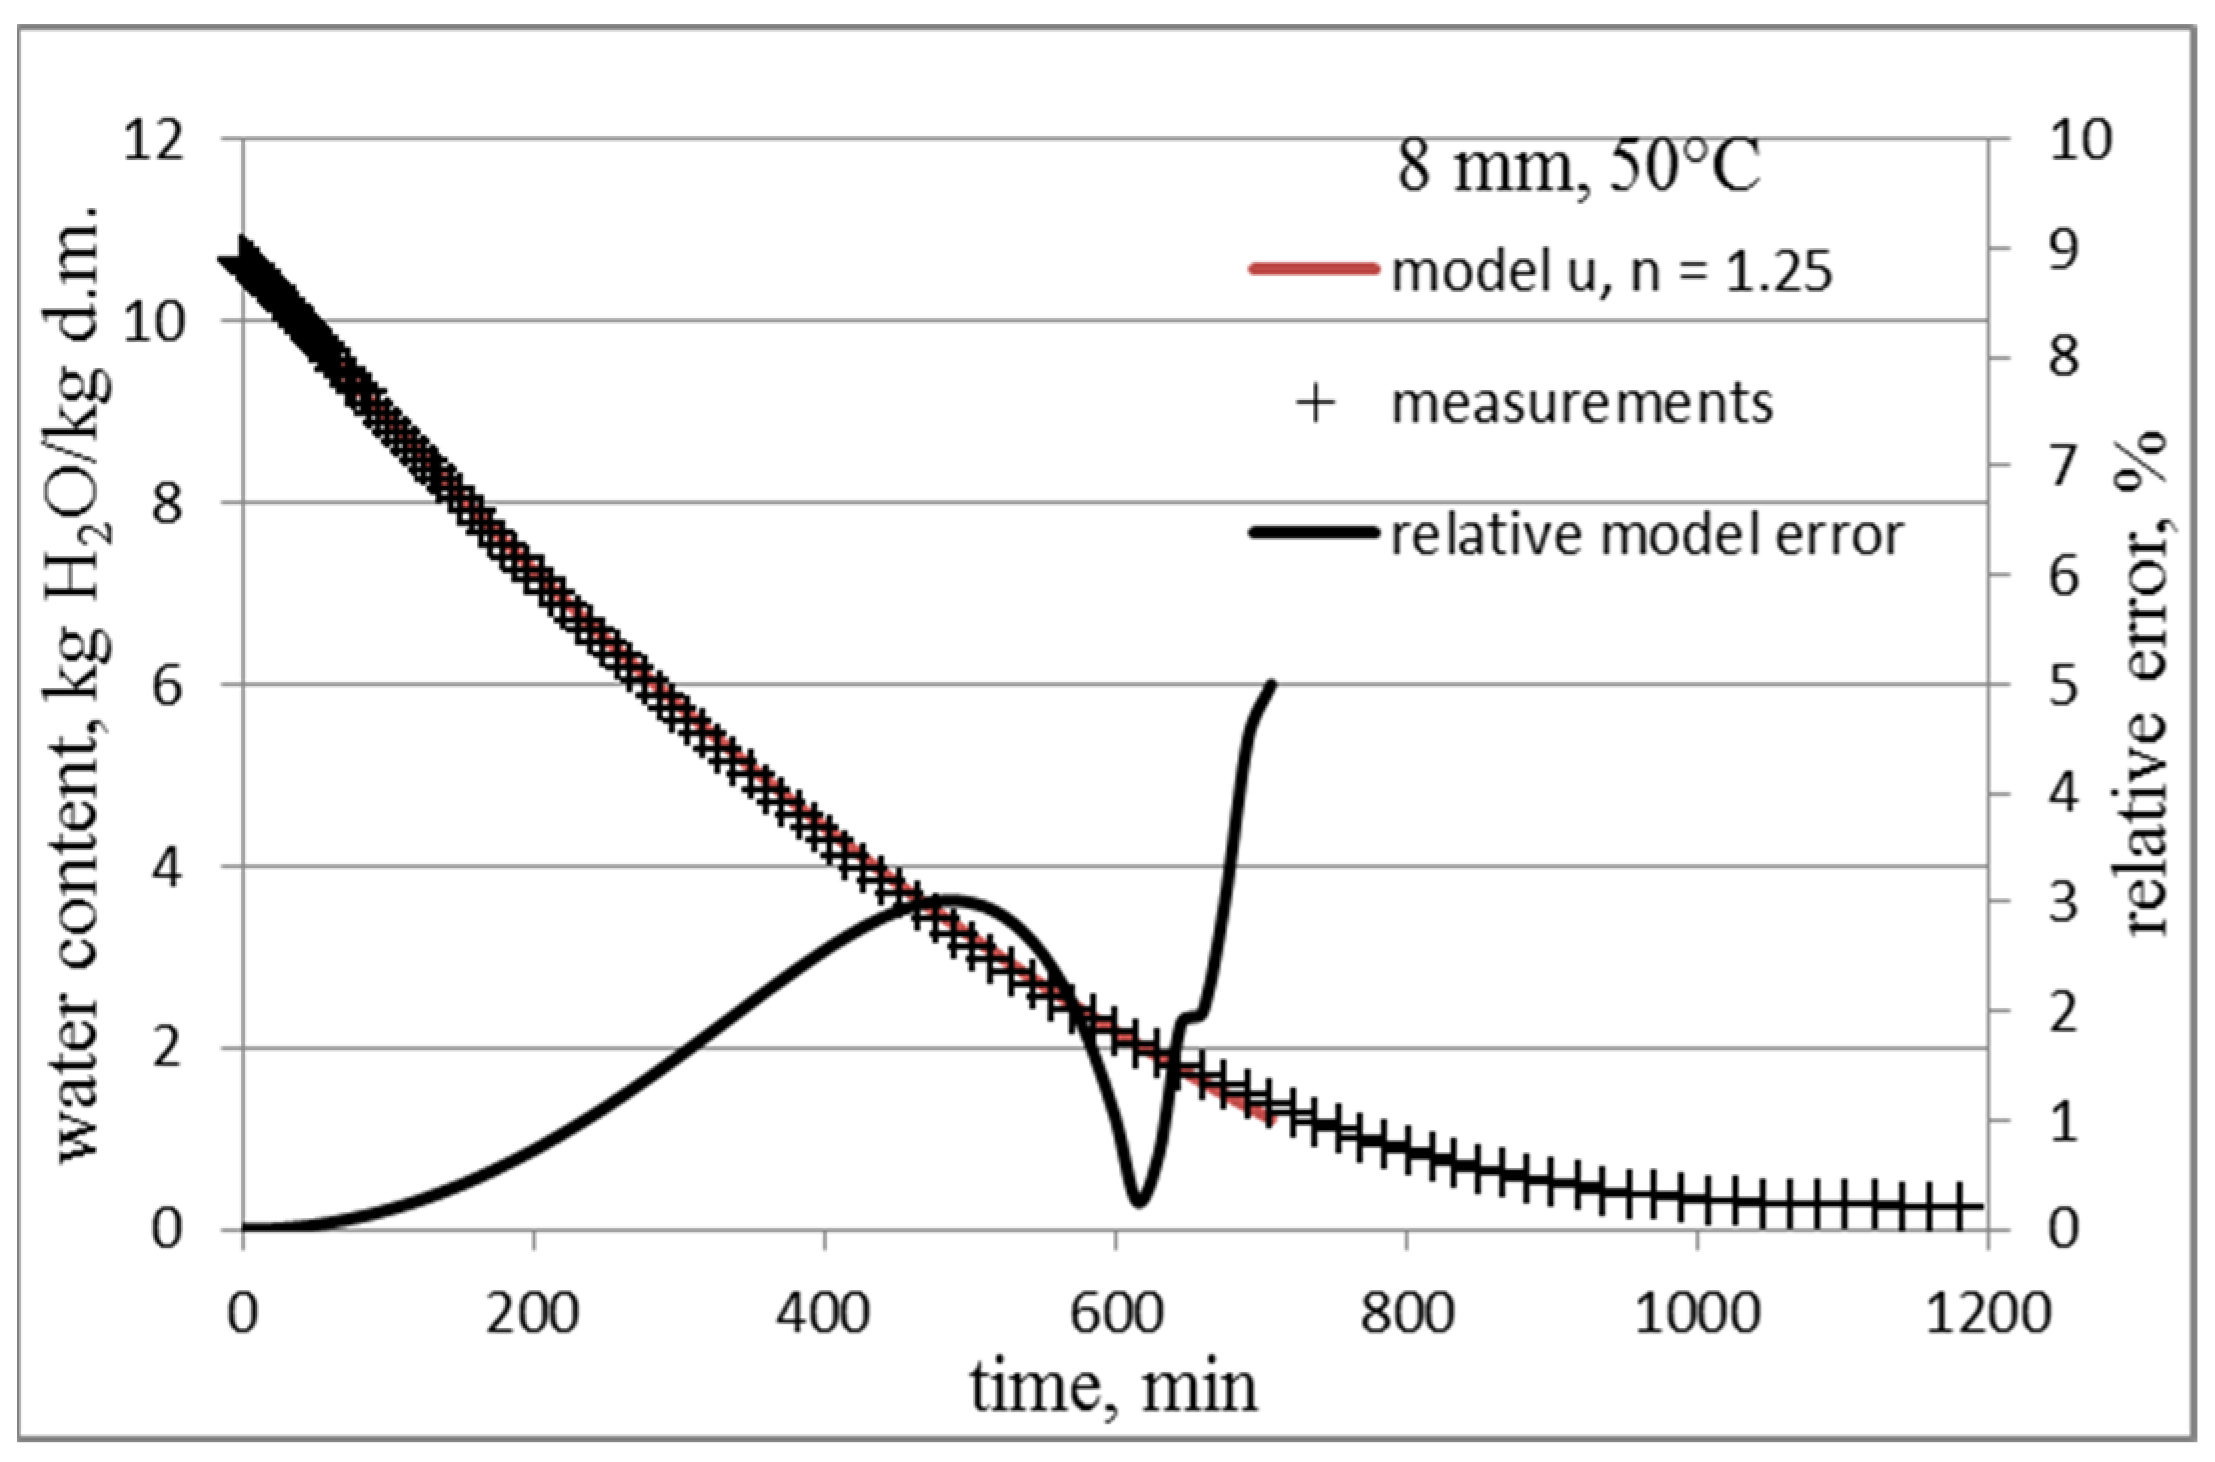
For each measurement of water content changes, the coefficient n of the model (6) was selected; therefore, the relative model error did not exceed 5%. Figure 1, Figure 2 and Figure 3 show the exemplary models of the changes in water content (6) during the drying process of leek, for selected drying temperatures and three thicknesses of slices, with an empirically selected coefficient n.
Model (6), presenting the changes in water content, describes the results of the empirical measurements of water content, from the initial to the critical value, i.e., up to approximately 1–1.5 kg H2O/kg d.m. (with a relative error of less than 5%).
The exponent n in Equation (3) allows us to determine the relationship between the change in the area of the dried material and the change in its volume. If every single particle of dried material would shrink like a perfect isotropic body, then n = 1, consequently N = 3. Any other values of the coefficient n determined by fitting the theoretical model (6) to the measurement results indicate that the dried particles change their shape and their surface ceases to be smooth. The corrugation of the surface means that the surface shrinkage is smaller than the volume shrinkage, resulting in the coefficient n ≠ 1. This was the case for the leeks, where selected values of the coefficient n were different from 1, both smaller and larger.

3.1. Determining the Value of the n Coefficient of the Model

Table 1 presents all of the empirically selected values of the n coefficient and the calculated N coefficient of the model (6) for all of the measurements of water content changes, for the indicated drying temperatures, and for the thickness and type of leek slice (solid cylinder; not separated slice, symbol “ns” in table; separated slice, symbol “s”).
As can be seen, the values of the empirically determined coefficient n are both greater and less than 1; therefore, N may be greater or less than 3. In other studies, where this model (6) was used, the empirical coefficient n was usually taken as greater than or equal to 1, i.e., 1 ≤ N ≤ 3, e.g., for carrot [59], pumpkin [62], parsley [63], chokeberry [64], apple pomace [33].
In the case of drying leek slices, for all of the measurements of water content changes, the value of the coefficient n was ranged between 0.67 and 7; therefore, coefficient N can range between 1.11 and 201, and theoretically go to infinity [61].
When analysing the values of the n and N coefficients, it is not possible to find any dependence on the geometrical features of the leek slices in the dried samples or on the parameters of the drying process. In more cases, the coefficient n is below unity (N > 3), and only for some samples (especially thin slices) the coefficient n is greater than 1 (N < 3). It can be considered that the values of the n coefficient (and therefore also N) are random. Therefore, we decided to define its probability distribution.
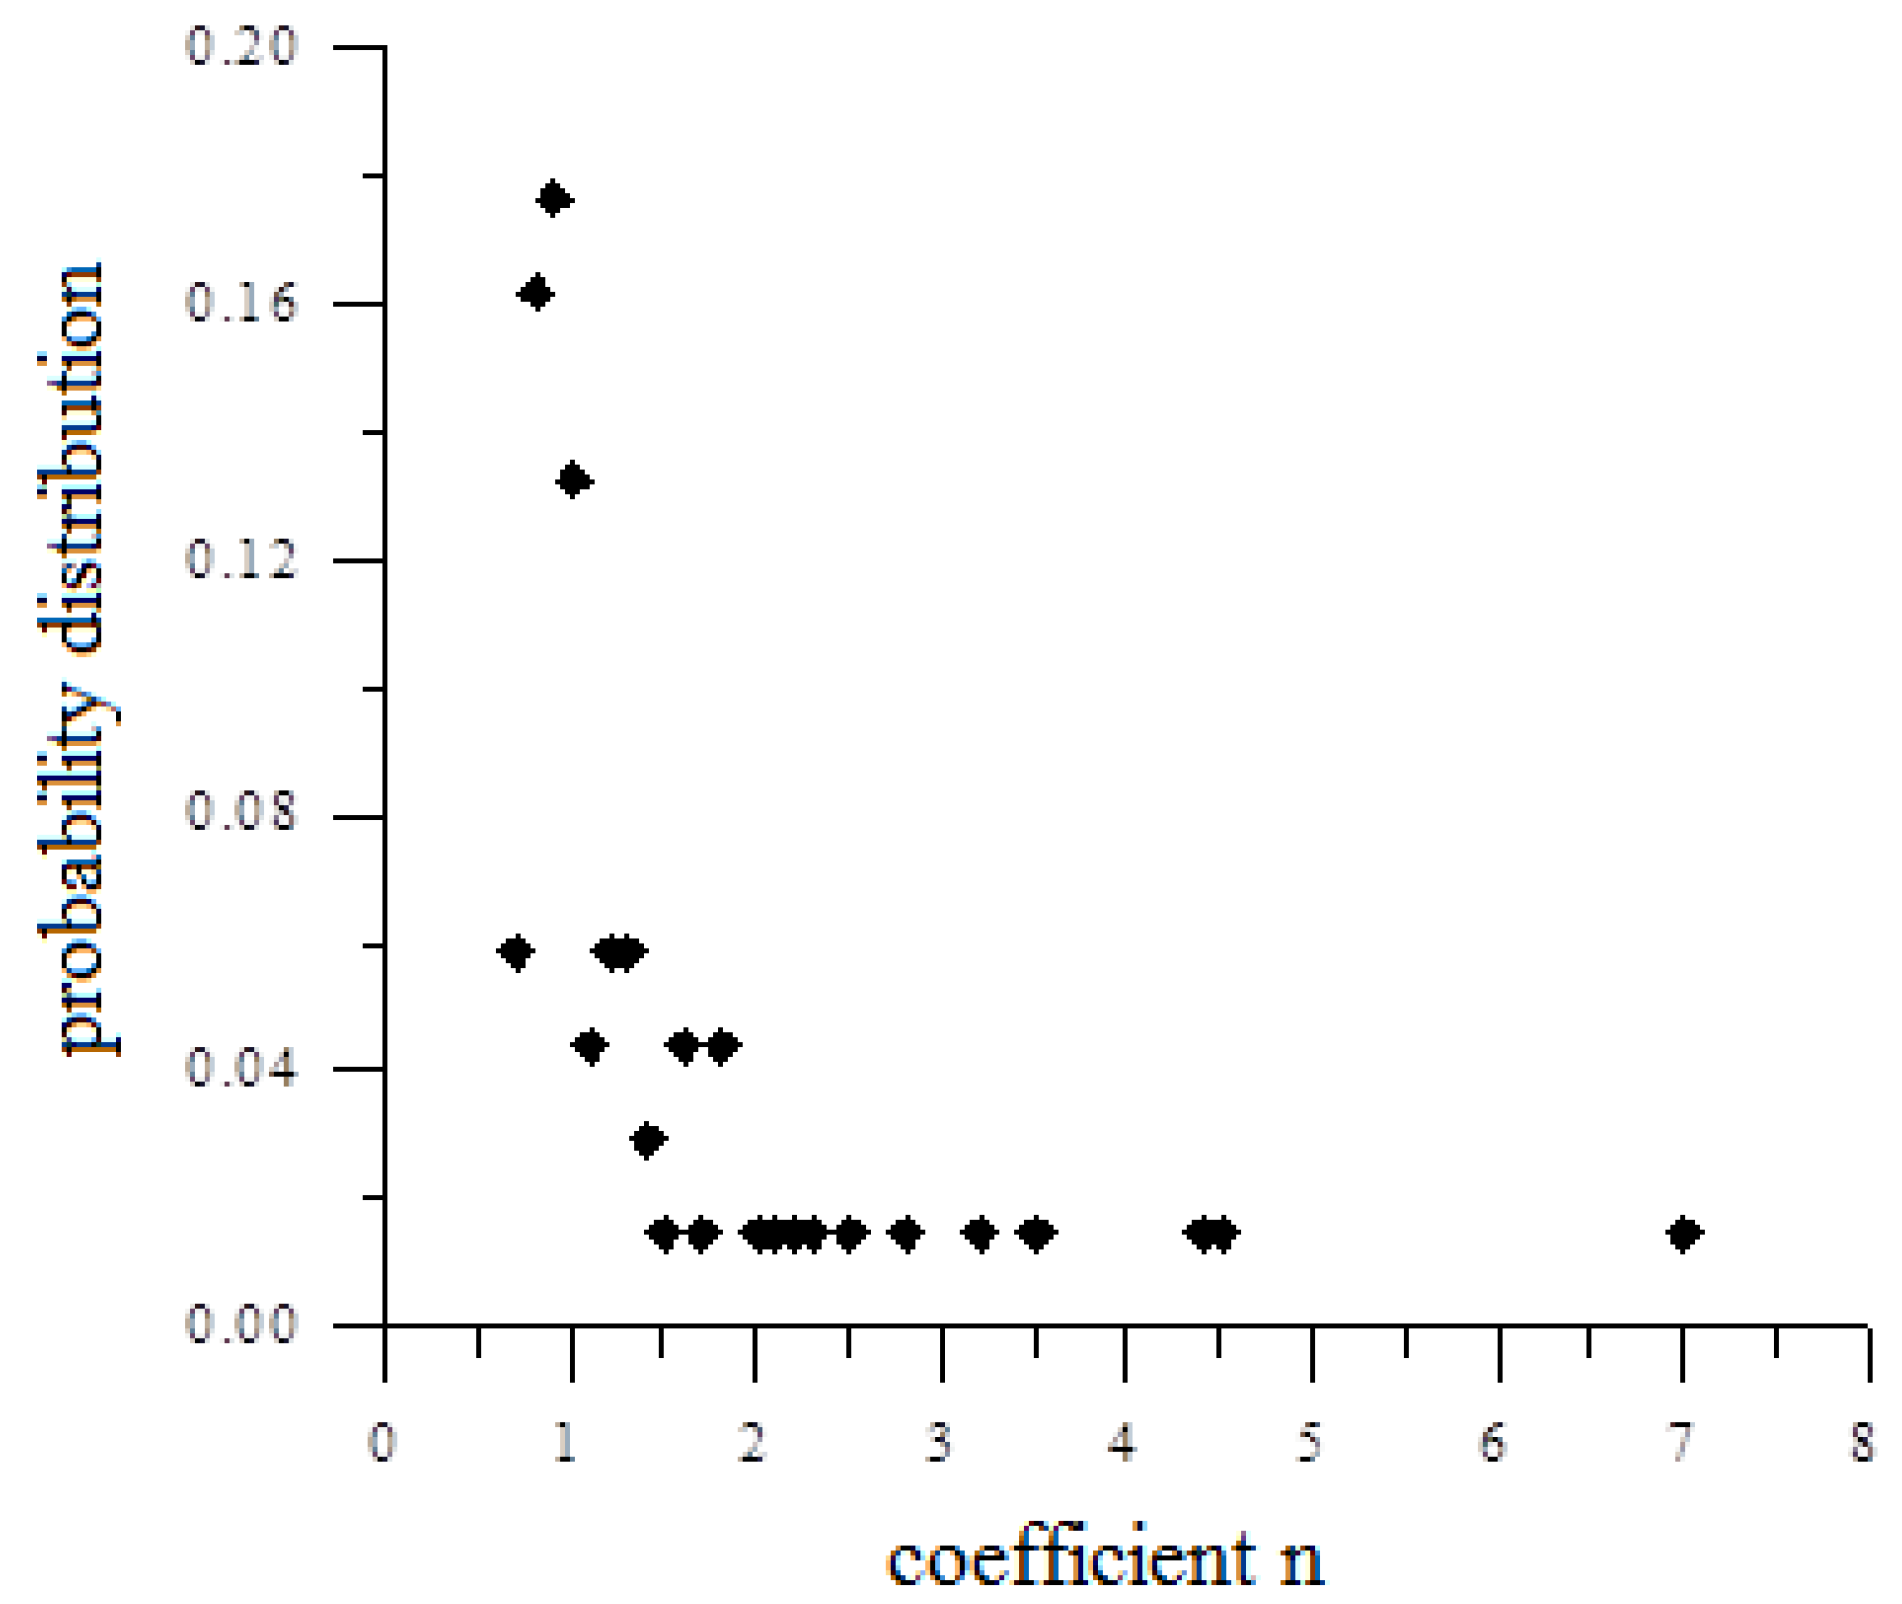
The frequency of occurrence of the n coefficient was calculated in intervals of equal size. It was assumed that the mean value n coefficient from a given interval is a random variable, the probability of which corresponds to the frequency of receiving values belonging to this interval by the coefficient n. The graph of frequency p(n) is shown in Figure 4.
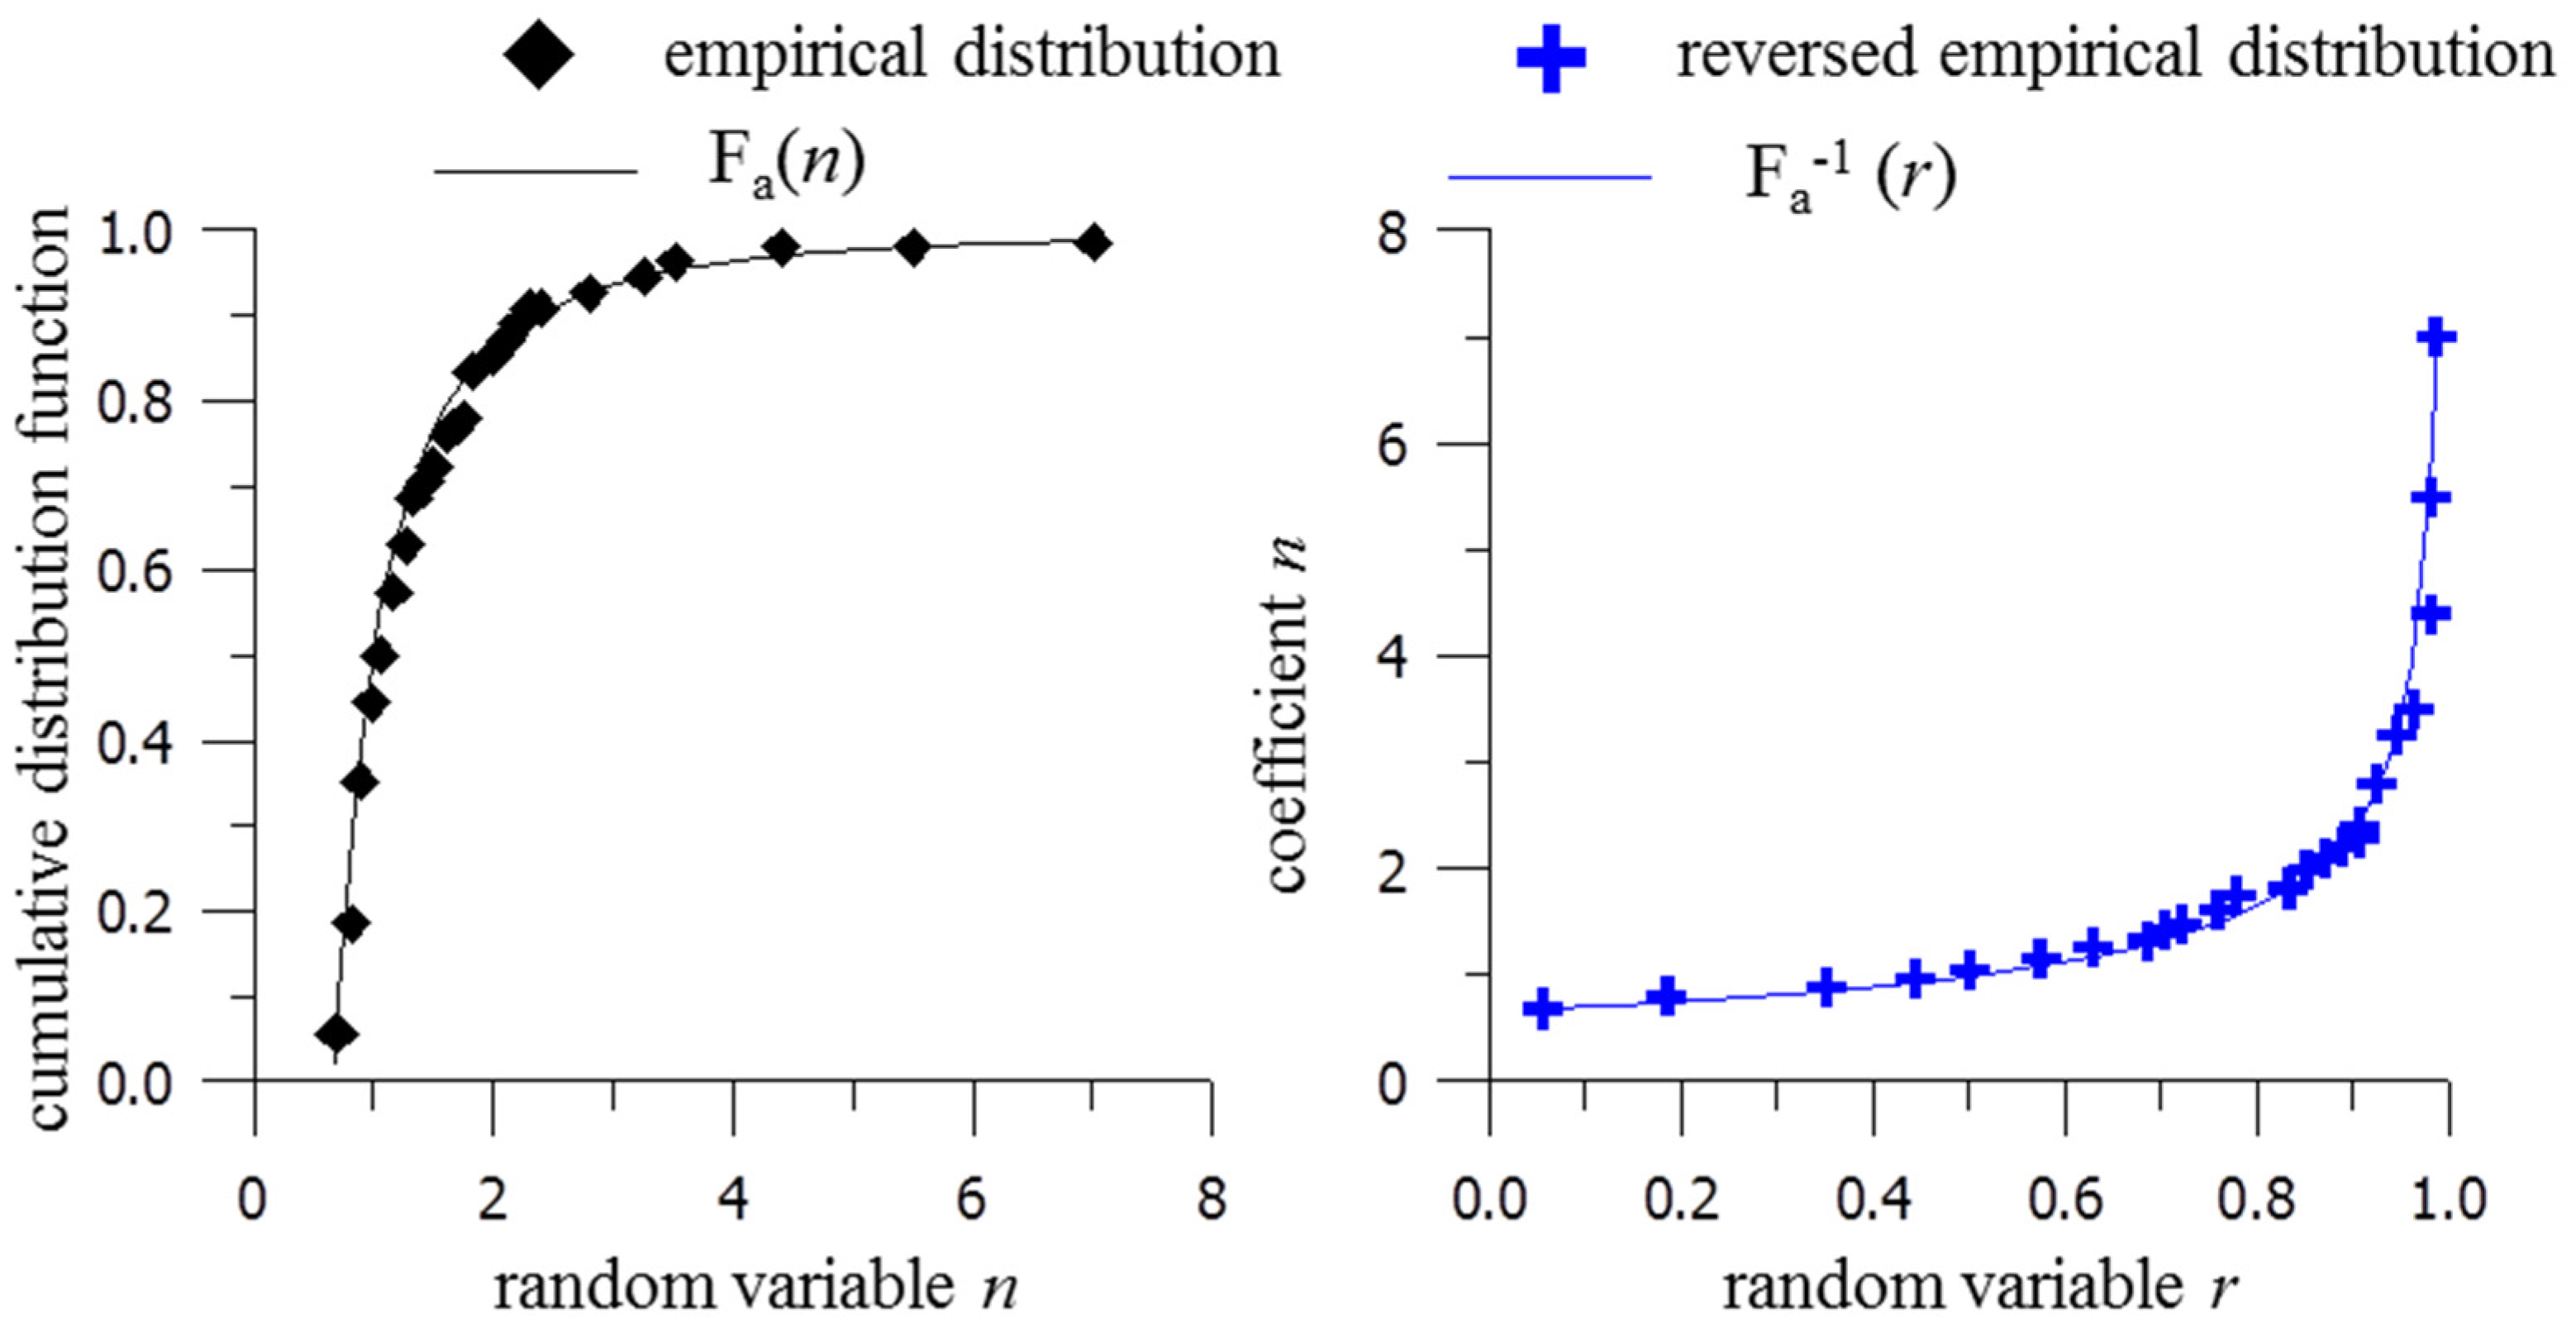
With the empirical probability distribution, it is possible to calculate the cumulative distribution function of the random variable. Values of the coefficient can be generated using the Monte Carlo method, using the inversed cumulative distribution function method. Monte Carlo methods are a class of computational algorithms that rely on repeated random sampling to obtain numerical results [65].
Once the distribution function of the empirical distribution of the coefficient n was known, an attempt was made to describe this distribution with one of the known theoretical distributions. Among others, the log-normal distribution and the Weibull distribution were tested; however, they were not sufficiently consistent with the empirical distribution tested. Therefore, we decided to select empirically the function approximating the distribution of the variable n.
The best fit was obtained using the hyperbolic function with selected coefficients:
F a ( n ) = 1 2 3 ( n p ) c
for which the inverse function was found:
F a 1 ( r ) = 2 3 ( 1 r ) 1 / c p
where c, p are numerical coefficients of the empirical cumulative distribution, r is a random variable with a uniform distribution in the interval [0, 1).
The cumulative and reversed distribution functions for the relationship p(n) with approximating function are presented at Figure 5.
The values of the n coefficient can be read from the inverse cumulative distribution function. Thus, the formula of the approximating function (8) can be identified to be a random generator and used to determine the value of n as a result of a random experiment. Such an experiment consists of randomizing a random variable r belonging to the interval (0,1) from the uniform distribution, and then calculating the value of function (8), which is a random value of the coefficient n. Then, this value was entered into the model of water content (6).

3.2. Models of Water Content Changes with Random Coefficient

Using the simulation of the value of the n coefficient, various models of water content changes were obtained for the same drying parameters.
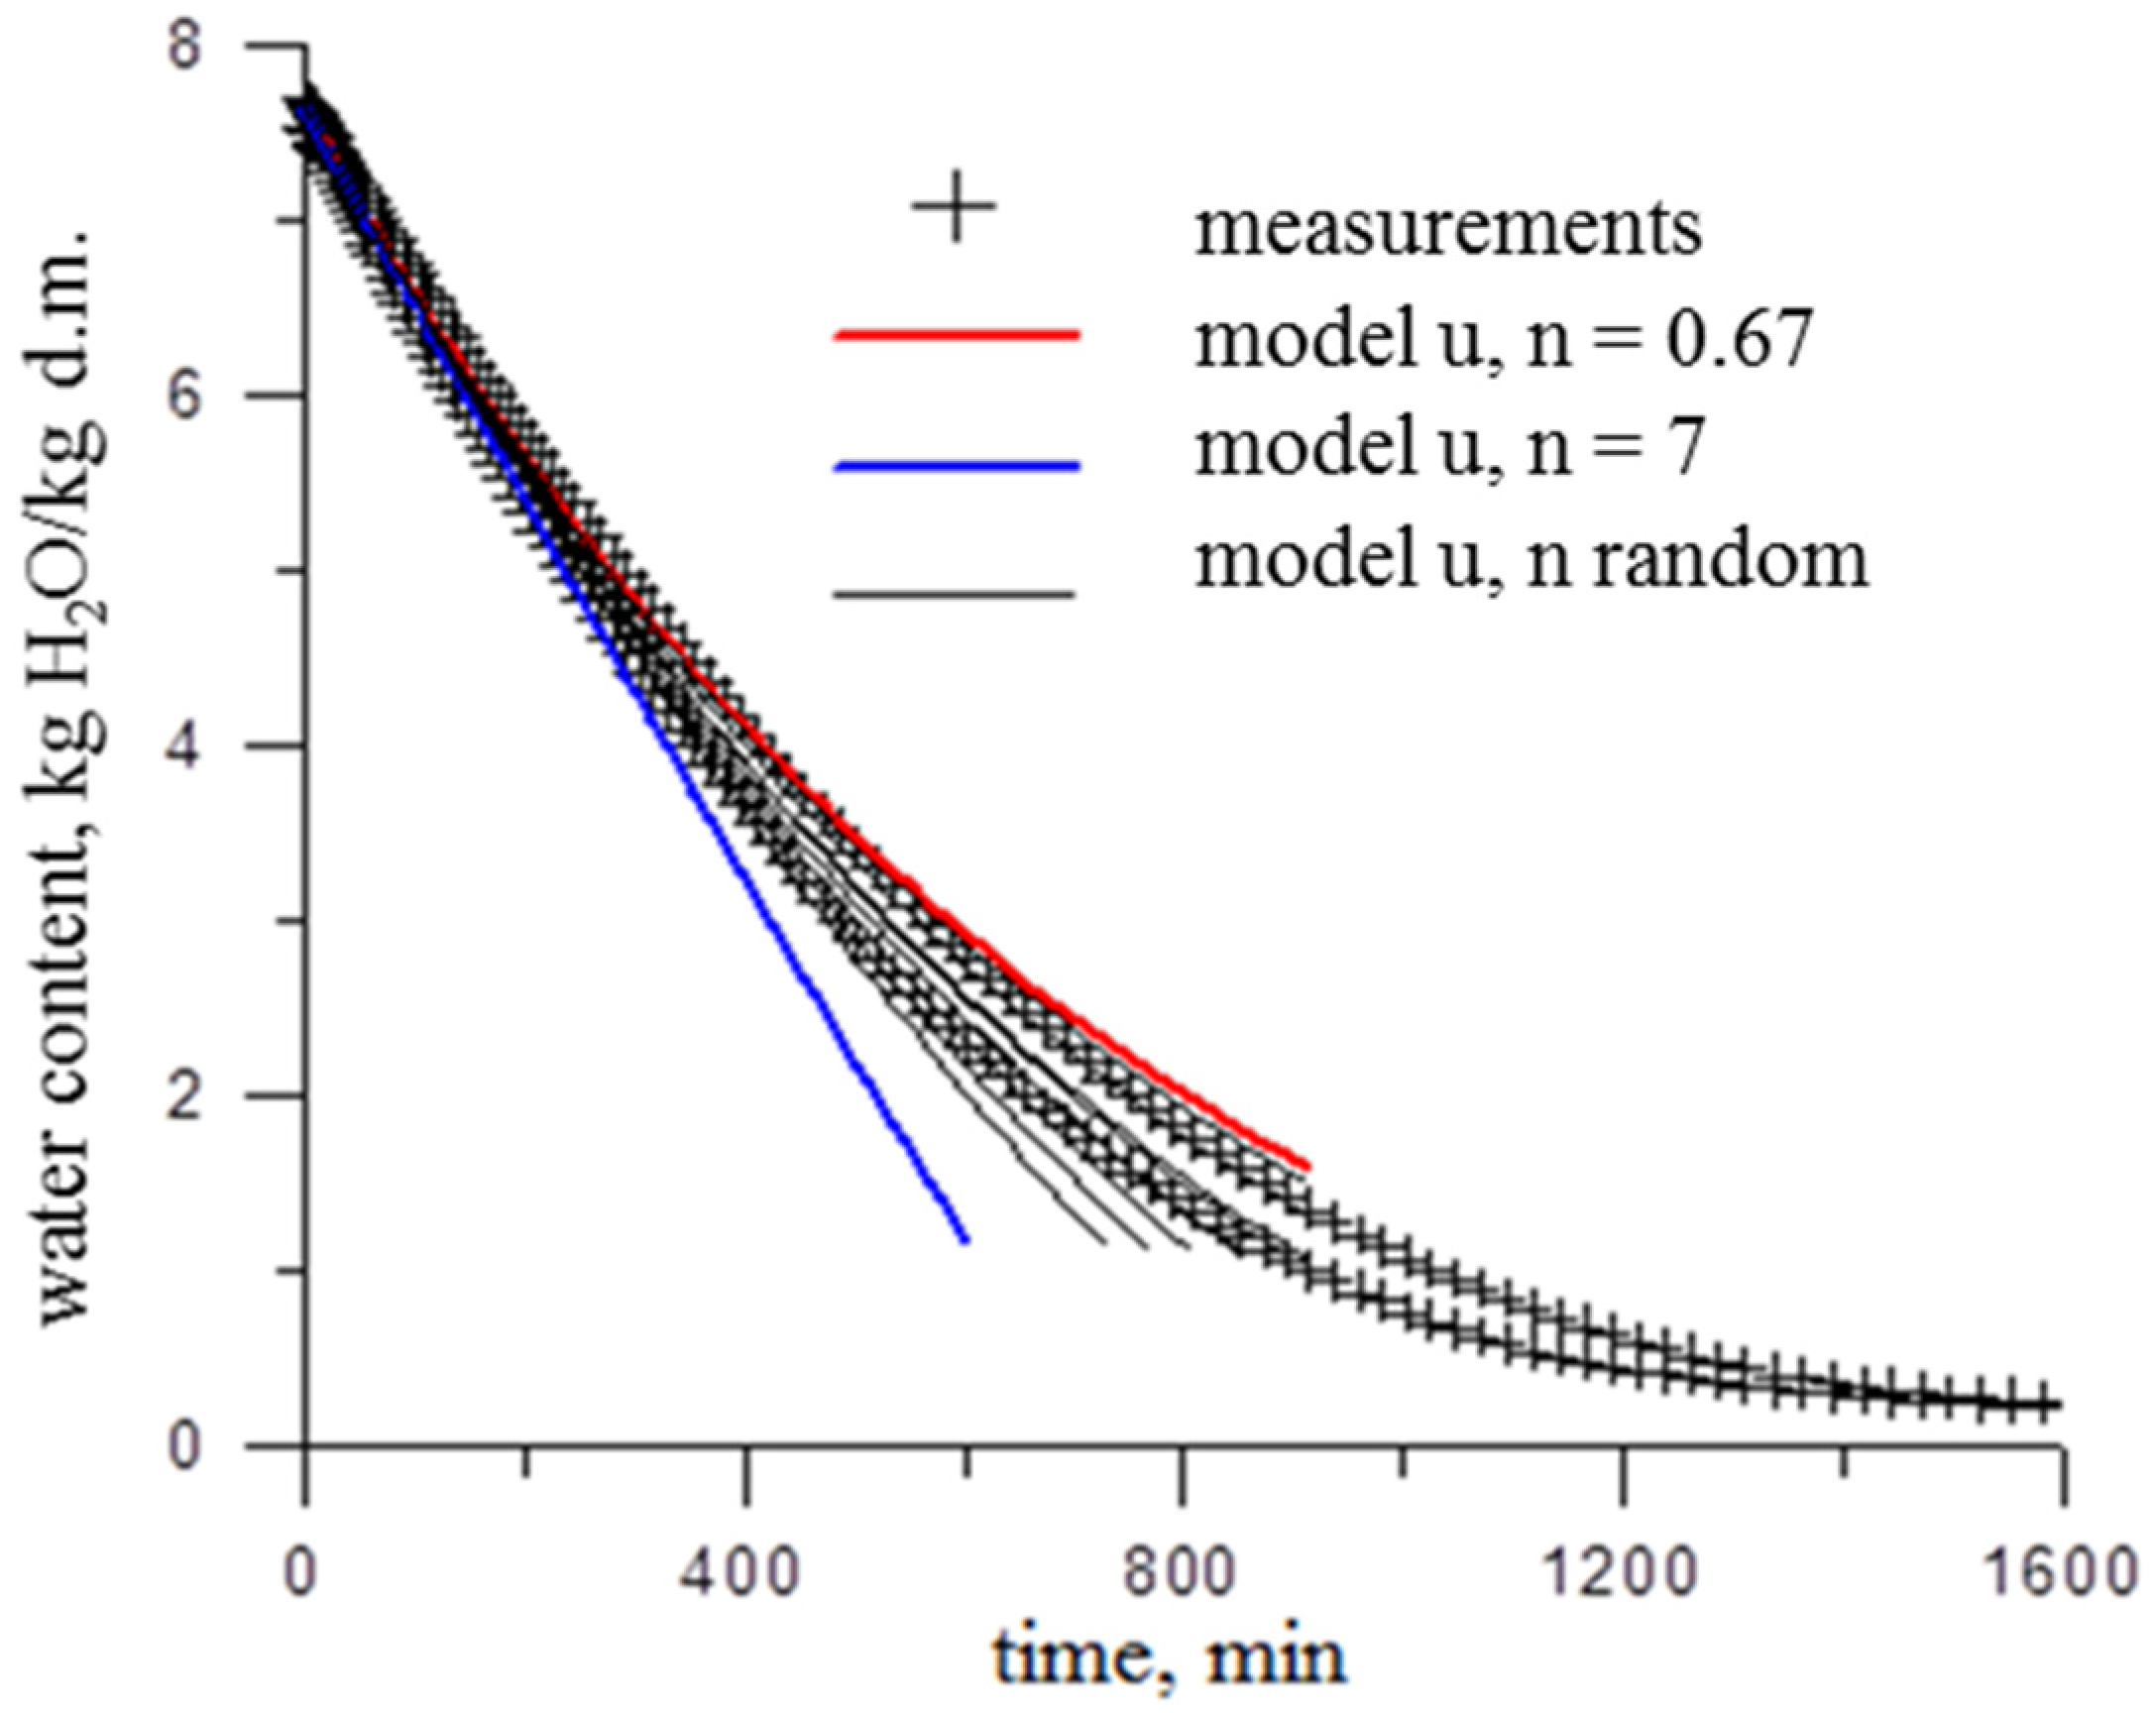
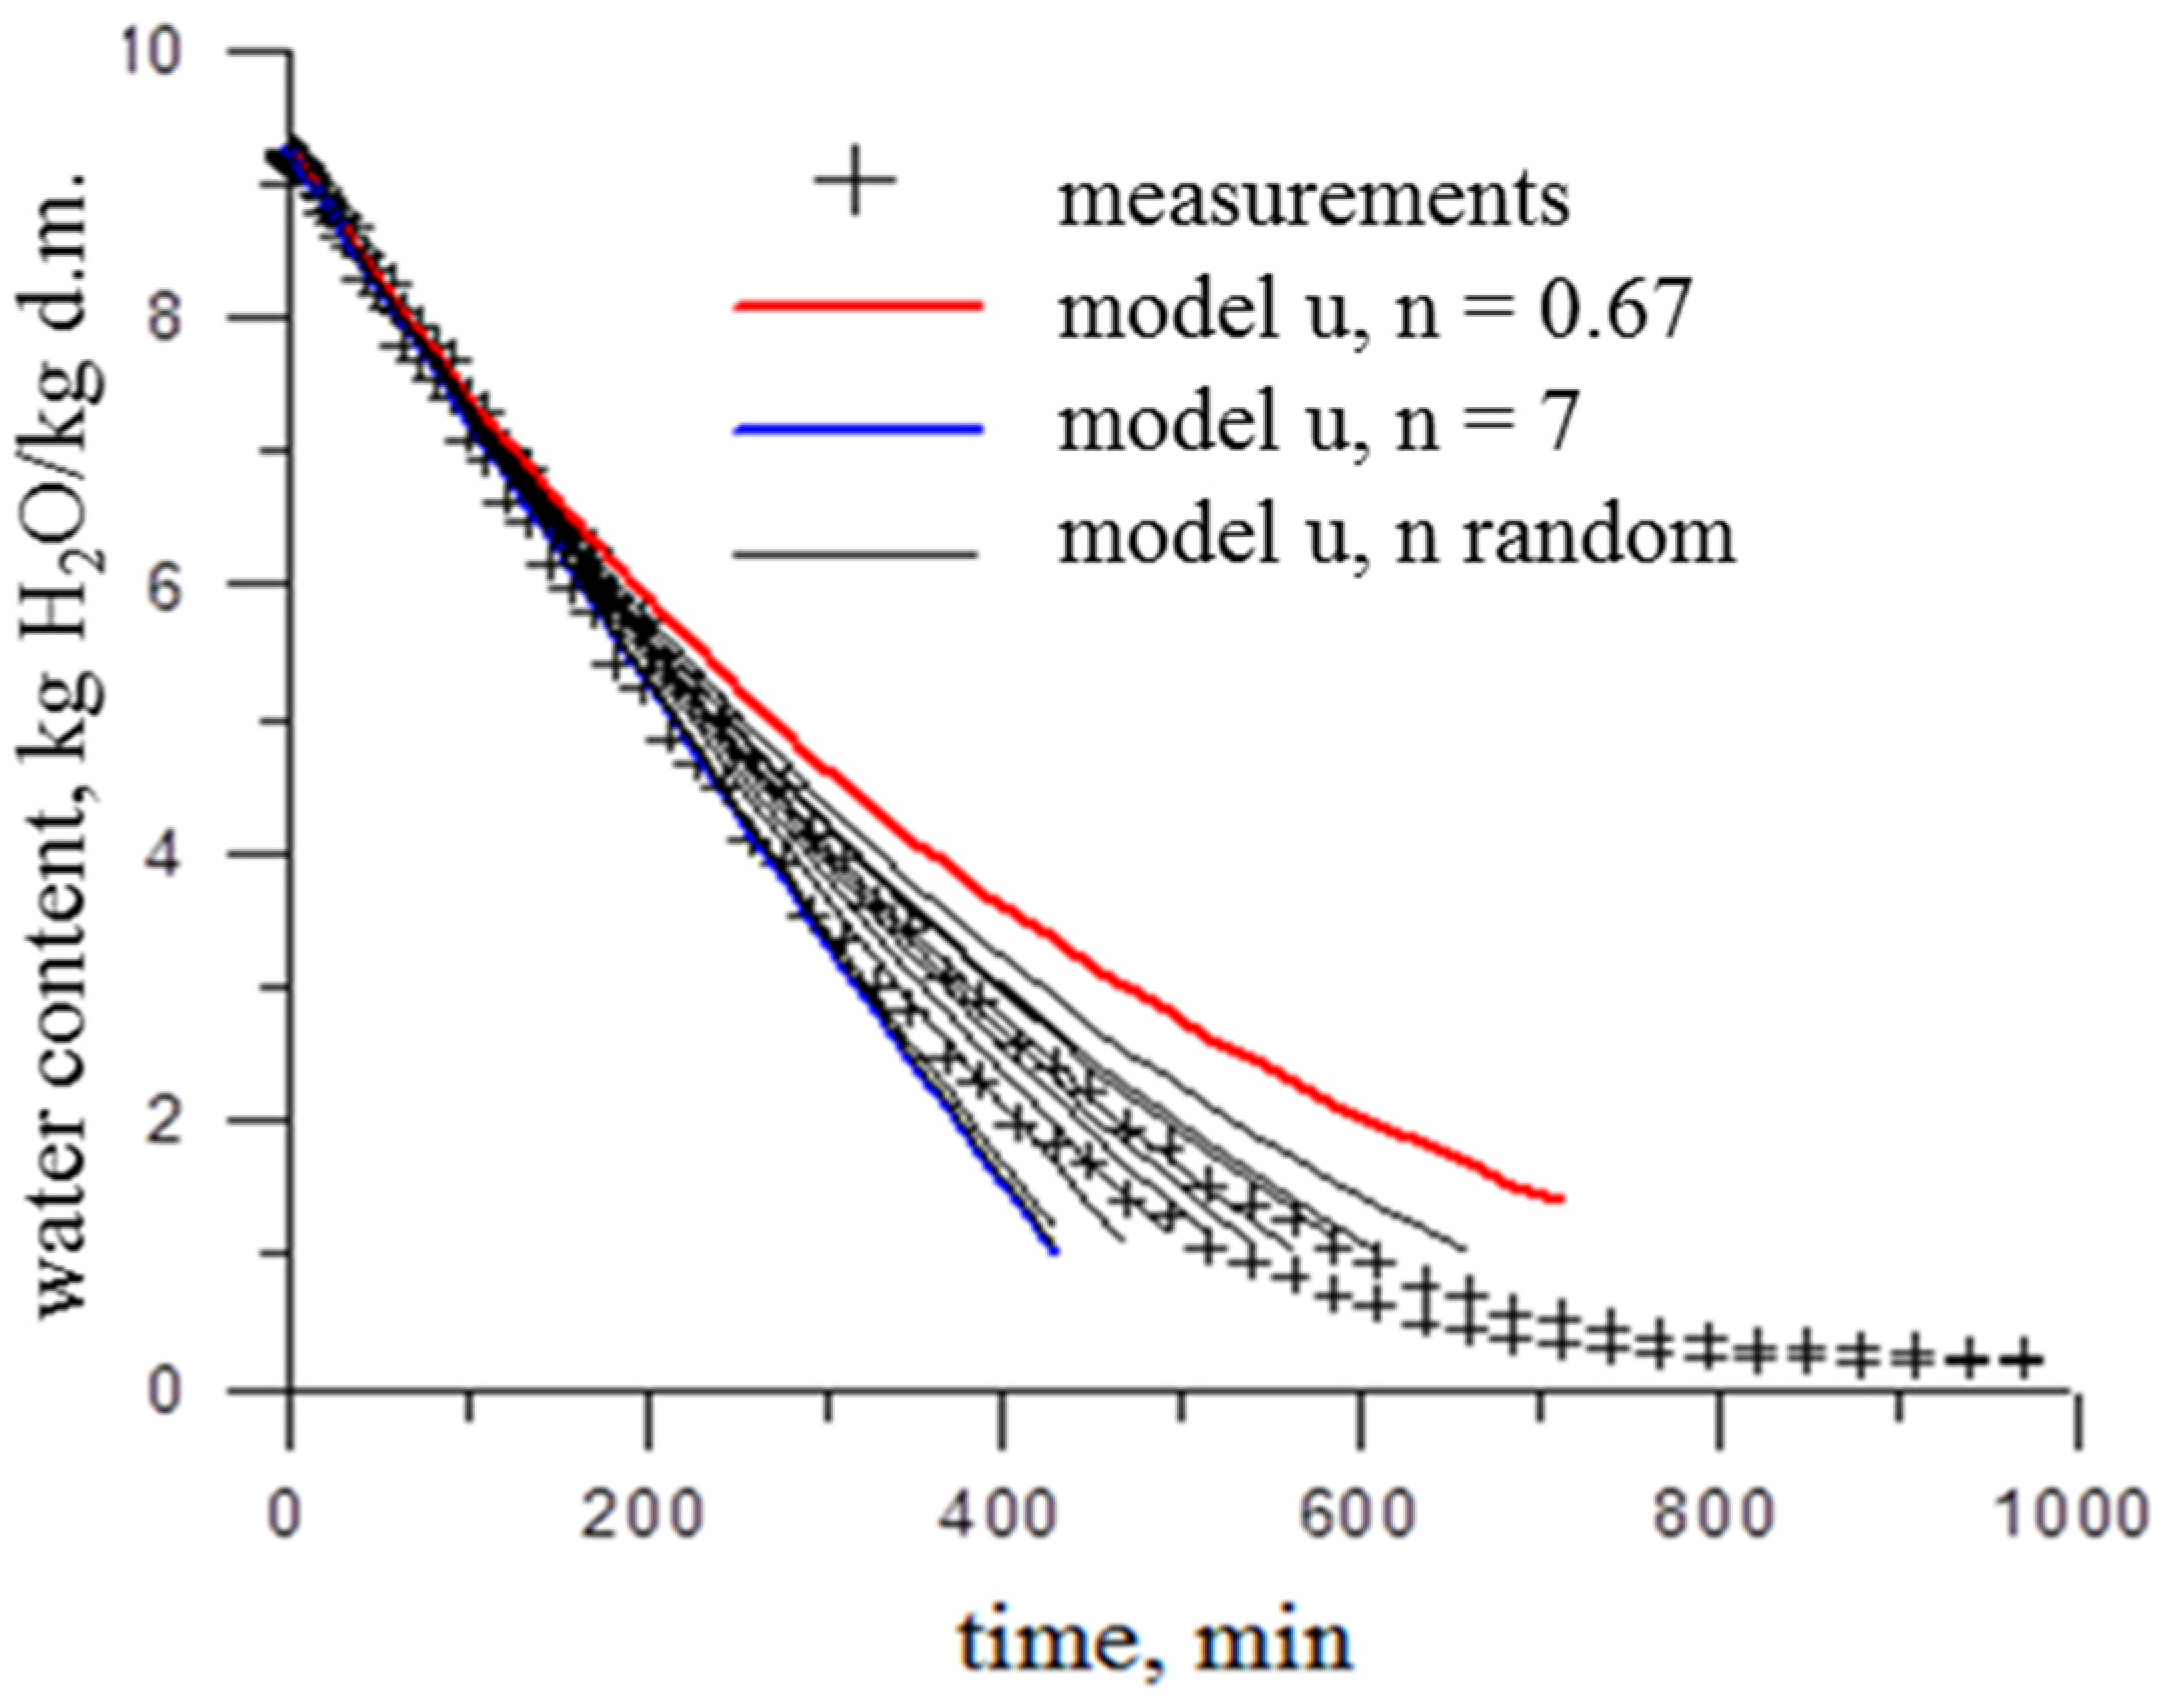
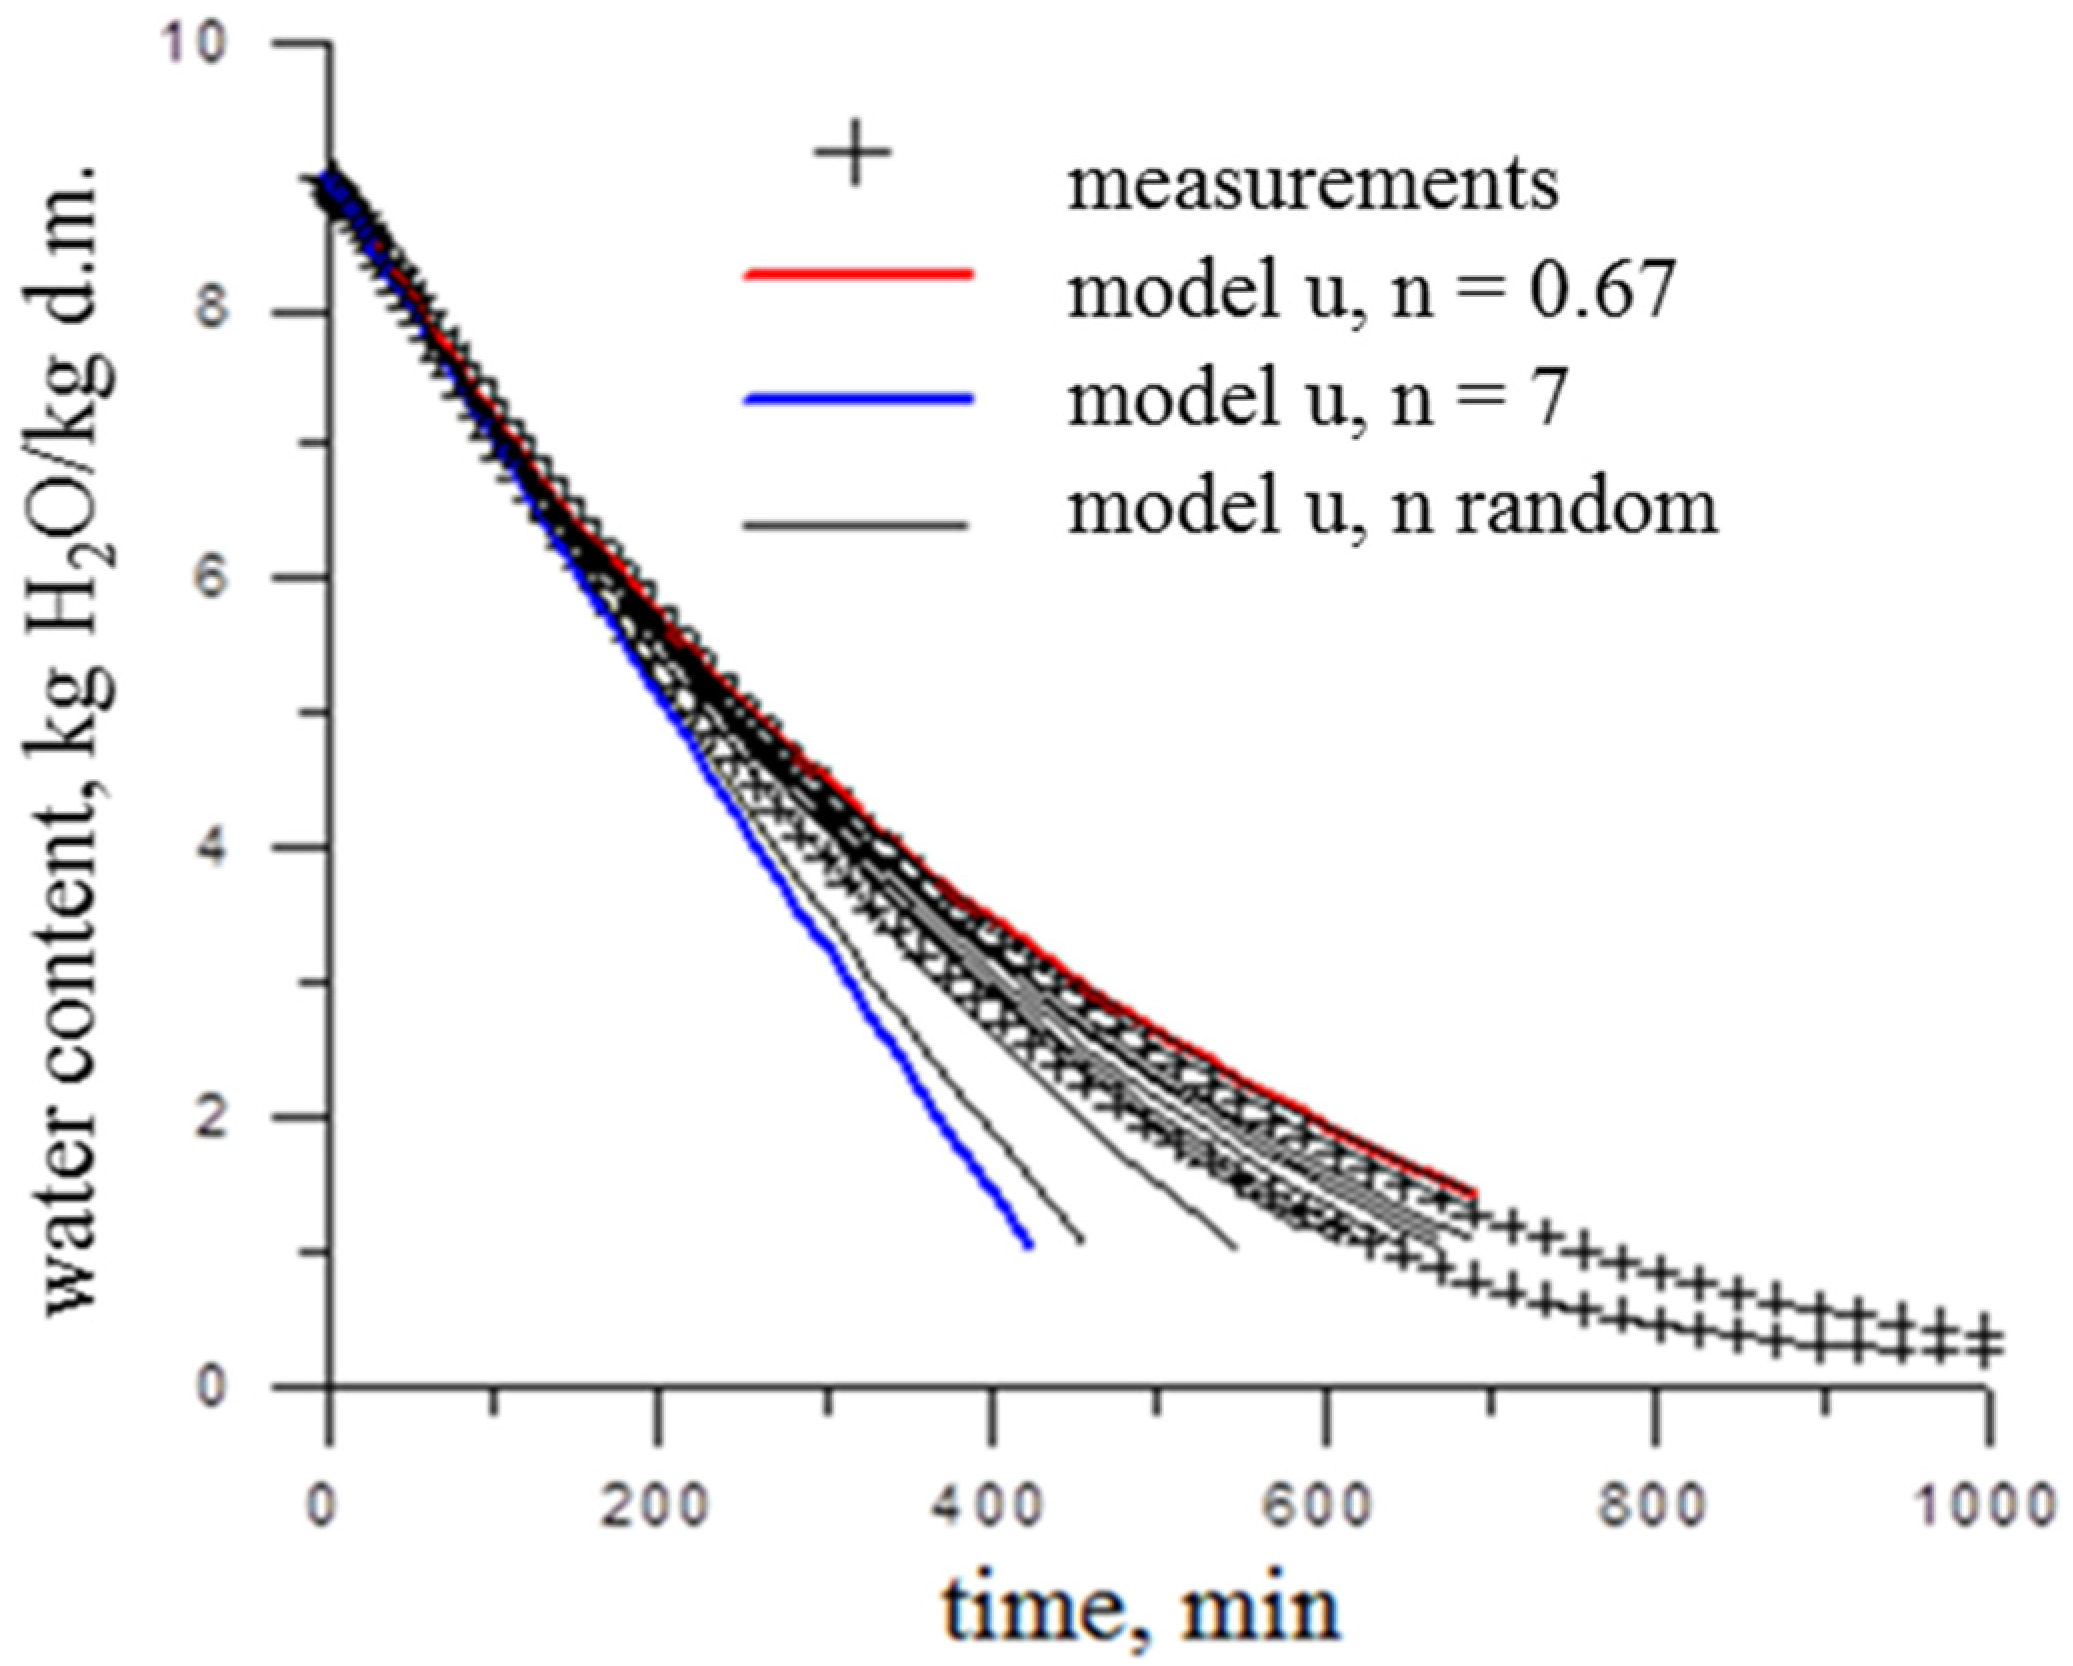
Figure 6, Figure 7 and Figure 8 show exemplary results of the modelling of the water content measurements of drying leek slices using the model (6) with a random n coefficient. First, two limiting curves were determined, with the coefficients nmin and nmax among all selected values of the n coefficients of the model (6) (marked with a thicker line on the graph red and blue). Next, the coefficient n was randomized using a pseudo-random number generator and probabilistic models were obtained (black lines on the graph).
It is worth noting that one plot of the model with a random n coefficient is a plot of a single measurement or averaged value of multiple repetitions of measurements carried out under the same conditions. Random models cover the area determined by the measurements of changes in the water content, limited by model graphs with determined extreme values of the analysed coefficient.
The model (6) was used to model the drying kinetics of many vegetables in the first period of drying [39,59,62,63]. The coefficient n, selected in the model, characterized the method for shrinking the dried particles. The value of this coefficient could be determined on the basis of many repetitions of the experiment and, finally, the average value with an acceptable standard deviation was adopted for modelling.
However, in the case of drying leek slices, the only predictable sample parameters are mass and volume, while the particle surface area of samples prepared from a homogeneous material may be different from the beginning. With the same initial mass, the number and shape of the dried particles may be different (slices as compact cylinders or cylinders of different thickness) and the surface can change in different ways during drying. The determined range of n values (0.67–7) is so large that the calculation of its mean value, as representative for the tested material using model (6), has no statistical or logical justification.
Therefore, attempts at mathematical modelling of the drying kinetics of such a material as leek should take into account the randomness of the number and the shape of the dried particles, which, for model (6), means the randomness of the n coefficient.
The models used in the literature usually reproduce only one specific course of changes in water content, while the model presented in this study may have a wider application. A model with a random coefficient can indicate different courses of water content changes with the same drying parameters.

4. Conclusions

The modelling of drying kinetics is crucial to understanding heat and mass exchange mechanism and mathematical description of the entire process. The fact that the leek particles dry unevenly is known in the industrial drying practice and is a technological problem. Often, simplified solutions of the diffusion equation or empirical formulas similar to these solutions containing exponential functions were used to model the kinetics of onion vegetables. Whilst such models, referred to as the models of the second period, possess a relatively good accuracy of the description of selected empirical experiments, they do not have a logical or theoretical justification for their use. The proposed model for water content changes in leek presented in this article explains the causes of this phenomenon, and can therefore be a valuable tool in decision-making, for example, in the determination of the time or method of drying.
The non-linear model (6) of water content changes with a random coefficient n approximates the measurements of water content changes, up to approximately 1–2 kg H2O/kg d.m. The empirical n coefficient of the nonlinear model of water content changes determined for leek was treated as a random variable, in which the empirical distribution was determined using the inverse distribution method.
The graphs of models (6) cover the area defined by many graphs of the same function and cover the area of empirical measurement results, which is the verification of the probabilistic model.

Author Contributions

Conceptualization, E.G.; methodology, E.G.; validation, E.G., I.W., K.R. and M.K.; formal analysis, E.G.; investigation, E.G., I.W., K.R. and M.K.; resources, E.G., I.W., K.R. and M.K.; data curation, E.G., I.W., K.R. and M.K.; writing—original draft preparation, E.G.; writing—review and editing, E.G.; visualization, E.G., I.W., K.R. and M.K.; supervision, E.G.; project administration E.G. All authors have read and agreed to the published version of the manuscript.

Funding

This research received no external funding.

Institutional Review Board Statement

Not applicable.

Informed Consent Statement

Not applicable.

Data Availability Statement

Data available from the corresponding author on reasonable request.

Conflicts of Interest

The authors declare no conflict of interest.

References

  1. Mahapatra, A.; Tripathy, P.P. Modeling and simulation of moisture transfer during solar drying of carrot slices. J. Food Process Eng. 2018, 41, e12909. [Google Scholar] [CrossRef]
  2. Savas, E. The Modelling of Convective Drying Variables’ Effects on the Functional Properties of Sliced Sweet Potatoes. Foods 2022, 11, 741. [Google Scholar] [CrossRef] [PubMed]
  3. Liu, H.; Liu, H.; Liu, H.; Zhang, X.; Hong, Q.; Chen, W.; Zeng, X. Microwave Drying Characteristics and Drying Quality Analysis of Corn in China. Processes 2021, 9, 1511. [Google Scholar] [CrossRef]
  4. Sánchez-Sáenz, C.M.; de Oliveira, R.A.; Park, K.J. HTST Pre-drying influence on vacuum drying kinetics and carrot slices quality parameters evaluation: Vacuum drying kinetics for carrot slices. J. Food Process. Preserv. 2015, 39, 1636–1646. [Google Scholar] [CrossRef]
  5. Abbaspour-Gilandeh, Y.; Kaveh, M.; Fatemi, H.; Khalife, E.; Witrowa-Rajchert, D.; Nowacka, M. Effect of Pretreatments on Convective and Infrared Drying Kinetics, Energy Consumption and Quality of Terebinth. Appl. Sci. 2021, 11, 7672. [Google Scholar] [CrossRef]
  6. Zhang, M.; Chen, H.; Mujumdar, A.S.; Tang, J.; Miao, S.; Wang, Y. Recent developments in high-quality drying of vegetables, fruits, and aquatic products. Crit. Rev. Food Sci. Nutr. 2015, 57, 1239–1255. [Google Scholar] [CrossRef]
  7. Inyang, U.E.; Oboh, I.O.; Etuk, B.R. Kinetic Models for Drying Techniques—Food Materials. Adv. Chem. Eng. Sci. 2018, 8, 27–48. [Google Scholar] [CrossRef] [Green Version]
  8. Onwude, D.I.; Hashim, N.; Janius, R.B.; Nawi, N.M.; Abdan, K. Modeling the Thin-Layer Drying of Fruits and Vegetables: A Review. Compr. Rev. Food Sci. Food Saf. 2016, 15, 599–618. [Google Scholar] [CrossRef] [Green Version]
  9. Kowalski, S.J.; Mierzwa, D. Numerical analysis of drying kinetics for shrinkable products such as fruits and vegetables. J. Food Eng. 2013, 114, 522–529. [Google Scholar] [CrossRef]
  10. Curcio, S.; Aversa, M. Influence of shrinkage on convective drying of fresh vegetables: A theoretical model. J. Food Eng. 2014, 123, 36–49. [Google Scholar] [CrossRef]
  11. Strati, I.F.; Kostomitsopoulos, G.; Lytras, F.; Zoumpoulakis, P.; Proestos, C.; Sinanoglou, V.J. Optimization of Polyphenol Extraction from Allium ampeloprasum var. porrum through Response Surface Methodology. Foods 2018, 7, 162. [Google Scholar] [CrossRef] [PubMed] [Green Version]
  12. Biernacka, B.; Dziki, D.; Kozłowska, J.; Kowalska, I.; Soluch, A. Dehydrated at Different Conditions and Powdered Leek as a Concentrate of Biologically Active Substances: Antioxidant Activity and Phenolic Compound Profile. Materials 2021, 14, 6127. [Google Scholar] [CrossRef] [PubMed]
  13. Fernández-López, J.; Botella-Martínez, C.; Navarro-Rodríguez de Vera, C.; Sayas-Barberá, M.E.; Viuda-Martos, M.; Sánchez-Zapata, E.; Pérez-Álvarez, J.A. Vegetable Soups and Creams: Raw Materials, Processing, Health Benefits, and Innovation Trends. Plants 2020, 9, 1769. [Google Scholar] [CrossRef] [PubMed]
  14. Soininen, T.H.; Jukarainen, N.; Soininen, P.; Auriola, S.O.K.; Julkunen-Tiitto, R.; Oleszek, W.; Stochmal, A.; Karjalainen, R.O.; Vepsäläinen, J.J. Metabolite Profiling of Leek (Allium porrum L) Cultivars by 1H NMR and HPLC–MS. Phytochem. Anal. 2014, 25, 220–228. [Google Scholar] [CrossRef]
  15. Kavalcová, P.; Bystrická, J.; Tomáš, J.; Karovičová, J.; Kuchtová, V. Evaluation and comparison of the content of total polyphenols and antioxidant activity in onion, garlic and leek. Potravinarstvo Slovak J. Food Sci. 2014, 8, 272–276. [Google Scholar] [CrossRef] [Green Version]
  16. Kovarovič, J.; Bystrická, J.; Fehér, A.; Lenková, M. Evaluation and comparison of bioactive substances in selected species of the genus Allium. Potravinarstvo 2017, 11, 702–708. [Google Scholar] [CrossRef] [Green Version]
  17. Radovanović, B.; Mladenović, J.; Radovanović, A.; Pavlović, R.; Nikolić, V. Phenolic composition, antioxidant, antimicrobial and cytotoxic activites of Allium porrum L. (Serbia) extracts. J. Food Nutr. Res. 2015, 3, 564–569. [Google Scholar]
  18. Bernaert, N.; De Clercq, H.; Van Bockstaele, E.; De Loose, M.; van Droogenbroeck, B. Antioxidant changes during postharvest processing and storage of leek (Allium ampeloprasum var. porrum). Postharvest Biol. Technol. 2013, 86, 8–16. [Google Scholar] [CrossRef]
  19. Kovarovič, J.; Bystrická, J.; Micová, M.; Harangozo, Ľ.; Miššík, J.; Hegedűsová, A. The influence of variety on the content of total polyphenols and antioxidant activity in leek (Allium porrum L.). J. Microbiol. Biotechnol. Food Sci. 2019, 8, 1072–1075. [Google Scholar] [CrossRef] [Green Version]
  20. Kratchanova, M.; Nikolova, M.; Pavlova, E.; Yanakieva, I.; Kussovski, V. Composition and properties of biologically active pectic polysaccharides from leek (Allium porrum). J. Sci. Food Agric. 2010, 90, 2046–2051. [Google Scholar] [CrossRef]
  21. Asemani, Y.; Zamani, N.; Bayat, M.; Amirghofran, Z. Allium vegetables for possible future of cancer treatment. Phytother. Res. 2019, 33, 3019–3039. [Google Scholar] [CrossRef] [PubMed]
  22. Itňanová, I.; Ranostajová, S.; Sobotová, H.; Demelová, D.; Pechán, I.; Ďuračková, Z. Antioxidative activity of selected fruits and vegetables. Biologia 2006, 61, 279–284. [Google Scholar] [CrossRef] [Green Version]
  23. Murcia, M.A.; Jimenez, A.M.; Martinez-Torne, M. Vegetables antioxidant losses during industrial processing and refrigerated storage. Food Res. Int. 2009, 42, 1046–1052. [Google Scholar] [CrossRef]
  24. Bernaert, N.; Debonne, E.; De Leyn, I.; van Droogenbroeck, B.; van Bockstaele, F. Incorporation of leek powder (Allium ampeloprasum var. porrum) in wheat bread: Technological implications, shelf life and sensory evaluation. LWT 2021, 153, 112517. [Google Scholar] [CrossRef]
  25. Biernacka, B.; Dziki, D.; Gawlik-Dziki, U. Pasta Enriched with Dried and Powdered Leek: Physicochemical Properties and Changes during Cooking. Molecules 2022, 27, 4495. [Google Scholar] [CrossRef]
  26. Royen, M.J.; Noori, A.W.; Haydary, J. Experimental Study and Mathematical Modeling of Convective Thin-Layer Drying of Apple Slices. Processes 2020, 8, 1562. [Google Scholar] [CrossRef]
  27. Rayaguru, K.; Routray, W. Mathematical modeling of thin layer drying kinetics of stone apple slices. Int. Food Res. J. 2012, 19, 1503–1510. [Google Scholar]
  28. Pinheiro, M.; Madaleno, R.; Castro, L.M. Drying kinetics of two fruits Portuguese cultivars (Bravo de Esmolfe apple and Madeira banana): An experimental study. Heliyon 2022, 8, e09341. [Google Scholar] [CrossRef]
  29. Bozkir, H. Effects of hot air, vacuum infrared, and vacuum microwave dryers on the drying kinetics and quality characteristics of orange slices. J. Food Process. Eng. 2020, 43, e13485. [Google Scholar] [CrossRef]
  30. Tan, S.; Miao, Y.; Zhou, C.; Luo, Y.; Lin, Z.; Xie, R.; Li, W. Effects of Hot Air Drying on Drying Kinetics and Anthocyanin Degradation of Blood-Flesh Peach. Foods 2022, 11, 1596. [Google Scholar] [CrossRef]
  31. Reppich, M.; Jegla, Z.; Grondinger, J.; Azouma, Y.O.; Turek, V. Mathematical Modeling of Drying Processes of Selected Fruits and Vegetables. Chem. Ing. Tech. 2021, 93, 1581–1589. [Google Scholar] [CrossRef]
  32. Khuwijitjaru, P.; Somkane, S.; Nakagawa, K.; Mahayothee, B. Osmotic Dehydration, Drying Kinetics, and Quality Attributes of Osmotic Hot Air-Dried Mango as Affected by Initial Frozen Storage. Foods 2022, 11, 489. [Google Scholar] [CrossRef] [PubMed]
  33. Tulej, W.; Głowacki, S. Modeling of the Drying Process of Apple Pomace. Appl. Sci. 2022, 12, 1434. [Google Scholar] [CrossRef]
  34. Alam, R.; Lyng, J.G.; Frontuto, D.; Marra, F.; Cinquanta, L. Effect of Pulsed Electric Field Pretreatment on Drying Kinetics, Color, and Texture of Parsnip and Carrot. J. Food Sci. 2018, 83, 2159–2166. [Google Scholar] [CrossRef]
  35. Abbaspour-Gilandeh, Y.; Kaveh, M.; Aziz, M. Ultrasonic-Microwave and Infrared Assisted Convective Drying of Carrot: Drying Kinetic, Quality and Energy Consumption. Appl. Sci. 2020, 10, 6309. [Google Scholar] [CrossRef]
  36. Sonmete, M.H.; Mengeş, H.O.; Ertekin, C.; Özcan, M.M. Mathematical modeling of thin layer drying of carrot slices by forced convection. J. Food Meas. Charact. 2016, 11, 629–638. [Google Scholar] [CrossRef]
  37. Górnicki, K.; Kaleta, A.; Choińska, A. Suitable model for thin-layer drying of root vegetables and onion. Int. Agrophys. 2020, 34, 79–86. [Google Scholar] [CrossRef]
  38. Zcan, M.M.; Arslan, D.; Mengeş, H.O. Evaluation of drying methods with respect to drying kinetics and mineral contents of dill and parsley. Iran. J. Chem. Chem. Eng. (IJCCE) 2018, 37, 237–245. [Google Scholar]
  39. Jaros, M.; Pabis, S. Theoretical models for fluid bed drying of cut vegetables. Biosyst. Eng. 2006, 93, 45–55. [Google Scholar] [CrossRef]
  40. Krokida, M.; Karathanos, V.; Maroulis, Z.; Marinos-Kouris, D. Drying kinetics of some vegetables. J. Food Eng. 2003, 59, 391–403. [Google Scholar] [CrossRef]
  41. Kaleta, A.; Górnicki, K. Some remarks on evaluation of drying models of red beet particles. Energy Convers. Manag. 2010, 51, 2967–2978. [Google Scholar] [CrossRef]
  42. Szadzińska, J.; Mierzwa, D.; Pawłowski, A.; Musielak, G.; Pashminehazar, R.; Kharaghani, A. Ultrasound- and microwave-assisted intermittent drying of red beetroot. Dry. Technol. 2019, 38, 93–107. [Google Scholar] [CrossRef]
  43. Azeez, L.; Adebisi, S.A.; Oyedeji, A.; Adetoro, R.O.; Tijani, K.O. Bioactive compounds’ contents, drying kinetics and mathematical modelling of tomato slices influenced by drying temperatures and time. J. Saudi Soc. Agric. Sci. 2019, 18, 120–126. [Google Scholar] [CrossRef]
  44. Bennamoun, L.; Khama, R.; Léonard, A. Convective drying of a single cherry tomato: Modeling and experimental study. Food Bioprod. Process. 2015, 94, 114–123. [Google Scholar] [CrossRef]
  45. Abbasi, S.; Mousavi, S.M.; Mohebbi, M. Modeling of moisture ratio and shrinkage of onion slices during hot air drying. In Proceedings of the 6th International Chemical Engineering Congress and Exhibition, ICHEC 2009, Kish Island, Iran, 16–20 November 2009. [Google Scholar]
  46. Ilter, I.; Akyıl, S.; Devseren, E.; Okut, D.; Koç, M.; Ertekin, F.K. Microwave and hot air drying of garlic puree: Drying kinetics and quality characteristics. Heat Mass Transf. 2018, 54, 2101–2112. [Google Scholar] [CrossRef]
  47. Rasouli, M.; Seiiedlou, S.; Ghasemzadeh, H.R.; Nalbandi, H. Convective drying of garlic (Allium sativum L.): Part I: Drying kinetics, mathematical modeling and change in color. Aust. J. Crop Sci. 2011, 5, 1707–1714. [Google Scholar]
  48. Younis, M.; Abdelkarim, D.; El-Abdein, A.Z. Kinetics and mathematical modeling of infrared thin-layer drying of garlic slices. Saudi J. Biol. Sci. 2018, 25, 332–338. [Google Scholar] [CrossRef]
  49. Benseddik, A.; Azzi, A.; Zidoune, M.; Khanniche, R.; Besombes, C. Empirical and diffusion models of rehydration process of differently dried pumpkin slices. J. Saudi Soc. Agric. Sci. 2019, 18, 401–410. [Google Scholar] [CrossRef]
  50. Agrawal, S.G.; Methekar, R.N. Mathematical model for heat and mass transfer during convective drying of pumpkin. Food Bioprod. Process. 2017, 101, 68–73. [Google Scholar] [CrossRef]
  51. Falade, K.O.; Solademi, O.J. Modelling of air drying of fresh and blanched sweet potato slices. Int. J. Food Sci. Technol. 2010, 45, 278–288. [Google Scholar] [CrossRef]
  52. Doymaz, I. Drying of Leek Slices Using Heated Air. J. Food Process. Eng. 2008, 31, 721–737. [Google Scholar] [CrossRef]
  53. Doymaz, I. Influence of blanching and slice thickness on drying characteristics of leek slices. Chem. Eng. Process. Process Intensif. 2008, 47, 41–47. [Google Scholar] [CrossRef]
  54. Dadali, G.; Özbek, B. Microwave heat treatment of leek: Drying kinetic and effective moisture diffusivity. Int. J. Food Sci. Technol. 2008, 43, 1443–1451. [Google Scholar] [CrossRef]
  55. Zakipour, E.; Hamidi, Z. Vacuum Drying Characteristics of Some Vegetables. Iran. J. Chem. Chem. Eng. (Ijcce) 2011, 30, 97–105. [Google Scholar]
  56. Kaleta, A.; Górnicki, K.; Winiczenko, R.; Chojnacka, A. Evaluation of drying models of apple (var. Ligol) dried in a fluidized bed dryer. Energy Convers. Manag. 2013, 67, 179–185. [Google Scholar] [CrossRef]
  57. Kucuk, H.; Midilli, A.; Aydin Kilic, A.; Dincer, I. A Review on Thin-Layer Drying-Curve Equations. Dry. Technol. 2014, 32, 757–773. [Google Scholar] [CrossRef]
  58. Kaleta, A.; Górnicki, K. Evaluation of drying models of apple (var. McIntosh) dried in a convective dryer. Int. J. Food Sci. Technol. 2010, 45, 891–898. [Google Scholar] [CrossRef]
  59. Górnicki, K.; Kaleta, A. Drying curve modelling of blanched carrot cubes under natural convection condition. J. Food Eng. 2007, 82, 160–170. [Google Scholar] [CrossRef]
  60. Pabis, S. The Initial Phase of Convection Drying of Vegetables and Mushrooms and the Effect of Shrinkage. J. Agric. Eng. Res. 1999, 72, 187–195. [Google Scholar] [CrossRef]
  61. Pabis, S.; Jaros, M. PH—Postharvest Technology: The First Period of Convection Drying of Vegetables and the Effect of Shape-dependent Shrinkage. Bios. Eng. 2002, 81, 201–211. [Google Scholar] [CrossRef]
  62. Sojak, M.; Glowacki, S. Analysis of giant pumpkin (Cucurbita maxima) drying kinetics in various technologies of convective drying. J. Food Eng. 2010, 99, 323–329. [Google Scholar] [CrossRef]
  63. Górnicki, K.; Kaleta, A. Modelling convection drying of blanched parsley root slices. Biosyst. Eng. 2007, 97, 51–59. [Google Scholar] [CrossRef]
  64. Kukiełko, E. Modeling of the Convection Drying Process of Chokeberry Fruit in a Thin Layer. Doctoral Dissertation, Warsaw University of Life Sciences, Warsaw, Poland, 2001. (In Polish). [Google Scholar]
  65. Matuszak, N. The Monte Carlo method and using in radiotherapy. Zesz. Nauk. WCO Lett. Oncol. Sci. 2019, 16, 50–57. [Google Scholar]
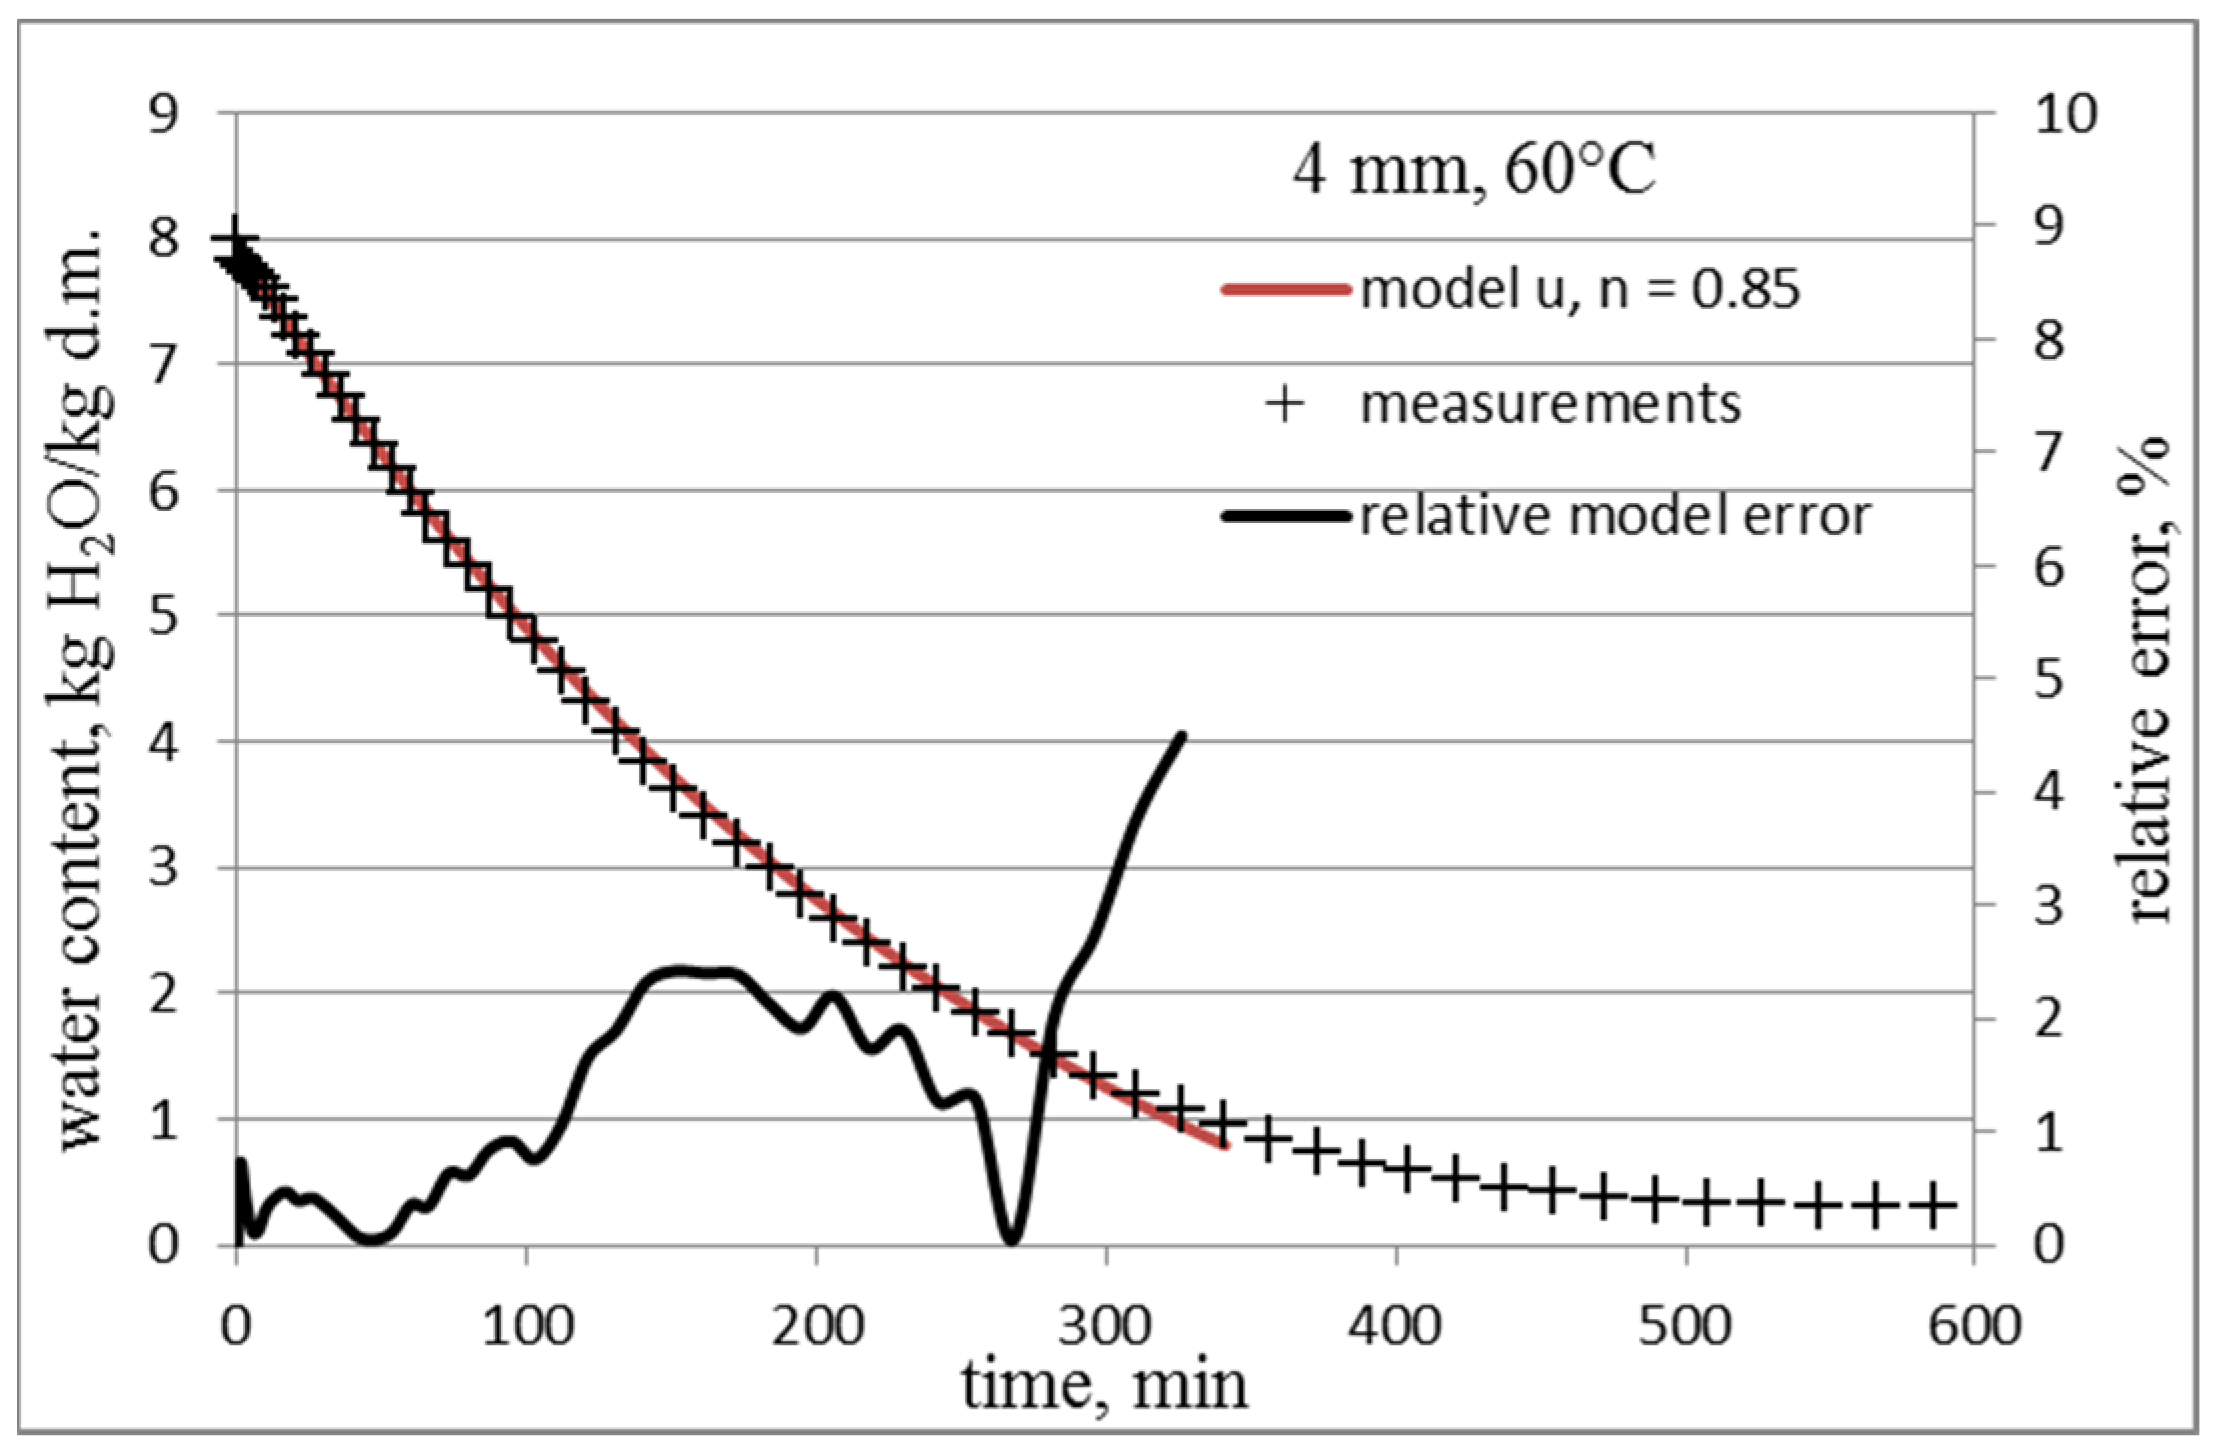
Figure 1. Model of water content changes in leek slices 4 mm thick, during drying at temperature 60 °C, when n = 0.85.
Applsci 12 11761 g001
Figure 2. Model of water content changes in leek slices 8 mm thick, during drying at temperature 50 °C, when n = 1.25.
Applsci 12 11761 g002
Figure 3. Model of water content changes in leek slices 12 mm thick, during drying at temperature 70 °C, when n = 0.82.
Applsci 12 11761 g003
Figure 4. Probability distribution p(n) of dried leek.
Applsci 12 11761 g004
Figure 5. Cumulative and inversed distribution function of the n coefficient and functions approximating these distributions.
Applsci 12 11761 g005
Figure 6. The graphs of models for moisture content changes with random coefficient for leek slices 8 mm thick, during drying at temperature 40 °C.
Applsci 12 11761 g006
Figure 7. The graphs of models for moisture content changes with random coefficient for leek slices 4 mm thick, during drying at temperature 50 °C.
Applsci 12 11761 g007
Figure 8. The graphs of models for moisture content changes with random coefficient for leek slices 12 mm thick, during drying at temperature 60 °C.
Applsci 12 11761 g008
Table 1. Coefficients n and N of the model (6) depending on the parameters of the drying process.
Drying Temperature [°C]Slice Thickness [mm]Type of SliceCoefficient n *Coefficient N
404ns1.01; 0.97; 1.022.94; 3.2; 2.89
8ns0.85; 1; 0.94.64; 3; 3.86
s0.8; 0.94; 16; 3.44; 3
12ns0.87; 0.95; 1.14.28; 3.35; 2.54
504ns1.42; 1.58; 1.651.88; 1.73; 1.68
8ns1.29; 1.2; 1.252.07; 2.25; 2.14
s0.86; 1.26; 0.914.45; 2.12; 3.73
12ns0.7; 0.81; 0.75201; 5.65; 9
s0.74; 0.67; 0.8210.09; 201; 5.35
604ns1.31; 0.89; 0.852.04; 3.99; 4.46
s1.81; 0.88. 0.851.58; 4.13; 4.64
8ns0.8; 1.49; 1.356; 1.8; 1.98
s0.83; 1.04; 0.845.08; 2.79; 4.85
12ns0.84; 0.93; 1.064.85; 3.53; 2.79
s0.89; 0.88; 0.773.99; 4.13; 7.45
704ns1.15; 2.8; 1.382.38; 1.31; 1.93
8ns1.33; 1.74; 2.12.01; 1.62; 1.46
s2; 1.06. 0.91.5; 2.69; 3.86
12ns0.87; 0.82; 0.914.28; 5.35; 3.74
s1.82; 1.15; 11.58; 2.38; 3
804ns2.3; 7; 3.251.41; 1.11; 1.26
s2.2; 1.05; 4.51.43; 2.74; 1.17
8ns1.82; 3.51; 4.41.59; 1.23; 1.18
s1.65; 2.51; 1.131.68; 1.36; 2.44
12ns0.89; 1.25; 0.973.99; 2.14; 3.2
s0.9; 0.94; 0.823.86; 3.44; 5.35
* for each of the 3 repetitions of water content measurements.
Publisher’s Note: MDPI stays neutral with regard to jurisdictional claims in published maps and institutional affiliations.