Communication

Formation and Characterization of Fucus virsoides J. Agardh Pigment–Polyethylene Glycol Microparticles Produced Using PGSS Process

1
Department of Process Engineering, Faculty of Food Technology, Josip Juraj Strossmayer University of Osijek, Franje Kuhača 18, 31000 Osijek, Croatia
2
Faculty of Agriculture and Food Technology, University of Mostar, Biskupa Čule bb, 88000 Mostar, Bosnia and Herzegovina
3
Laboratory for Separation Processes and Product Design, Faculty of Chemistry and Chemical Engineering, University of Maribor, Smetanova 17, 2000 Maribor, Slovenia
*
Authors to whom correspondence should be addressed.
Appl. Sci. 2022, 12(22), 11496; https://doi.org/10.3390/app122211496
Submission received: 17 September 2022 / Revised: 6 November 2022 / Accepted: 11 November 2022 / Published: 12 November 2022
(This article belongs to the Section Food Science and Technology)

Abstract

:
The particles from the gas-saturated solutions (PGSS) process was employed to micronize brown algae pigments separated by different extraction techniques. The particle formation of pigments with a coating material, polyethylene glycol (PEG), was carried out by the PGSS process using supercritical CO2. Environmental scanning electron microscopy (ESEM) and Fourier-transform infrared spectroscopy (FTIR) were performed to characterize the produced particles, while encapsulation efficiency was determined using spectrophotometric methods. The physical properties of obtained microparticles were also determined. The PGSS process enabled a high encapsulation yield in the range from 61.60 to 73.73%, and high encapsulation efficiency in terms of chlorophyll a, chlorophyll b, and carotenoid content. The release of CO2 during the PGSS process gave the microparticles their characteristic open and porous form, and enhanced the solubility and flow properties at the same time.

1. Introduction

For thousands of years, people have relied on algae as a traditional food source, notably in Asia, because of its widespread availability, accessibility, diversity, and nutritional content. However, worldwide interest has recently increased as a result of the fact that algae are a valuable source of structurally different bioactive compounds (such as polysaccharides, phenolics, volatile organic compounds, and natural pigments) with different health benefits. In addition to being inexpensive and naturally rich in nutrients, there are still some issues related to the bioaccessibility, bioavailability, and stability of bioactive compounds [1,2]. Natural pigments have attracted a lot of attention in the past few years due to their potential for use in medicine and pharmaceuticals [3,4], as well as the fact that they can be utilized as alternatives to synthetic dyes and colors [5,6]. Algae include three primary types of pigments: carotenoids, phycobiliproteins, and chlorophylls [7].
The main issue with using natural pigments, such as carotenoids, as colorants in commercial applications is that they have a limited tolerance for temperature changes, heating, and light exposure. Their decomposition can also be accelerated by oxygen and other oxidizing substances. Microencapsulation is a technique that can be used to protect chemicals of natural origin. Microencapsulation techniques that are most frequently utilized are spray techniques (spray cooling, spray drying, spray drying with CO2 at a supercritical state), freeze drying, extrusion, and coacervation [8].
CO2 in a supercritical state is an important tool for the creation of new active compound delivery systems through particle formation. Supercritical fluids are an alternative technology for encapsulating active compounds where the bioactive compounds are entrapped into a matrix as a carrier material to increase the product shelf life, while also managing the active compound’s dissolution rate. As an alternative to conventional microencapsulation techniques such as solvent displacement and self-emulsifying systems, this technique completely avoids organic solvents and post-treatment processes that are time and energy-consuming and with remaining residual solvent levels which represent a safety risk [9,10]. The possibility of producing novel delivery systems, technically and economically feasible, without any additional steps typically required by traditional techniques, such as the drying of microparticles, has enormous importance within pharmaceutical and food industries [10,11]. By reducing particle size and increasing surface area, bioavailability (the difference between the initial dosage and the medicine absorbed in a target area in the human body) can be improved, resulting in increased dissolution. Small pharmaceutical particles with a reduced particle size distribution play an important role in the design of traditional active compounds delivery systems including tablets, syrups, capsules, and injections [12,13,14]. During the micronization process, the mixture containing core material (bioactive compound and shell material) is saturated with CO2 and then the CO2-containing solution is rapidly expanded in an expansion section. Due to the Joule–Thomson effect (evaporation and volume expansion of the gas), the solution cools below the solidification temperature of the solute. This results in the formation of particles. Microparticles can be easily separated from the CO2 stream in a spray tower (gas–liquid contactor) [14]. Encapsulation of natural compounds, lipids and fat derivatives, medicines, synthetic and natural compounds with antioxidant activity, surface-active chemicals, and UV stabilizers are among the most common applications of this technique [15].
This study aimed to determine the possibilities in the encapsulation of pigments using particles from the gas-saturated solutions (PGSS) process to improve its stability and bioaccessibility effectively. Obtained particles are discussed in terms of particle shape and surface, physical (colour, flow, and solubility properties), and chemical properties. Algae extracts were prepared with different extraction techniques in order to give insight into influence not only by coating, but also by the properties of the core material on the microparticles.

2. Materials and Methods

2.1. Materials and Chemicals

In February 2020, Fucus virsoides J. Agardh, 1868, was collected in the southwest Novigrad sea area, which is located in the Adriatic Sea shore (44°12′02″ N, 15°28′51″ E), Croatia. A representative sample was collected via single-point sample collection from a depth of 0.5 m at a sea temperature of 12 °C. Used solvents (ethanol, hexane, methanol, acetone, and petroleum benzine) were of analytical grade and were obtained from J.T. Baker (New Jersey, PA, USA). CO2 of 2.5 (99.5% (v/v)) grade was purchased from Messer (Ruse, Slovenia). PEG 4000 was purchased from Merck & Co, USA.

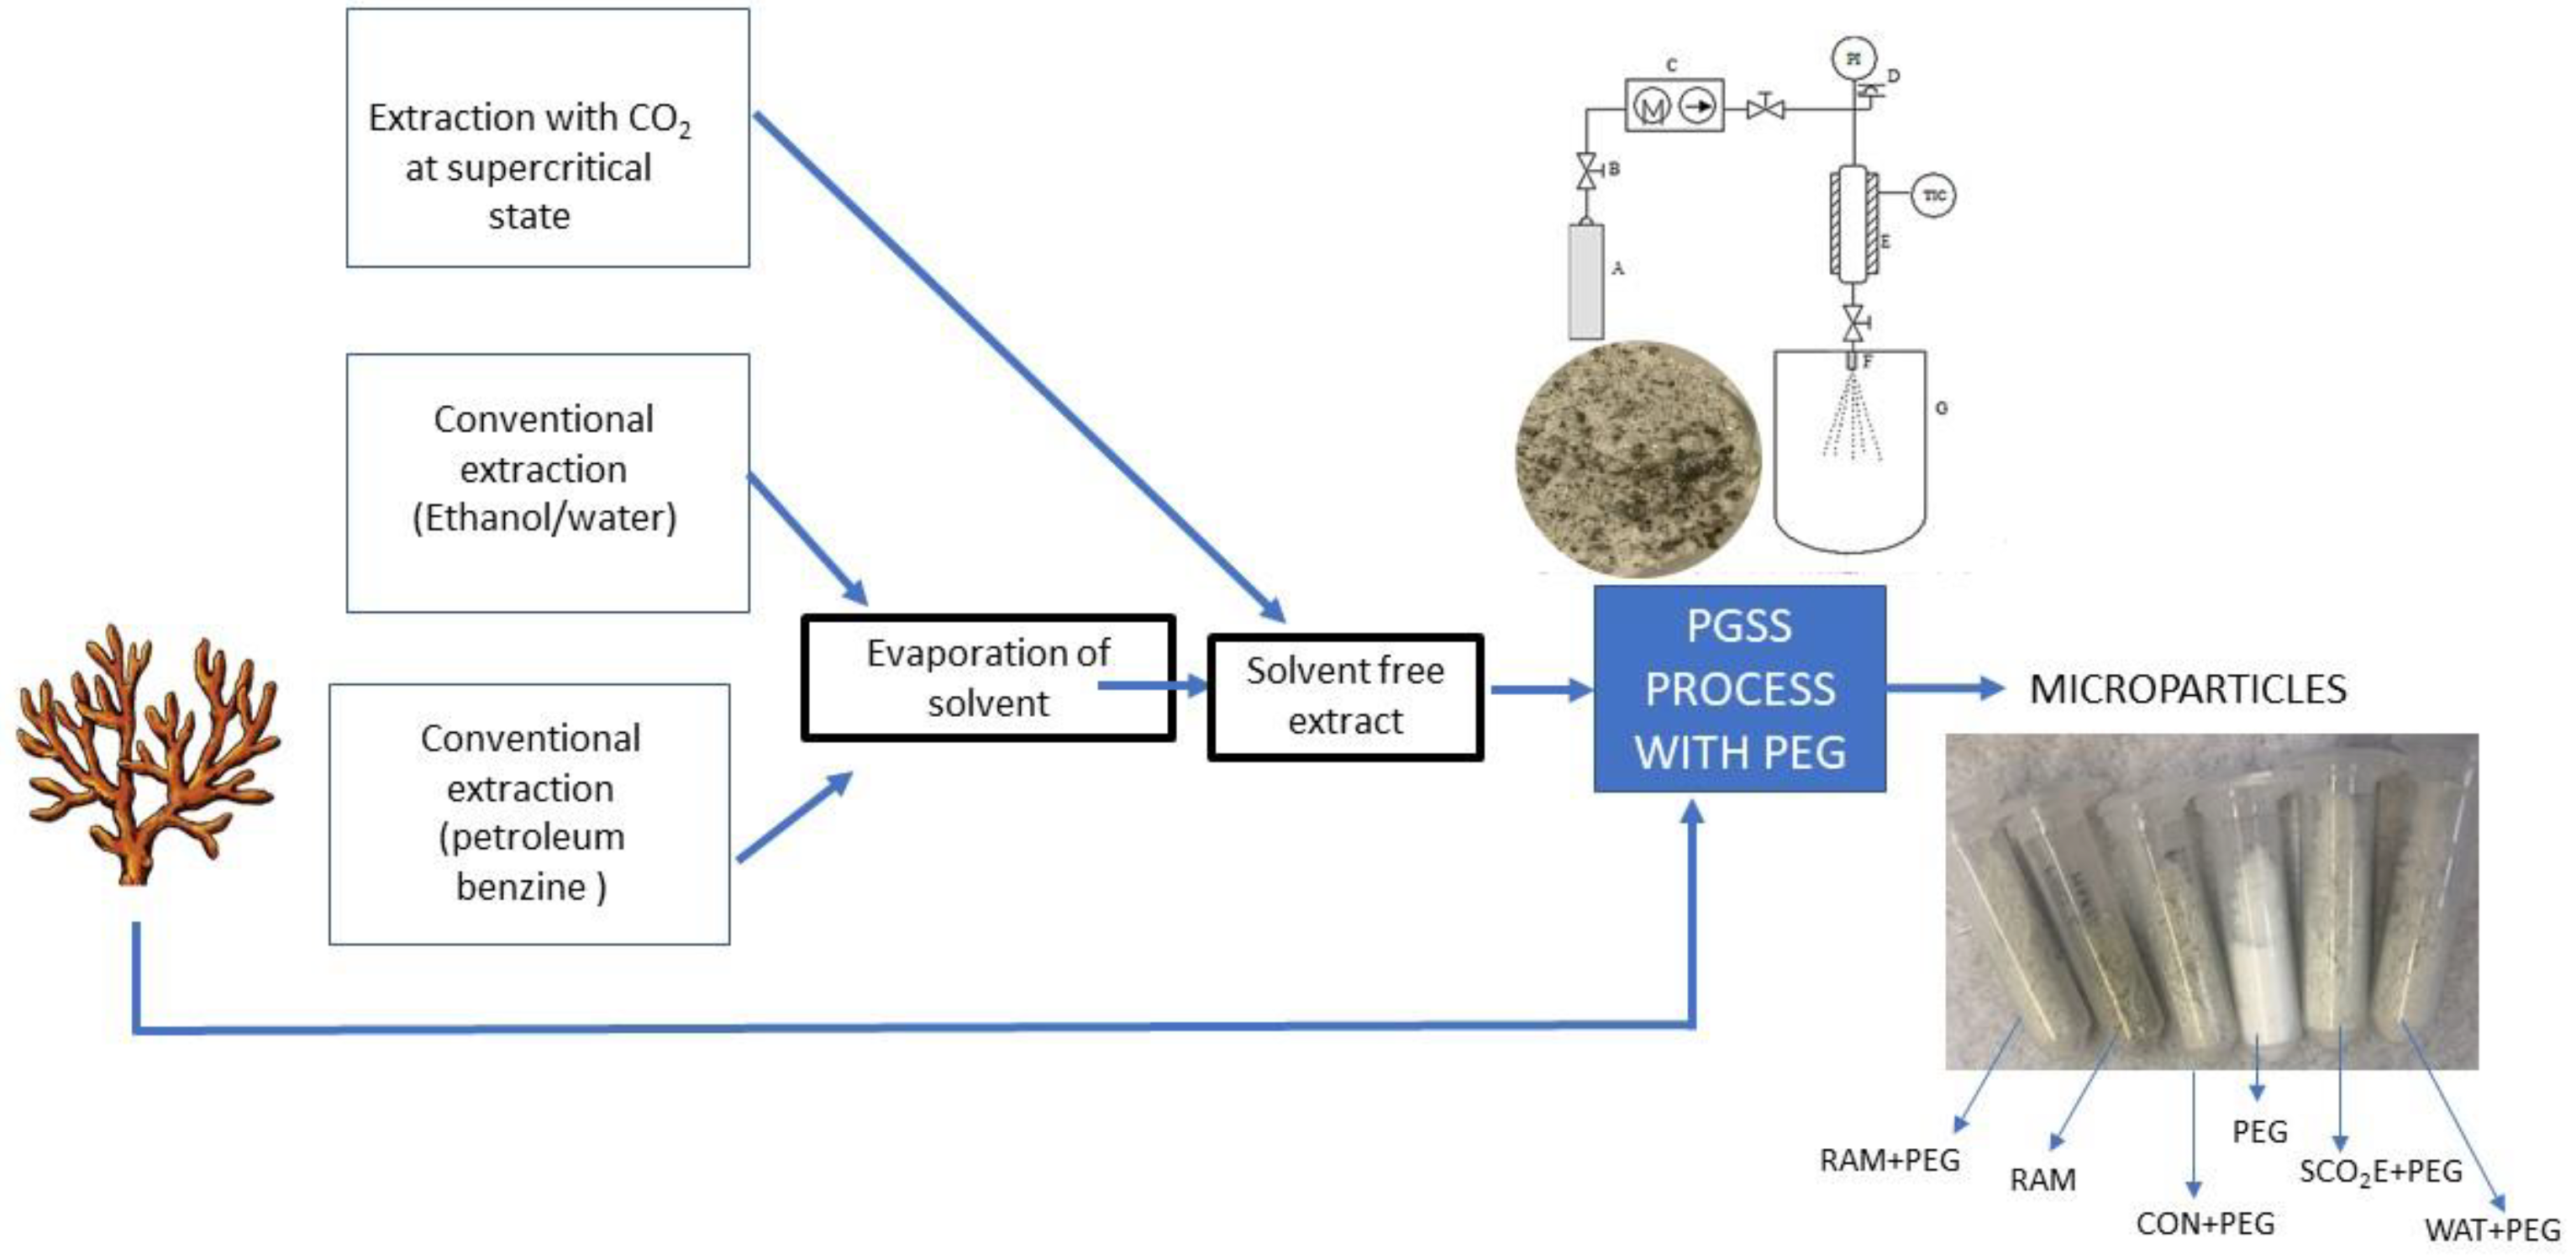
2.2. Extraction Procedure

Dry extracts (solvent-free) were obtained using 3 different extraction techniques: supercritical fluid extraction, and solid–liquid extraction with water/ethanol and petroleum benzine as the solvent (Figure 1).
First, the solid/liquid extraction was performed using 70% water-ethanol solution as a solvent for 3 h with a solvent/solid ratio of 20/1 mL/g at a temperature of 50 °C. The solvent was completely removed using a rotary evaporator to obtain dry polar (water/ethanol free) extract (WAT).
Supercritical extract (SCOE2) was obtained from a semi-continuous flow apparatus built in the laboratory of the Faculty of Chemistry and Chemical Engineering of the University of Maribor. The extraction cell was filled with 20 g of algal material. Extraction was performed at the constant conditions of 340 bar and 40 °C for 2 h. After extraction, the system was completely depressurized and the extract was obtained.
Additionally, conventional extraction was performed using petroleum benzine. The whole process took 3 h at 40 °C. To obtain conventional (petroleum benzine-free) dry extract (CON), the solvent was evaporated using a rotary evaporator. Extraction procedures are based on the preliminary single-factor experiments (not reported) and literature data (Gupta 2021, Esquivel-Hernández).

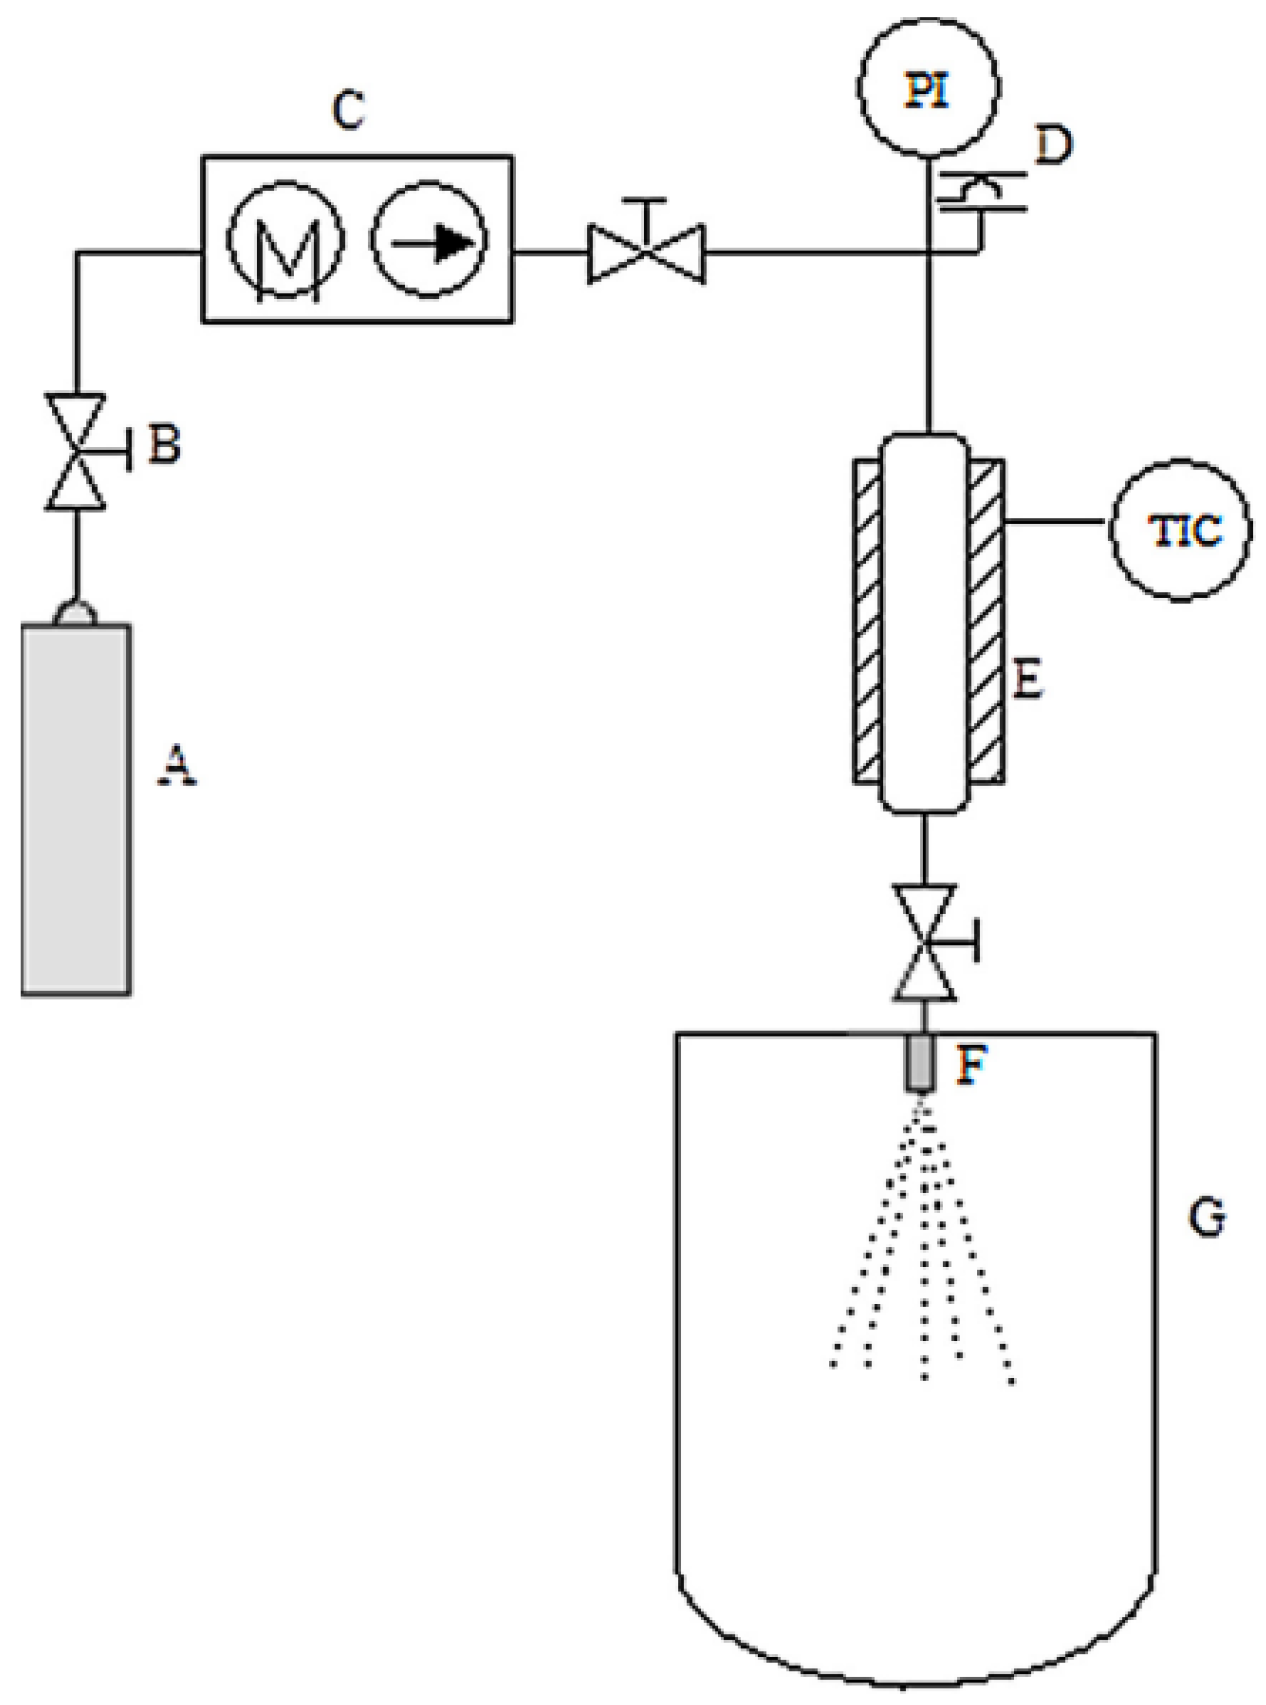
2.3. Particles from Gas-Saturated Solution (PGSS) Process

The microparticles were produced using an apparatus based on the PGSS process; an autoclave is loaded initially with 0.5 g of the extract and 9.5 g of the polyethylene glycol PEG 4000. A high-pressure pump was used to compress the liquid CO2 from the gas cylinder into the system (Figure 2). When the desired pressure (180 bar) and temperature (70 °C) were reached, the stirring of the system began and continued for 2 h. The gas-saturated solution was then rapidly expanded through the 1 cm nozzle in a spray tower and the gas (CO2) evaporated. The solution was cooled below the mixture’s solidification temperature as a result of the Joule–Thomson effect, as well as possible gas evaporation and volume expansion, and fine particles were produced and collected into a collection vessel. The procedure followed the protocol by Perko et al. [16], while solubility data were obtained from the literature [17].
Encapsulation yield was calculated as the ratio between the mass of collected particles and the mass of the initial feed (mass of dry extract + mass of PEG) (1):
Encapsulation yield: (mcollected particles/minitialfeed) × 100

2.4. Chemical Characterization of Microparticles

The encapsulation efficiency of pigment microparticles was measured via a UV-vis spectrophotometer. Samples were prepared according to the method described in detail by Vo et al. [18], with slight modifications. For the determination of surface pigment content, 500 mg of microparticles were mixed with 6 mL hexane for 1 min to completely separate surface pigments from the microparticles. The obtained mixture was centrifuged for 10 min at 5000 rpm, and the supernatant was filtered using a 0.2 μm syringe filter and measured. For total pigment content, 500 mg of microparticles were mixed with a mixture consisting of 3 mL methanol and 3 mL acetone to completely dissolve microparticles, and then sonicated for 10 min. The obtained mixture was filtered using the 0.2 μm syringe filter and measured. Equations (2)–(4) from Lichtenthaler and Buschmann [19] were used to calculate the total concentrations of chlorophyll a, chlorophyll b, and carotenoids in the samples. The absorbances were measured at 665.2 nm, where chlorophyll a exhibits its maximum absorbance, at 652.4 nm, where chlorophyll b exhibits its maximum absorbance, and at 470 nm, where carotenoids exhibit their maximum absorbance. All measurements were performed in triplicate.
ca = 16.82 × A665.2 − 9.28 × A652.4
cb = 36.92 × A652.4 − 16.54 × A665.2
c(x+c) = (1000 × A470 − 1.91 × ca − 95.15 × cb)/225
Encapsulation efficiency was calculated using the following equation:
EE ( % )   =   T o t a l   p i g m e n t   c o n t e n t s u r f a c e   p i g m e n t   c o n t e n t t o t a l   p i g m e n t   c o n t e n t × 100

2.5. Determination of Physical Properties of Microparticles

2.5.1. Solubility Properties

AACC Method 88-04 (AACC, 1983) was used to evaluate the water absorption index (WAI) and water solubility index (WSI). For WAI, 10 mL of distilled water and 0.8 g of microparticles were mixed. The mixtures were standing for 30 min with periodic mixing and then centrifuged for 15 min at 5000 rpm. Decanted supernatant was dried at 105 °C until a constant mass was reached. WAI and WSI were calculated using the following Equations (6) and (7):
WAI (g/g) = gel mass/dry matter mass of the initial sample
WSI = weight of dry matter in supernatant/dry matter of sample × 100

2.5.2. Color Properties
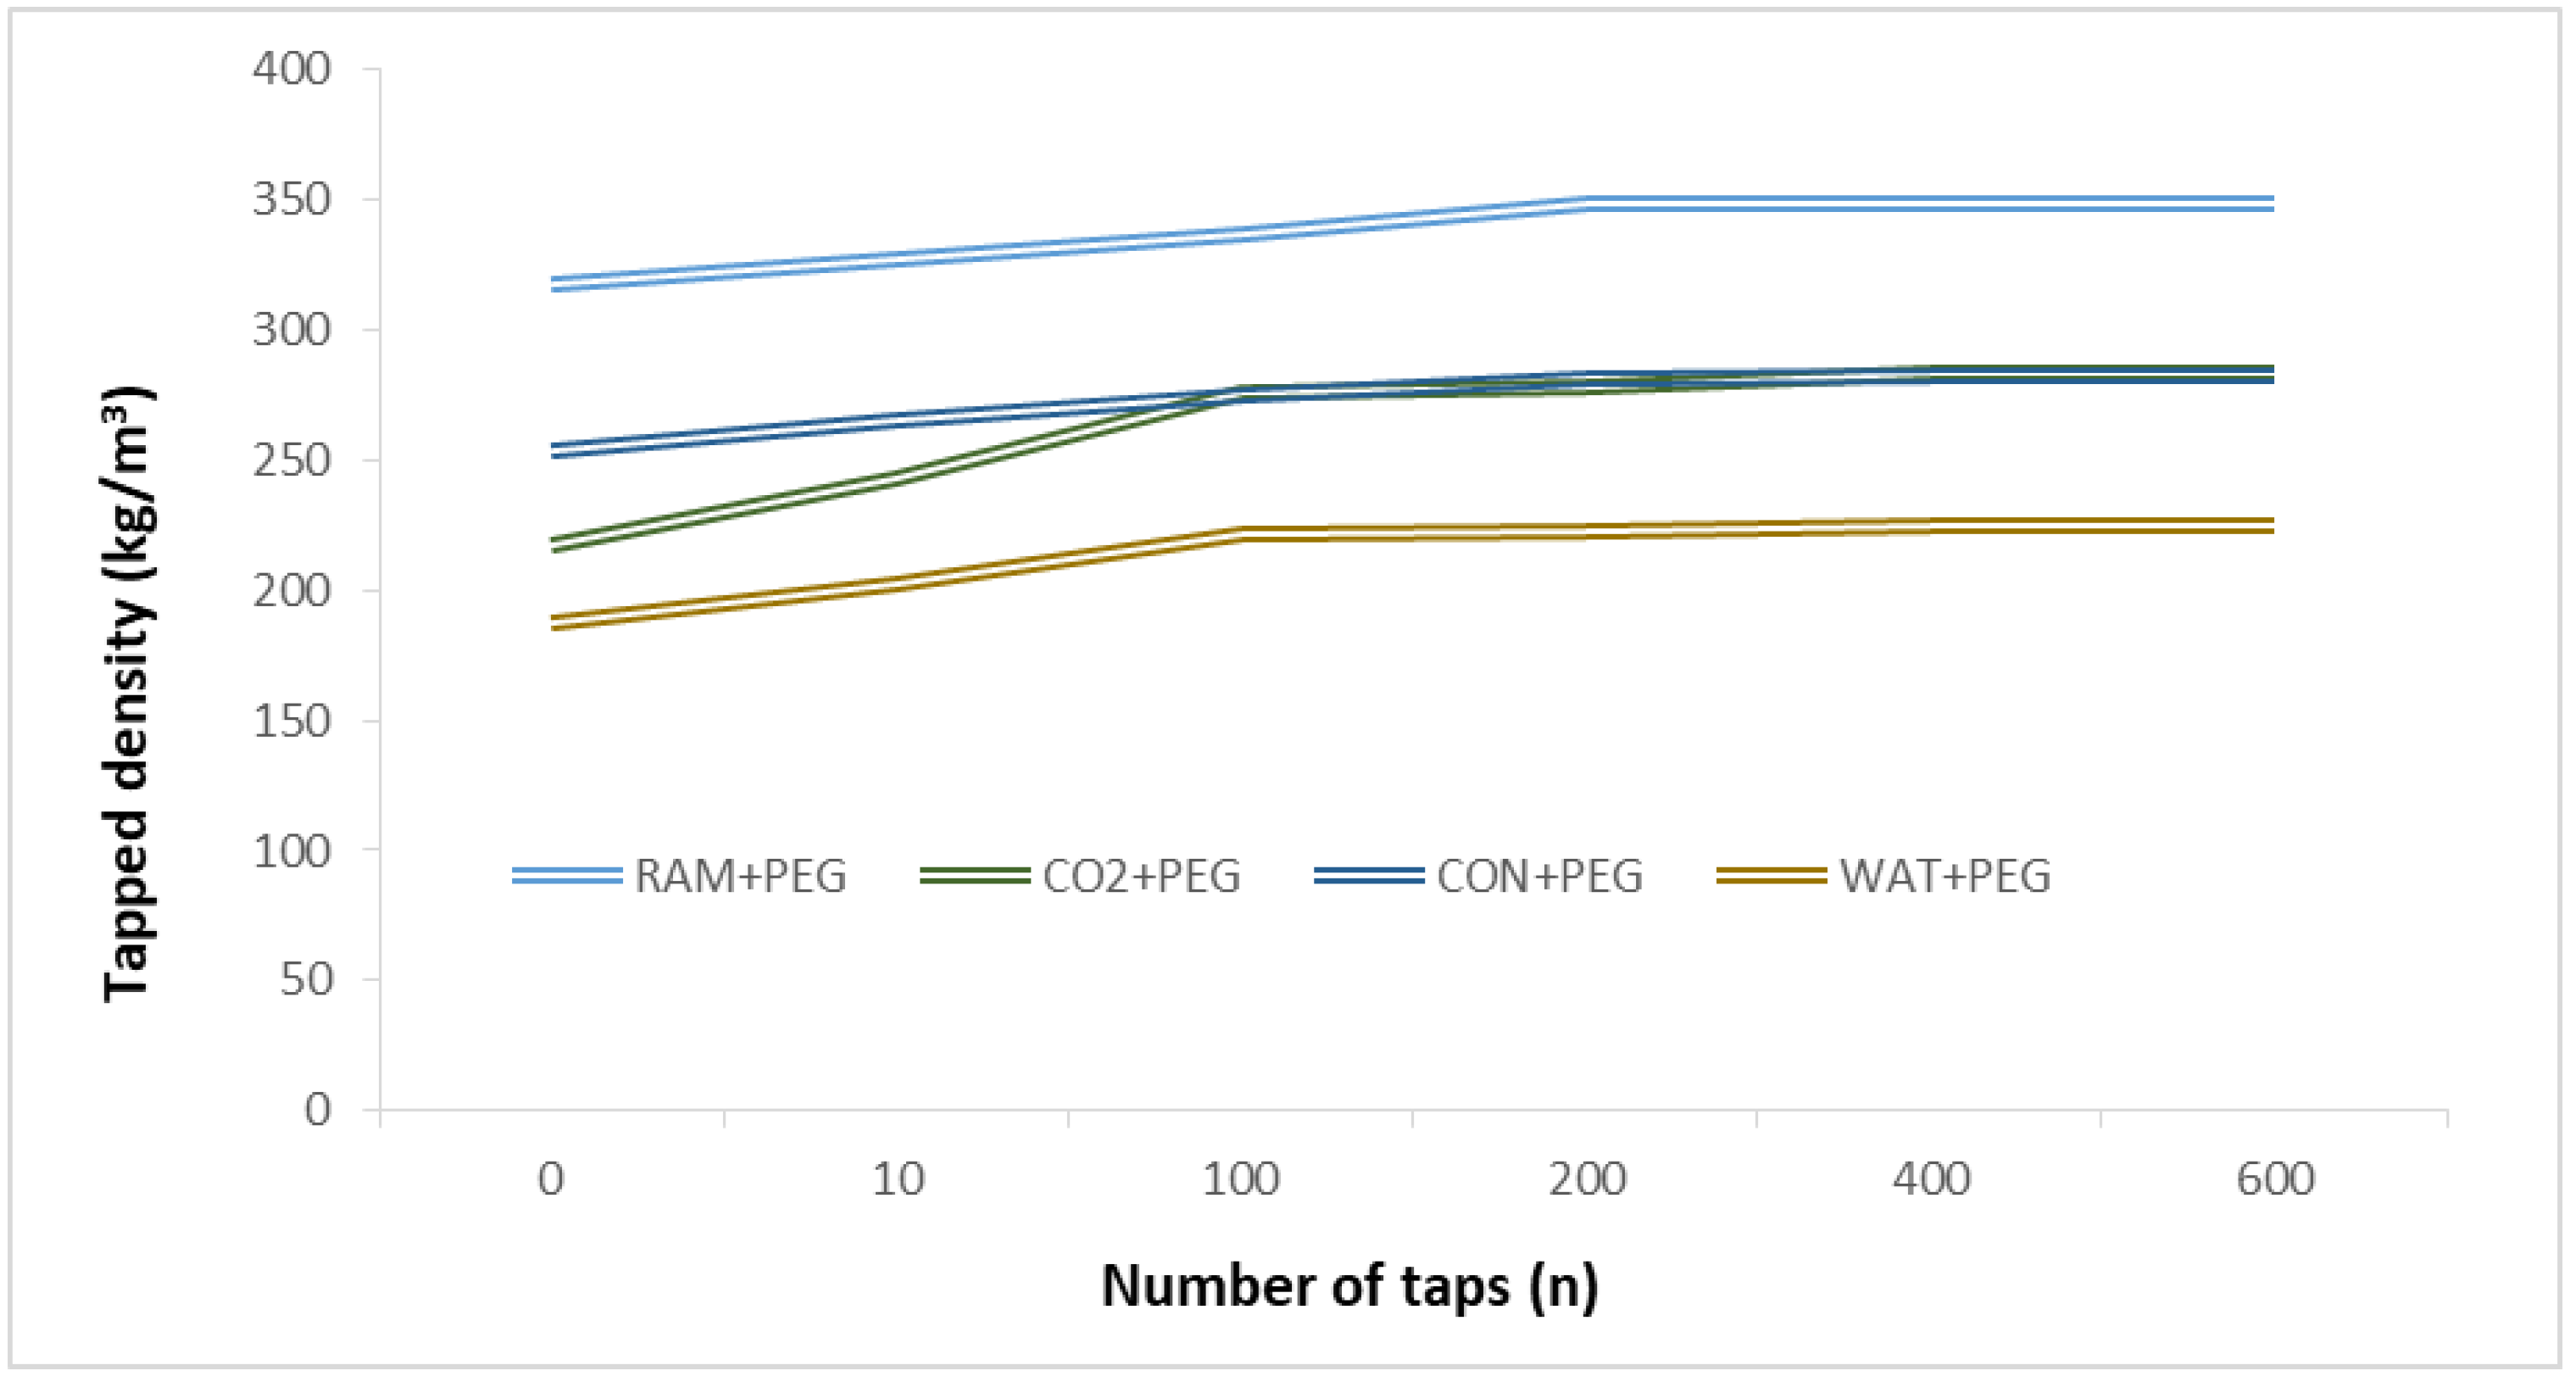
Using a Chroma Meter CR-300 from Konica Minolta in Japan, the color was determined. After the device was calibrated with a white color standard calibration plate, obtained color changes were expressed in CIE-Lab parameters as L* (whiteness/darkness), a* (redness/greenness), and b* (yellowness/blueness). Equation (8), where the subscript “0” denotes the initial color values of the raw algal material, was used to compute the total color change (DE). Additionally, Equation (9) was used to construct the whiteness index based on the measured values.
Δ E = ( L L 0 2 ) + ( b b 0 ) 2 + ( a a 0 ) 2
W I = 100 [ ( 100 L ) + a 2 + b 2 ] 0.5

2.5.3. Bulk Density

Bulk density was measured using an Automated tapped density analyzer (Anton Paar) with a number of taps from 10 to 600. Bulk density was expressed as kg/m3.

2.6. Environmental Scanning Electron Microscopy (ESEM)

An environmental scanning electron microscope (SEM) model Quanta FEI 200 3D microscope (FEI, Oregon, USA) with a tungsten cathode as an electron source was used to study the size and morphology of the sample. The accelerating voltage for imaging was 15 kV.

2.7. Thermogravimetric Analysis of Microparticles

A Mettler Toledo TGA/DSC1 STAR system (Mettler Toledo, Greifensee, Switzerland) was used to conduct the thermogravimetric analysis. About 5 mg of the samples for the materials examined in this study were put into the aluminum pans. Experiments were performed in a nitrogen atmosphere (30 mL/min) in the temperature range from 25 to 900 °C with a heating rate of 10 K/min and with simultaneous recording of thermogravimetric and DSC signals. Three measurements were made for each measurement to ensure repeatability.

2.8. Fourier-Transform Infrared Spectroscopy

The presence of functional groups was determined using an IRAffinity-1 Fourier-transform infrared spectrophotometer (Shimadzu, Kyoto, Japan) equipped with an attenuated total reflectance cell (ATR). The spectra of samples were recorded in the wavelength range of 4000 cm−1 and 400 cm−1 against the air as a background, at a resolution of 16 cm−1 and a total of 30 co-added scans. The data were analyzed with high-performance IR solution software.

3. Results and Discussion

3.1. Encapsulation Yield and Encapsulation Efficiency of Algae Pigment Microparticles

Encapsulation of algae pigments by the PGSS process was studied using extracts prepared with different extraction techniques. The conditions of pressure and temperature for the PGSS were selected to ensure a temperature above the melting point of PEG 4000 (62 °C) to provide good processability. As shown in Table 1, the yield of collected microparticles in the collecting vessel was from 61.60% to 73.73%. The discontinuous operating approach used in the study caused a reduction in average encapsulation yield because some of the initial pigment/PEG mixture was left in the reactor and/or on the spraying tower’s walls. The yield of collected particles was highest with WAT+PEG as the initial mixture. The EE of pigments in PEG varied in the ranges from 56.98 to 95.00%, from 65.48 to 83.40%, and from 43.02 to 62.31%, for chlorophyll a, chlorophyll b, and carotenoids respectively, and the results differed depending on the used extraction process. The pattern was the same with all pigment classes; the lowest EE was for raw algal material, followed by extract obtained with an ethanol-water solution and conventional extraction, while EE for SCO2E was the highest. The extracts due to differential solubility interacted with the PEG differently. Pure PEG 4000 has low polarity and therefore polar (SCO2E) extract is more soluble in PEG. These results showed good agreement with prior research employing the PGSS method to load active compounds into microparticles in terms of encapsulation efficiency [20,21].

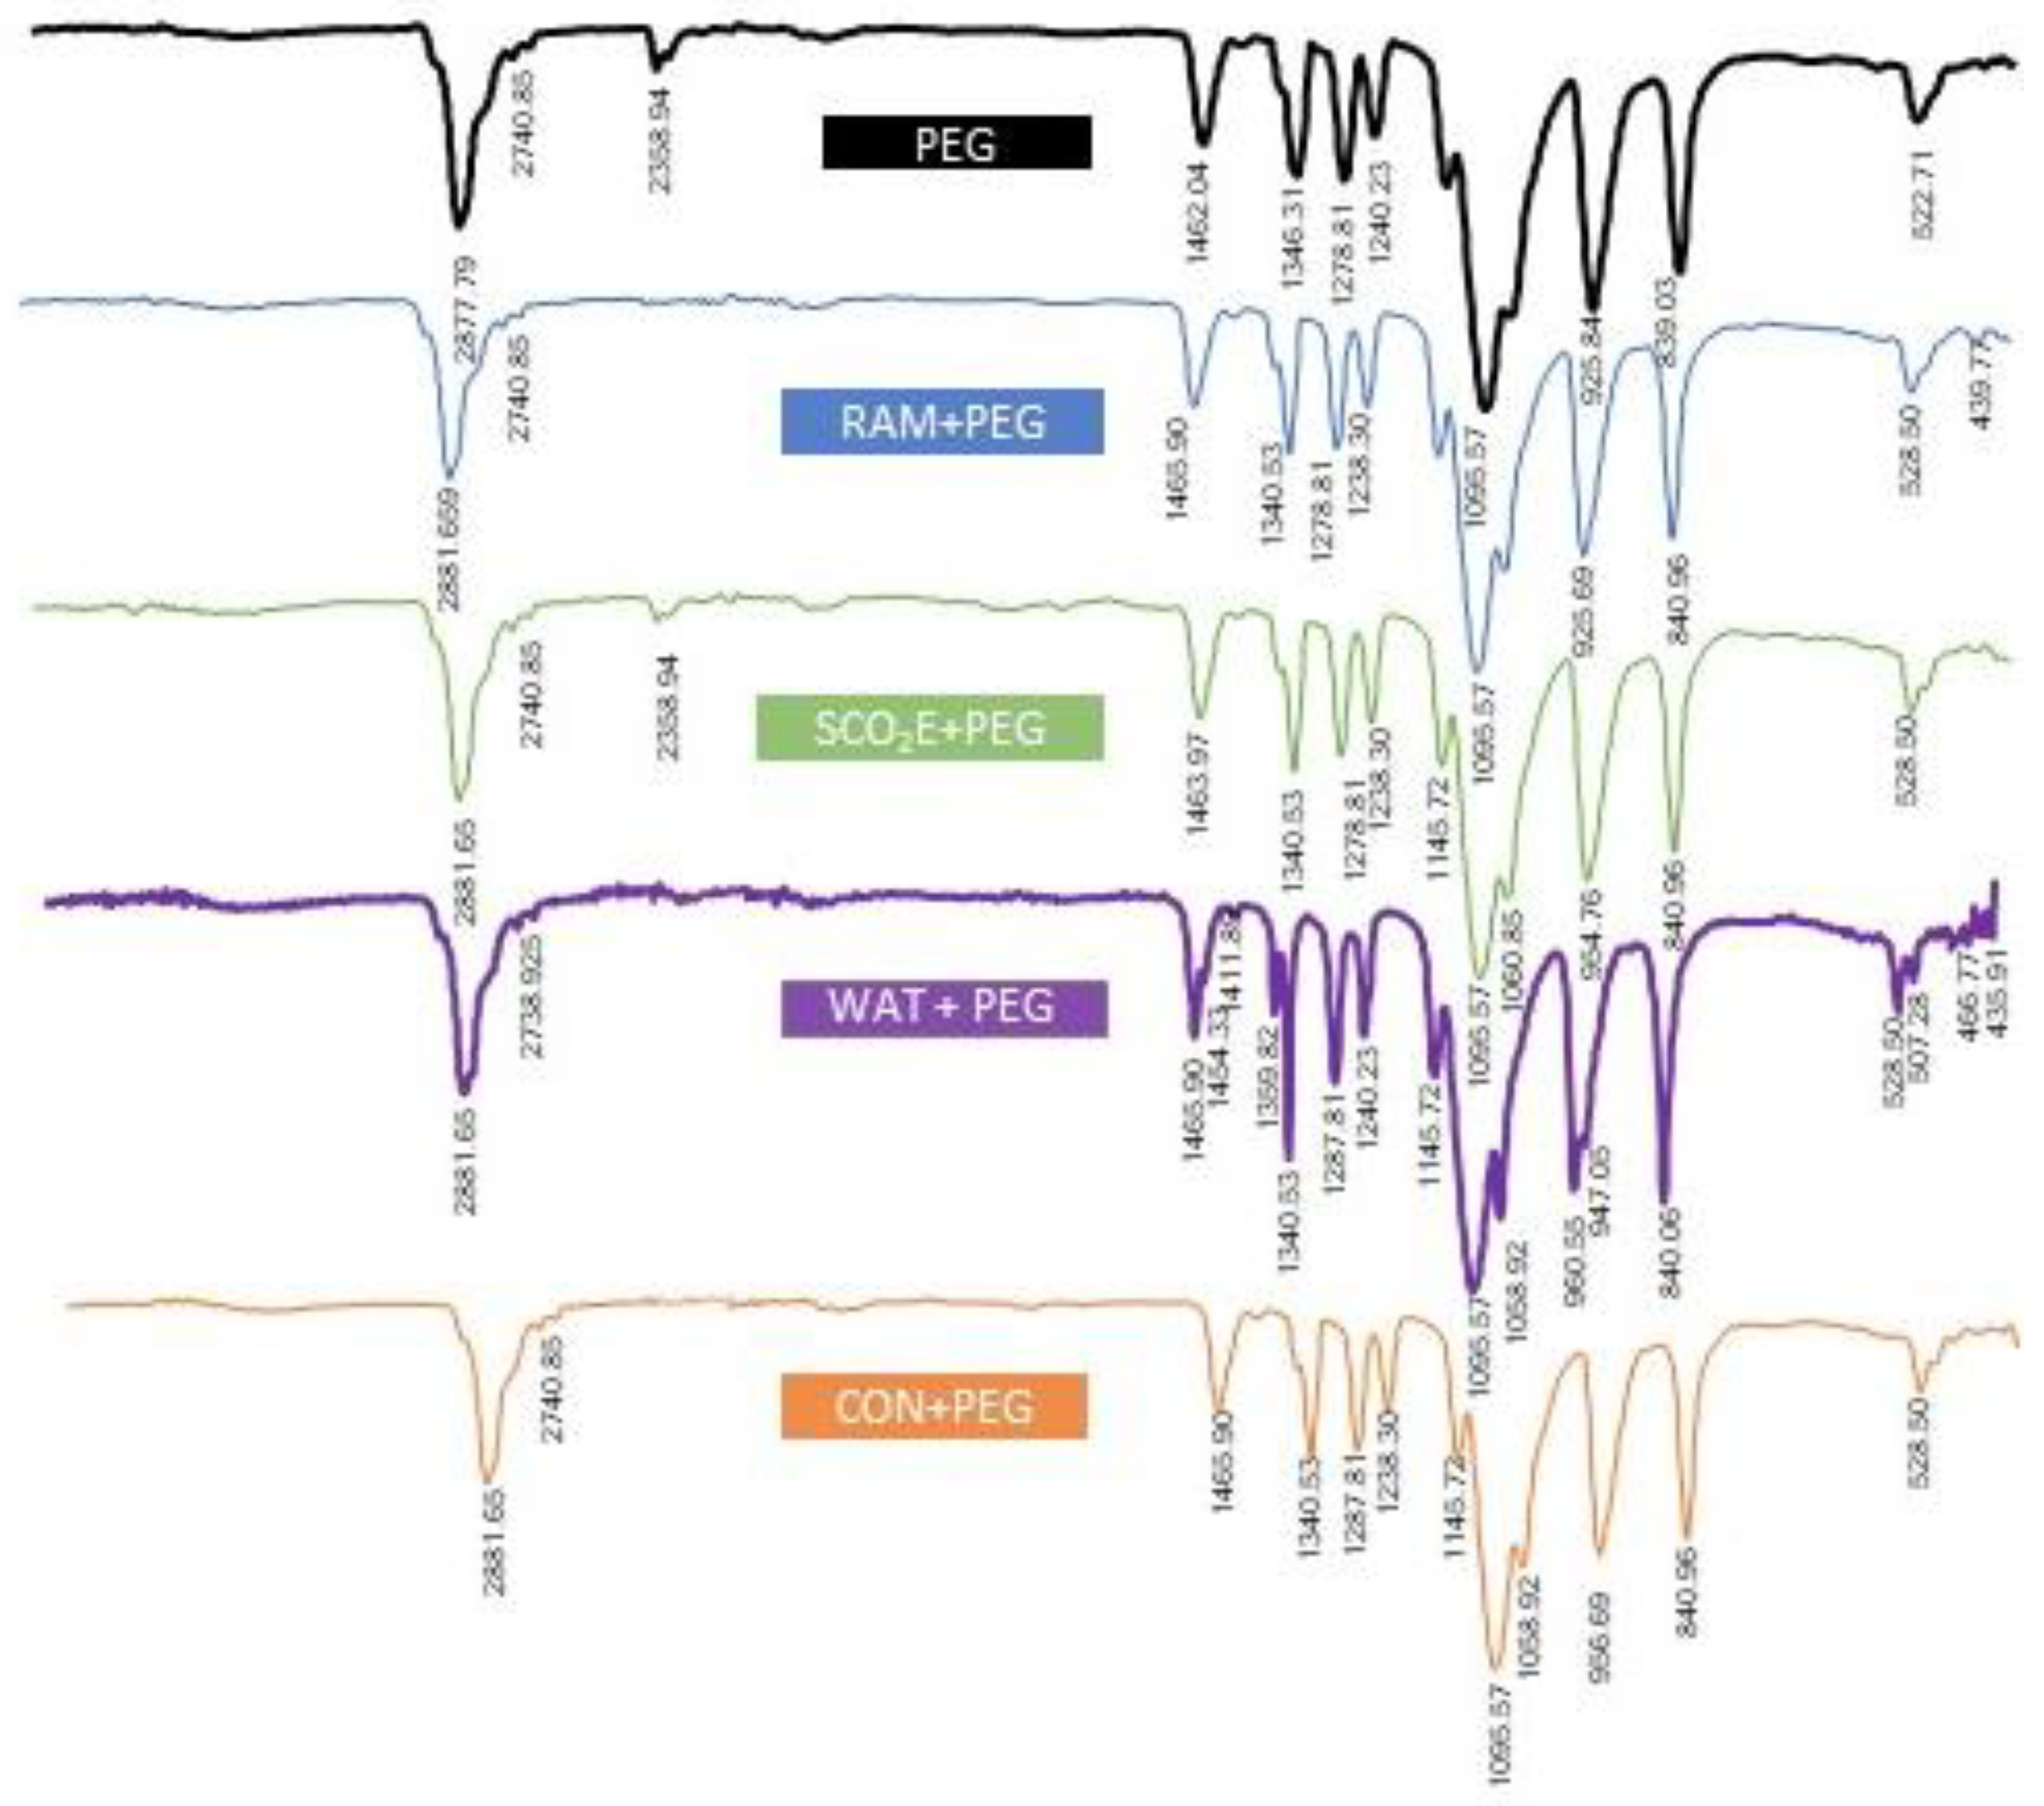
3.2. Fourier-Transform Infrared Spectroscopy (FTIR) of Algal Pigment Microparticles

FTIR analysis confirmed the encapsulation of algae pigments in PEG microparticles. Figure 3 shows the FTIR spectra of PEG 4000, and algae pigment microparticles of raw algal materials and extracts obtained with different extraction techniques. In the comparison of PEG with microparticles, the spectrum in the absorption bands at 430–520 and 1100–1400 cm−1 showed a considerable contribution of algae extract in the microparticles.
The absorption characteristics of PEG in the algae pigment microparticles processed by PGSS were represented from 4000 to 520 cm−1 (Figure 3). The carrier’s (PEG 4000) spectrum bands were visible at 2881.65 cm−1 due to -C-H stretching vibrations, and at 1465 and 1340 cm−1 due to -C-H vibrations. Two bands at 1278–1058 cm−1 were due to the stretching vibrations of the alcoholic -O-H and -C-O-C ether linkages [22]. In the comparison of PEG and microparticles, the band at 950 cm−1 of the microparticle showed a considerable contribution of algae extract in the microparticles. The band is assignable to the C=C, a trans-substituted functional group that is characteristic of brown macroalgae [23]. These findings allowed us to confirm that SCO2 extract was well encapsulated in PEG 4000. However, FTIR spectra of PEG and microparticles prepared by the PGSS technique were very similar, demonstrating that the PEG’s chemical structure was not changed by the PGSS processing.

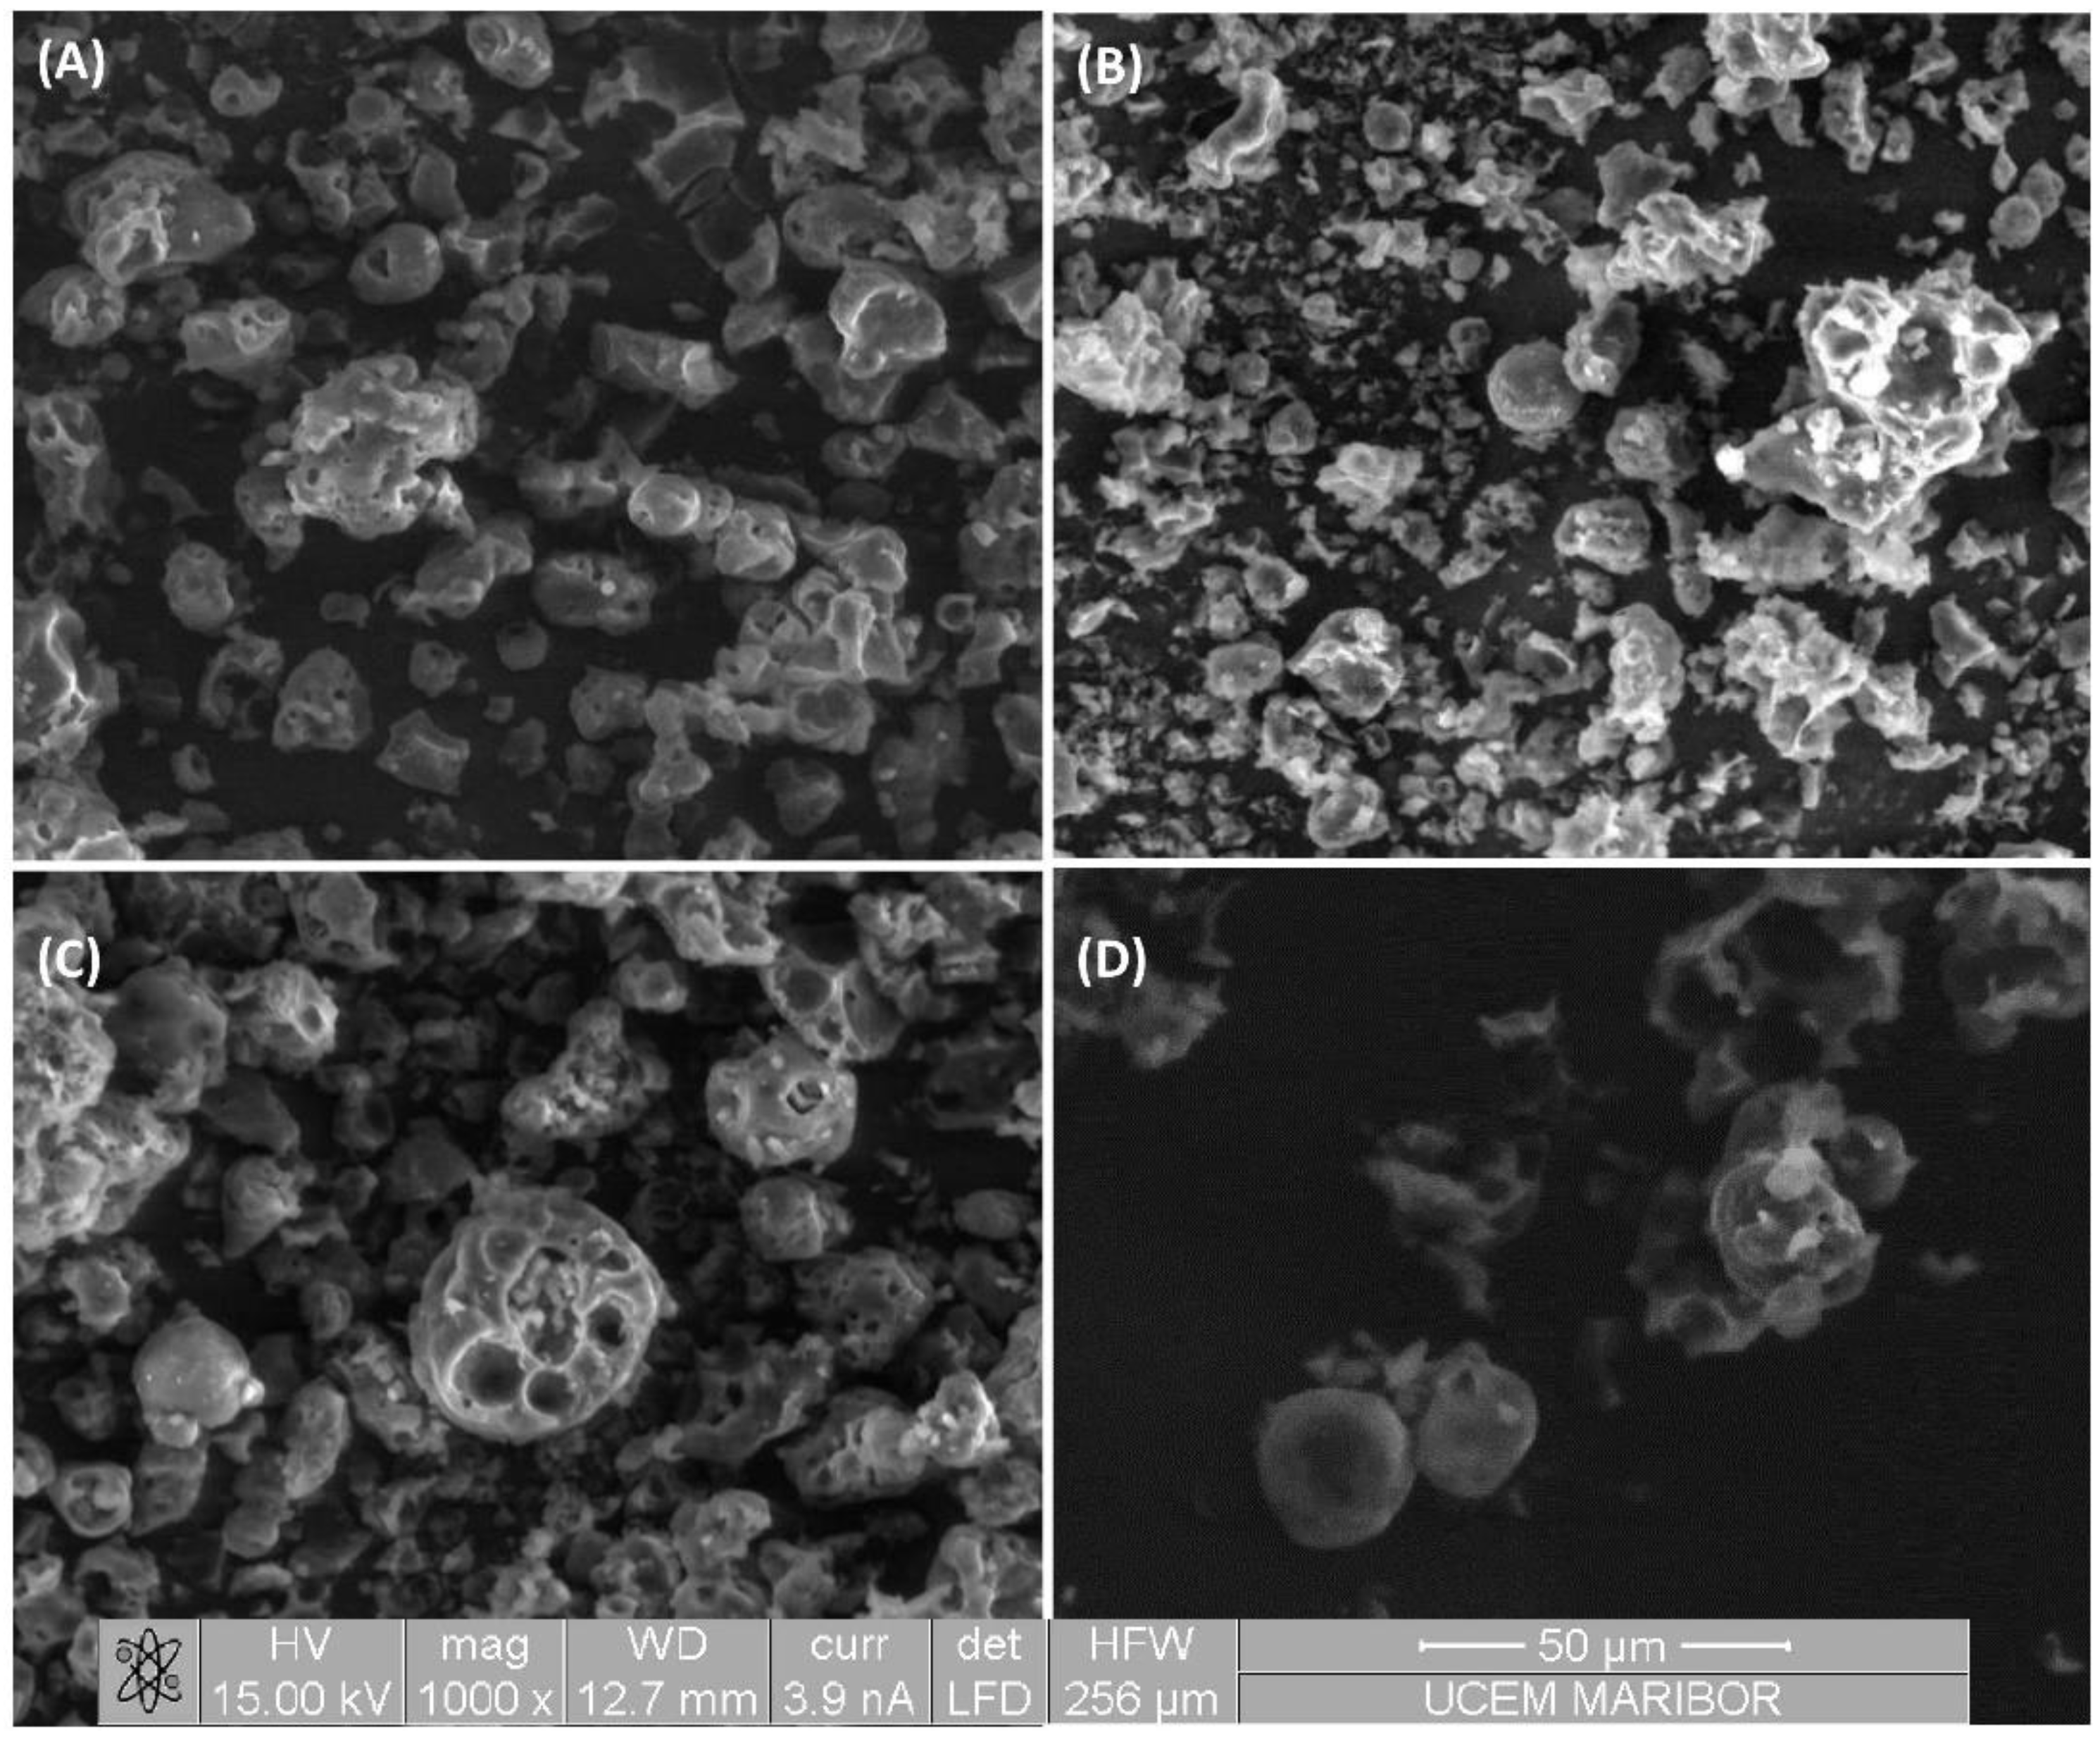
3.3. Morphology of Algal Pigment Microparticles

Processing of pigment extract with the PGSS process resulted in porous particles of varied shapes and of a smaller particle size (Figure 4B–D) compared to the original material (Figure 4A). The solidification of the material after depressurization and the release of CO2 from the substance caused an open and porous structure of microparticles [24]. Other encapsulation processes, such as spray drying, also show the non-sphericity of microparticles, and this morphology can affect the way active compound is released since it has shorter active compound diffusion paths [25,26].

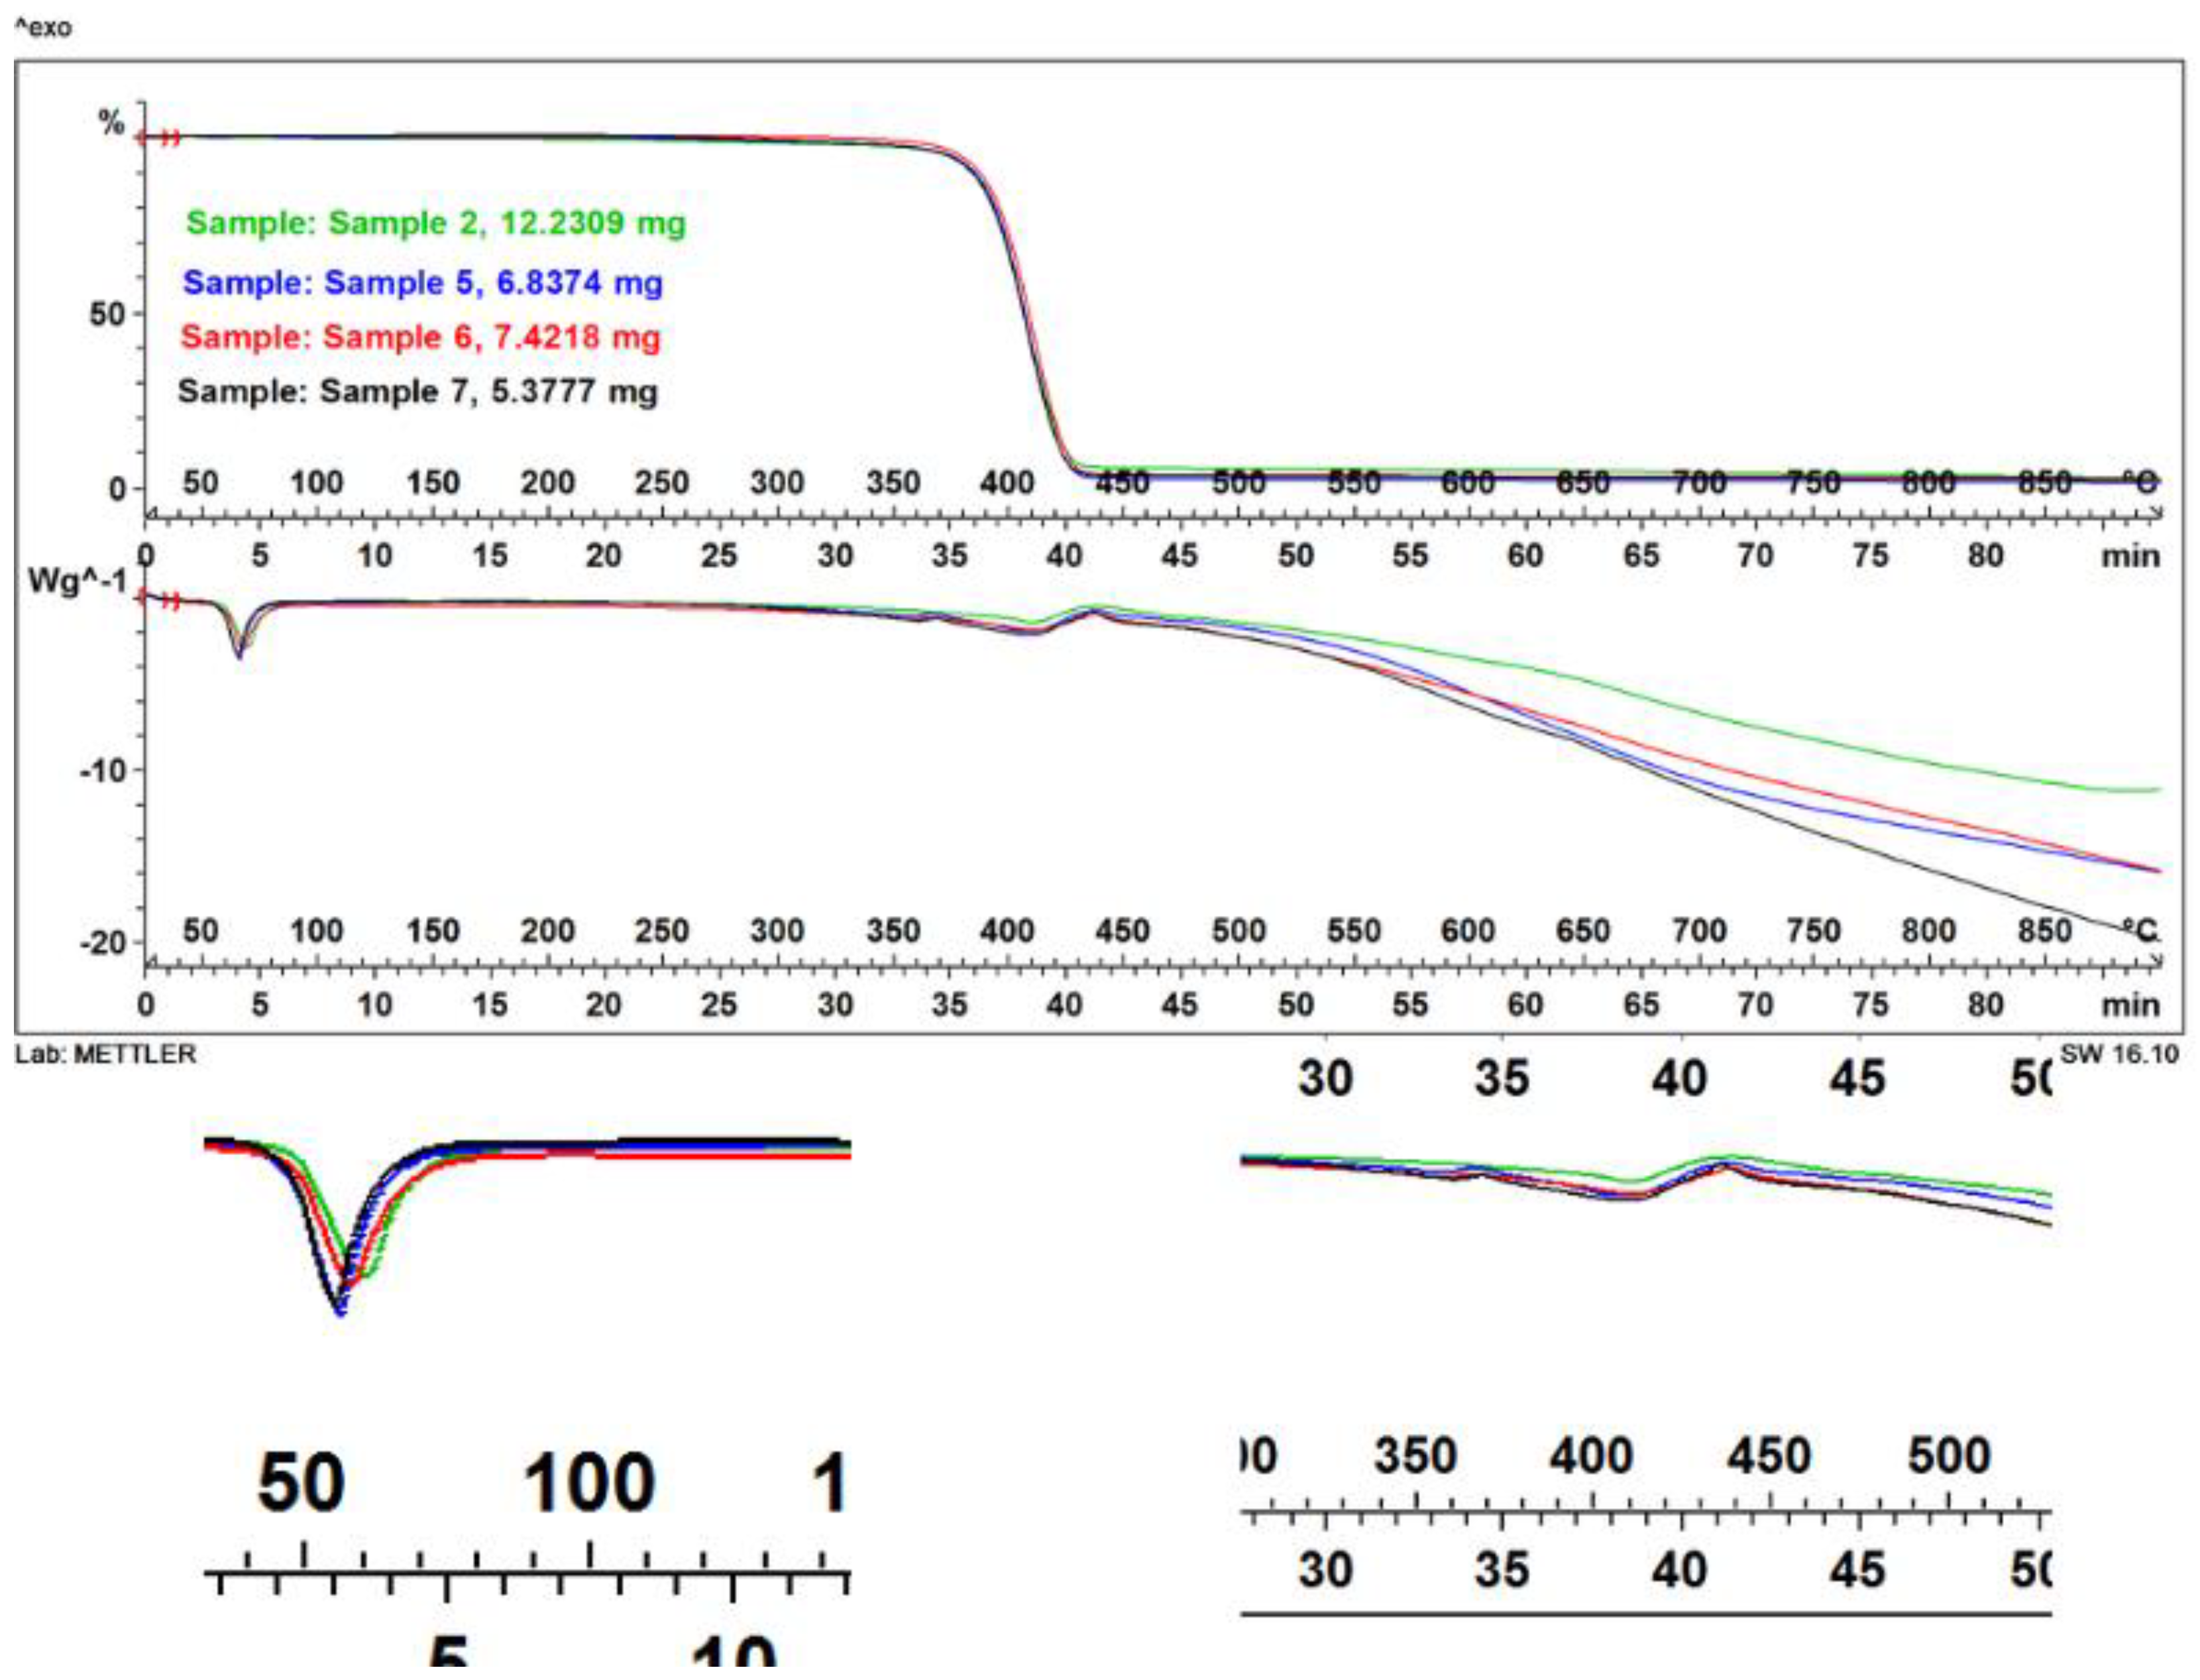
3.4. Thermal Behavior of Algal Pigment Microparticles

For more detailed analysis of the obtained microparticles, structural transitions in the microparticles were obtained by the PGSS process using the DSC and TGA methods at temperatures ranging from 25–900 °C. The thermogravimetric change of algae pigment microparticles was compared with the PEG to evaluate the thermal stability of the obtained microparticles (Figure 5). The desorption peak that would be assigned to algae pigment extract was not detected in the thermogram of microparticles. Lower onset melting temperature in the case of SCO2E and the absence of an extract endothermic melting peak indicate that the extract was a disrupted PEG crystalline structure. The melting enthalpy (ΔHm) was very similar to carrier enthalpy for extracts obtained with conventional extractions (WAT and CON), while that for RAM was significantly lower. However, the melting enthalpy (ΔHm) increased when SCO2E was encapsulated, which indicates the higher thermal energy storage capacity of microparticles (Table 2).
The thermograms of the microparticles showed a characteristic peak at around 60 °C of the PEG [26], without an extract peak indicating that the extract was completely encapsulated into a carrier during DSC measurement. The samples’ thermogravimetric curves followed a consistent pattern, and Figure 5 shows that the microparticles exhibit a thermal decomposition that begins in the temperature range between 180 and 280 °C, and ends at temperatures above 430 °C. These microparticle thermal characteristics are comparable to those reported for PEG 4000 by Kou et al. [27] and Karaman et al. [28].

3.5. Physical Properties of Algal Pigment Microparticles

Table 3 shows the colour change of microparticles in comparison with PEG. In comparison with PEG, the L value was reduced while redness slightly increased. Moreover, the yellowness of the powder significantly increased, which is probably linked to encapsulated pigments. As previously reported, chlorophyll a, chlorophyll b and carotenoids are the major pigments that contributed to the photosynthetic performance of Fucus [29]. They probably remained on the surface of the microcapsule and gave the final particles their green-brown colour. It is perceptible that after the PGSS process, microparticles became lighter. This effect occurs due to the encapsulation effect, where pigment particles are entrapped into the shell material.
Results for WAI and WSI showed that the PGSS process improved the solubility of dry extract microparticles in comparison with RAM. The solubility properties of pigment microparticles were similar to PEG properties. This could be related to the loss of structural order, caused by the penetration of water. Another reason for increased solubility could be the reduction of the particle size resulting in increased total surface area (Table 3). WSI values of extract microparticles were very similar to the WSI of pure PEG, indicating that WSI depends directly on the properties of the coating materials, which was also found by Shaygania et al. [30]. Lower WSI values of RAM encapsulated in PEG could be assigned to the presence of insoluble fibre in algal material. In addition, when WAI and WSI are compared, one trend can be observed where the percentage of water absorption decreases with increased water solubility of the microparticles. However, even though high water solubility is desired for application in the food and pharmaceutical industry, some additional analyses also need to be conducted. According to Ahmed et al. [31] agglomeration of the encapsulated particles could contribute to a smaller WAI, and subsequently increase WSI.
The final microparticle water content can be utilized to estimate how stable they will be during storage. The final level for all microparticles was below 2%. Results indicate that relatively dry and microbiological stable powders can be obtained by the PGSS process [32].
The bulk density of the microparticle is a crucial parameter that indicates how effectively the microparticle fits compactly. In handling and processing procedures such as transportation, mixing, compression, and packing, the microparticle’s flowability and cohesiveness are crucial [33]. As particle size decreases, the cohesivity of powder should increase. As the forces between the particles weaken, a free-flowing powder has a higher bulk density and is therefore packed more densely [34,35]. According to flowability data (Figure 6), CON+PEG and RAM+PEG microparticles have excellent flowability, while the flowability properties of WAT +PEG microparticles were fair, and for CO2+PEG they were passable.

4. Conclusions

Algae pigment microparticles were successfully prepared by the PGSS process using PEG as the carrier material. To ensure good process capability, the pressure and temperature conditions for the PGSS process were chosen above the melting point of PEG. Particles produced with CO2 extract showed the highest encapsulation efficiency in terms of chlorophyll a, chlorophyll b, and carotenoid content. Since the physicochemical properties of microparticles were enhanced during the PGSS process, these PEG microparticles represent a promising delivery system for pigments, with the expected promotion of their bioactivities and viability during processing and long-term storage. Therefore, this study provides the basis for the application of the PGSS process for the production of algal pigment delivery vehicles.

Author Contributions

Conceptualization, M.B., M.Š. and S.J.; methodology, M.Č., K.A., A.-M.C. and M.B.; formal analysis, M.B., M.Č. and A.-M.C.; investigation, M.B.; resources, S.J.; writing—original draft preparation, M.B.; writing—review and editing, S.J., M.Č. and M.B. All authors have read and agreed to the published version of the manuscript.

Funding

This research was funded by the Croatian Government and the European Union through the European Regional Development Fund—the Competitiveness and Cohesion Operational Programme (KK.01.1.1.01), and The Scientific Centre of Excellence for Marine Bioprospecting—BioProCro. The authors would like to acknowledge the Slovenian Research Agency (ARRS) for financing this research within the frame of Programme P2-0421 (Sustainable technologies and Circular Economy).

Institutional Review Board Statement

Not applicable.

Informed Consent Statement

Not applicable.

Data Availability Statement

The data presented in this study are available on request from the corresponding author.

Acknowledgments

We would like to thank the Croatian Government and the European Union through the European Regional Development Fund—the Competitiveness and Cohesion Operational Programme (KK.01.1.1.01) for funding The Scientific Centre of Excellence for Marine Bioprospecting—BioProCro. We are also grateful to Donat Petricioli for the sample identification and collection.

Conflicts of Interest

The authors declare no conflict of interest.

References

  1. Osório, C.; Machado, S.; Peixoto, J.; Bessada, S.; Pimentel, F.B.; Alves, R.C.; Oliveira, M.B.P.P. Pigments content (Chlorophylls, Fucoxanthin and Phycobiliproteins) of different commercial dried algae. Separations 2020, 7, 33. [Google Scholar] [CrossRef]
  2. Wells, M.L.; Potin, P.; Craigie, J.S.; Raven, J.A.; Merchant, S.S.; Helliwell, K.E.; Smith, A.G.; Camire, M.E.; Brawley, S.H. Algae as nutritional and functional food sources: Revisiting our understanding. J. Appl. Phycol. 2017, 29, 949–982. [Google Scholar] [CrossRef] [PubMed]
  3. Maeda, H.; Kanno, S.; Kodate, M.; Hosokawa, M.; Miyashita, K. Fucoxanthinol, metabolite of fucoxanthin, improves obesity-induced inflammation in adipocyte cells. Mar. Drugs 2015, 13, 4799–4813. [Google Scholar] [CrossRef] [PubMed] [Green Version]
  4. Dong, X.; Bai, Y.; Xu, Z.; Shi, Y.; Sun, Y.; Janaswamy, S.; Yu, C.; Qi, H. Phlorotannins from Undaria pinnatifida Sporophyll: Extraction, Antioxidant, and Anti-Inflammatory Activities. Mar. Drugs 2019, 17, 434. [Google Scholar] [CrossRef] [Green Version]
  5. Azeem, M.; Iqbal, N.; Mir, R.A.; Adeel, S.; Batool, F.; Khan, A.A.; Gul, S. Harnessing natural colorants from algal species for fabric dyeing: A sustainable eco-friendly approach for textile processing. J. Appl. Phycol. 2019, 31, 3941–3948. [Google Scholar] [CrossRef]
  6. El-Khatib, E.; Ali, N.F.; El-Mohamedy, R. Enhancing dyeing of wool fibers with colorant pigment extracted from green algae. J. Chem. Pharm. Res. 2016, 8, 614–619. [Google Scholar]
  7. Cikoš, A.M.; Šubarić, D.; Roje, M.; Babić, J.; Jerković, I.; Jokić, S. Recent advances on macroalgal pigments and their biological activities (2016–2021). Algal Res. 2022, 65, 102748. [Google Scholar] [CrossRef]
  8. Janiszewska-Turak, E. Carotenoids microencapsulation by spray drying method and supercritical micronization. Int. Food Res. J. 2017, 99, 891–901. [Google Scholar] [CrossRef]
  9. Akolade, J.O.; Balogun, M.; Swanepoel, A.; Ibrahim, R.B.; Yusuf, A.A.; Labuschagne, P. Microencapsulation of eucalyptol in polyethylene glycol and polycaprolactone using particles from gas-saturated solutions. RSC Adv. 2019, 23, 34039–34049. [Google Scholar] [CrossRef] [Green Version]
  10. Priamo, W.L.; Dalmolin, I.; Boschetto, D.L.; Mezzomo, N.; Ferreira, S.R.S.; de Oliveira, J.V. Micronization processes by supercritical fluid technologies: A short review on process design (2008–2012). Acta Sci. Technol. 2013, 35, 695–709. [Google Scholar]
  11. Islam, T.; Al Ragib, A.; Ferdosh, S.; Uddin, A.H.; Haque Akanda, M.J.; Mia, M.A.R.; Islam Sarker, M.Z. Development of nanoparticles for pharmaceutical preparations using supercritical techniques. Chem. Eng. Com. 2022, 209, 1642–1663. [Google Scholar] [CrossRef]
  12. Kwon, K.T.; Uddin, M.S.; Jung, G.W.; Chun, B.S. Preparation of micro particles of functional pigments by gas-saturated solution process using supercritical carbon dioxide and polyethylene glycol. Korean J. Chem. Eng. 2011, 28, 2044. [Google Scholar] [CrossRef]
  13. Knez, Ž.; Škerget, M.; Hrnčič, M.K.; Čuček, D. Particle formation using sub-and supercritical fluids. In Supercritical Fluid Technology for Energy and Environmental Applications; Elsevier: Amsterdam, The Netherlands, 2014; pp. 31–67. [Google Scholar]
  14. Knez, Ž.; Knez Hrnčič, M.; Škerget, M. Particle formation and product formulation using supercritical fluids. Annu. Rev. Chem. Biomol. Eng. 2015, 6, 379–407. [Google Scholar] [CrossRef] [PubMed]
  15. Jung, M.; Perrut, M. Particle design using supercritical fluids: Literature and patent survey. J. Supercrit. Fluids 2011, 20, 179–219. [Google Scholar] [CrossRef]
  16. Perko, T.; Ravber, M.; Knez, Ž.; Škerget, M. Isolation, characterization and formulation of curcuminoids and in vitro release study of the encapsulated particles. J. Supercrit. Fluids 2015, 103, 48–54. [Google Scholar] [CrossRef]
  17. Weidner, E.; Wiesmet, V.; Knez, Ž.; Skerget, M. Phase equilibrium (solid-liquidgas)in polyethyleneglycol-carbon dioxide systems. J. Supercrit. Fluids 1997, 10, 139–147. [Google Scholar] [CrossRef]
  18. Vo, D.T.; Saravana, P.S.; Woo, H.C.; Chun, B.S. Fucoxanthin-rich oil encapsulation using biodegradable polyethylene glycol and particles from gas-saturated solutions technique. J. CO2 Util. 2018, 26, 359–369. [Google Scholar] [CrossRef]
  19. Lichtenthaler, H.K.; Buschmann, C. chlorophylls and carotenoids: Measurement and characterization by uv-vis spectroscopy. Curr. Protoc. Food Anal. Chem. 2001, 1, F4.3.1–F4.3.8. [Google Scholar] [CrossRef]
  20. García-González, C.A.; Argemí, A.; Sousa, A.R.S.; de Duarte, C.M.M.; Saurina, J.; Domingo, C. Encapsulation efficiency of solid lipid hybrid particles prepared using the PGSS® technique and loaded with different polarity active agents. J. Supercrit. Fluids 2010, 54, 342–347. [Google Scholar] [CrossRef]
  21. López-Iglesias, C.; Quílez, C.; Barros, J.; Velasco, D.; Alvarez-Lorenzo, C.; Jorcano, J.L.; Monteiro, F.J.; García-González, C.A. Lidocaine-loaded solid lipid microparticles (SLMPs) produced from gas-saturated solutions for wound applications. Pharmaceutics 2020, 12, 870. [Google Scholar] [CrossRef]
  22. Lee, S.C.; Surendhiran, D.; Chun, B.S. Extraction and encapsulation of squalene-rich cod liver oil using supercritical CO2 process for enhanced oxidative stability. J. CO2 Util. 2022, 62, 102104. [Google Scholar] [CrossRef]
  23. Kartikaningsih, H.; Mufti, E.D.; Nurhanief, A.E. Fucoxanthin from brown seaweed Sargassum cristaefolium tea in acid pH. In AIP Conference Proceedings; AIP Publishing LLC: Melville, NY, USA, 2017; Volume 1844, p. 030009. [Google Scholar]
  24. Khosa, A.; Reddi, S.; Saha, R.N. Nanostructured lipid carriers for site-specific drug delivery. Biomed. Pharmacother. 2018, 103, 598–613. [Google Scholar] [CrossRef]
  25. Battaglia, L.; Gallarate, M.; Panciani, P.P.; Ugazio, E.; Sapino, S.; Peira, E.; Chirio, D. Techniques for the Preparation of Solid Lipid Nano and Microparticles. In Application of Nanotechnology in Drug Delivery; Sezer, A.D., Ed.; IntechOpen: London, UK, 2014; ISBN 978-953-51-1628-8. [Google Scholar]
  26. Ghosh, M.K.; Wahed, M.I.I.; Ali, M.A.; Barman, R.K. Formulation and characterization of fenofibrate loaded solid dispersion with enhanced dissolution profile. J. Pharm. Pharmacol. 2019, 10, 343–355. [Google Scholar] [CrossRef] [Green Version]
  27. Kou, Y.; Wang, S.; Luo, J.; Sun, K.; Zhang, J.; Tan, Z.; Shi, Q. Thermal analysis and heat capacity study of polyethylene glycol (PEG) phase change materials for thermal energy storage applications. J. Chem. Thermodyn. 2018, 128, 259–274. [Google Scholar] [CrossRef]
  28. Karaman, S.; Karaipekli, A.; Sarı, A.; Biçer, A. Polyethylene glycol (PEG)/diatomite composite as a novel form-stable phase change material for thermal energy storage. Sol. Energy Mater. Sol. Cells 2011, 95, 1647–1653. [Google Scholar] [CrossRef]
  29. Matishov, G.G.; Makarov, M.V. Changes in the pigment composition of Fucus Vesiculosus l. and Fucus Serratus l. from the barents sea during prolonged exposure to the dark. Dokl. Biol. Sci. 2004, 397, 338–339. [Google Scholar] [CrossRef]
  30. Shaygannia, S.; Eshaghi, M.R.; Fazel, M.; Hashemiravan, M. The Effect of Microencapsulation of Phenolic Compounds from Lemon Waste by Persian and Basil Seed Gums on the Chemical and Microbiological Properties of Mayonnaise. Prev. Nutr. Food Sci. 2021, 31, 82–91. [Google Scholar] [CrossRef]
  31. Ahmed, M.; Akter, M.S.; Lee, J.C.; Eun, J.B. Encapsulation by spray drying of bioactive components, physicochemical and morphological properties from purple sweet potato. LWT Food Sci. Technol. 2010, 43, 1307–1312. [Google Scholar] [CrossRef]
  32. Haq, M.; Chun, B.S. Microencapsulation of omega-3 polyunsaturated fatty acids and astaxanthin-rich salmon oil using particles from gas saturated solutions (PGSS) process. LWT 2018, 92, 523–530. [Google Scholar] [CrossRef]
  33. Abdullah, E.C.; Geldart, D. The use of bulk density measurements as flowability indicators. Powder Technol. 1999, 102, 151–165. [Google Scholar] [CrossRef]
  34. Gupta, A.K.; Seth, K.; Maheshwari, K.; Baroliya, P.K.; Meena, M.; Kumar, A.; Vinayak, V. Biosynthesis and extraction of high-value carotenoid from algae. Front. Biosci. Landmark 2021, 26, 171–190. [Google Scholar]
  35. Esquivel-Hernández, D.A.; Ibarra-Garza, I.P.; Rodríguez-Rodríguez, J.; Cuéllar-Bermúdez, S.P.; Rostro-Alanis, M.d.; Alemán-Nava, G.S.; García-Pérez, J.S.; Parra-Saldívar, R. Green extraction technologies for high-value metabolites from algae: A review. Biofuels Bioprod. Biorefining 2017, 11, 215–231. [Google Scholar] [CrossRef]
Figure 1. Schematic overview of used procedure and methods (RAM+PEG—raw algal material, SCO2E+PEG—extract obtained with supercritical extraction, CON+PEG—dry extract obtained with conventional extraction, WAT+PEG—dry extract obtained with ethanol/water extraction, PEG—polyethylene glycol, RAM.—raw algal material.
Applsci 12 11496 g001
Figure 2. Laboratory apparatus for micronization with the PGSS (particles from gas-saturated solutions) process (A, carbon dioxide reservoir; B, valve; C, high-pressure pump; D, safety drive; E, autoclave; F, nozzle; G, expansion chamber; PI, analog manometer; TIC, thermo element with digital screen) (reprinted from The Journal of Supercritical Fluids, 103, Tina Perko, Matej Ravber, Željko Knez, Mojca Škerget, Isolation, characterization and formulation of curcuminoids and in vitro release study of the encapsulated particles, 4, Copyright (2022), with permission from Elsevier).
Applsci 12 11496 g002
Figure 3. FTIR spectra of the algae pigment microparticles obtained by the PGSS process (RAM+PEG—raw algal material, SCO2E+PEG—extract obtained with supercritical extraction, CON+PEG—dry extract obtained with conventional extraction, WAT+PEG—dry extract obtained with ethanol/water extraction, PEG—polyethylene glycol).
Applsci 12 11496 g003
Figure 4. Environmental scanning electron microscope (ESEM) photographs of polyethylene glycol microparticles of pigments of raw algal materials or extracts obtained with different extraction techniques: (A) raw algae material; (B) supercritical CO2 extraction; (C) ethanol/water extraction; (D) conventional extraction.
Applsci 12 11496 g004
Figure 5. DSC (Differential scanning calorimetry (DSC) and TGA (thermogravimetric analysis) of PEG microparticles of pigments of raw algal materials or extracts obtained with different extraction techniques: Sample 2: RAM+PEG—raw algal material, Sample 5: SCO2E+PEG—extract obtained with supercritical extraction, Sample 6: CON+PEG—dry extract obtained with conventional extraction, Sample 7: WAT+PEG—dry extract obtained with ethanol/water extraction, PEG—polyethylene glycol.
Applsci 12 11496 g005
Figure 6. Tapped density vs. number of taps of PEG microparticles of pigments of raw algal materials or extracts obtained with different extraction techniques: RAM+PEG—raw algal material, SCO2E+PEG—extract obtained with supercritical extraction, CON+PEG—dry extract obtained with conventional extraction, WAT+PEG—dry extract obtained with ethanol/water extraction, PEG—polyethylene glycol.
Applsci 12 11496 g006
Table 1. Encapsulation yield and pigment encapsulation efficiency for microparticles obtained with the PGSS process.
MicroparticlesEncapsulation Yield (%)EE Chlorophyll a
(%)
EE Chlorophyll b (%)EE Carotenoids
(%)
RAM+PEG61.6056.9865.4843.02
SCO2E+PEG66.0395.0075.9162.31
CON+PEG64.2470.7383.4057.33
WAT+PEG73.7357.0170.9555.37
EE—encapsulation efficiency, RAM+PEG—raw algal material, SCO2E+PEG—extract obtained with supercritical extraction, CON+PEG—dry extract obtained with conventional extraction, WAT+PEG—dry extract obtained with ethanol/water extraction, PEG—polyethylene glycol.
Table 2. Summary of thermal properties of algae microparticles.
TOm (°C)Tm (°C)ΔHm (J/g)TOmax (°C)Tmax (°C)ΔHmax (J/g)
RAM+PEG45.4763.59181382.53411.64101.17
SCO2E+PEG37.4760.44191372.77408.90222.81
CON+PEG46.3662.01173370.49413.86188.07
WAT+PEG48.6560.26171372.12410.87250.85
For PEG Tm (°C)= 61.3, ΔHm=170
Table 3. Dry matter and physical properties for pigment microparticles obtained with the PGSS process.
MicroDry Matter (%)Mean
Diameter (μm)
COLORΔEWIWAI (g/g)WSI (%)
PEG98.67-Applsci 12 11496 i001--0.07399.71
RAM+PEG98.6624.09Applsci 12 11496 i00213.3480.590.49093.32
SCO2E+PEG99.4716.49Applsci 12 11496 i0037.9785.840.09798.71
CON+PEG98.9217.68Applsci 12 11496 i0049.4184.420.19097.86
WAT+PEG98.9917.98Applsci 12 11496 i00515.9277.960.19597.64
ΔE—colour change, WI—whiteness index, WAI—water absorption index, WSI—water solubility index, RAM+PEG—raw algal material, SCO2E+PEG—extract obtained with supercritical extraction, CON+PEG—dry extract obtained with conventional extraction, WAT+PEG—dry extract obtained with ethanol/water extraction, PEG—polyethylene glycol.
Publisher’s Note: MDPI stays neutral with regard to jurisdictional claims in published maps and institutional affiliations.

