Abstract
The accurate prediction of the height of the water-conducting fracture zone is essential for the prevention of roof damage by water disasters in coal mines. The development law of water-conducting fracture zone in combined mining of Jurassic and Carboniferous coal seams is different from that of previous research results. This study constructed an engineering geomechanics model to carry out material simulation and numerical simulation. The changes of stress, displacement, and fracture propagation were analyzed and compared with the results of formula calculation and field measurement, revealing the combined action of Jurassic and Carboniferous coal seams on the development law of water-conducting fracture zone. The results show that: (1) stress concentration is formed in the middle of the goaf in Jurassic coal seam, resulting in the high height of water-conducting fracture zone and the fracture “closed”; (2) the mining of Carboniferous coal seams caused the second subsidence of Jurassic goaf, and closed fracture “activated”; (3) the height of the water-conducting fracture zone obtained by the empirical formula is small, which is quite different from the actual situation. These research results are of significance for determining the height of the water-conducting fracture zone in Jurassic and Carboniferous coal seams during combined mining and the prevention of coal roof water hazards.
1. Introduction
The main common coal-bearing strata in China are the Jurassic and Carboniferous-Permian strata. It is rare to encounter the combined mining of Jurassic and Carboniferous-Permian coal seams in the same coalfield. However, the Datong coalfield is the most typical one with the characteristics of “Jurassic and Carboniferous-Permian and multi-coal seams”. At present, the shallow coal resources in the Datong Jurassic coalfield are increasingly depleted, and the deep Carboniferous-Permian coal is the main coal seam. The mining of the upper Jurassic coal seam left the goaf and coal pillar, forming a wide range of fracture development areas. The secondary failure of the rock caused by the mining of the Carboniferous coal seam is characterized by the coexistence of multiple structures formed by the combined mining of the Jurassic and Carboniferous coal seams, which makes the mining conditions more complicated (Figure 1). The overlying rock movement and the development of cracks caused by mining are more likely to cause the occurrence of various coal mine disasters [1,2]. Water disaster is the main problem faced by the combined mining of the Jurassic coal seam and Carboniferous coal seam. The goaf water left by the mining of Jurassic coal seam and surface water are likely to enter the underground through the water-conducting fracture zone formed by deep coal seam mining, which seriously threatens the safe mining of coal resources and also causes severe impacts on the environment and roof water bodies [3,4].
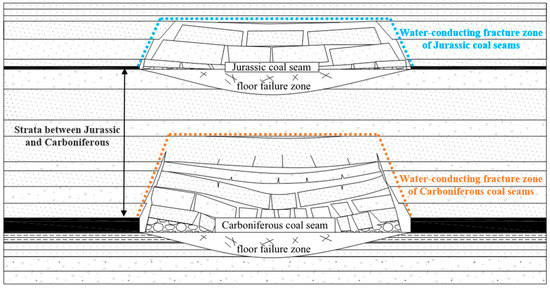
Figure 1.
The distribution map of water-conducting fracture zone in overburdened rock.
China is vigorously developing safe energy and green energy [5,6]. Therefore, it is important to study the occurrence conditions of mine water inrush, accurately predict water inrush and formulate prevention and control countermeasures. Understanding the evolution characteristics of a water-conducting fracture zone in the combined mining of Jurassic and Carboniferous coal seams is critical to achieving this goal.
Scholars have carried out theoretical analysis, experimental research, and on-site measurement to solve the problem of roof water inrush. Approaches mainly include key strata theory [7], upper three zone theory (caving zone, fracture zone, and bending zone) [8,9], thin plate model theory [10], empirical formula method [11], similar simulation experiment [12,13], numerical simulation [14,15,16], and field test methods [17,18,19,20]. At present, the determination of the height of the water-conducting fracture zone of the coal seam roof in China is mainly based on the formula in the ‘Buildings, water bodies, railways and main roadway coal pillars and coal mining specifications’ [21]. This formula was based on the empirical formula established by the measured data of the shallow coal seam mining in the Permian system in the North China type coalfield, and only the influence factor of mining thickness was considered [22]. A large number of studies have shown that the development height of the water-flowing fractured zone is affected by many factors, such as coal seam burial conditions, overburden structure, and mining technology. The above reasons cause that the height of water flowing fractured zone in many coal mines is not completely consistent with the calculation results of the empirical formula.
To understand the mechanism of water-conducting fracture zone formation, scholars put forward the surface failure characteristics of shallow buried coal seam with large mining height [23] through the key layer theory; using the rock fracture process analysis (RFPA) system, the relationship between rock movement and goaf time and space was studied [24]. The deformation and migration patterns of overlying strata in coal seam mining were studied by using high-precision microseismic monitoring and distributed optical fiber [25]; other scholars have studied the mechanical properties and engineering response characteristics of rock mass under the interaction of slope rock mass and underground mining, and revealed the deformation and failure process and evolution rules of fractured rock mass [26].
Numerical and material simulations are commonly used to compare with field-measured data [27]. Fractal geometry theory and MATLAB software were used to analyze the fractal characteristics of the weathered rock fracture network. The influence of cyclic dry-wet weathering on the mechanical behavior of medium-grained sandstone was studied through a uniaxial compression test and direct shear test, which provided the basis for the production of simulation materials [28]. The distributed optical fiber sensor monitoring was introduced into the two-dimensional or three-dimensional model test to study the mining failure characteristics of weakened weathered composite roof in the working face of thick conglomerate and thin bedrock [29,30]. Some scholars also used the DEM method to simulate the deformation and failure process of roof falling in multi-layer coal overlapping working face [31]. UDEC, PFC, DFN, and other discrete element numerical simulation methods have been fully applied in the study of the rock failure process [32,33,34].
These research studies are of great significance in revealing the fracture characteristics of overburden strata. However, most of the above research studies are aimed at the mining of single coal-measure coal seams without considering the cracks in overburden strata under the combined mining of Jurassic and Carboniferous coal seams. Especially from the perspective of prevention and control of mine water disasters, it is very rare to study the development law of roof water-conducting fracture zone in the combined mining of Jurassic and Carboniferous coal seams. The research results have important theoretical and practical value for preventing composite water disasters such as surface water, roof sandstone water, and goaf water left over from Jurassic coal seam mining.
Taking the combined mining of Jurassic and Carboniferous coal seams in the Datong mining area as the engineering background, this research uses material simulation and numerical simulation methods, empirical formula analysis, and field observation to reveal the development pattern of water-conducting fracture zone under the combined mining of Jurassic and Carboniferous coal seams. Our study is significant for the safe mining of coal mines in the northwest and ecologically fragile areas.
2. Materials and Methods
2.1. The Study Area
The Majiliang coal mine is located northwest of the Datong coalfield. The geographical coordinates are 112°53′32′′–113°00′16′′ east longitude and 39°58′26′′–40°04′03′′ north latitude. The bedrock with loess covered is only exposed on both sides of the valley. The exposed strata range from old to new: Ordovician, Carboniferous, Permian, Jurassic, and Quaternary, respectively. The Jurassic coal seam has been mined. Currently, coal seam No. 3 of the Upper Carboniferous Taiyuan Formation, a nearly horizontal coal seam, is the primary mineable coal seam. The thickness of coal seam No. 3 ranges from 5.10 to 7.63 m, with an average of 5.41 m, and the inclination angle of it ranges from 1° to 4°, with an average of 2°. The distance between coal seam No.3 and coal seam No. 14-2 overlying Jurassic coal seam ranges from 171.52 to 207.67 m, with an average distance of 189.66 m. The working face 8117 is located in the first level 301-2 panel, with 2377.4 m length and 239.4 width (Figure 2). The coal seam No. 3 is threatened seriously by water disaster because of complex strata conditions.
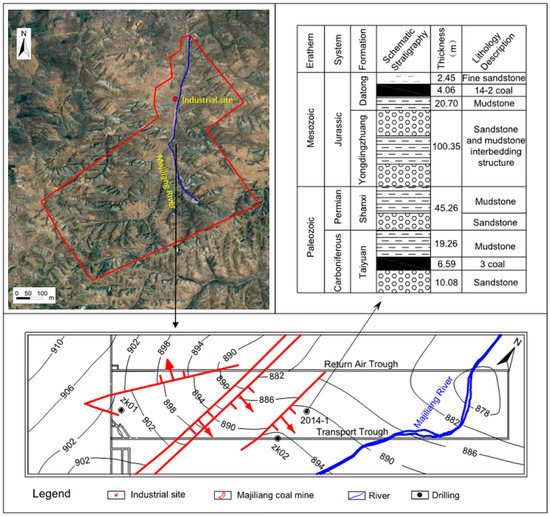
Figure 2.
Location of Majiliang Coal Mine and general situation of working face 8117.
Through the reasonable abstraction and simplification of the geological prototype, the engineering geomechanics model diagram (Figure 3) was established, which accurately reflects the objective reality of the geological body. Moreover, it is characterized by both the possibility of mechanical analysis and the feasibility of computer numerical simulation. In Figure 3, the electrode, DAM, and BS are added in order to better explain the layout of the electrical monitoring system in a similar material model, DAM refers to the data acquisition mainframe, and BS refers to base station.
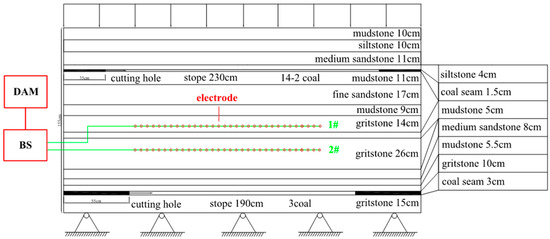
Figure 3.
Engineering geomechanics model diagram of working face 8117 of Majiliang coal mine.
2.2. Principle and Scheme of Material Simulation
2.2.1. Principles of Material Simulation
The material simulation based on similar principles and theories establishes indoor engineering geomechanics models using similar materials [35,36,37]. The destruction and movement of the overlying rock during coal seam mining are simulated to obtain the development characteristics of the water-conducting fracture zone by this method. The similarity conditions of material simulation generally include geometric similarity, mechanical similarity, stress similarity, deformation similarity, and failure similarity.
- (1)
- Geometric similarity
The actual mining size is required to maintain a certain relationship with the geometric model size, namely:
where Cl is the geometric similarity constant; l is the model size, m; L is the Prototype size, m.
- (2)
- Kinematic similarity
It is required that the movement time of each corresponding point of the actual prototype and the model maintain a certain proportional relationship, namely:
where Ct is the kinematic similarity constant; t is the movement time of model point, s; T is the movement time of prototype point, s.
- (3)
- Kinetic similarity
The force between the actual prototype and the model is required to maintain a certain similar relationship, namely:
where RM and RH are the mechanical properties of the model and prototype rock, respectively; rM and rH are the gravity of the model and prototype rock, respectively; LM and lH are the model and prototype geometric size, respectively; Cσ is the mechanical similarity constant.
- (4)
- Similar boundary conditions
It is required to consider the influence of the boundaries on both sides in the model design process and determine the size of the protective coal pillar through formula calculation. The coal pillar on both sides of No. 14-2 coal face is 70 m, and No. 3 coal face is 110 m.
2.2.2. Schemes of Material Simulation
According to the mining size of the working face 8117, the theoretical calculation height of the water-conducting fracture zone, and the size of the engineering geomechanics model frame, the plane stress model is adopted, with Cl being 1/200. The model simulates mining along the coal seam strike due to the near horizontal coal seam. Considering the change process of the apparent resistivity of each rock layer monitored by the network parallel electrical method, the samples with different lithologies were prepared according to the designed material ratio and the resistivity of common rocks before the test. Different proportions of iron powder were added to facilitate the current transmission. The electrical equipment was used for measurement to obtain the optimal amount of iron powder. The uniaxial compressive strength of the sample was measured by the rigid hydraulic servo testing machine, and the strength was compared with the strength calculated by the strength similarity ratio. The error range was within 20%. According to the laying method of the model, the electrodes and monitoring points were set after laying.
The model mining progress refers to the actual advancing speed of 5 m/d. The model mining speed was determined as 5 cm (prototype 10 m) every 3.4 h (prototype 2 days) by the time similarity ratio of 14.1. The mining sequence is from the upper layer No. 14-2 coal seam to the lower layer No. 3 coal seam. It propelled from left to right in turn with a 5 cm (prototype 10 m) mining length and 1.5 cm (prototype 3 m) mining thickness. Thirteen measuring lines were arranged above No. 3 coal seam with a spacing of 10 cm. Each line contained 29 measuring points with a spacing of 10 cm. A total of 377 measuring points were arranged. The camera was used to photograph the dynamic process of the development of the water-conducting fracture zone. Furthermore, the network parallel electrical method was applied to monitor the three-dimensional point data in the model space, which reflects the change of apparent resistivity with inversion.
2.3. Principles and Schemes of Numerical Simulation
2.3.1. Principles of Numerical Simulation
The Universal distinct element code (UDEC), a discrete element method program developed by the Itasca company, is used to study discontinuous media [38,39]. The discrete element method was originally developed to study the stability of roadways and slopes with jointed rock masses, which can solve the mechanical problems of jointed or block systems under dynamic or quasi-static conditions. The basic idea of the discrete element method is the same as that of the finite element method. The region is divided into elements. Using the finite difference method, the interaction force between the element blocks can be calculated according to the relationship between force and displacement, and the motion law of individual elements can also be determined according to the magnitude of the unbalanced force and unbalanced torque suffered by the element according to the Newton motion law.
In order to solve the problem of roof and floor damage in the process of coal mining and give full play to the characteristics that the block element in the discrete element method can fall, the discrete element method is introduced into mining engineering to study the practical problems caused by the geological structural plane. Since the length of the working face is much larger than the width of the working face, that is, when the working face advances to a sufficient length, the stress field distribution of the surrounding rock of the working face has little relationship with the length of the working face. According to the theory of elasticity, such problems can be applied to the plane strain problem, and the use of plane strain simulation can save computational resources.
2.3.2. Schemes of Numerical Simulation
The size of the model is determined to be 600 m × 340 m with reference to the working face 8117 of the Majiliang coal mine, and the scope of the model basically includes the main coal measures strata.
According to the characteristics of the rock formations revealed by the 2014-1 drilling near the working face 8117, the rock formations are divided into 17 layers from bottom to top. The joints are divided according to the thickness of each layer, and the grid is automatically generated by the software.
The Mohr–Coulomb criterion is adopted in the yield failure criterion of model rock materials. The mechanical parameters of coal blocks are obtained in the laboratory, excluding the original cracks, joints, and other structural planes, and there are certain errors compared with the original state of the rock. Therefore, the parameters obtained from mechanical tests need to be modified before they can be applied to numerical simulation. At the same time, in order to be closer to the actual situation of the model, it is necessary to set rock joints in the model to simulate the discontinuous surface in the stratum. This numerical simulation studies the excavation of an underground coal seam, and the surface contact model is selected as the constitutive model of joints in this simulation. According to the UDEC user manual, joint properties are usually obtained from laboratory triaxial or direct shear tests. However, joint properties tested in laboratory do not represent actual joint parameters in the field. The only way to select reasonable joint parameters is to compare joint properties similar to those tested in the field.
Parametric bulk modulus (K) and shear modulus (G) describing mechanical properties of materials are converted by Young’s modulus (E) and Poisson’s ratio (v) using Equations (5) and (6).
Through the correction of mechanical parameters of rock strata in the Majiliang mine, it is assumed that all the material properties in the model are isotropic, and the mechanical parameters of rock strata and joints in this numerical simulation study are determined by referring to the numerical simulation study on the development law of water-conducting fractures in adjacent mines (Table 1 and Table 2).

Table 1.
Table of mechanical parameters of model overburden.

Table 2.
Table of mechanics parameter of model overburden joint.
A compensation load was applied to the upper boundary of the model. The vertical strata thickness above the model is 238.5 m, and the total average density of overburden is 2500 kg/m3. According to the overburden pressure Equation (7), the top boundary pressure is 5.8 MPa. The lower boundary was constrained by vertical displacement. The left and right boundaries were simplified as displacement boundary conditions, which can move along the Y direction, and the X direction is fixed by displacement constraint.
where H is the vertical height of the overburden, m; ρr is the total average density of the overburden, kg/m3; g is the acceleration of gravity, 9.8 m/s2.
Corresponding to the material simulation, the mining length of the Jurassic No. 14-2 coal seam is 460 m, and that of Carboniferous No. 3 coal seam is 380 m, the upper part of the working face 8117 was covered by the Jurassic goaf. In the model, 11 observation lines are set horizontally, with each monitoring line divided into 10 monitoring points to monitor the displacement of roof strata. The numerical simulation model is shown in Figure 4.
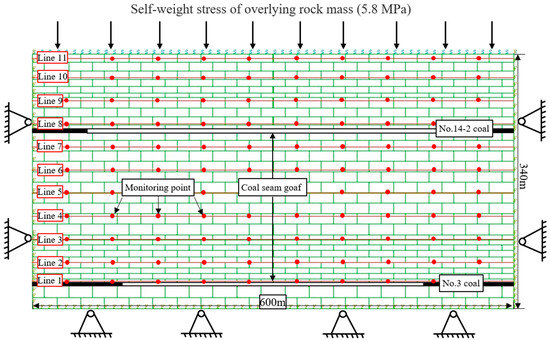
Figure 4.
Schematic diagram of numerical simulation model.
The logical sequence analysis of ‘stress–displacement–fracture’ is adopted. Firstly, the stress change is analyzed, then the displacement change under stress is analyzed, and finally, the fracture under displacement is analyzed. The range of model fracture was used as the main basis for judging the height of the water conducting.
2.4. Analysis of Material Simulation
2.4.1. Overburden Movement and Deformation
The settlement curve of overburden movement, using photogrammetry to monitor the displacement of each monitoring point on the surface of the model, was drawn (Figure 5).
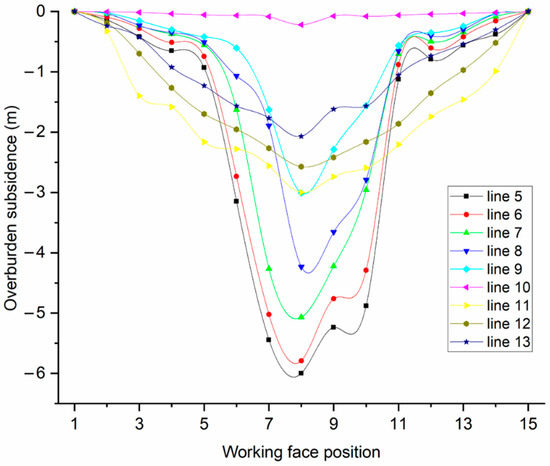
Figure 5.
Curve of overburden subsidence of material simulation.
It can be seen from Figure 5 that when No. 3 coal seam of the Carboniferous system is mined, a large space is formed in the goaf position. The overburden moves and sinks vertically under the action of gravity, resulting in bending, deformation, and fracture, which are symmetrically distributed as a whole (Line 5~10). Because the coal pillars on both sides of the working face can bear the overburden pressure, the subsidence in the middle is greater than that on both sides. The separation gap is formed due to differences in the subsidence of rock strata. Although the separation gap is compacted, it can buffer the subsidence of overburden. Thus, the subsidence of overburden is larger in the lower part and smaller in the upper part. The overburden of coal seam No. 14-2 has an extreme subsidence at the middle of the first survey line (Line 11) on the upper part of the coal seam, which is slightly larger than the thickness of coal seam No. 14-2. The subsidence of the overlying strata of the No. 3 coal seam reaches the maximum at the middle position of the survey line 5 (located at the top of the water-conducting fracture zone), which is slightly larger than 6 m and close to the mining thickness of the coal seam. The subsidence position of coal seam No. 14-2 overburden monitoring line is earlier than that of coal seam No. 3 because of the large mining length of coal seam No. 14-2. However, the subsidence of coal seam No. 14-2 is far less than that of No. 3 coal seam because of the large mining thickness of No. 3 coal seam.
Comprehensive analysis shows that the extreme values of the overburden movement and subsidence of coal seams No. 14-2 and No. 3 are in the middle of the goaf area. The subsidence has abrupt changes at the cut-off and stop-line positions of the working face, indicating that the overlying strata are fractured at this location. Large water storage space is formed between the falling roof, the coal pillars on both sides of the goaf, and the coal seam floor. The crushed rock masses in the caving zone undergo compaction and horizontal movement with the action of stress, resulting in the maximum subsidence of coal seam No. 14-2 and No. 3 coals being slightly larger than the thickness of the coal seam.
2.4.2. Changes of Model Apparent Resistivity
Background apparent resistivity data were collected on the model before No. 3 coal seam mining, and the model has good stratification (Figure 6).
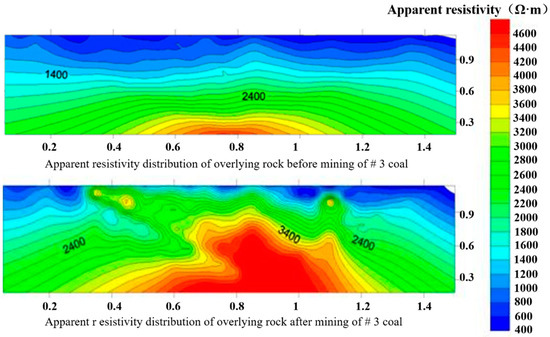
Figure 6.
Comparison diagram of apparent resistivity distribution of overlying rock before and after mining of # 3 coal.
When the No. 3 coal seam advanced to the stop line position, two survey lines were used to collect the apparent resistivity data of the model. The overburden of the model goaf has an obvious high resistance area and presents an approximate “trapezoidal” distribution. The resistivity, with the caving zone and fracture zone forming, will increase due to the existence of gas in the fracture, which is the main basis for judging the development height of a water-flowing fracture. The height of water flowing fracture is approximately 100 m. Considering that the resistivity changes little when the fracture is very small, the height of the water-conducting fracture zone measured by the electrical method may be less than the actual height.
2.4.3. Development of Water-Conducting Fracture Zone
When the working face is advanced about 250 m, the height of the water-conducting fracture zone is basically stable from 44 m to 48 m above coal seam No. 14-2 and from 110 m to 130 m above coal seam No. 3. The corresponding fracture mining ratios ranges from 14.67 to 16 and from 18.33 to 21.67, respectively. The development form of the whole water-conducting fracture zone tends to be stable, showing the characteristics of a “trapezoidal” shape (Figure 7).
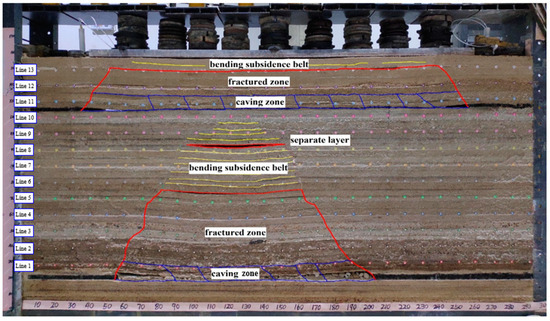
Figure 7.
Model overlying strata “three zones” distribution morphology map.
3. Results
3.1. Analysis of Numerical Simulation
3.1.1. Changes in the Model Stress
According to the model stress nephogram, the stress is redistributed after the mining of the No. 3 coal seam. The influence range of the goaf stress relief zone spreads to the Jurassic goaf. After the overburden of coal seam No. 14-2 is broken, the pressure of the overlying strata is directly transmitted to the goaf area, causing the stress at this place to be greater than on both sides. Obvious stress concentration occurs on both sides and the middle of the goaf. Among them, there are two stress concentration points in the middle of the goaf.
3.1.2. Changes of the Model Displacement
After the mining of coal seam No. 14-2, the overburdened rock was broken and bent and sunk in the middle part of the goaf under the support of its own weight and coal pillars on both sides. The displacement presents an “arch” shape. Among them, the middle position displacement is greater than that of the two sides; the lower displacement is greater than the upper part, and the results are consistent with the results of material simulation and stress distribution. Displacement caused by No. 3 coal mining in Carboniferous affected Jurassic goaf. After a comparative analysis of coal seam No. 3, the overlying rock in the goaf of coal seam No. 14-2 experienced secondary subsidence (Figure 8).

Figure 8.
Comparison diagram of displacement distribution of overlying rock before and after mining of # 3 coal.
The data of 110 monitoring points in 11 monitoring lines in the numerical model were exported. Lines 1–4, close to coal No. 3, and Lines 8 and 9, close to coal No. 14-2, were selected to draw the curve of the movement and subsidence of the overlying strata after coal mining (Figure 9).
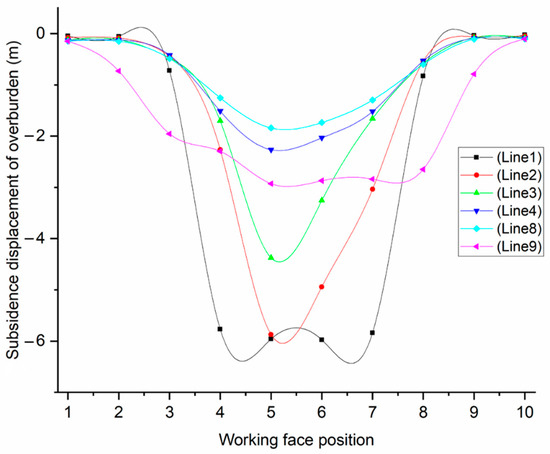
Figure 9.
Overlying rock movement sinking curve of numerical simulation.
Figure 9 shows that the overlying rocks of the two layers of coal have moved and subsided when the No. 3 coal is mined, indicating that during the mining of the lower coal seam. The scope of influence has affected the overlying rock of the upper coal seam and has undergone secondary movement and subsidence. The overlying cracks in the Jurassic goaf are “activated”, which is completely consistent with the uneven surface settlement and the expansion of ground cracks after the mining of the Carboniferous coal seam No. 3.
3.1.3. Development of the Model Fracture
Based on the model stress and displacement analysis, the results of the overlying rock fracture morphology development are analyzed. With the mining of coal seam No. 14-2, the scope of the goaf continues to expand. When the working face advances to the stop line position, the fracture development form and height are basically stable, showing a “trapezoid” shape. In addition, the height of the fracture on both sides, approximately 44 m, is slightly larger than the height of the middle fracture.
When mining coal seam No. 3, the density of overburden fracture in the open cut and the front face of the working face is greater than that of coal seam No. 14-2. The stress in the coal seam No. 14-2 goaf is concentrated and transferred to the open cut and near the working face of coal seam No. 3, resulting in the shear failure being more prone to occur in the overburden. In the middle part of the crack development range, a crack “closed” area is formed. The height of the fracture is stable at about 135 m. The overall morphology, with slight changes in the fracture morphology of coal seam No. 14-2, is not affected (Figure 10).

Figure 10.
Comparison diagram of fracture distribution of overlying rock before and after mining of # 3 coal.
4. Discussion
4.1. Analysis of the Development Mechanism of Water-Conducting Fracture Zone in Overlying Rock
Under the action of the self-weight of rock strata, when the working face advances, the overlying rock near the cut hole first bends and sinks, forming a tiny interlayer fracture. As the working face continues to advance, the rock hanging distance increases, the shear stress increases, and the cracks with an angle of about 60° appear at the top of the cutting hole. The shear stress and self-weight lead to the direct collapse of the coal seam. Moreover, the length and width of the transverse cracks in the roof continue to expand (Figure 11a). The development mechanism of the water-conducting fracture zone formed in the early stage of combined mining of Jurassic and Carboniferous coal seams is similar to that of single-layer coal mining.

Figure 11.
Diagram of the development of water-conducting fracture zone in working face.
When the working face advances to a certain distance, under the action of shear force, a large number of plume fractures are first generated in the rock stratum (Figure 11b), and they are connected with the transverse fractures, which eventually leads to the direct roof collapse. During the model mining process, the rock stratum is different from the initial bilateral cantilever beam structure and belongs to the unilateral cantilever beam structure. The distance of the first collapse is about twice that of the subsequent collapse, and the caving zone is periodic.
Furthermore, the rock stress of the Jurassic coal seam is transmitted downward along the middle of the goaf, which leads to the greater compressive stress in the central part of the water-conducting fracture zone of the Carboniferous coal seam, resulting in the closure of a wide range of water-conducting fracture zone, which is also one of the most apparent characteristics of combined mining of Jurassic coal seam and Carboniferous coal seam (Figure 11c). Most of the previous research focused on single coal seam mining conditions [40], and the study of repeated mining of multiple coal seams was limited to Jurassic or Carboniferous Permian [41]. This research used the method of system theory to study the Jurassic and Carboniferous coal seams, which has important practical significance for preventing the influence of Jurassic coal seam goaf water, Carboniferous coal seam roof sandstone water, and surface water on deep coal seams.
4.2. Analysis of Stress and Closed Fracture Caused by Mining of Jurassic Coal Seams
Five measurement lines (Line 1–5) within the range of the water-conducting fracture zone of Carboniferous No.3 coal in the numerical simulation model were selected for stress analysis. The vertical stress measured by the monitoring line in the numerical model was derived to draw the vertical stress change curve diagram of the model under different mining conditions (Figure 12), reflecting the change of the overburden stress (1~10 on the horizontal axis represents the number or position of the monitoring points on each monitoring line in the numerical simulation model (from left to right)). Figure 12 shows that the monitoring line stress, transmitting down the formation, will form a stress concentration in the middle of the goaf, the cut-off, and the stop line. In addition to the stress concentration formed on both sides of the working face, some stress concentration also appeared in the periodic collapse position. The middle part of the Jurassic goaf area transmitted a large stress downward, resulting in an increase in the height of the water-transmitting cracks in the Carboniferous coal seam, which verifies the influence of stress concentration on the height of fracture development.
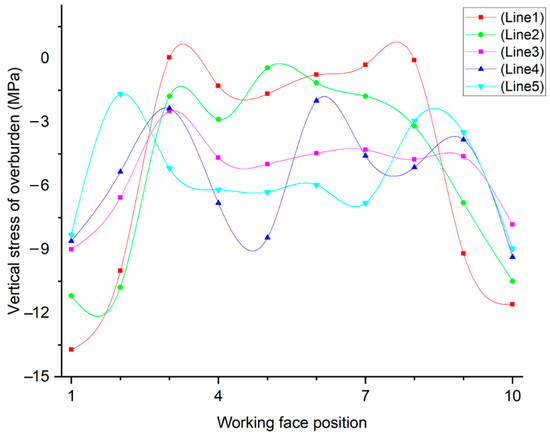
Figure 12.
Stress curve diagram of each monitoring point of numerical simulation.
The stress is transferred downward along the two sides of the working face, and the stress concentration position in the middle of the goaf, and the caving zone and the fracture zone are continuously compacted, resulting in the “closed” phenomenon of the fracture. The effect of stress on the “closing” of cracks is verified.
A comprehensive analysis can find that: the middle of the goaf and the overlapping boundary position of the working face will show the characteristics of “stress concentration, high fracture density, and large bottom fracture closed area”. This situation can lead to an increase in the height of the water-conducting fracture zone in the Carboniferous coal seam. It is necessary to control the height of the mining or leave a protective coal pillar during mining. This was different from the previous studies, which only considered the influence of mine pressure and controlled the roof [42,43]. It avoided the influence of groundwater discharge on the ecological environment in the deep mining of the central and western regions and was also a useful exploration of water-preserved mining.
4.3. Analysis of Secondary Failure and Fracture Activation Caused by the Mining of Carboniferous Coal Seams
The developed water-conducting fracture zone is relatively high due to the destruction, bending, and subsidence of the overlying rock caused by the mining of the Carboniferous coal seam. Through the previous analysis, the overburden deformation caused by the mining of Carboniferous coal seam No. 3 has spread to the Jurassic goaf, resulting in the secondary movement of the compacted and stabilized overlying rock (Figure 8). In order to explain the influence of coal seam mining in Carboniferous on Jurassic goaf, the moving subsidence data obtained from four monitoring lines (8, 9, 10, and 11) in the numerical simulation model of 14-2 coal seam roof before and after coal mining in Carboniferous No. 3 coal seam were statistically analyzed. The settlement differences of four monitoring lines were obtained (Figure 13).
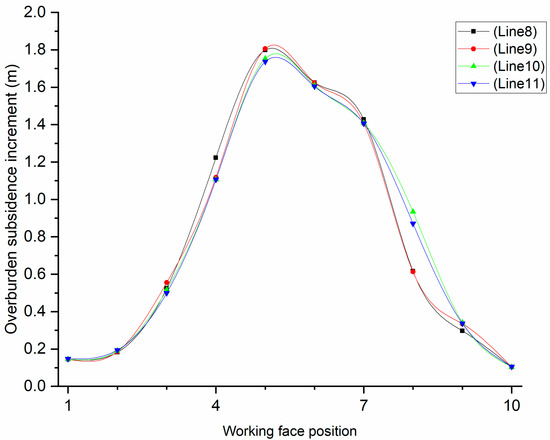
Figure 13.
The secondary subsidence curve of coal seam No. 14-2 overlying strata of material simulation.
As shown in Figure 13, the overlying rock of coal seam No. 14-2 subsided after the mining of coal seam No. 3. There is a slight difference in the subsidence of each survey line, with maximum subsidence of 1.81 m. The shape and location of the subsidence are consistent with the subsidence of the coal seam No. 3 overlying rock. Finally, a clear movement and subsidence formed in the middle of the coal seam No. 14-2 goaf. It seems that the mining of Carboniferous coal seams will aggravate the development of ground fracture and surface subsidence, which is consistent with the conclusions obtained from the field survey.
According to the previous analysis, the mining of the Carboniferous coal seam will cause the secondary subsidence of Jurassic goaf overburden. The transverse fractures closed by debris filling and stress compression will be “activated” with the movement and subsidence of overburden. This phenomenon is very obvious in the process of material simulation. From the numerical simulation fracture morphology diagram, it can be seen that the lateral fracture has undergone minor changes. However, the changes in the longitudinal fracture in material simulation and numerical simulation are small. Therefore, it can be considered that the mining of Carboniferous coal seams caused the “activation” of the transverse fracture, with little effect on the longitudinal fracture. Previous research studies have only considered the failure range of overlying strata from a macro perspective, and there were few research studies on the activation and closure of cracks within the failure range [44]. At present, there is no research on the influence of transverse cracks and vertical cracks on groundwater flow. If the mining only produces transverse fractures without communicating with vertical fractures to form a fracture network directly through the goaf, it is also extremely beneficial to prevent mine water disasters.
4.4. Comprehensive Comparative Analysis of the Heights of Water-Conducting Fracture Zone
Commonly used methods to predict the height of the water-conducting fracture zone include material simulation and numerical simulation method, empirical formula calculations, and field measurements. The height of the water-conducting fracture zone in the Carboniferous coal seam No. 3, comparing the results obtained by the three methods, was analyzed (Table 3).

Table 3.
Comparison of height of water conducting fissures water-conducting fracture zone.
The height of the water-conducting fracture zone obtained by field measurement, similar material simulation, and numerical simulation is relatively close, with a maximum value of 150 m and a minimum value of 100 m. Table 2 shows that the height of the water-conducting fracture zone calculated by the empirical formula is obviously small, which is quite different from that of the Carboniferous coal seam in the Datong mining area. This conclusion verifies the influence of stress transfer in the goaf of the Jurassic coal seam on the height of the water-conducting fracture zone in the Carboniferous coal seam. At the same time, the roof water damage cannot be evaluated only by the results calculated by the empirical formula. The smaller calculation results may lead to the leakage of roof aquifer water, goaf water, or surface water, resulting in water inrush accidents. At present, the method of calculating the development height of the water-conducting fracture zone was relatively large, and there were some errors in the single-field detection method [45]. Instead, a variety of field and theoretical analysis methods should be used to verify each other.
4.5. Simulation Result Error and Reliability Analysis
- (1)
- Error analysis of simulation
The rock formation and fracture parameters selected for the simulation were obtained from indoor rock block mechanical property tests; many factors are simplified according to the principle of easy control. Therefore, the test conditions are difficult to be fully consistent with the field situation. In the future, in-depth research can be carried out on the basis of accurate testing of rock mechanics parameters to make the research results closer to reality.
- (2)
- Reliability analysis of simulation
The material simulation results are compared with the numerical simulation results: the heights of the two water-conducting fracture zone are very close, and the development forms and changing processes of the water-conducting fracture zone are relatively consistent, mutually verifying the reliability of the simulation results.
Comparing the simulation results with the on-site measurement results, the height of the water-conducting fracture zone and the maximum split mining ratio obtained by the borehole TV and the water injection test are similar to the simulation results, which fully verify the reliability of the simulation results.
5. Conclusions
Through comprehensive analysis of empirical formula calculation, field measurement, material simulation, and numerical simulation results, the joint effect of successive mining of Jurassic coal seam and Carboniferous coal seam on water-conducting fracture zone was studied. The main conclusions are as follows:
The overburden subsidence in the middle of Jurassic goaf is in contact with the floor from stress concentration. The stress transfers along the strata to the roof of the Carboniferous coal seam, which intensifies the destruction of the overburden in the Carboniferous coal seam, and the height of the water-flowing fracture is large.
The cracks formed in the advancing process of the Carboniferous working face appear ‘closed’ under the compaction of the stress concentration in the Jurassic goaf. The closed area is located in the middle of the range of the water-flowing fractured zone of the Carboniferous coal seam, which is greatly affected by the overburden stress.
The mining of the Carboniferous coal seam causes the ‘closed ‘ cracks’ activation and secondary settlement in Jurassic goaf. The maximum settlement value is located in the middle of the goaf, which will aggravate the expansion of ground fracture and surface settlement.
The height of water flowing fractured zone obtained by field measurement and simulation is basically consistent. The height of the water-flowing fractured zone calculated by the empirical formula of the height of the water-flowing fractured zone in medium hard rock is small, which is different from the field measurement in the Carboniferous coal seam mining in the Datong mining area.
Author Contributions
Conceptualization, C.L.; methodology, C.L. and J.X.; software, Q.L.; validation, J.X.; formal analysis, Q.L. and Y.H.; investigation, C.L. and J.X.; resources, J.X.; data curation, C.L., Q.L. and H.Z.; writing—original draft preparation, H.Z.; writing—review and editing, Y.H.; visualization, Y.H.; supervision, J.X.; project administration, J.X.; funding acquisition, J.X. All authors have read and agreed to the published version of the manuscript.
Funding
The research was supported by the National Key Research and Development Program of China, grant number 2019YFC1805400, the National Natural Science Foundation of China, grant number 52274243, and the National Natural Science Foundation of China, grant number 42174165.
Institutional Review Board Statement
Not applicable.
Informed Consent Statement
Not applicable.
Data Availability Statement
Not applicable.
Conflicts of Interest
The authors declare no conflict of interest.
References
- Palchik, V. Formation of fractured zones in overburden due to longwall mining. Environ. Earth Sci. 2003, 44, 28–38. [Google Scholar] [CrossRef]
- Wu, Y.; Huang, Z.; Xue, S. Effect of temperature on physical mechanical and acoustic emission properties of Beishan granite Gansu Province China. Nat. Hazards 2021, 107, 1577–1592. [Google Scholar] [CrossRef]
- Bu, W.K.; Mao, X. Research on effect of fault dip on fault activation and water inrush of coal floor. Chin. J. Rock Mech. Eng. 2009, 28, 386–394. [Google Scholar]
- Mahato, M.K.; Singh, P.K.; Singh, A.K.; Tiwari, A.K. Assessment of Hydrogeochemical Processes and Mine Water Suitability for Domestic, Irrigation, and Industrial Purposes in East Bokaro Coalfield, India. Mine Water Environ. 2018, 37, 493–504. [Google Scholar] [CrossRef]
- Zhao, D.; Guo, Y.; Wang, G.; Guan, X.; Zhou, X.; Liu, J. Fractal Analysis and Classification of Pore Structures of High-Rank Coal in Qinshui Basin, China. Energies 2022, 15, 6766. [Google Scholar] [CrossRef]
- Zhao, D.; Guo, Y.; Wang, G.; Mao, X. Characterizing nanoscale pores and its structure in coal: Experimental investigation. Energy Explor. Exploit. 2019, 37, 1320–1347. [Google Scholar] [CrossRef]
- Xu, J.L.; Zhu, W.B.; Wang, X.Z. New method to predict the height of fractured water-conducting zone by location of key strata. J. China Coal Soc. 2012, 37, 762–769. [Google Scholar]
- Wang, G.; Wu, M.; Wang, R.; Xu, H.; Song, X. Height of the mining-induced fractured zone above a coal face. Eng. Geol. 2017, 216, 140–152. [Google Scholar] [CrossRef]
- Liu, S.; Li, W.; Wang, Q.; He, J.; Xue, S. Water Inrush Risk zoning and Water Conservation Mining Technology in the Shennan Mining Area, Shaanxi, China. Arab. J. Sci. Eng. 2017, 43, 321–333. [Google Scholar] [CrossRef]
- Liu, S.; Li, W.; Wang, Q.; Pei, Y. Investigation on mining-induced fractured zone height developed in different layers above Jurassic coal seam in western China. Arab. J. Geosci. 2018, 11, 30. [Google Scholar] [CrossRef]
- Hu, X.J.; Li, W.P.; Cao, D.T.; Liu, M.C. Index of multiple factors and expected height of fully mechanized water flowing fractured zone. J. China Coal Soc. 2012, 37, 613–620. [Google Scholar]
- Li, H.Y.; Wang, W.H.; Qi, Q.X.; Zhang, L. Study on fissure development rule of overlying strata influenced by mining based on fractal theory. J. China Coal Soc. 2014, 9, 1023–1030. [Google Scholar]
- Yang, D.; Guo, W.; Tan, Y. Study on the Evolution Characteristics of Two-Zone Failure Mode of the Overburden Strata under Shallow Buried Thick Seam Mining. Adv. Civ. Eng. 2019, 2019, 9874769. [Google Scholar] [CrossRef]
- Wang, S.; Li, X. Dynamic Distribution of Longwall Mining-Induced Voids in Overlying Strata of a Coalbed. Int. J. Géoméch. 2017, 17, 04016124. [Google Scholar] [CrossRef]
- Sun, B.; Zhang, P.; Wu, R.; Fu, M.; Ou, Y. Research on the overburden deformation and migration law in deep and extra-thick coal seam mining. J. Appl. Geophys. 2021, 190, 104337. [Google Scholar] [CrossRef]
- Zhao, Y.X.; Ling, C.W.; Liu, B.; He, X. Fracture evolution and energy dissipation of overlying strata in shallow-buried underground mining with ultra-high working face. J. Min. Saf. Eng. 2021, 38, 9–18. [Google Scholar]
- Singh, R.N.; Jakeman, M. Strata Monitoring Investigations Around Longwall Panels Beneath the Cataract Reservoir. Mine Water Environ. 2001, 20, 55–64. [Google Scholar] [CrossRef]
- Gandhe, A.; Venkateswarlu, V.; Gupta, R.N. Extraction of Coal Under a Surface Water Body—A Strata Control Investigation. Rock Mech. Rock Eng. 2005, 38, 399–410. [Google Scholar] [CrossRef]
- Han, Y.C.; Cheng, J.L.; Huang, Q.S. Prediction of the height of overburden fractured zone in deep coal mining: Case study. Arch. Min. Sci. 2018, 63, 617–631. [Google Scholar]
- Sun, X.Y.; Lu, M.J.; Li, C.; Miao, L.T. Optimal selection of staggered distance mining in double seams and its influence on water-resisting key strata. J. Min. Saf. Eng. 2021, 38, 51–57. [Google Scholar]
- Li, B.; Wu, H.; Li, T. Height prediction of water-conducting fractured zone under fully mechanized mining based on weighted multivariate nonlinear regression. J. Min. Saf. Eng. 2022, 39, 536–545. [Google Scholar]
- Liu, T.Q. Influence of mining activities on mine rock mass and control engineering. J. China Coal Soc. 1995, 20, 1–5. [Google Scholar]
- Li, Z.; Pang, Y.; Bao, Y.; Ma, Z. Research on Surface Failure Law of Working Faces in Large Mining Height and Shallow Buried Coal Seam. Adv. Civ. Eng. 2020, 2020, 8844249. [Google Scholar] [CrossRef]
- Yu, X.; Zhao, K.; Wang, Q.; Yan, Y.; Zhang, Y.; Wang, J. Relationship between Movement Laws of the Overlaying Strata and Time Space of the Mined-Out Volume. Geofluids 2020, 2020, 2854187. [Google Scholar] [CrossRef]
- Liu, C.; Li, X.; Zhang, C.; Sun, B. The spatio-temporal evolution law of overlying rock fractures in an experimental working face (N00 mining method) based on microseismic monitoring technology. Arab. J. Geosci. 2021, 14, 1373. [Google Scholar] [CrossRef]
- Li, X.; Li, Q.; Hu, Y.; Teng, L.; Yang, S. Evolution characteristics of mining fissures in overlying strata of stope after converting from open-pit to underground. Arab. J. Geosci. 2021, 14, 2795. [Google Scholar] [CrossRef]
- Zhu, F.; Gao, J.; Yang, J.; Ye, N. Neighborhood linear discriminant analysis. Pattern Recognit. 2021, 123, 108422. [Google Scholar] [CrossRef]
- Li, X.; Peng, K.; Peng, J.; Hou, D. Experimental investigation of cyclic wetting-drying effect on mechanical behavior of a medium-grained sandstone. Eng. Geol. 2021, 293, 106335. [Google Scholar] [CrossRef]
- Zhu, X.G.; Wang, Y.P. Research on the Overburden Movement and Failure Mechanism Utilizing Similar Simulation Test of DaPing Coal Mine. J. Civ. Eng. Rock Eng. 2015, 32, 457–462. [Google Scholar]
- Yang, W.; Xia, X. Study on mining failure law of the weak and weathered composite roof in a thin bedrock working face. J. Geophys. Eng. 2018, 15, 2370–2377. [Google Scholar] [CrossRef]
- Liu, Q.M.; LI, W.P.; LI, X.Q.; Hu, G. Study on Deformation Characteristics of Coal Roof Overlapping Mining under the Coverage of Magmatic Rocks with DEM Simulation. Procedia Eng. 2011, 26, 101–106. [Google Scholar]
- Lian, H.Q.; Liu, D.M.; Yin, S.X. Study on mechanism of overburden rock failure during coal mining with shallow depth and thin bedrock. Procedia Eng. 2011, 26, 8–235. [Google Scholar]
- Deng, G.; Xie, H.; Gao, M.; Li, C.; He, Z. Numerical Simulation on the Evolution of Mining-Induced Fracture Network in a Coal Seam and Its Overburden under the Top Coal Caving Method. Adv. Civ. Eng. 2020, 2020, 8833193.1–8833193.14. [Google Scholar] [CrossRef]
- Zhang, X.; Hu, B.; Zou, J.; Liu, C.; Ji, Y. Quantitative Characterization of Overburden Rock Development Pattern in the Goaf at Different Key Stratum Locations Based on DEM. Adv. Civ. Eng. 2021, 2021, 8011350.1–8011350.18. [Google Scholar] [CrossRef]
- Li, J. A review of technique, advance and outstanding issues in numerical modeling for rock mechanics and rock engineering. Int. J. Rock Mech. Min. Sci. 2003, 40, 283–353. [Google Scholar]
- Fei, W.P.; Zhang, L.; Zhang, R. Experimental study on a geomechanical model of a high arch dam. Int. J. Rock Mech. Min. Sci. 2010, 47, 299–306. [Google Scholar] [CrossRef]
- Liu, S.; Liu, W.; Huo, Z.; Song, W. Early warning information evolution characteristics of water inrush from floor in underground coal mining. Arab. J. Geosci. 2019, 12, 30. [Google Scholar] [CrossRef]
- Kazerani, T. Effect of micromechanical parameters of microstructure on compressive and tensile failure process of rock. Int. J. Rock Mech. Min. Sci. 2013, 64, 44–55. [Google Scholar] [CrossRef]
- Zhu, J.-B.; Li, Y.-S.; Wu, S.-Y.; Zhang, R.; Ren, L. Decoupled explosion in an underground opening and dynamic responses of surrounding rock masses and structures and induced ground motions: A FEM-DEM numerical study. Tunn. Undergr. Space Technol. 2018, 82, 442–454. [Google Scholar] [CrossRef]
- Li, X.L.; Huang, Q.X. High development characteristics of water flowing fractured zone in fully-mechanized top-caving mining of extremely thick coal seam under water. J. Min. Saf. Eng. 2022, 39, 54–61. [Google Scholar]
- Yao, B.H.; Zhou, H.F.; Chen, L. Numerical simulation about fracture development in overlying rocks under repeated mining. J. Min. Saf. Eng. 2010, 27, 443–446. [Google Scholar]
- Meng, X.B. Safety and high efficient mining technology of ultra thick seam with double system interaction in Datong mining area. Coal Sci. Technol. 2017, 45, 114–120. [Google Scholar]
- Yu, B.; Yang, J.X.; Gao, R. Mechanism and technology of roof collaborative controlling in the process of Jurassic and Carboniferous coal mining in Datong mining area. J. China Univ. Min. Technol. 2018, 47, 486–493. [Google Scholar]
- Guo, B.B.; Sun, W.B.; Liu, C.W. Research Overview on the Height of Water Flowing Fractured Zone after Coal Mining. Sci. Technol. Eng. 2015, 15, 100–108. [Google Scholar]
- Wang, Z.R.; Zhao, L.Q.; Kang, J.; Jia, L.G. Technological study on height observation of water flowing fractured zone caused by repeated mining in multiple coal seam. Coal Eng. 2018, 50, 82–85. [Google Scholar]
Publisher’s Note: MDPI stays neutral with regard to jurisdictional claims in published maps and institutional affiliations. |
© 2022 by the authors. Licensee MDPI, Basel, Switzerland. This article is an open access article distributed under the terms and conditions of the Creative Commons Attribution (CC BY) license (https://creativecommons.org/licenses/by/4.0/).