Abstract
Cybersecurity risk is among the top risks that every organization must consider and manage, especially during this time wherein technology has become an integral part of our lives; however, there is no efficient and simplified measurement method that organizations or regulators could use, as frequently as they need, to evaluate and compare the outcome of cybersecurity efforts that have been put in place. Consequently, this has resulted in an absence of critical data for cybersecurity improvement. This research proposes a Cyber Trust Index (CTI), a novel and simplified framework for evaluating, benchmarking, and improving organizations’ cybersecurity performance. Methods: The researchers analyzed prominent scientific research papers and widely used security standards to develop baseline security controls that serve as a measurement foundation. Then, they identified Control Enablers and Capability Tiers that were used as base measures and measurement methods. The CTI framework was evaluated by experts and tested with 35 organizations from the critical information infrastructure (CII) sector, as well as other generic sectors, in Thailand to confirm its validity and reliability in real organization settings and identify the priorities and factors that can contribute to better cybersecurity performance. Results: The CTI has two key elements: the baseline controls and rating methods. The baseline controls comprise 12 dimensions, 25 clusters, and 70 controls. The rating methods utilize five control enablers and five capability tiers to compute scores. A binary questionnaire is used to capture data for the rating process. Based on a statistical analysis of CTI results from 35 pilot organizations, 28.57% are in the beginner group with high-risk exposure, 31.43% are in the leader group with low-risk exposure, and 40% of organizations are in between (the intermediate and advanced groups). Two key factors distinguish between the beginner and leader groups: (1) an internal factor, which is the Control Enablers; and (2) an external factor, which is the influence of a cyber regulating body. Our study confirms that Control Enablers in higher Tiers will help organizations achieve better cybersecurity performance (R = 0.98021) and highlights the significance of cyber regulating bodies by showing a shear difference of 197.53% in cyber performance between highly regulated and low-regulated industries. Conclusions: This research reveals key insights into the importance of Control Enablers, which are the internal factors that organizations must leverage to drive better cybersecurity performance, and the positive return on enforcement, which emphasizes the need for cyber regulating bodies. The CTI framework has proven to be valid and efficient for measuring cybersecurity performance. At the very least, a step-wise roadmap is provided for organizations and regulators to adopt and adapt the CTI framework for their cybersecurity measurement and improvement mission.
1. Introduction
Digital technology and innovation play an essential role in improving the quality of life and ease of doing business everywhere. One of the vital factors that influences the successful implementation of new technology is cybersecurity. Several researchers have pointed out that cybersecurity is a primary and necessary contributor for sustainable economic, social, and environmental development [1,2,3,4]. The major challenge to achieving cybersecurity goals is the ever-increasing risk of threats. With the global average cost of a data breach in 2020 measuring as high as USD 3.86 million [5], the World Economic Forum has defined cybersecurity as a vital agenda item that organizations of all sizes and types must seriously consider. During the COVID-19 outbreak, the situation has become worse. The FBI reported a 400% increase in cyberattack cases compared to before the outbreak of COVID-19 [6,7].
To fight this rise in cyberattacks, organizations that wish to protect themselves must develop a cybersecurity program primarily based on international standards and best practices [8]. Some standards, such as ISO/IEC 27001:2013 [9] and ISO/IEC 27701:2019 [10], provide requirements for certification via an independent third-party audit, while others serve as a framework or guideline for managing cybersecurity risks, such as the NIST Cybersecurity Framework (CSF) [11].
Apart from defending against cyber threats, most organizations also need to comply with several laws, regulations, and contractual obligations that require preservation of the security, privacy, and continuity of a business. This includes but is not limited to the Payment Card Industry Data Security Standard (PCI DSS) [12], the Health Insurance Portability and Accountability Act (HIPAA), and the General Data Protection Regulation (GDPR).
Although complying with standards, best practices, and regulations will help minimize cyber risks, compliance with the above does not mean that an organization will have good cybersecurity. For example, many ISO 27001-certified organizations tend to only focus on achieving certification [13] by applying ISO 27001 to a minimal extent within their organizations rather than strengthening security controls throughout their most critical applications, business data, or information systems. This creates inconsistencies in the application of security controls within the organization, wherein the ISO 27001-certified areas are more secure than other areas.
An efficient security performance measurement method must be created to resolve this problem and evaluate how well the organizations can protect, detect, respond, and recover from cyberattacks. The measurement method must be quick and affordable because security controls must be dynamic, continuously updated, and upgraded. Static security controls will eventually fall to an attacker. Given this, organizations must rapidly and frequently perform measurements to identify current weaknesses and better plan for defense. This practice is similar to the role of COVID-19 rapid testing. The countries that run more tests per capita have demonstrated better results in containing outbreaks [14]. Nevertheless, the available methods are limited, especially quantitative measurement and benchmarking at the organization level [15,16]. Only a few methods were tested in a real-world environment [16], but most of them were resource-intensive and suitable for specific-use cases only [17,18,19,20,21,22]. In addition, the Five-point Likert-type scale questions that are commonly used as measuring instruments can cause the results to be prone to tendency bias and result in a lack of reproducibility [23].
This research aims to develop a new cybersecurity performance measurement framework—namely the Cyber Trust Index (CTI)—that is fast, flexible, adaptable, and requires less effort than conventional methods. The core design concept is based on the measurement information model described in ISO 15939:2017 [24]. The CTI is built upon Control Enablers and Capability Tiers, which, in our hypothesis, are the crucial factors that drive cybersecurity performance. Organizations that have Control Enablers in higher Capability Tiers are more secure and have a higher degree of cyber resilience. We derived the Control Enablers and Capability Tiers from a systemic literature review; these also serve as reusable parts in the CTI model, making the model flexible and adaptable. They can accommodate other measurement methods or security control sets by functioning as the base measures, measurement functions, or weighted elements. The CTI was evaluated by security experts and tested by 35 organizations across different industry sectors. Based on the results, we can provide answers to the following research questions:
RQ1: Which industry sectors are leading/lacking in terms of cybersecurity performance?
RQ2: What are the internal and external driving factors that affect the performance of these sectors?
RQ3: How can we set targets and develop a roadmap for improvement?
2. Cybersecurity Performance Measurement—The Past and the Present Methods
In this section, we analyze prominent scientific research papers, widely used security standards, and best practices to study the methods, mechanisms, and factors that can be used to gauge and benchmark an organization’s security performance. Based on research by W. Burke et al. [15], there were 14 cybersecurity measurement methods that indexed or ranked the security readiness and capabilities at a country or organization level. We selected five methods for the assessment of organizations, then combined them with our search for methods that have been presented in security standards and academic publications. The result was eight methods including the Cybersecurity Capability Maturity Model (C2M2) [25], Cybersecurity Poverty Index [26], Global Cybersecurity Assurance Report Card [27], Capability Assessment Framework for Information Security Governance in Organizations (CAFISGO) [28], ISP 10 × 10 M [29], Composite Cybersecurity Rating Scheme [30], Security Effectiveness Framework [31], and Cyber Resilience Review [32]—as shown in Table 1. Other available methods were excluded from our analysis because they do not measure organization-level performance but do measure at the country level [33,34], evaluate specific topics [17,18,19], or target selected industry sectors only [21,22]. Similarly, the methods that did not disclose details about scoring calculations were also excluded [35,36,37,38].

Table 1.
Methods for measuring an organization’s cybersecurity performance.
Created by U.S. Department of Energy, the Cybersecurity Capability Maturity Model (C2M2) [25] evaluates an organization’s cybersecurity capabilities across ten domains (Asset, Change, and Configuration Management; Threat and Vulnerability Management; Risk Management; Identity and Access Management; Situational Awareness; Event and Incident Response, Continuity of Operations; Third-Party Risk Management; Workforce Management; Cybersecurity Architecture; Cybersecurity Program Management). The method was designed to be used by organizations of any type and size. The C2M2 measurement mechanisms use 342 questions, with each of them using four-point-scale Maturity Indicator Levels (MILs) ranging from 0 (Not Implemented) to 3 (Fully Implemented). An organization will achieve a Maturity Level in the respective domain when the related questions of that Maturity Level are rated as Fully Implemented. The final Maturity Level is determined by the highest Maturity Level achieved.
The Cybersecurity Poverty Index [26] developed by RSA is a lightweight measurement method with only 18 questions that is designed to assess an organization’s ability to identify, protect, detect, respond, and recover from cyber threats following NIST CSF. The index was last run in 2016 with 878 respondents that rated their organizations using a five-point-scale. The final score was produced from the average score of all the questions without weighting. The key results indicated the two most undeveloped capabilities, Incident Response and Cyber Risk Management, which required prioritized improvement.
The Tenable Network Security and CyberEdge Group developed the Global Cybersecurity Assurance Report Card [27] in 2017, which used 12 main questions that were separated into 2 discrete areas. The first area assessed the cyber risks that may affect 11 key IT components by using a five-point-scale. The second area evaluated the organization’s ability to counter the risk using Likert-type scale questions. The final score was calculated by adding the percentage of the top two responses for each question. The major findings included the comparison of cybersecurity performance across different industry sectors, with the government and education sectors receiving the lowest scores.
Maleh et al. proposed the Capability Assessment Framework for Information Security Governance in Organizations (CAFISGO) [28] with the purpose of measuring an organization’s capabilities to govern its security activities. The method has 5 key areas, 21 objectives, and 80 controls that are assembled into 100 questions, each of which must be rated between 0 and 1. The results were based on the summation of weighted average scores and interpreted into five performance levels (Initial; Basic; Defined; Managed; Optimized). CAFISGO was tested with large organizations in Morocco and the results revealed the areas where such organizations had low Maturity Levels, especially with regards to security risk management.
First introduced in 2016 [29] and having undergone rigorous testing in 2020 [16], the ISP 10 × 10 M was used to determine an organization’s security performance based on ten critical success factors (CSF), each of which were measured using ten (10) key performance indicators (KPI) (Physical information security controls; Technical and logical security controls; Information resources management; Employee management; Information risk management and incident handling; Organizational culture and top management support; Information security policy and compliance; Security management maturity; Third-party relationships; External environment connections). The rating process began by sending a questionnaire to the organization’s representative so that they can evaluate each indicator using a Likert scale from 1 (Not adopted) to 5 (Fully implemented). The overall security performance was calculated from the summation of the point-scales and multiplied by the weight of the indicator. The main findings from applying this method indicated that information risk management and incident handling were the most undeveloped areas in 20 organizations in Slovenia and coincided with the findings from the Cybersecurity Poverty Index [26] and CAFISGO [28]. This finding implies that the same problems have continued to persist since 2016.
Since most of the reviewed methods used Maturity Levels and point-scales as the rating mechanism, Rae and Patel took a different approach by developing the Composite Cybersecurity Rating Scheme [30], which is based on using a risk assessment as an instrument for evaluating the cybersecurity performance of SMEs in the UK. The scheme has two layers (behavioral influence and technical audit scores). The scoring of the first layer is produced by measuring the likelihood of poor security behaviors against potential consequences for the business. The second layer is evaluated based on a modified UK Cyber Essentials scheme (Protecting the network; Ensuring systems are securely configured; Controlling system access; Protecting against malware; Keeping the system up to date). Furthermore, a combination of likelihood and consequence also produces the second layer’s score. The final score is then calculated from the summation of the first and second layers. The most challenging aspect of this scheme is that it was based on risk assessment. Since risk is dynamic, due to constant changes in the threat landscape and technology [39], the measurement results might be different depending on the context and, therefore, impossible to compare.
Created with the objective of helping security leaders measure the effectiveness of security operations and identify improvement opportunities, the Security Effectiveness Framework [30] from the Ponemon Institute consists of six metrics (uptime; compliance; threat containment; cost management; breach prevention; policy enforcement) and five key resources (budget; technology; control; governance; culture). It uses 13 questions with a five-point scale from −2 to +2 to establish a rating. The final score (Security Effectiveness Rating) is calculated from the summation of the average points without weighting. The framework was used to survey 101 organizations from the UK and Europe and came up with key recommendations based on the top five drivers that contribute to good Security Effectiveness Ratings and discerned the top five consequences for poor ratings. Among other drivers, policy enforcement was the most important metric that supported security effectiveness.
The Cybersecurity and Infrastructure Security Agency (CISA) under the U.S. Department of Homeland Security developed the Cyber Resilience Review (CRR) [32] as a lightweight assessment method that would allow organizations to evaluate their cybersecurity programs. The method was derived from the CERT Resilience Management Model (CERT-RMM) [40], which defined the foundational practices that would determine an organization’s resilience management capabilities. The CRR comprises of 10 domains (Asset management; Controls management; Configuration and change management; Vulnerability management; Incident management; Service Continuity management; Risk management; External dependencies management; Training and awareness; Situation awareness) that are associated with 42 goals. It uses 299 questions with three-type responses (yes, no, incomplete) to evaluate the Maturity Level. The Maturity Level will be achieved when all goals at each level are satisfied. This method, including the domains, goals, and measurement mechanisms, follows the same approach used by C2M2 [25].
Perspective on Existing Methods
By considering all reviewed methods, we found that the majority of them used predefined questions with point-scale responses that gather data and determine the level of cybersecurity performance [25,26,27,28,29,30]. Then, the points were summarized, mostly as an arithmetic mean [26,28,30], to produce a final score. Only two methods [28,29] applied weighting before determining the results. One method [30] was based on a risk assessment concept and used a 5 × 5 risk matrix (1–25 points) to determine scores. Several methods [25,26,28,29,32] employed the Maturity Level concept (typically from 0 to 5) to convert scores into comprehensible performance levels. These methods share some common challenges and limitations. All of them, except the Global Cybersecurity Assurance Report Card [27], had relatively small performance scale intervals (e.g., from 0 to 5), which caused insufficient structure granularity and caused the results to only be comparable at high levels [41]. The use of a questionnaire with point-scale responses also requires some degree of estimation and might create some variance among different respondents [23]. Furthermore, some methods have too few questions [26,27], making the results dubious; whereas some methods have too many questions [25,32], thereby requiring significant effort in the completion of the assessment.
This research proposes a novel measurement method consisting of several adaptable and reusable components that address the aforementioned challenges. The new method is designed to be fast, reliable, and reusable so that any organization can use it as frequently as needed. Furthermore, existing or future methods can also utilize the results of this research to enhance their processes. Hence, this research will open many new avenues for development in this area.
3. The Cyber Trust Index (CTI) Framework
We designed and developed each component of the CTI framework based on the Measurement Information Model recommended by ISO 15939 [24], as illustrated in Figure 1, to ensure that our framework is adaptable and reusable by other measurement methods.
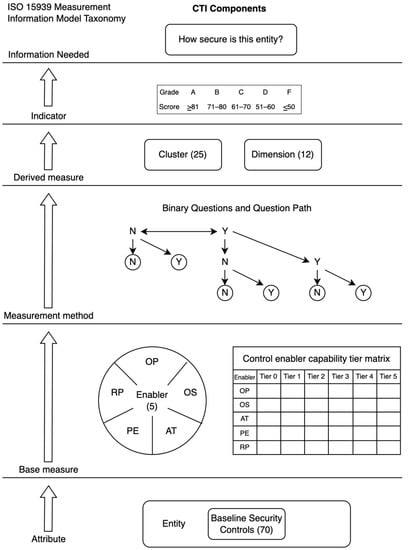
Figure 1.
CTI Components based on ISO 15939 Measurement Information Model.
CTI Framework Walkthrough
This section breaks down the CTI framework into its key elements and describes them based on the measurement information model’s taxonomy.
- Entity and Information Needed
Entity means the organization being measured and the information needed are the results that represent how secure the organization is. To obtain the information needed, the CTI uses the following components:
- Attribute
An attribute is a characteristic of an entity that can be measured and converted into the information needed. Wanyonyi et al. and Tytarenko concluded that organizations are more secure when they have suitable and effective security controls in place [42,43]. Since there is a great deal of variety in security controls that could be used as attributes in our framework, we compiled a baseline security control set from notable security standards and best practices, including ISO 27001 [9], NIST CSF [11], PCI DSS v3.2 [12], NIST SP800-53 R4 [44], SANS Top 20 (CIS Controls) [45,46], ENISA IAF [47], and OWASP Top 10 [48,49].
The baseline security control compilation process was straightforward. We used NIST CSF as a foundation, then explored all other standards and best practices referenced by the NIST CSF. We then consolidated the controls with the same objectives into a unique control. A score was assigned to each unique control by counting the number of standards that recommend such a control. The unique controls that have a score of three or more, which means there are at least three standards recommended as controls, were selected to form our baseline security control set. The results were a total of 70 controls categorized into 25 clusters and 12 dimensions.
The baseline security control set, as shown in Table 2, serves two objectives. The first objective is its use as an attribute to be measured, and the second objective is to prove that other components of CTI can work with any set of security controls because the baseline security control was derived from various standards and best practices.
Table 2.
CTI Controls, Clusters, and Dimensions.
- Base measure
A base measure is a variable that we can assign a value to based on the measurement of the attribute. It serves as an intermediate parameter that gives a signal about the attribute. All methods listed in Table 1 do not have base measures, thereby causing the measurement operations to be subjective and further requiring human judgment to rate or assign values to the attributes. For example, when confronting a rating scale to evaluate the performance of the attributes, the respondents must execute a mapping process between their own attitude and the associated point or level on the rating scale. The results may depend on a respondent’s motivation and cognitive skills to provide accurate responses [50].
To overcome this problem, the CTI framework uses Control Enablers as base measures. Control Enablers are the underlying factors that either mandate, support, or influence the performance of the controls. Cybersecurity performance is the outcome of organizations implementing and operating various controls at different paces. Analyzing the controls (attribute) and Control Enablers (base measure) together will help us move beyond a basic rating of the control itself, which requires human discretion, to identify the nature of the force at play. Furthermore, Control Enablers will help us understand why some organizations have better cybersecurity performance than others.
Control Enablers are derived from applying the Analytical Hierarchy Process (AHP) with a set of candidate enablers that were obtained through literature review. The selected Control Enablers must satisfy the following three qualifying criteria:
- The Control Enabler must either mandate, support, or influence the performance of the control.
- The Control Enabler may or may not be the control itself. If the control plays its part in either mandating, supporting, or influencing the performance of other controls, then that particular control is also a Control Enabler.
- The Control Enabler must be objectively and unambiguously measurable.
The application of AHP begins by constructing multiple logical hierarchies for the systematic assessment of the enablers by making pairwise comparisons for each of the selected criteria against the goal. Our goal is to select Control Enablers that primarily contribute to the security control performance, and our chosen criteria are Mandate, Support, and Influence, which are the qualifying criteria that were stated earlier. Then, the candidate enablers were mapped with the hierarchical structure, as illustrated in Figure 2.
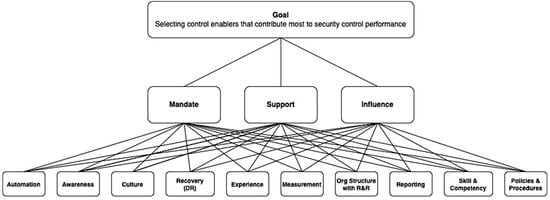
Figure 2.
Hierarchy of goals, criteria, and candidate enablers.
To accommodate the rating process, we decided to use a 9-point scale, which was recommended by Saaty [51], mainly because the scale provided the proper level of granularity and can adequately classify the options upon presentation to experts. The rating for each pair was obtained from experts’ consensus during a focus group meeting. Based on the rating results, a normalized criteria table was created, and an Eigenvector (λ) was calculated and used as a weight for assessing the enablers.
Based on Saaty, we used the Random Consistency Index (RI) of 3 for n = 3, and the Consistency Index (CI) and Consistency Rate (CR) have been computed using Formulas (1) and (2), respectively. The CR rate was 8.34%, which is less than 10%, so our table can be considered consistent.
In the next step of the process, a normalized comparison table of candidate Control Enablers and their criteria was created using the weights obtained from the previous step, as described in Table 3. Likewise, the rating for each pair using Saaty’s scale was obtained from experts during a focus group meeting.
Table 3.
Prioritized enablers.
From the AHP results, we can select the top five enablers that most affect our goal. Some of them, such as Policies and Procedures and Organization Structure with Role and Responsibility, have been renamed to improve clarity and understanding. The selected Control Enablers for our framework are listed in Table 4.
Table 4.
Proposed Control Enablers.
To evaluate security control performance through the Control Enablers, we need to define a scale that represents the level of ability each Control Enabler can contribute to the effectiveness of the control. We then adopted the capability and maturity model concept [20,52,53] and segmented each Control Enabler into levels called Capability Tiers, as shown in Table 5. The Control Enablers in higher Tiers will contribute to more effective security control.
Table 5.
Capability Tiers.
- Measurement Method
ISO 15939 defines two types of measurement methods. The first method involves human judgment (subjective) and the second method performs measurements based on fact (objective). Since our main purpose was to avoid a point-scale that required discretion in rating, a series of binary questions (Y/N) is used as our measurement method to match a Control Enabler with its Capability Tier. The highest achieved tier is then transformed into a score for that enabler. With this binary questioning technique, the respondents only need to choose between two choices and not the ordinal multi-choice formats (such as Likert scales), thereby making the results faster, simpler, and equally reliable [81].
To further improve our measurement method, we use a question path to optimize the number of questions each respondent needs to answer. Rather than answering a fixed set of questions to determine performance levels (usually Maturity Levels) [25,28,32], the question path provides dynamic questions that are presented to the respondent based on their previous answers. There are many possible paths, but the most optimized path was selected and presented in Figure 3. The path begins with question 1 (Q1), which aims to verify whether the base measure achieves Capability Tier 2 or not. Upon answering yes, the path continues to the right and the respondent is presented with Q2, which verifies Tier 4 achievement, and then Q3, which verifies Tier 5 achievement. The circle symbol represents the end of the path and the final Tier being achieved. Whenever the respondent answers no, an alternative question will be presented to measure a different Tier achievement, continuing until reaching the end of the path.
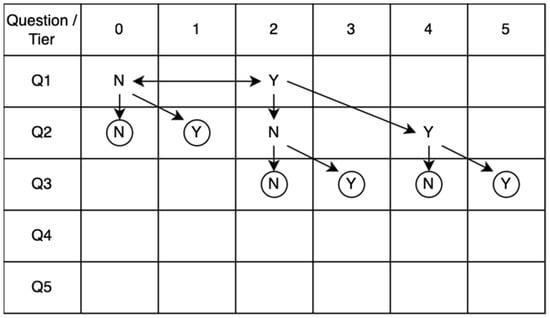
Figure 3.
CTI question path.
To determine which Tier (0–5) the base measure achieves, we only need to ask up to three questions. Hence, by using a question path with binary questions (Y/N), the rating process is faster, more accurate, easier to perform, and reduces the respondent’s fatigue when compared to the methods that do not use this technique [81,82]. Existing methods may benefit from adopting the binary question format and question path techniques to enhance their measurement processes.
- Derived Measure
A derived measure captures information from multiple attributes through two or more base measures and transforms them into a new value that can be used to compare different entities. CTI uses Cluster and Dimension scores as derived measures. The computation process begins by summarizing the scores of all applicable Control Enablers to get a cluster score. Then, in the next step, all cluster scores are calculated to find the arithmetic mean, which becomes the scores for the respective dimensions. Of note, the CTI binary questions and question path were designed to work with the derived measures from the ground up. Each binary question was created to capture data from multiple base measures (Enablers in this case) and the results are presented in the form of a derived measure (cluster). In other words, the question is presented at the cluster level rather than the baseline security control level. This helps reduce the number of questions and makes the answering process more pleasant for the respondents [50].
- Indicator
An indicator serves as the final element in the measurement information model and interprets and presents the measurement results to the user with respect to the defined information needs and further decision-making. In the CTI framework, a typical grading rubric (A to F) was used to represent the performance of each dimension and the overall cybersecurity state of the measured entity.
To obtain a final grade, the scores of the clusters are averaged and then compared with the grading criteria, which can be interpreted in terms of the risk and required actions, as described in Table 6.
Table 6.
Grading criteria and interpretation of the results.
4. Results
This section explains the framework evaluation and stress testing results along with a discussion of the key findings, critical insights, and recommendations. Different evaluation methods were used to identify the framework’s suitability and capability. The qualitative method is an expert in-depth interview based on open-ended questions that uses the Fuzzy Delphi technique. Suggestions from experts were used to improve the framework. The next step is stress testing the framework stress, which was comprised of sending the CTI questionnaires to 80 organizations across the Critical Information Infrastructure (CII) sector [83], as well as some generic sectors in Thailand. Responses from 35 out of the 80 organizations were checked to ensure the quality of the data before performing data analyses. All missing values or outliers were confirmed with the respondents. After the quality check, all variables in our dataset represented a normal distribution with skewness values that ranged between −1.129 and 0.410, with only one value that being less than −1.0. The Kurtosis values are between 1.310 and 3.392, with only one value that exceeds 3.0. Thus, for a small sample size, this result enables the presumption that our dataset is distributed normally [84]. Furthermore, Cronbach’s Alpha (α) was calculated to confirm the internal consistency and reliability of the CTI framework. This result is 0.880, which means our framework is reliable [85,86].
4.1. The State of Cybersecurity in Thailand
Our finding demonstrates the cybersecurity performance of organizations in various sectors of Thailand, with the lowest score being 9, the highest score being 93, and 61 being the average score. Figure 4 presents the distribution of the CTI score for all 35 organizations in ascending order.
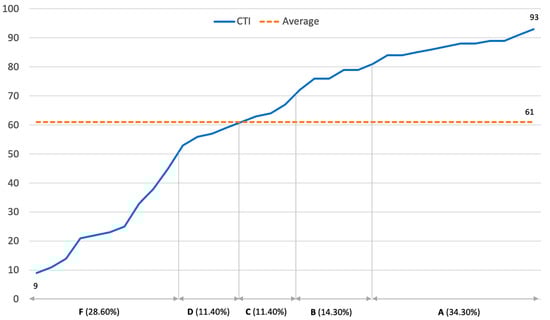
Figure 4.
CTI score and grade distribution.
From the results, 48.6% of the measured organizations have strong cybersecurity performance (34.3% got an A grade and 14.3% got a B). On the other hand, more than half of the measured organizations (51.4%) have weak cybersecurity performance (C, D, and F grades). Ten organizations (28.6%) received an F grade, which indicates a very weak cybersecurity posture and requires immediate improvement. The results show a degree of consistency with the cybersecurity maturity survey of 114 companies that was performed by McKinsey and Company in 2021 [87], which pointed out that most of the surveyed organizations (70%) have not reached the mature cybersecurity state. Another research study conducted in 2016 [26] also summarized similar results, with 75% of the surveyed organizations having significant cybersecurity risk exposure and only 25% being considered mature. This fact highlights the difficulties and challenges in managing cybersecurity risks as the number of mature organizations remains unchanged from the past up to the present.
When conducting a cross-tabulation analysis, we identified the telecommunication industry as the top performer, with an industry average score as high as 90. The transportation industry is the most undeveloped industry, with the lowest industry average score of 25. Figure 5 presents an additional visualization of the industry average scores versus the research average scores and provides an answer to the first research question (RQ1).
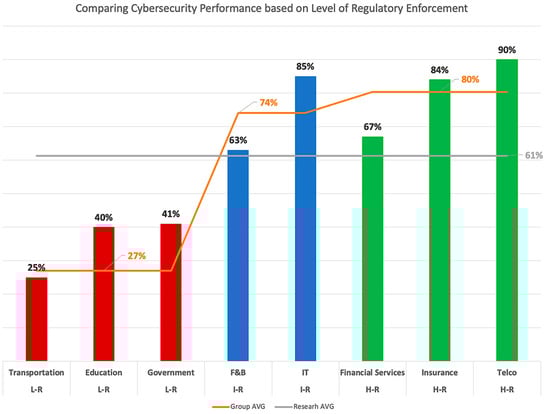
Figure 5.
Industry AVG versus Research AVG scores. Note: Highly regulated (H-R), Indirectly regulated (I-R), Low regulated (L-R).
We can see from Figure 5 that telecommunication (90), information technology (85), and insurance (84) are the leading sectors, whereas government (41) and education (40) are lacking sectors, which is consistent with the results of other studies [26,27]. Transportation (25) is the least promising sector with the lowest score in our study. It is important to note that the leading sectors in our results have well-established regulators who exercise an active role in driving cybersecurity practices. On the other hand, the regulators of the lacking sectors have yet to proactively enforce cybersecurity practices among their regulated organizations. The driving force of regulators indeed provides an answer to part of RQ2, specifically the external driving factor. In addition, these results show logical coherence with the surveys performed by ITU [33] and McKinsey and Company [87] in that the regulated industries with active enforcing regulators progress toward a more decent cybersecurity performance.
4.2. The Key Drivers for Cybersecurity Performance
To answer the second research question (RQ2) and confirm that Control Enablers are important internal factors that drive organizations’ cybersecurity performance, we ran a multiple linear regression on the data of an organization that has a CTI score that is closest to the overall mean score (61). All five Control Enablers were used as independent variables and organization scores were used as the dependent variable. The Control Enabler score was calculated from the Capability Tier (Table 5). For example, if the questionnaire results indicated that the selected organization has a well-defined policy (Tier 3) for the Access Management Cluster, the OP Enabler will get a score of 3. We continued the computation process until all Control Enablers were scored for all respective Clusters. The regression results are shown in Table 7.
Table 7.
Multiple Linear Regression.
The R value is 0.8703, which indicates a strong linear relationship between the Control Enablers and the cluster scores [88]. The R-Squared is 0.7574, which indicates that 75.74% of the variance in the cluster scores can be explained by the capability of the Control Enablers. The overall p-value is 0.00003, which is less than the significance level (<0.001) and was demonstrated to be, overall, statistically significant. A regression analysis of other organizations also yielded results in the same direction. Hence, we can conclude that the Control Enablers are a good fit for the model. Each individual coefficient of the Control Enabler has a positive value, thereby interpreting the positive contribution to the organization scores. The OP has a high significance (p-value < 0.05) and indicates that it is the most important Control Enabler that helps drive an organization’s cybersecurity performance. Our findings are consistent with the study of Bahuguna, Bisht, and Pande, who conducted a study on cybersecurity maturity in Indian organizations through facilitated table-top exercises (TTX) and self-assessment questionnaires [89]. They reported that effective policy implementation is the first priority for improving the cybersecurity maturity of organizations. This also corresponds to the findings of Prislan, Mihelič, and Bernik [16], which indicated that the area of information security policy and compliance play an important role in the degree of information security development.
4.3. Cybersecurity Priorities for the Next Normal
To answer the third research question (RQ3), we used the Two-Tailed T-test method to determine the cybersecurity priorities. In Table 8, the average score of each dimension was compared with the average score of all the dimensions combined. The dimensions that received high significance scores represent the areas that most organizations have performed well in, which are Secure System Installation and Respond and Recovery. The dimensions with low significance scores are the weak areas that are susceptible to cyber risks, thus requiring prioritized actions. These dimensions are Data Security and Cloud Security. The relatively weak performance in the Data Security dimension emphasizes the necessity for raising the bar in protecting personal data to ensure compliance with global and local regulations, such as the EU GDPR and Thailand Personal Data Protection Act (PDPA), as well as protecting the security of data at rest and in transit [16,30]. Organizations should also consider strengthening their controls to protect the remote workforce and cloud applications, especially when they embrace cloud-first and work-from-anywhere strategies [87].
Table 8.
Two-Tailed T-test for each CTI dimension.
Based on the dimension correlation data in Table 9, it is recommended that the implementation of strong access control will help to improve data security and application security since there are high intercorrelations between these dimensions. This finding reflects the current technology and compliance trend wherein most businesses are striving to develop applications to serve customers [90]. These applications require strict access control to ensure only authorized users can access the system and data [91].
Table 9.
CTI dimension correlation matrix.
To further understand the priorities and importance of each dimension, we applied the K-Mean Clustering technique [92] to classify the dimensions into three clusters, as illustrated in Table 10.
Table 10.
K-Mean Clustering results.
- Most critical dimensions: This group result is aligned with the Two-Tailed T-test results that were discussed earlier. It comprises the Data Security and Cloud Security dimensions, which received the lowest scores among the other groups. Policymakers and organization leaders should review and update their current cybersecurity strategy and investment initiatives to give priority to these two dimensions where possible.
- Important dimensions: This group combined related dimensions that form part of the fundamental practice for identifying and mitigating cyber risks. Some organizations received decent scores on these dimensions. Organizations that are just starting to plan and implement cybersecurity programs, e.g., startups and SMEs, may consider these dimensions as a good starting point.
- Necessary dimensions: This group mostly contains technical-oriented dimensions. All of them are necessary for building organizational capabilities to prevent, detect, respond, and recover from cyber threats. This group also has the Governance dimension, which performs the evaluate, direct, and monitor functions [28] and ensures other dimensions are strategically aligned with objectives.
4.4. Cluster Performance Analysis
To leverage the CTI results on an organization’s cybersecurity performance and to suggest benchmarking data for the global community, we analyzed the specific dataset that was created from the top 25th percentile of organizations. These organizations have scored higher than the other 75% of organizations in our study and should be considered a role model for others. This dataset has eight organizations spread across the telecommunication, insurance, IT, government, and financial sectors.
From Figure 6, the top organizations have a solid foundation for managing the legal aspect of cybersecurity. Furthermore, they have a well-established process for ensuring compliance with local and international cyber-related regulations. On the contrary, according to our study, most organizations need to adequately extend their legal practice to cover key suppliers or data processors. Organizations should establish a governance process to manage the compliance obligations of key suppliers through strong contract management.
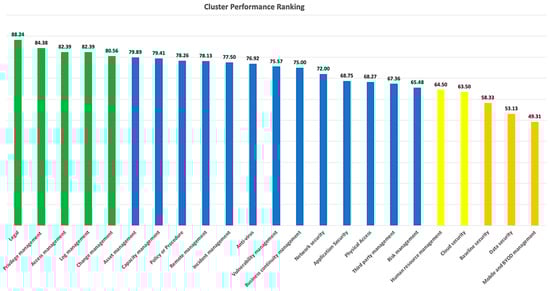
Figure 6.
Cluster performance ranking of 25th-percentile Organizations.
Privilege and access management are the second and third highest-scored clusters, thereby reinforcing the recommendations from other studies [93,94,95] that Identity Management and Access Controls are the most critical elements in every cybersecurity program. Log management is the fourth-ranked cluster. It is driven by the Computer-Related Crime Act B.E. 2550 of Thailand (CCA) [96]. The CCA requires organizations to retain and protect access logs for at least 90 days, so most organizations are already in the mature stage of log management. Similarly, many organizations have a formal change management process, making it the fifth-ranked cluster in our study.
When we look at the clusters with low scores, organizations must pay closer attention to securing mobile and BYOD devices. This is underscored by the fact that Thailand and many other developing countries have an exponential growth rate of mobile banking and e-payment [97], which has expanded the risk surface. Organizations should also take crucial steps to manage and reduce the risks of using user-owned devices/services in business activities (shadow IT) [98].
Data security is another shortfall cluster among organizations. Security measures such as data classification, labeling, masking, and data leakage prevention should be considered with the aim of identifying and protecting the data based on its sensitivity throughout its life cycle [99,100]. Most organizations are doing less in baseline security. This is particularly important and has been highlighted by the new version of the ISO 27001 that was published on 25 October 2022 [101], wherein organizations must define secure baseline configurations and ensure all critical information assets are configured according to the baseline.
The shift from on-premise to cloud computing and the growing reliance on the cloud that has been driven by the COVID-19 pandemic has created a massive demand for better management of security in the cloud. Based on the respondents of our study, as organizations are adopting a cloud-first strategy and focusing on running the business on the cloud, security is one of the most undeveloped areas due to the misconception that it is the responsibility of the cloud service provider [95,102].
It is also essential for organizations to focus on raising users’ awareness and educating them on good cyber hygiene practices that will help reduce phishing risks, which are the primary attack vector of most cyber attacks [103,104]. This is highlighted in the Human Resources Management cluster in our study.
Ultimately, the findings from our research and other studies have led to similar conclusions, wherein most organizations should prioritize their actions to protect business and personal data as well as the data in the cloud [95,99,105,106] by applying a combination of technical and process-based controls [16,87].
5. Discussion
This research complements earlier works by proposing a framework that is derived from significant security standards and research papers. This research attempted to create a lightweight method that could deliver fast and accurate results. To the best of our knowledge, this is the first cybersecurity performance measurement method design based on the ISO 15939 measurement information model, which is being tested in real-world organization settings, especially across various industry sectors. The CTI can be used as a complete toolkit for the evaluation of an organization’s performance or for use in some selected parts to support and enhance other measurement methods. Organizations and regulators can use the data and analytical insight to benchmark their progress and define improvement targets. This section will discuss the importance of and the way to leverage both internal and external factors for performance improvement. We also provided a step-wise roadmap for organizations and regulators to use to get the most benefits from our framework and research data.
5.1. The Need for Cyber Regulating Body and Return on Enforcement—The External Factor
This subsection focuses on the comparison of cyber performance among Highly regulated (H-R), Indirectly regulated (I-R), and Low regulated (L-R) organizations, as illustrated in Figure 5.
In Thailand, many regulating bodies supervise specific industry operations. Among many regulators, there are only four active regulators enforcing cybersecurity practices: (1) the Office of The National Broadcasting and Telecommunications Commission (NBTC), which regulates the telecommunication sector; (2) the Bank of Thailand (BOT), which regulates the financial sector; (3) the Securities and Exchange Commission (SEC), which regulates the capital market—and recently include digital asset business; and (4) the Office of Insurance Commission (OIC), which regulates the insurance sector. All four industry sectors regulated by the NBTC, BOT, SEC, and OIC are grouped to form the Highly regulated (H-R) sectors in our study.
Our findings conclude that industry sectors with active regulators enforcing cybersecurity practices will have a significantly higher performance, with an average score of 80%. In comparison, Low regulated (L-R) sectors only have an average score of 27%, as illustrated in Figure 5. The H-R sectors achieved a 197.53% higher performance than the average score of Low regulated (L-R) sectors, which are comprised the government, education, and transportation sectors, as shown in Table 11.
Table 11.
%Performance differences between each level of regulator enforcement.
The H-R sectors also have a 31.09% higher performance than the average score we developed from our research. Furthermore, there is one specific group to point out: the Indirectly regulated industry (I-R), which comprises the information technology and food and beverage sectors. These sectors do not have active regulators but receive indirect enforcement of cybersecurity practices. For example, the IT service providers who provide services or develop an application for the H-R sectors are subject to strict validation and verification of decent cybersecurity practices through ISO 27001 certification or independent audit reports. The food and beverage sector must also comply with the customers’ strict exporting rules and regulations, which are mainly regulated in the US and EU. Some of these regulations require basic cyber hygiene practices. Thus, the organizations in I-R sectors have a 174.07% and 20.76% better performance than the average score of L-R sectors and the research average, respectively. The L-R sectors with a 55.94% lower current performance compared to the average score from the research must receive immediate attention from all stakeholders—i.e., the organization leader, regulator, and government—to set the policy, allocate resources, and take corrective actions to improve the situation before the risk materializes.
This leads to the conclusion that the more active and stricter the cyber regulating practices, the greater the cybersecurity performance of the organizations. The governments in developing countries can use the data from this study to develop a business case and target KPIs in order to establish cyber regulating bodies, given that the results show positive returns; moreover, this ripple effect will spread beyond the regulated sectors to the indirectly regulated organizations.
5.2. Leverage Control Enabler to Drive Cybersecurity Performance—The Internal Factor
Referring to RQ2, we aimed to identify the key factors that drive cybersecurity performance. Table 12 shows that top performer organizations (org score 81–93) have all Enablers (OP, OS, AT, PE, RP) in Tier 4 or more with an average Enabler score of 4+. Advanced organizations have most Enablers in Tier 3–4 with an average Enabler score of 3–3.9. Intermediate organizations have some Enablers in Tier 2 or 3 with an average Enabler score of 2–2.9. Last, beginner organizations have most Enablers in Tier 1 with an average Enabler score of 0–1.9.
Table 12.
Organization cybersecurity performance profile based on Capability Tier and Enabler Score.
As illustrated in Figure 7, the positive correlation confirms that Control Enablers in the higher Tiers will help organizations achieve better cybersecurity performance.
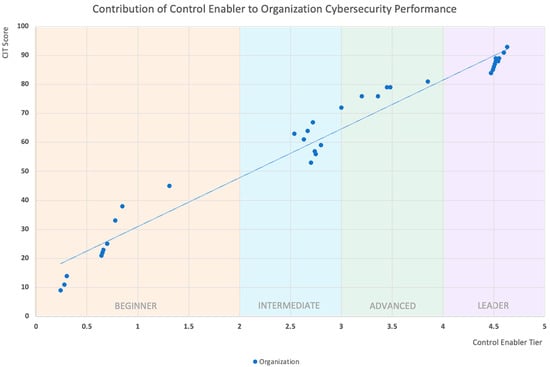
Figure 7.
Contribution of Control Enabler to Organization Cybersecurity Performance.
By analyzing the profiles of leader organizations in Figure 7, we found the five best practices that can deliver a better cybersecurity performance—all are closely tied to our Control Enablers.
1. Make the security policy and process “live”. Although many organizations nowadays are shifting focus from policy-based to platform- or technology-based security controls, policy- and process-based controls are still important, especially in areas where technology is not mature or costly [16,87]. One of the critical success factors of advanced entities in CTI ranking is that they have a documented policy and process, communicate them to all stakeholders, and take proactive steps to ensure that the policies and processes are consistently followed.
Organizations can implement this best practice by improving the OP Enabler to reach at least Tier 4. In fact, OP is the most cost-effective Enabler based on the responses of leader organizations, as it helps drive the performance of most clusters in all dimensions.
2. Build human-centric cybersecurity. There are four subsequent best practices that organizations can follow and all of them are part of leveling the OS Enabler up to Tier 4: (1) Roles and responsibilities must be clearly defined for employees who will take care of security controls operations. These roles must cover all clusters of the CTI. Once defined, the roles and responsibilities must be reviewed and updated on an annual basis; (2) ensure that the security team has adequate staff; (3) consider segregating or having dedicated roles for some specific CTI clusters, such as Legal, Risk Management, Human Resource Management, Access and Privilege Management, Incident Management, and Business Continuity Management. These are the top dedicated roles that have been reported by leader organizations; and (4) since humans are the first line of defense [107,108], organizations must cultivate human-centric cybersecurity by constantly raising awareness and providing security education that is appropriate for each role. The content of the training and awareness education must be reviewed for its effectiveness. Additionally, employees and the security team must be consistently evaluated to ensure the possession of adequate skills and knowledge for their roles and responsibilities.
3. Use technology to optimize operations. Organizations should harness modern technology, such as cybersecurity automation, AI, and machine learning, to deliver better results, reduce staff workload, and enable faster cyber threat detection and response. Automation is one of our recommended Enablers. The organization can gain significant value by implementing automation technology at Tier 4 of the OT Enabler. Automation is a workaround when cyber talent shortage is a global problem [94,109]. It is well noted that leader organizations in our study are embracing technology to optimize the following areas: Asset Management; Mobile and BYOD Management; Access and Privilege Management; Network Security; Anti-Virus; Log Management; and Vulnerability Management;
4. Measure performance to get insight data. According to our research, leader organizations have formally defined security metrics that are regularly measured and updated across most of the CTI clusters. On the unimpressive side, beginner organizations rarely perform these measurements, causing the formation of a significant gap in CTI score differences between their group and the leader group. Our analysis also suggests that organizations that constantly monitor security metrics (Tier 4 of PE Enabler) have a shared pattern of higher scores in the Risk Management, Incident Management, and Business Continuity Management clusters; this is because the data were used to correct the root cause of the problems and improve the processes.
5. Report key results and share knowledge for improvement. The key output of security control operations and measurement results must be reported to all stakeholders to enable organizations to achieve more remarkable progress on CTI rankings and reduce cyber risks simultaneously. Our results reveal that leader organizations are reporting key outputs and measurement results from the managers all the way up to the board and C-suite. This practice will indeed result in a Tier 4 level for the RP Enabler.
5.3. Combining the Internal and External Driving Forces to Deliver Better Cybersecurity Performance—The Roadmap
So far, we have proved that all five Control Enablers complement each other. Together, they form a potent internal driving force that helps organizations attain better CTI scores. We also highlighted the need for a cyber regulating body and the positive return on enforcement that the industry sector will get from having an active regulator as an external driving force for cybersecurity practices. In this subsection, we recommend a roadmap that synergizes all of the driving forces that both organizations and regulators can use as guidance for applying the CTI framework, as well as the data from this research, which can support their mission to deliver better cybersecurity performance. The roadmap is shown in Figure 8.
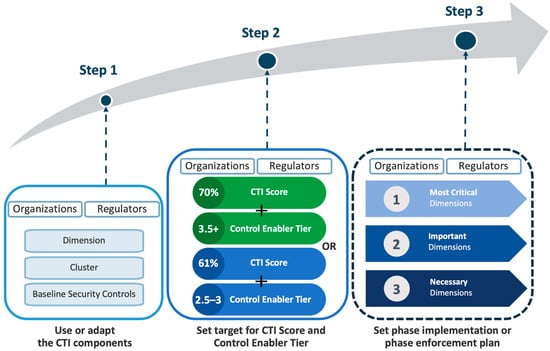
Figure 8.
Roadmap to deliver better cybersecurity performance.
From the roadmap, and by using the CTI Framework (Figure 1) as a reference, organizations and regulators can take the following steps to deliver better cybersecurity performance:
Step 1: Organizations and regulators can opt to use all of the Baseline Security Controls, Clusters, and Dimensions that are recommended by the CTI as their attributes and derived measures or modify them to match specific requirements by adding/updating the controls and rearranging the clusters/dimensions. It is advisable that all controls from the CTI must be kept intact, but more controls can be added as necessary.
Step 2: Organizations and regulators can set cybersecurity performance targets, which comprise two levels: the first level is the overall CTI score/grade and the second level is the Control Enabler Tier achievement. Data from this research can be used as a benchmark of progress. For example, the target for the CTI score/grade could be 61% or more (the overall research average), and the Control Enabler Tier achievement target could be Tier 2.5–3 (intermediate group) according to Figure 8. Organizations or sectors working with more sensitive data or with a need to provide high availability services could set more rigorous targets, such as a score of 70% and levelling up to Tier 3.5 or higher.
Step 3: Organizations can define a phase improvement plan and regulators can set a phase enforcement of security controls for the supervised organizations. This will help prevent compliance burnout [110,111], which occurs from mandating all security controls in one shot, and thereby causing excessive burdens to the organizations. The phase enforcement initiatives can embrace the data from Table 10 of this research. The most critical dimensions (Data Security and Cloud Security) must be tackled first to lessen the current risks. The important dimensions (Asset Management, Risk Management, End-User Management, and Secure System Install) will be the next priority as they form a solid foundation for other initiatives. Then, the necessary dimensions (Governance, Access Control, Network Security, Application Security, Operation Security, and Respond and Recovery) will follow as the last phase that will complete the whole enforcement program.
6. Conclusions
Cybersecurity requires a multi-faceted approach, including commitment and support from stakeholders, up-to-date and robust security controls, and reliable measurement methods that uncover the problems, identify improvement opportunities, and update cybersecurity controls to counter cyber risks on an ongoing basis.
This research presented the Cyber Trust Index (CTI) framework as a novel and efficient method that can rate and plan improvements to an organization’s cybersecurity performance. The framework was validated through stress-testing with 35 organizations from Thailand’s Critical Information Infrastructure (CII) sector, as well as some other generic sectors. The results from the 35 pilot organizations underscore the strong positive relationship (R = 0.98021) between Control Enablers and cybersecurity performance. The organizations in the leader group (31.43% of respondents) have all Enablers (OP, OS, AT, PE, RP) in Tier 4 or more and achieved CTI scores as high as 93%. Hence, organizations can leverage this insight to improve their cybersecurity performance by leveling up the Control Enabler to higher Tiers. Another highlight of our research is the evidence of the positive return on enforcement of cybersecurity practices by regulators. The highly regulated industries have a 197.53% higher performance than the low regulated industries. This fact creates a strong voice for developing countries or even the industry sectors of developed countries that lack active cyber regulating bodies to realize the benefits of having regulators and enforcing good cybersecurity practices.
In addition, the CTI framework provides a comprehensive presentation on how to use binary questions and question path techniques to reduce time and effort in the data-capturing process. There are 50% less questions in the CTI compared to the average number of questions that are asked by existing measurement methods, making the CTI framework more efficient and requiring less time and resources than existing ones.
Lastly, a step-wise roadmap is provided for customizing the CTI and utilizing the data from this research, including the recommended target for critical organizations—70% CTI Score and 3.5+ Control Enabler Tier—to complement the cybersecurity measurements and improvement goals of organizations and regulators.
Author Contributions
Conceptualization, S.M.; methodology, S.M.; validation, S.K. and P.C.; formal analysis, S.M.; investigation, S.M. and S.K.; resources, S.M.; data curation, S.M.; writing—original draft preparation, S.M.; writing—review and editing, S.M., S.K. and P.C.; visualization, S.M.; supervision, S.K. All authors have read and agreed to the published version of the manuscript.
Funding
This research received no external funding.
Institutional Review Board Statement
The study was conducted according to the guidelines of the Declaration of Helsinki, and approved by the Institutional Review Board (or Ethics Committee) of Mahidol University (protocol code MU-CIRB 2020/291.2409 and the date of approval 20 October 2020).
Informed Consent Statement
Not applicable.
Data Availability Statement
Not applicable.
Conflicts of Interest
The authors declare no conflict of interest.
References
- Vasiu, I.; Vasiu, L. Cybersecurity as an Essential Sustainable Economic Development Factor. Eur. J. Sustain. Dev. 2018, 7, 171–178. [Google Scholar] [CrossRef]
- Michael, K.; Kobran, S.; Abbas, R.; Hamdoun, S. Privacy, Data Rights and Cybersecurity: Technology for Good in the Achievement of Sustainable Development Goals. In Proceedings of the International Symposium on Technology and Society (ISTAS2019), Boston, MA, USA, 15–16 November 2019. [Google Scholar]
- Andrade, R.; Yoo, S.; Tello-Oquendo, L.; Ortiz-Garces, I. Cybersecurity, Sustainability, and Resilience Capabilities of a Smart City; Elsevier: Amsterdam, The Netherlands, 2021. [Google Scholar]
- Sadik, S.; Ahmed, M.; Sikos, L.; Islam, N. Toward a Sustainable Cybersecurity Ecosystem. Computers 2020, 9, 74. [Google Scholar] [CrossRef]
- IBM Security. Cost of a Data Breach Report 2020. Available online: https://www.ibm.com/security/digital-assets/cost-data-breach-report/ (accessed on 20 January 2021).
- Interpol, Cyber Crime: COVID-19 Impact. Available online: https://www.interpol.int/News-and-Events/News/2020/INTERPOL-report-shows-alarming-rate-of-cyberattacks-during-COVID-19 (accessed on 12 August 2020).
- Hill, T. FBI Sees Spike in Cyber Crime Reports during Coronavirus Pandemic. Available online: https://thehill.com/policy/cybersecurity/493198-fbi-sees-spike-in-cyber-crime-reports-during-coronavirus-pandemic (accessed on 12 August 2020).
- Hedström, K.; Kolkowska, E.; Karlsson, F.; Allen, J.P. Value conflicts for information security management. J. Strateg. Inf. Syst. 2011, 20, 373–384. [Google Scholar] [CrossRef]
- ISO/IEC 27001:2013; Information Technology—Security Techniques—Information Security Management Systems—Requirements. International Organization for Standardization: Geneva, Switzerland, 2013.
- ISO/IEC 27701:2019; Security Techniques—Extension to ISO/IEC 27001 and ISO/IEC 27002 for Privacy Information Management—Requirements and Guidelines. International Organization for Standardization: Geneva, Switzerland, 2019.
- NIST. Framework for Improving Critical Infrastructure Cybersecurity. 2018. Available online: https://nvlpubs.nist.gov/nistpubs/CSWP/NIST.CSWP.04162018.pdf (accessed on 5 May 2020).
- Payment Card Industry Security Standards Council. Payment Card Industry (PCI) Data Security Standard; PCI SSC: Westborough, MA, USA, 2018. [Google Scholar]
- Park, C.; Jang, S.; Park, Y. A study of Effect of Information Security Management System [ISMS] Certification on Organization Performance. J. Korea Acad. Ind. Coop. Soc. 2012, 13, 4224–4233. [Google Scholar]
- Pettengill, M.; McAdam, A. Can We Test Our Way Out of the COVID-19 Pandemic? J. Clin. Microbiol. 2020, 58, e02225-20. [Google Scholar] [CrossRef] [PubMed]
- Burke, W.; Oseni, T.; Jolfaei, A.; Gondal, I. Cybersecurity Indexes for eHealth. In Proceedings of the Australasian Computer Science Week Multiconference, Sydney, Australia, 29–31 January 2019; pp. 1–8. [Google Scholar] [CrossRef]
- Prislan, K.; Mihelič, A.; Bernik, I. A real-world information security performance assessment using a multidimensional socio-technical approach. PLoS ONE 2020, 15, e0238739. [Google Scholar] [CrossRef] [PubMed]
- Hewlett Packard. State of Security Operations: Report of Capabilities and Maturity of Cyber Defense Organizations: Business White Paper. Palo Alto. 2015. Available online: https://ten-inc.com/presentations/HP-State-of-Security-Operations-2015.pdf (accessed on 28 May 2021).
- Shah, A.; Ganesan, R.; Jajodia, S.; Cam, H. A methodology to measure and monitor level of operational effectiveness of a CSOC. Int. J. Inf. Secur. 2018, 17, 121–134. [Google Scholar] [CrossRef]
- John Joseph, A.J.; Mariappan, M. A novel trust-scoring system using trustability co-efficient of variation for identification of secure agent platforms. PLoS ONE 2018, 13, e0201600. [Google Scholar] [CrossRef]
- Monteiro, S.; Magalhães, J.P. Information Security Maturity Level: A Fast Assessment Methodology. In Ambient Intelligence—Software and Applications—8th International Symposium on Ambient Intelligence (ISAmI 2017); De Paz, J.F., Julian, V., Villarrubia, G., Marreiros, G., Novais, P., Eds.; Springer: Berlin/Heidelberg, Germany, 2017; pp. 269–277. [Google Scholar]
- Teufel, S.; Burri, R.; Teufel, B. Cybersecurity guideline for the utility business a swiss approach. In Proceedings of the 2018 International Conference on Smart Grid and Clean Energy Technologies, ICSGCE 2018, Kajang, Malaysia, 29 May–1 June 2018; IEEE: Beijing, China, 2018; pp. 1–6. [Google Scholar] [CrossRef]
- Szczepaniuk, E.K.; Szczepaniuk, H.; Rokicki, T.; Klepacki, B. Information security assessment in public administration. Comput. Secur. 2020, 90, 101709. [Google Scholar] [CrossRef]
- Taherdoost, H. What Is the Best Response Scale for Survey and Questionnaire Design; Review of Different Lengths of Rating Scale/Attitude, Scale Likert Scale. Int. J. Acad. Res. Manag. 2019, 8, 1–10. [Google Scholar]
- ISO/IEC/IEEE 15939:2017; Systems and Software Engineering—Measurement Process. International Organization for Standardization: Geneva, Switzerland, 2017.
- U.S. Department of Energy. Cybersecurity Capability Maturity Model Version 2.0. 2021. Available online: https://www.energy.gov/ceser/cybersecurity-capability-maturity-model-c2m2 (accessed on 28 May 2021).
- RSA. RSA Cybersecurity Poverty Index—2016; RSA: Bedford, MA, USA, 2016. [Google Scholar]
- Tenable Network Security; CyberEdge Group. 2017 Global Cybersecurity Assurance Report Card; CyberEdge Group: Annapolis, MD, USA, 2017. [Google Scholar]
- Maleh, Y.; Ezzati, A.; Sahid, A.; Belaissaoui, M. CAFISGO: A Capability Assessment Framework for Information Security Governance in Organizations. J. Inf. Assur. Secur. 2017, 12, 209–217. [Google Scholar]
- Bernik, I.; Prislan, K. Measuring Information Security Performance with 10 by 10 Model for Holistic State Evaluation. PLoS ONE 2016, 11, e0163050. [Google Scholar] [CrossRef] [PubMed]
- Rae, A.; Patel, A. Defining a New Composite Cybersecurity Rating Scheme for SMEs in the U.K. In Information Security Practice and Experience; Lecture Notes in Computer Science; Springer: Cham, Switzerland, 2019; Volume 11879, pp. 362–380. [Google Scholar]
- Ponemon Institute. Security Effectiveness Framework Study; Ponemon Institute: Traverse City, MI, USA, 2010; Available online: https://www.yumpu.com/en/document/view/28533958/security-effectiveness-framework-study (accessed on 28 May 2021).
- Cybersecurity and Infrastructure Security Agency. Cyber Resilience Review; CISA: Arlington, VA, USA, 2020. Available online: https://www.cisa.gov/uscert/resources/assessments (accessed on 28 May 2021).
- ITU; BDT. Cyber Security Programme Global Cybersecurity Index (GCI) Reference Model; ITU/BDT: Geneva, Switzerland, 2020. [Google Scholar]
- E-Governance Academy. National Cybersecurity Index; EGA: Tallin, Estonia, 2018. [Google Scholar]
- PwC; Iron Mountain. An Introduction to the Information Risk Maturity Index; Iron Mountain: Boston, MA, USA, 2014. [Google Scholar]
- Yu, S. Understanding the Security Vendor Landscape Using the Cyber Defense Matrix. In Proceedings of the RSA Conference, San Francisco, CA, USA, 29 February–4 March 2016. [Google Scholar]
- Yu, S. The BETTER Cyber Defense Matrix, Reloaded. In Proceedings of the RSA Conference, San Francisco, CA, USA, 4–8 March 2019. [Google Scholar]
- Bissell, K.; LaSalle, R.; Richards, K. The Accenture Security Index; Accenture: Dublin, Ireland, 2017. [Google Scholar]
- Taylor, R.G. Potential Problems with Information Security Risk Assessments. Inf. Secur. J. 2015, 24, 177–184. [Google Scholar] [CrossRef]
- Software Engineering Institute. CERT Resilience Management Model Version 1.2; SEI: Pittsburgh, PA, USA, 2016; Available online: https://resources.sei.cmu.edu/library/asset-view.cfm?assetid=508084 (accessed on 6 June 2021).
- Pearse, N. Deciding on the scale granularity of response categories of likert type scales: The case of a 21-point scale. Electron. J. Bus. Res. Methods 2011, 9, 159–171. [Google Scholar]
- Wanyonyi, E.; Rodrigues, A.; Abeka, S.O.; Ogara, S. Effectiveness of Security Controls On Electronic Health Records. Int. J. Sci. Technol. Res. 2017, 6, 47–54. [Google Scholar]
- Tytarenko, O. Selection of the Best Security Controls for Rapid Development of Enterprise-Level Cyber Security; Naval Postgraduate School: Monterey, CA, USA, 2017. [Google Scholar]
- NIST. NIST SP 800-53 Rev.4 Security and Privacy Controls for Federal Information Systems and Organizations. 2013. Available online: https://csrc.nist.gov/publications/detail/sp/800-53/rev-4/final (accessed on 5 May 2020).
- Center for Internet Security. CIS Controls v7.1. 2019. Available online: https://learn.cisecurity.org/CIS-Controls-v7.1 (accessed on 8 October 2020).
- SANS Institute. The CIS Critical Security Controls for Effective Cyber Defense. Available online: https://www.sans.org/critical-security-controls (accessed on 8 October 2020).
- Microsoft. About the ENISA Information Assurance Framework. Available online: https://docs.microsoft.com/en-us/compliance/regulatory/offering-enisa (accessed on 3 June 2020).
- OWASP. OWASP Top Ten. Available online: https://owasp.org/www-project-top-ten/ (accessed on 9 November 2020).
- OWASP. OWASP Mobile Top Ten. Available online: https://owasp.org/www-project-mobile-top-10/ (accessed on 9 November 2020).
- Krosnick, J. Question and Questionnaire Design. In The Palgrave Handbook of Survey Research; Palgrave: Cham, Switzerland, 2018. [Google Scholar]
- Saaty, T.L. Analytic Hierarchy Process. In Encyclopedia of Biostatistics; Armitage, P., Colton, T., Eds.; John Wiley & Sons: Hoboken, NJ, USA, 2005. [Google Scholar] [CrossRef]
- Safari, M.R.; Yu, L.Z. Assessment of IT Governance and Process Maturity: Evidence from banking Industry. In Proceedings of the Thirteenth Wuhan International Conference on E-Business, Wuhan, China, 1 June 2014; pp. 145–153. [Google Scholar]
- Elmaallam, M.; Kriouile, A. Towards A Model of Maturity For Is Risk Management. Int. J. Comput. Sci. Inf. Technol. 2011, 3, 171–188. [Google Scholar] [CrossRef]
- Salvi, V.; Kadam, A.W. Information Security Management at HDFC Bank: Contribution of Seven Enablers; ISACA: Schaumburg, IL, USA, 2014. [Google Scholar]
- Da Veiga, A. The influence of information security policies on information security culture: Illustrated through a case study. In Proceedings of the Ninth International Symposium on Human Aspects of Information Security & Assurance (HAISA), Levos, Greece, 1–3 July 2015; Plymouth University: Plymouth, UK, 2015; pp. 22–33. [Google Scholar]
- Shriver, S.; Williams, B. Situational Leadership and Cybersecurity. Lead. Lead. 2019, 91, 44–49. [Google Scholar] [CrossRef]
- Kianpour, M.; Kowalski, S.; Zoto, E.; Frantz, C.; Overby, H. Designing Serious Games for Cyber Ranges: A Socio-technical Approach. In Proceedings of the 2019 IEEE European Symposium on Security and Privacy Workshops, Stockholm, Sweden, 17–19 June 2019; pp. 85–93. [Google Scholar]
- Griffy-Brown, C.; Lazarikos, D.; Chun, M. Agile Business Growth and Cyber Risk: How do we secure the Internet of Things (IoT) environment? In Proceedings of the 2018 IEEE Technology and Engineering Management Conference (TEMSCON), Evanston, IL, USA, 28 June–1 July 2018; pp. 1–5. [Google Scholar]
- Sharma, L.; Singh, V. India towards digital revolution (security and sustainability). In Proceedings of the 2nd World Conference on Smart Trends in Systems, Security and Sustainability World, London, UK, 27 July 2020; pp. 163–171. [Google Scholar]
- Moller, D. Cybersecurity in Digital Transformation Scope and Applications; Springer: Berlin/Heidelberg, Germany, 2020. [Google Scholar]
- Van Eeten, M. Patching security governance: An empirical view of emergent governance mechanisms for cybersecurity. Digit. Policy Regul. Gov. 2017, 19, 429–448. [Google Scholar] [CrossRef]
- Mosteanu, N. Challenges for organizational structure and design as a result of digitalization and cybersecurity. Bus. Manag. Rev. 2020, 11, 278–286. [Google Scholar] [CrossRef]
- NIST. NIST SP 800-181. Rev.1 Workforce Framework for Cybersecurity (NICE Framework). 2020. Available online: https://doi.org/10.6028/NIST.SP.800-181r1 (accessed on 11 July 2021).
- Elkhannoubi, H.; Belaissaoui, M. A framework for an effective cybersecurity strategy implementation: Fundamental pillars identification. In Proceedings of the International Conference on Intelligent Systems Design and Applications (ISDA), Porto, Portugal, 14–16 December 2016; pp. 1–8. [Google Scholar]
- Akin, O.; Karaman, M. A novel concept for cybersecurity: Institutional cybersecurity. In Proceedings of the International Conference on Information Security and Cryptography, Ankara, Turkey, 23–24 May 2013. [Google Scholar]
- Chehri, A.; Fofona, I.; Yang, X. Security Risk Modeling in Smart Grid Critical Infrastructures in the Era of Big Data and Artificial Intelligence. Sustainability 2021, 6, 3196. [Google Scholar] [CrossRef]
- Mohammad, S.; Surya, L. Security Automation in Information Technology. Int. J. Creat. Res. Thoughts IJCRT 2018, 6, 901–905. [Google Scholar]
- Geluvaraj, B. The Future of Cybersecurity: Major Role of Artificial Intelligence, Machine Learning, and Deep Learning in Cyberspace. In International Conference on Computer Networks and Communication Technologies (ICCNCT); Springer: Singapore, 2018. [Google Scholar]
- Truong, T.; Diep, Q.; Zelinka, I. Artificial Intelligence in the Cyber Domain: Offense and Defense. Symmetry 2020, 3, 410. [Google Scholar] [CrossRef]
- Shaukat, K.; Luo, S.; Varadharajan, V.; Hameed, I.A.; Chen, S.; Liu, D.; Li, J. Performance Comparison and Current Challenges of Using Machine Learning Techniques in Cybersecurity. Energies 2020, 13, 2509. [Google Scholar] [CrossRef]
- Sarker, I.; Abushark, Y.; Alsolami, F.; Khan, A. IntruDTree: A Machine Learning Based Cyber Security Intrusion Detection Model. Symmetry 2020, 5, 754. [Google Scholar] [CrossRef]
- Krumay, B.; Bernroider, E.W.; Walser, R. Evaluation of Cybersecurity Management Controls and Metrics of Critical Infrastructures: A Literature Review Considering the NIST Cybersecurity Framework. In Proceedings of the 23rd Nordic Conference (NordSec 2018), Oslo, Norway, 28–30 November 2018; pp. 376–391. [Google Scholar]
- Andreolini, M.; Colacino, V.; Colajanni, M.; Marchetti, M. A Framework for the Evaluation of Trainee Performance in Cyber Range Exercises. Mob. Netw. Appl. 2020, 1, 236–247. [Google Scholar] [CrossRef]
- Goode, J.; Levy, Y.; Hovav, A.; Smith, J. Expert assessment of organizational cybersecurity programs and development of vignettes to measure cybersecurity countermeasures awareness. Online J. Appl. Knowl. Manag. 2018, 1, 67–80. [Google Scholar] [CrossRef]
- Ahmed, Y.; Naqvi, S.; Josephs, M. Cybersecurity Metrics for Enhanced Protection of Healthcare IT Systems. In Proceedings of the International Symposium on Medical Information and Communication Technology (ISMICT), Oslo, Norway, 8–10 May 2019. [Google Scholar]
- Hughes, J.; Cybenko, G. Quantitative Metrics and Risk Assessment: The Three Tenets Model of Cybersecurity. Technol. Innov. Manag. Rev. 2013, 8, 15–24. [Google Scholar] [CrossRef]
- De Bruin, R.; Solms, V. Cybersecurity Governance: How can we measure it? In Proceedings of the IST Africa Conference, Durban, South Africa, 11–13 May 2016. [Google Scholar]
- Andreasson, A.; Fallen, N. External Cybersecurity Incident Reporting for Resilience. In Proceedings of the 17th International Conference of Perspectives in Business Informatics Research (BIR 2018), Stockholm, Sweden, 24–26 September 2018. [Google Scholar]
- Yang, L.; Lau, L.; Gan, H. Investors’ perceptions of the cybersecurity risk management reporting framework. Int. J. Account. Inf. Manag. 2020, 1, 167–183. [Google Scholar] [CrossRef]
- Piplai, A.; Mittal, S.; Joshi, A.; Finin, T.; Holt, J.; Zak, R. Creating Cybersecurity Knowledge Graphs From Malware After Action Reports. IEEE Access 2020, 8, 211691–211703. [Google Scholar] [CrossRef]
- Dolnicar, S.; Grün, B.; Leisch, F. Quick, simple and reliable: Forced binary survey questions. Int. J. Mark. Res. 2011, 53, 233. [Google Scholar] [CrossRef]
- Norman, K.; Pleskac, T. Conditional Branching in Computerized Self-Administered Questionnaires on the World Wide Web. Proc. Hum. Factors Ergon. Soc. Annu. Meet. 2002, 46, 1241–1245. [Google Scholar] [CrossRef]
- National Cybersecurity Agency (NCSA). Prescribing Criteria and Types of Organizations with Tasks or Services as Critical Information Infrastructure Organizations and Assigning Control and Regulation B.E. 2564. 2021. Available online: https://drive.ncsa.or.th/s/akWsCmQ7Z9oDWAY (accessed on 6 June 2021).
- Kline, R.B. Principles and Practice of Structural Equation Modeling; The Guilford Press: New York, NY, USA, 2010. [Google Scholar]
- Hair, J.; Black, W.; Babin, B.; Anderson, R. Multivariate Data Analysis: A Global Perspective; Prentice Hall: Hoboken, NJ, USA, 2010. [Google Scholar]
- George, D.; Mallery, P. SPSS for Windows Step by Step: A Simple Guide and Reference, 11.0 Update, 4th ed.; Allyn & Bacon: Boston, MA, USA, 2003. [Google Scholar]
- McKinsey & Company. Organizational Cyber Maturity: A Survey of Industries. 2021. Available online: https://www.mckinsey.com/business-functions/risk-and-resilience/our-insights/organizational-cyber-maturity-a-survey-of-industries (accessed on 14 July 2022).
- Garcia Asuero, A.; Sayago, A.; González, G. The Correlation Coefficient: An Overview. Crit. Rev. Anal. Chem. 2006, 36, 41–59. [Google Scholar] [CrossRef]
- Bahuguna, A.; Bisht, R.; Pande, J. Assessing cybersecurity maturity of organizations: An empirical investigation in the Indian context. Inf. Secur. J. Glob. Perspect. 2019, 28, 164–177. [Google Scholar] [CrossRef]
- Agyeman, F.O.; Ma, Z.; Li, M.; Sampene, A.K. A Literature Review on Platform Business Model: The Impact of Technological Processes on Platform Business. EPRA Int. J. Econ. Bus. Manag. Stud. 2021, 8, 1–7. [Google Scholar] [CrossRef]
- Rohn, D.; Bican, P.; Brem, A.; Kraus, S.; Clauß, T. Digital platform-based business models—An exploration of critical success factors. J. Eng. Technol. Manag. 2021, 60, 101625. [Google Scholar] [CrossRef]
- Wu, J. Cluster Analysis and K-means Clustering: An Introduction. In Advances in K-Means Clustering; Springer: Berlin/Heidelberg, Germany, 2012. [Google Scholar] [CrossRef]
- Alhija, M. Cyber security: Between challenges and prospects. CIC Express Lett. Part B Appl. Int. J. Res. Surv. 2020, 11, 1019–1028. [Google Scholar] [CrossRef]
- Mohammed, I.A. Identity Management Capability Powered by Artificial Intelligence to Transform the Way User Access Privileges Are Managed, Monitored and Controlled. SSRN Electron. J. 2021, 9, 4719–4723. [Google Scholar]
- Pankti, D.; Thaier, H. Best Practices for Securing Financial Data and PII in Public Cloud. Int. J. Comput. Appl. 2021, 183, 1–6. [Google Scholar]
- Ministry of Digital Economy and Society. Computer-Related Crime Act B.E. 2550. 2007. Available online: https://www.mdes.go.th/law/detail/3618-COMPUTER-RELATED-CRIME-ACT-B-E--2550--2007- (accessed on 15 October 2022).
- J.P. Morgan. E-Commerce Payments Trends: Thailand. 2019. Available online: https://www.jpmorgan.com/merchant-services/insights/reports/thailand (accessed on 15 October 2022).
- Alotaibi, B.; Almagwashi, H. A Review of BYOD Security Challenges, Solutions and Policy Best Practices. In Proceedings of the 2018 1st International Conference on Computer Applications & Information Security (ICCAIS), Riyadh, Saudi Arabia, 4–6 April 2018; pp. 1–6. [Google Scholar] [CrossRef]
- Koo, J.; Kang, G.; Kim, Y.-G. Security and Privacy in Big Data Life Cycle: A Survey and Open Challenges. Sustainability 2020, 12, 10571. [Google Scholar] [CrossRef]
- Moulos, V.; Chatzikyriakos, G.; Kassouras, V.; Doulamis, A.; Doulamis, N.; Leventakis, G.; Florakis, T.; Varvarigou, T.; Mitsokapas, E.; Kioumourtzis, G.; et al. A Robust Information Life Cycle Management Framework for Securing and Governing Critical Infrastructure Systems. Inventions 2018, 3, 71. [Google Scholar] [CrossRef]
- ISO/IEC 27001:2022; Information Security, Cybersecurity and Privacy Protection—Information Security Management Systems—Requirements. International Organization for Standardization: Geneva, Switzerland, 2022.
- Wermke, D.; Huaman, N.; Stransky, C.; Busch, N.; Acar, Y.G.; Fahl, S. Cloudy with a Chance of Misconceptions: Exploring Users’ Perceptions and Expectations of Security and Privacy in Cloud Office Suites. In Proceedings of the Sixteenth Symposium on Usable Privacy and Security (SOUPS 2020), Online, 7–11 August 2020. [Google Scholar]
- Alabdan, R. Phishing Attacks Survey: Types, Vectors, and Technical Approaches. Future Internet 2020, 12, 168. [Google Scholar] [CrossRef]
- Ghazi-Tehrani, A.K.; Pontell, H.N. Phishing Evolves: Analyzing the Enduring Cybercrime. Vict. Offenders 2021, 16, 316–342. [Google Scholar] [CrossRef]
- Lallie, H.; Shepherd, L.; Nurse, J.; Erola, A.; Epiphaniou, G.; Maple, C.; Bellekens, X. Cyber Security in the Age of COVID-19: A Timeline and Analysis of Cyber-Crime and Cyber-Attacks during the Pandemic. Comput. Secur. 2021, 105, 102248. [Google Scholar] [CrossRef]
- Yassine, H.; Shahab, S.S.; Faycal, B.; Abbes, A.; Mamoun, A. Latest trends of security and privacy in recommender systems: A comprehensive review and future perspectives. Comput. Secur. 2022, 118, 102746. [Google Scholar]
- Jensen, M.L.; Wright, R.; Durcikova, A.; Karumbaiah, S. Building the Human Firewall: Combating Phishing through Collective Action of Individuals Using Leaderboards (1 July 2020). Available online: https://doi.org/10.2139/ssrn.3622322 (accessed on 27 October 2022).
- Edegbeme-Beláz, A.; Zsolt, S. The Human Firewall—The Human Side of Cybersecurity; Óbuda University: Budapest, Hungary, 2020. [Google Scholar]
- Brewer, R. Could SOAR save skills-short SOCs? Comput. Fraud. Secur. 2019, 2019, 8–11. [Google Scholar] [CrossRef]
- Pham, H. Information security burnout: Identification of sources and mitigating factors from security demands and resources. J. Inf. Secur. Appl. 2019, 46, 96–107. [Google Scholar] [CrossRef]
- Nobles, C. Stress, Burnout, and Security Fatigue in Cybersecurity: A Human Factors Problem. HOLISTICA J. Bus. Public Adm. 2022, 13, 49–72. [Google Scholar] [CrossRef]


Publisher’s Note: MDPI stays neutral with regard to jurisdictional claims in published maps and institutional affiliations. |
© 2022 by the authors. Licensee MDPI, Basel, Switzerland. This article is an open access article distributed under the terms and conditions of the Creative Commons Attribution (CC BY) license (https://creativecommons.org/licenses/by/4.0/).