

Near Infrared Illumination Optimization for Vein Detection: Hardware and Software Approaches

 , , and
Abstract
1. Introduction
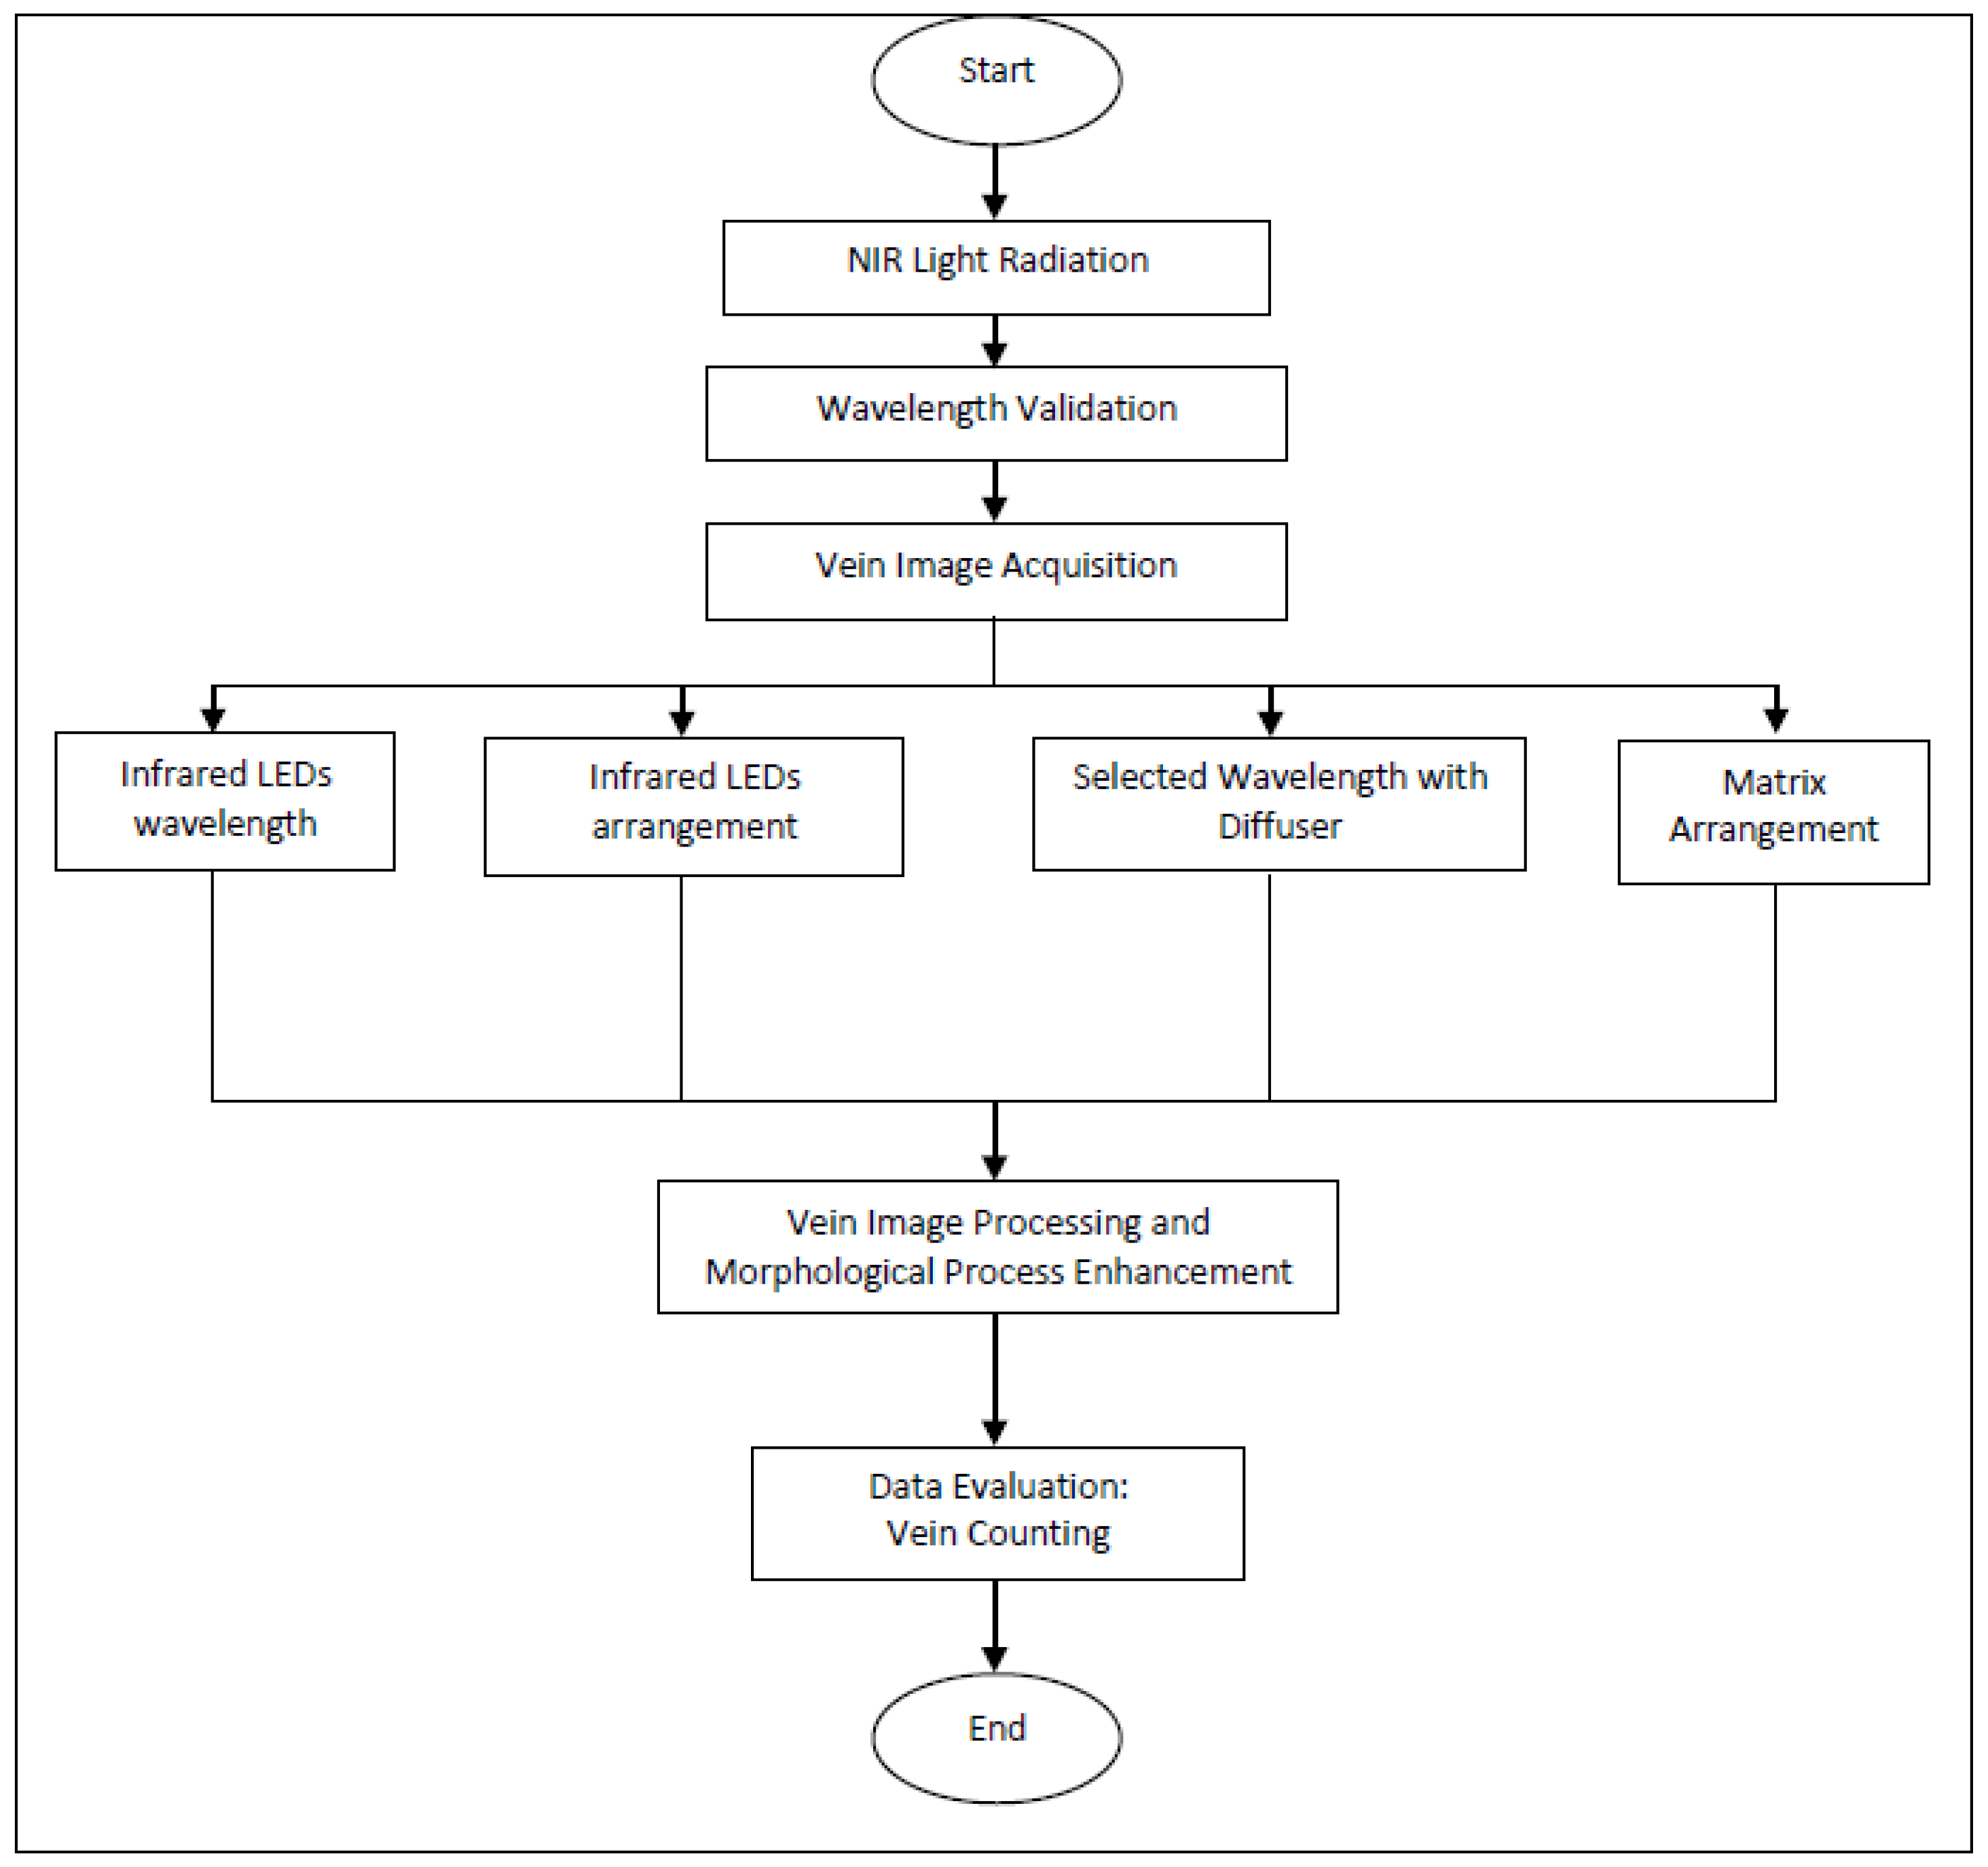
2. Methodology
2.1. NIR Projection
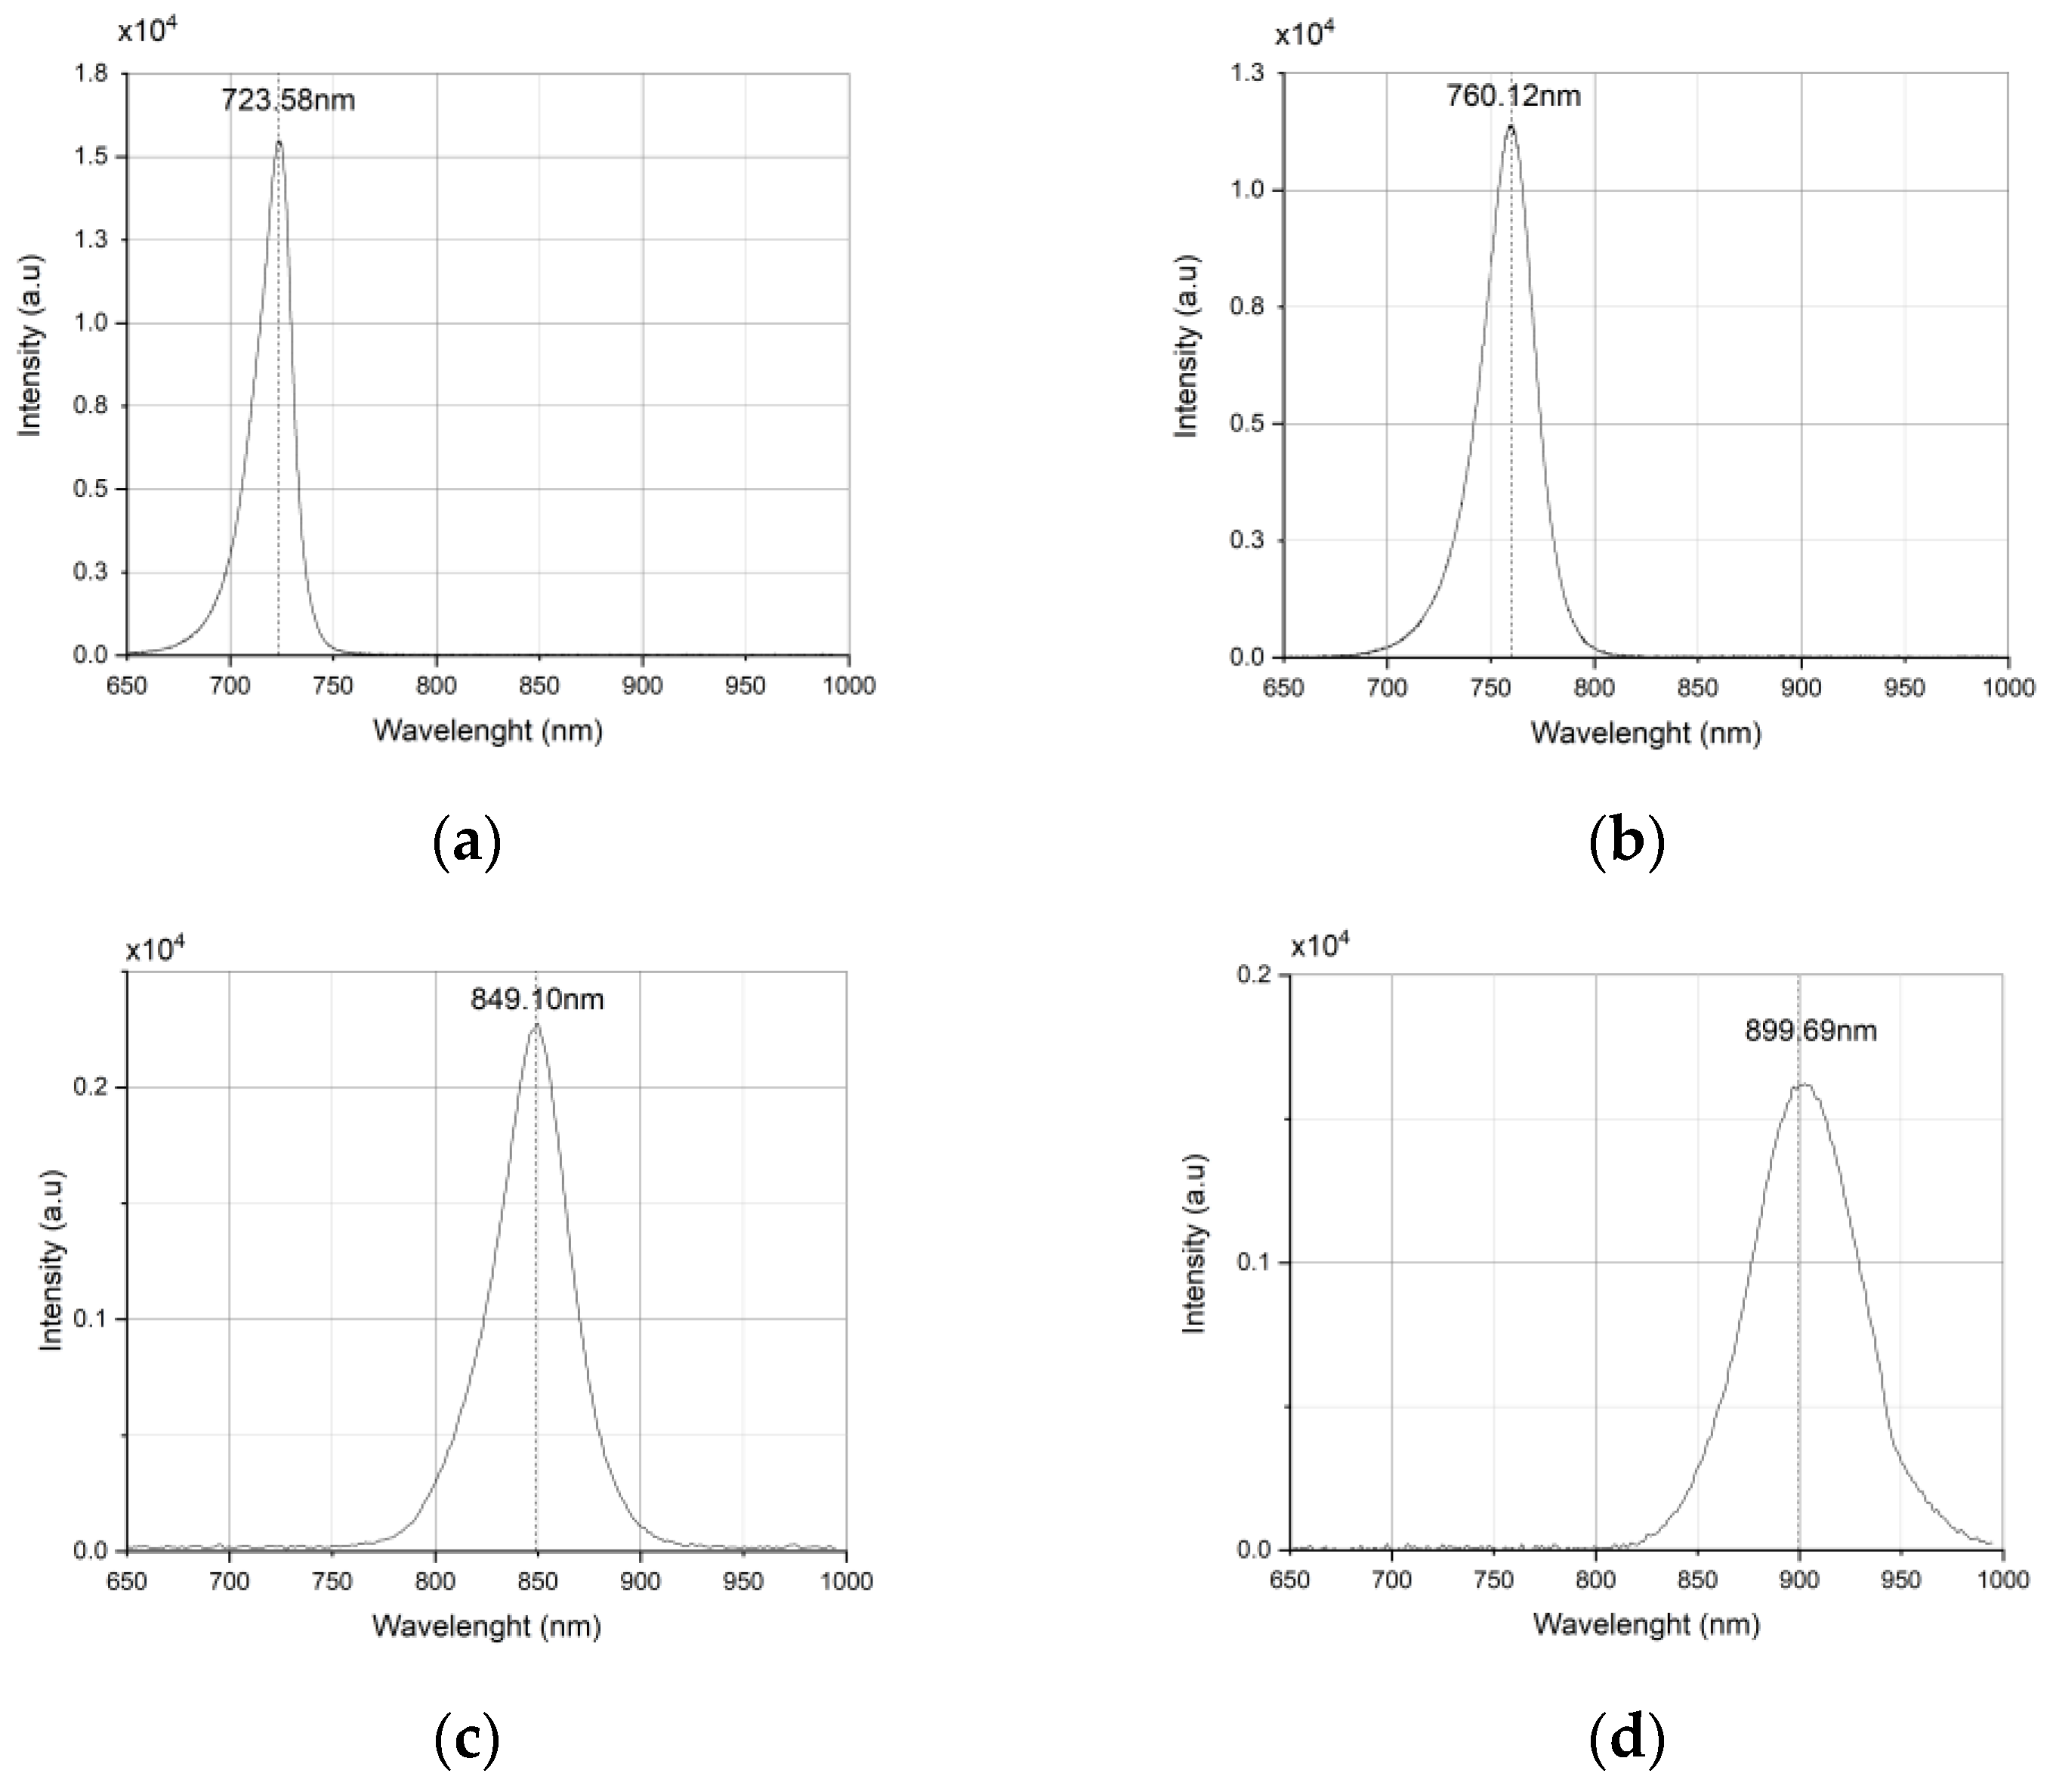
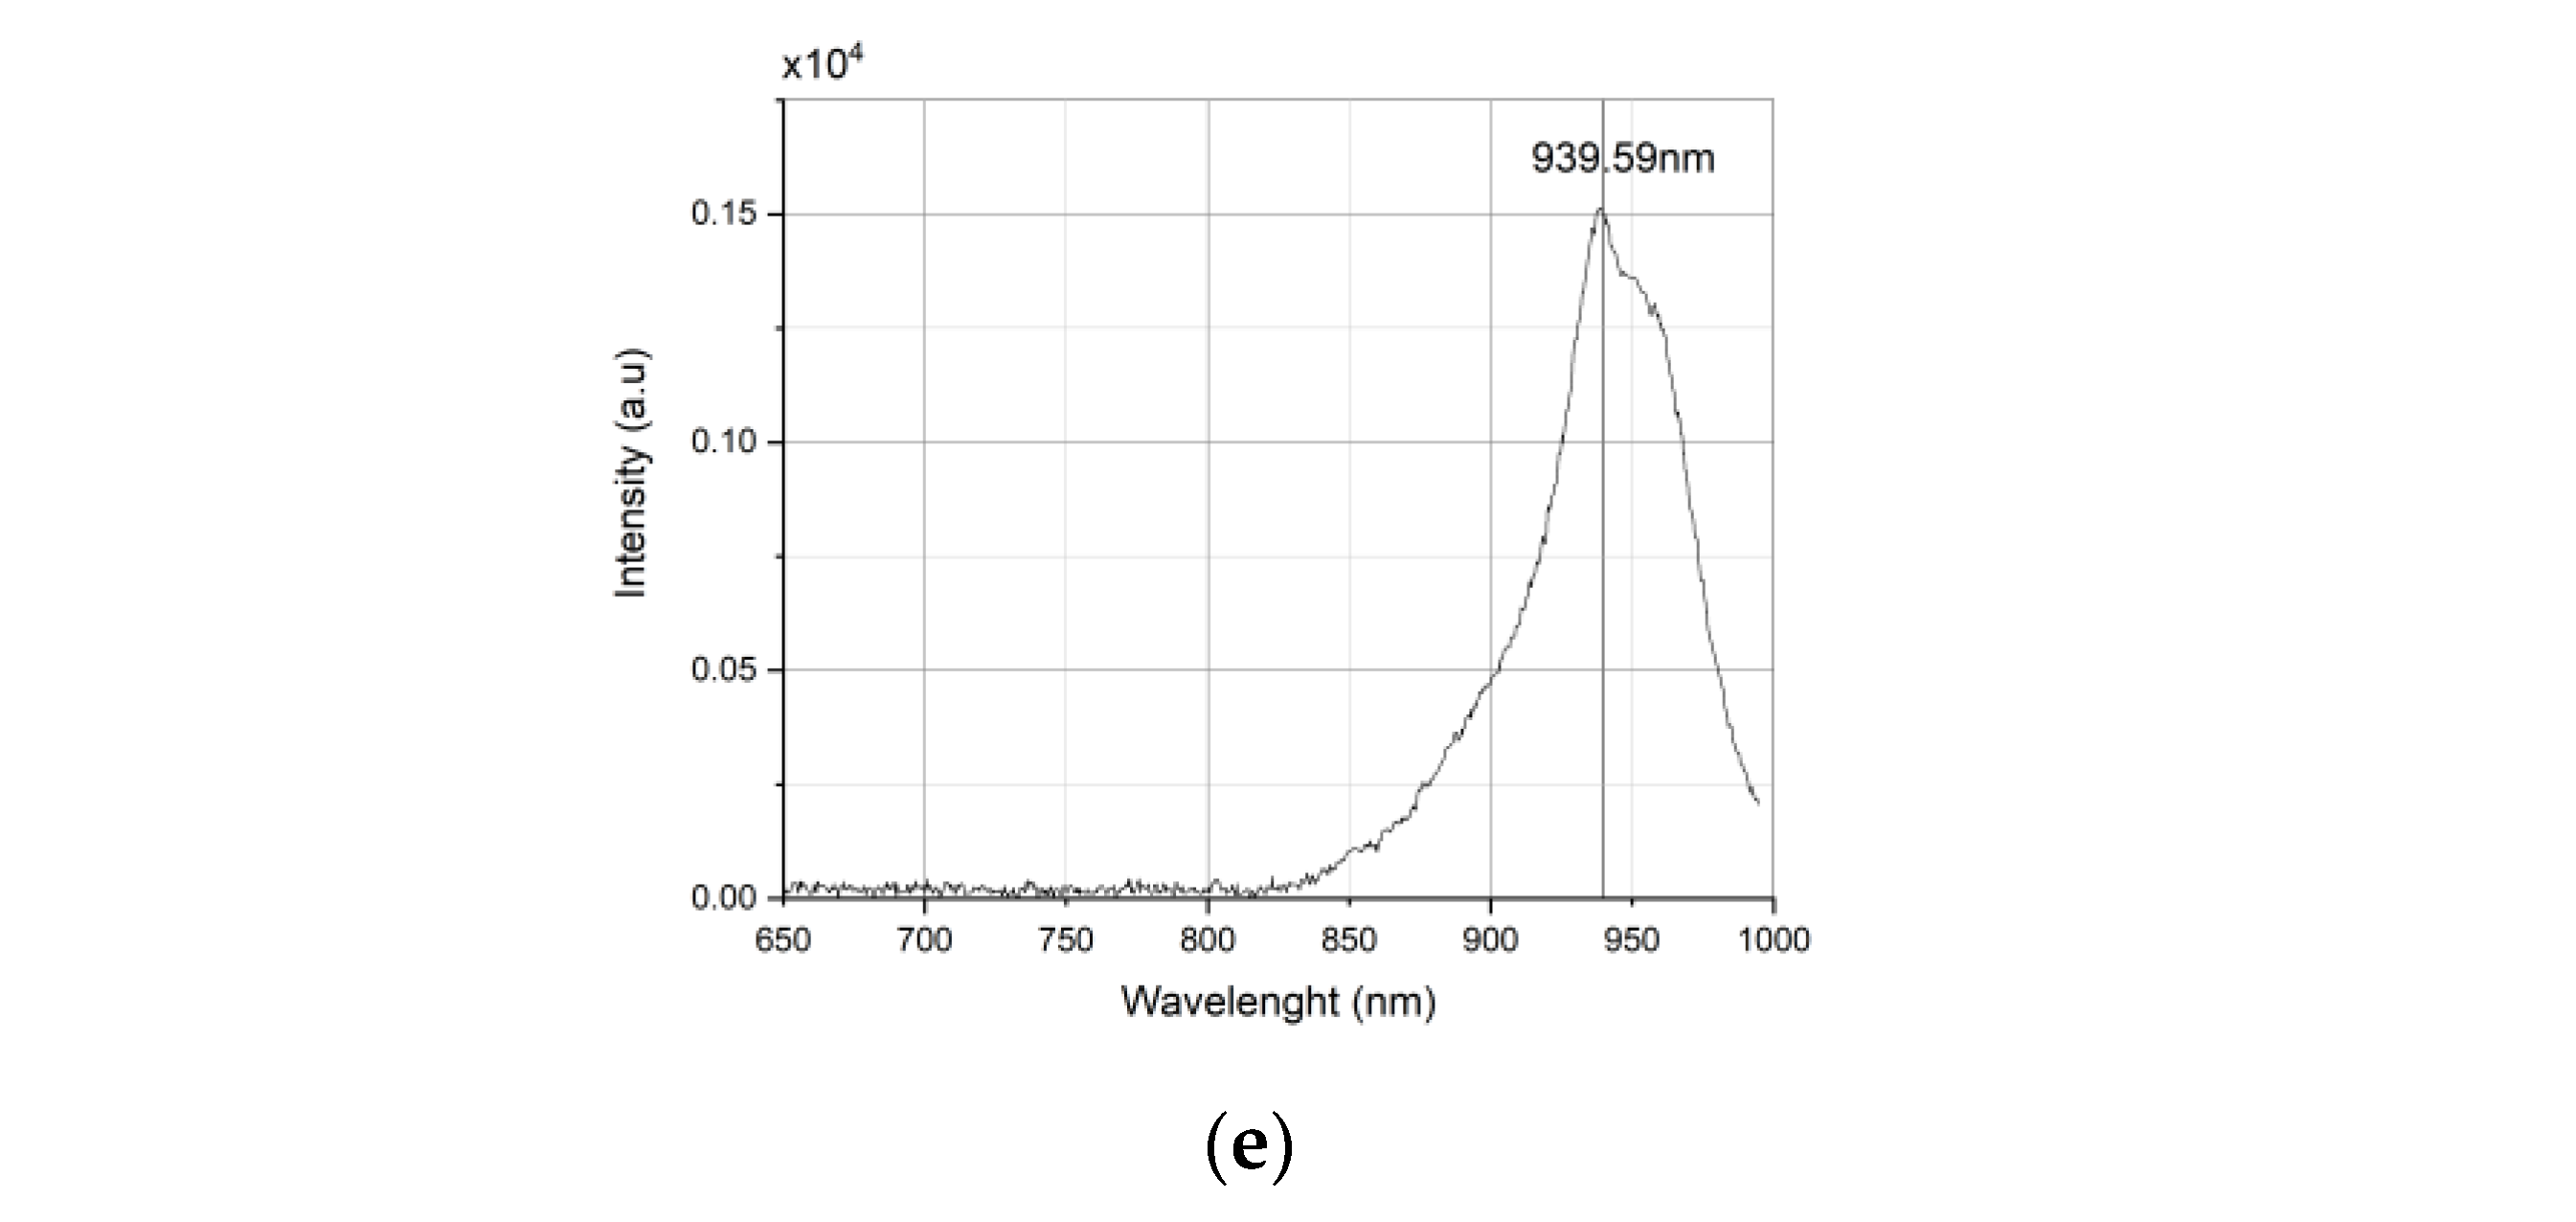
2.1.1. LED Wavelength
2.1.2. Luminosity
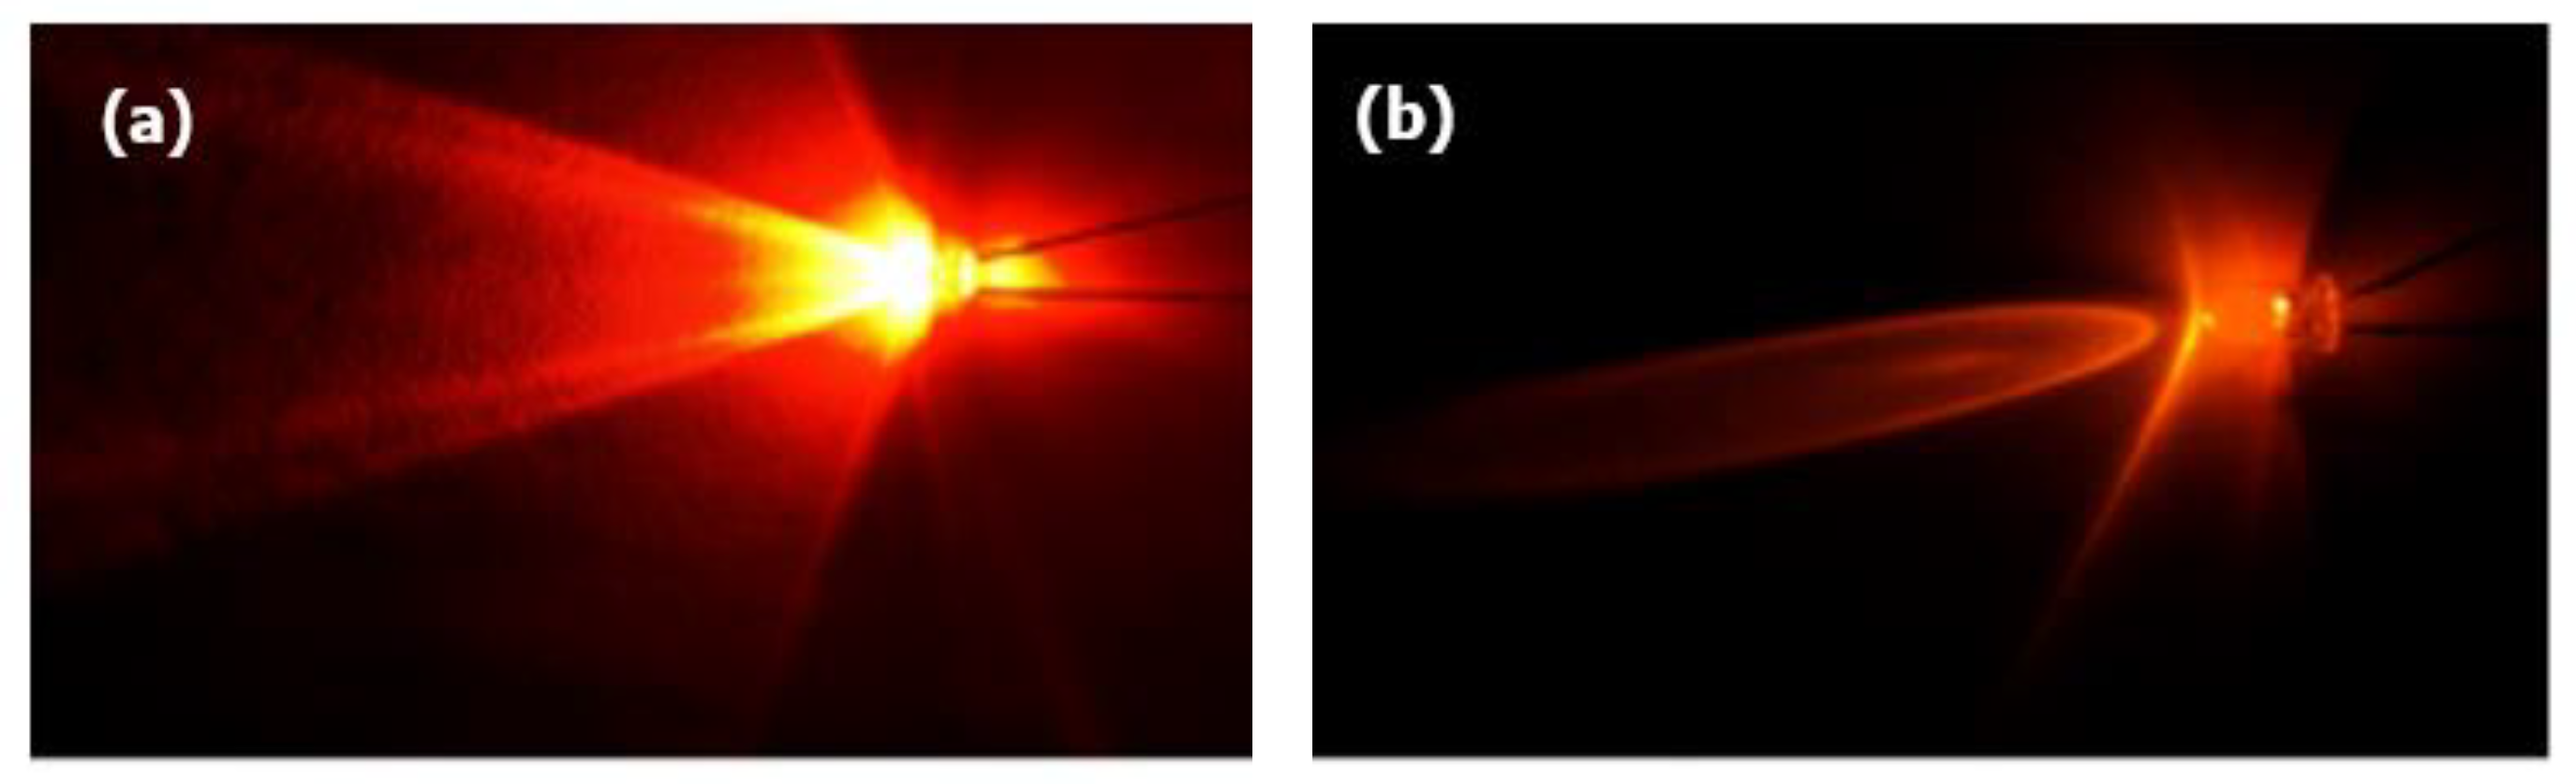
2.1.3. Angle
2.2. Vein Image Acquisition
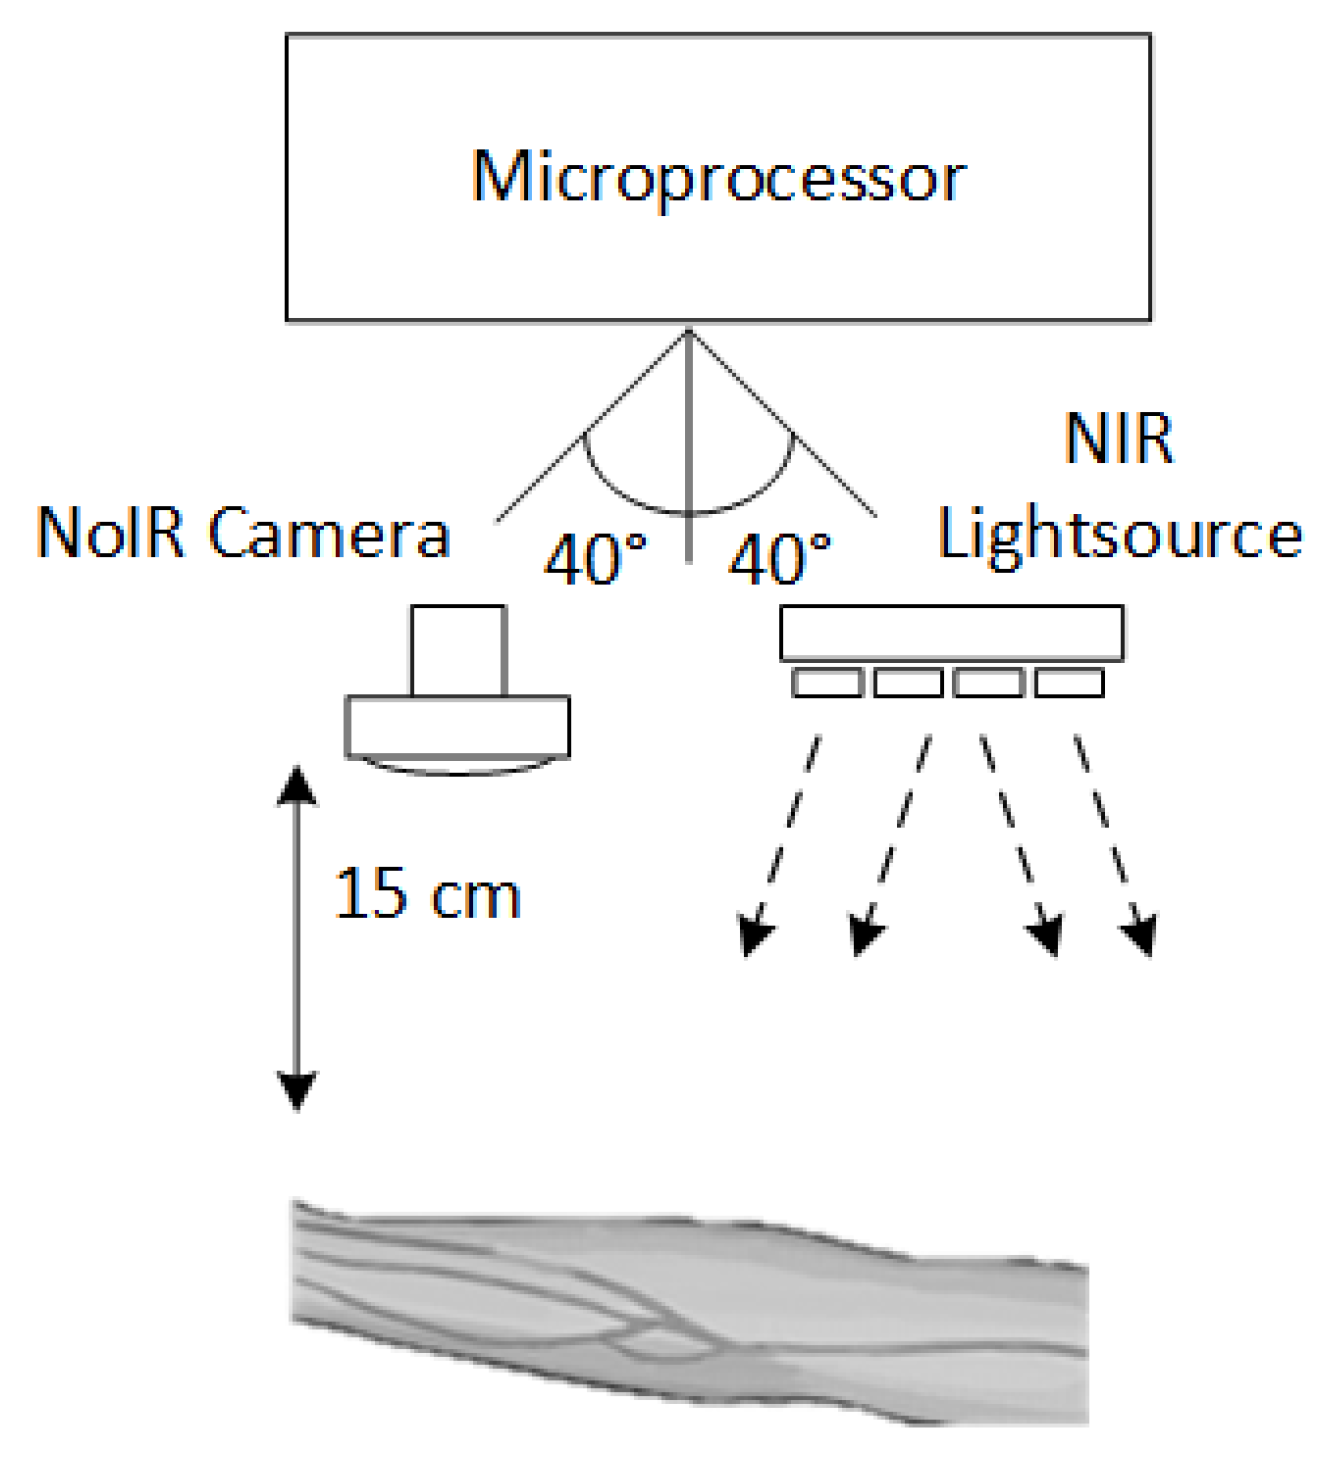
2.2.1. Experiment Setup
2.2.2. Design Parameters
- Method: Hessian (H), Contrast (C)
- Region of Interest (ROI): Palm (P), Arm (A)
- Wavelength: 720 nm (72), 760 nm (76), 850 nm (85), 900 nm (90), 940 nm (94)
- LEDs Arrangement: Square LED (M), Ring LED (R)
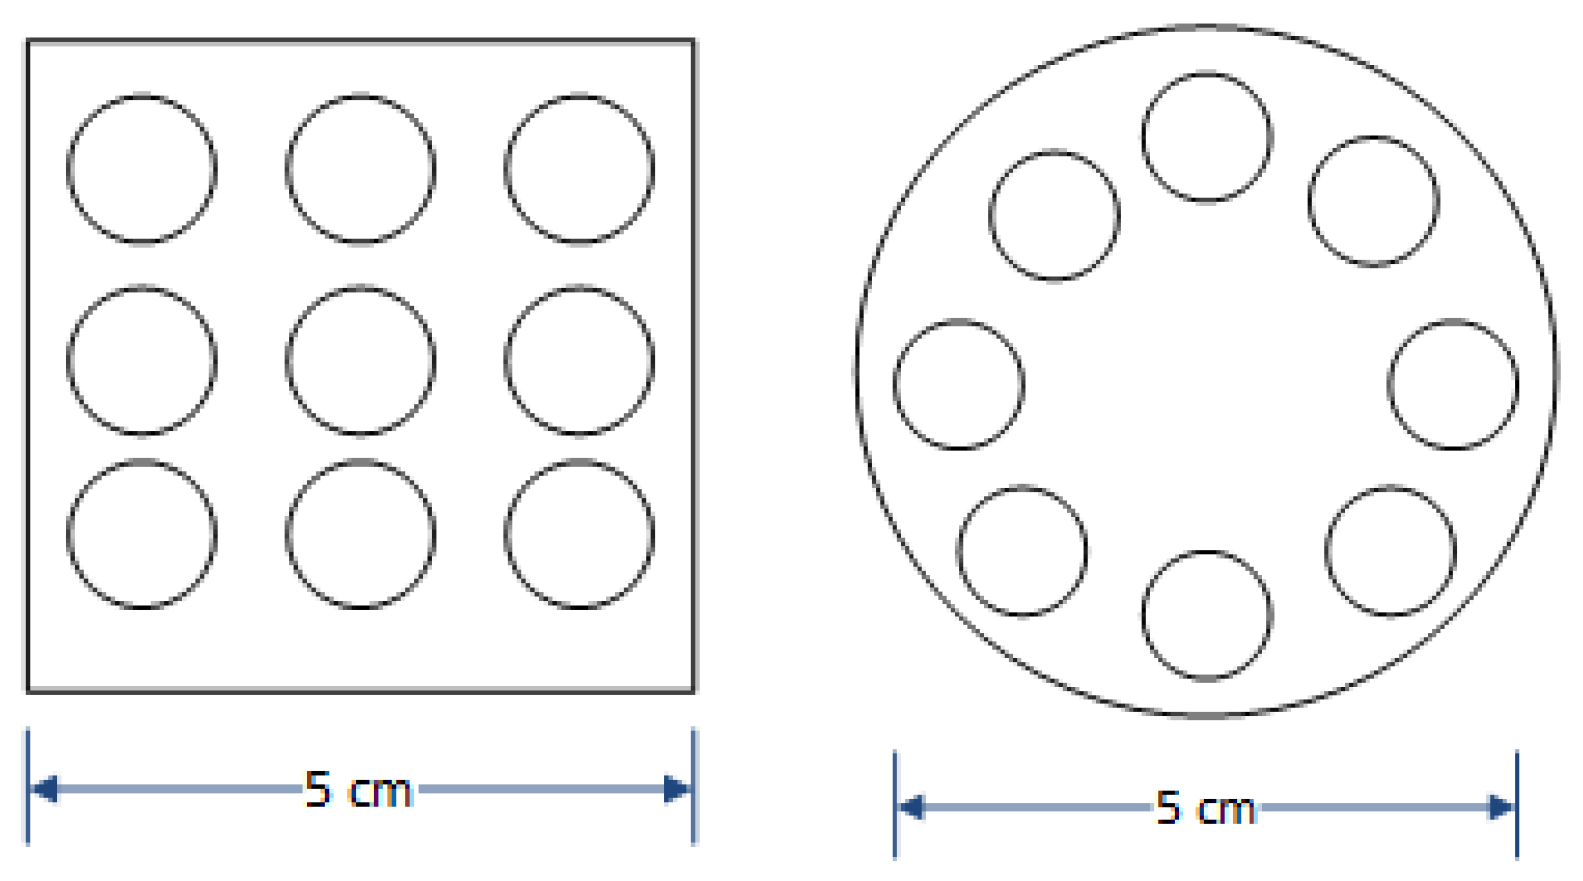
- Square LED Arrangement: 3 × 3, 4 × 4, 5 × 5, 6 × 6
- Number of LEDs: 8, 9, 16, 25, 36
- The inclusion of diffuser: Without diffuser (WO), With diffuser (W)
2.3. Vein Image Processing and Morphological Process Enhancement
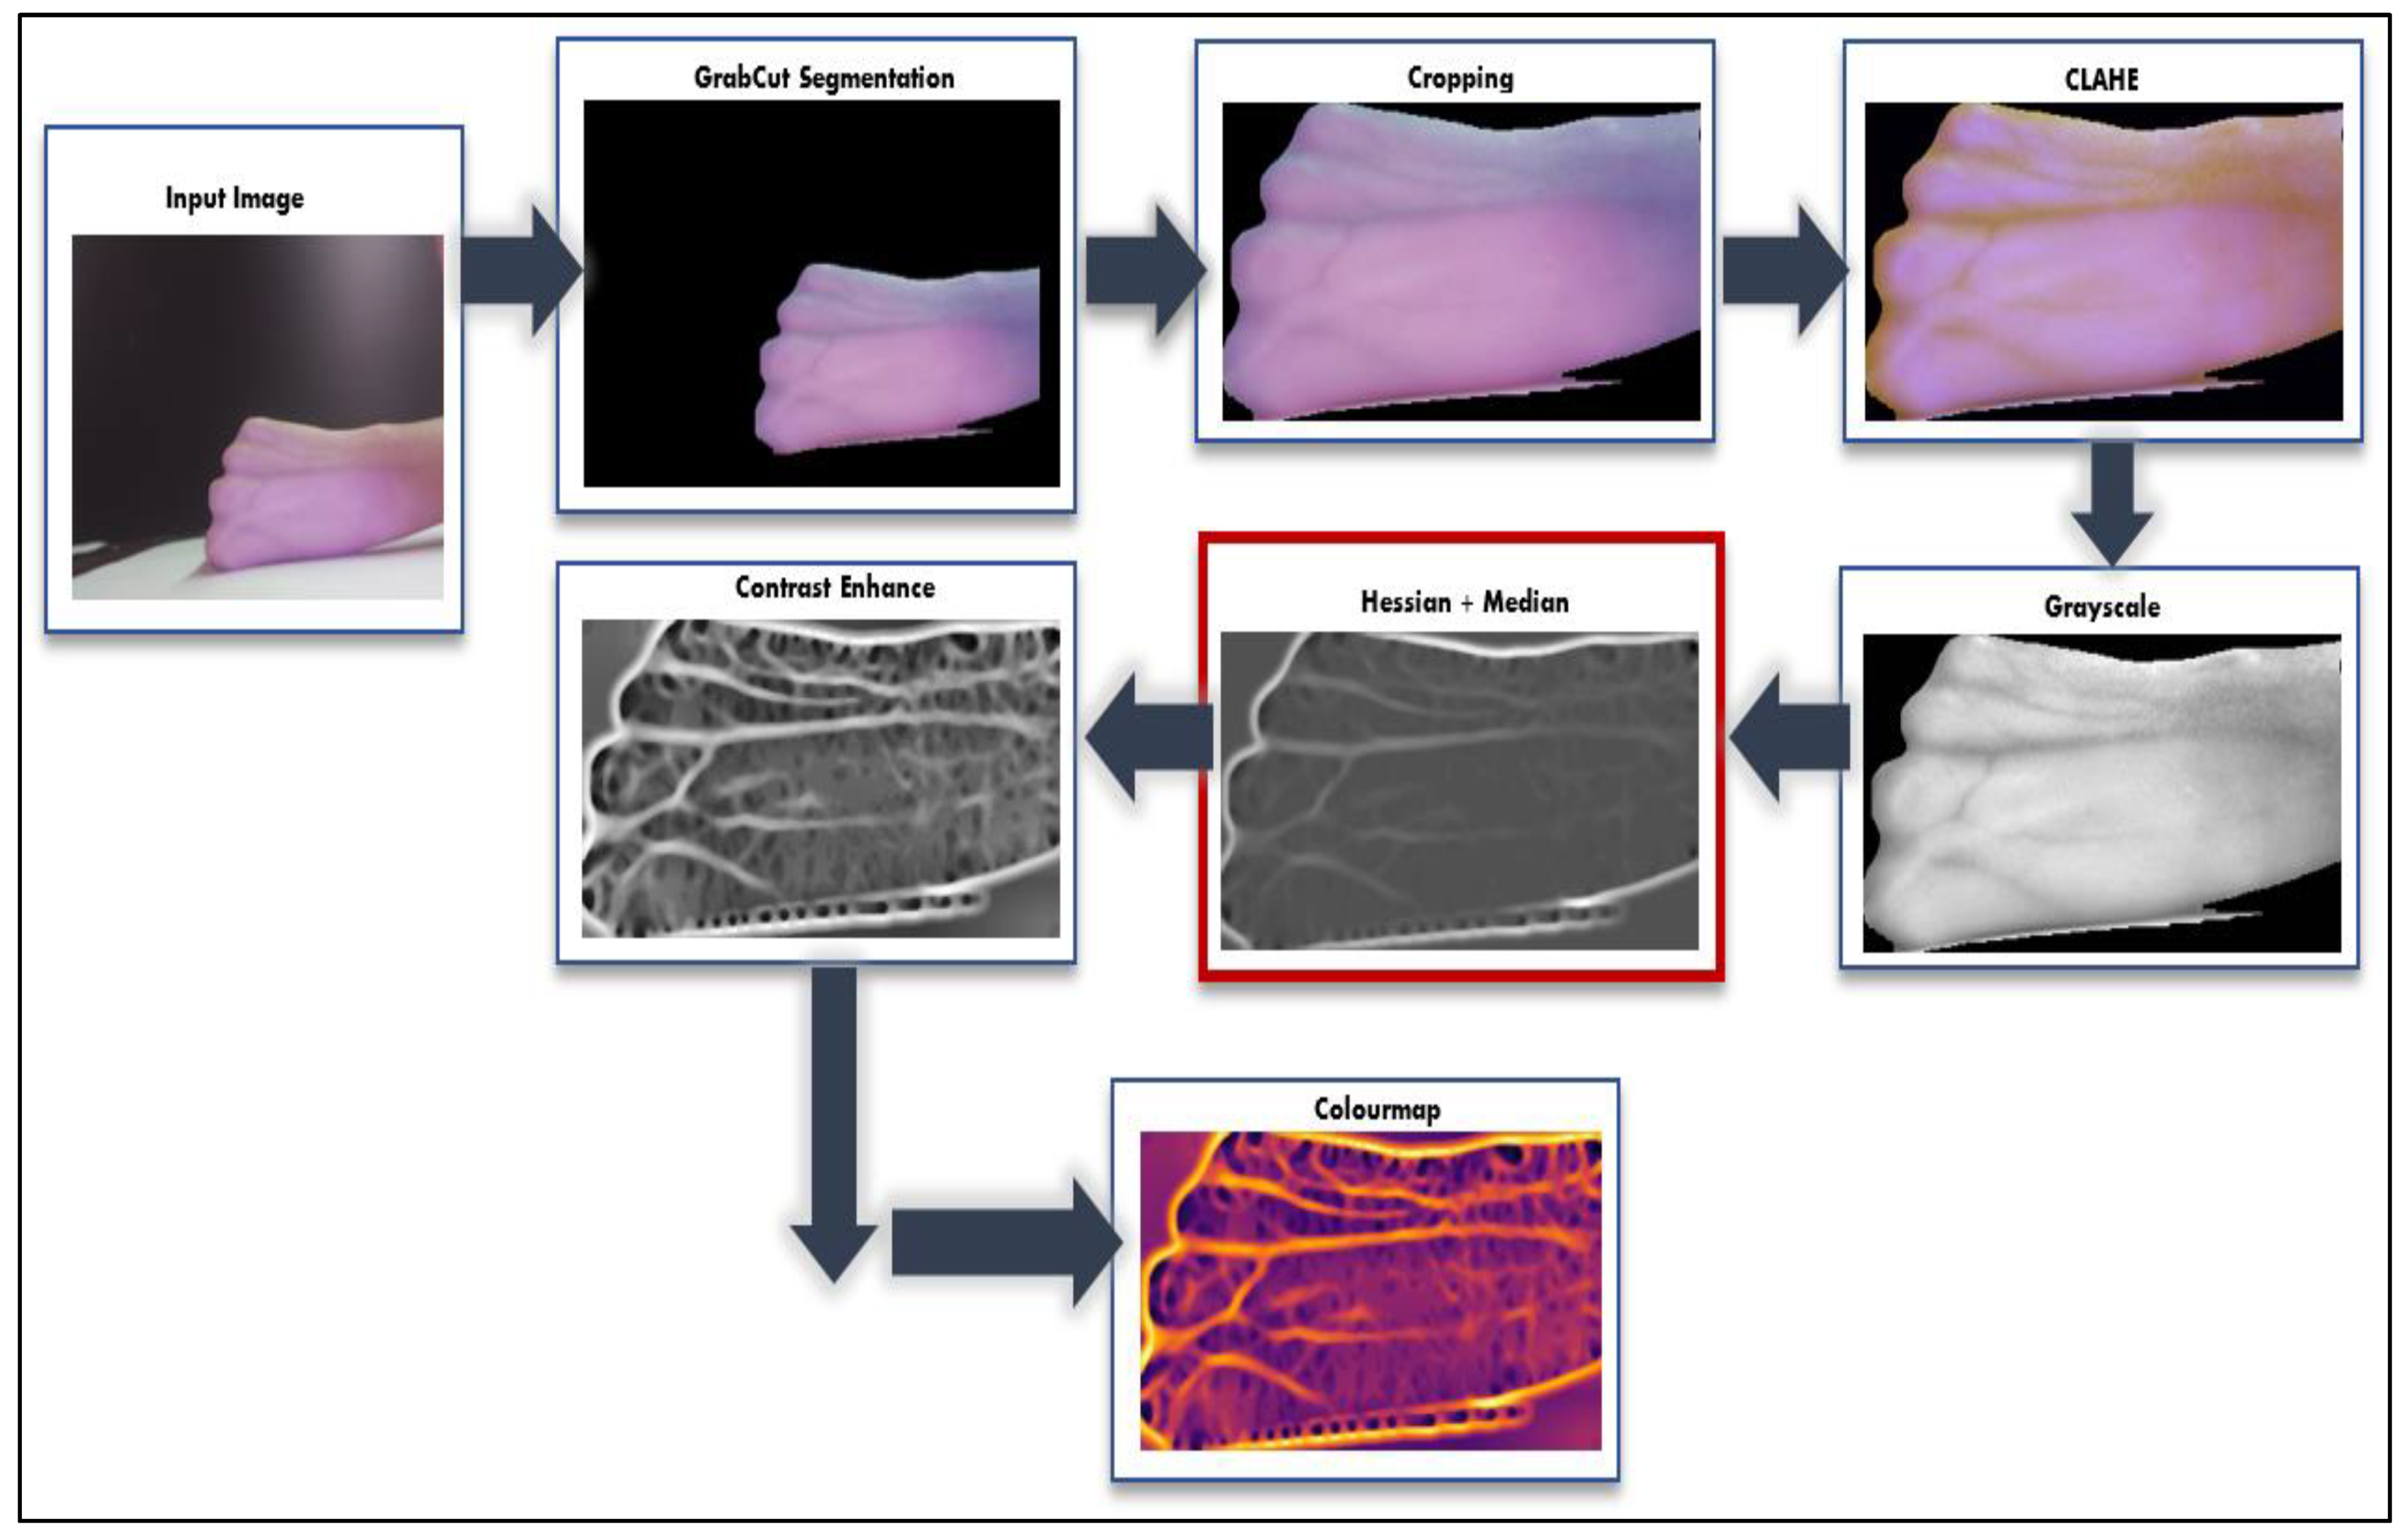
2.3.1. GrabCut Segmentation for ROI and Cropping
2.3.2. CLAHE
| Algorithm 1 CLAHE | |
| IN: | Image X of size |
| OUT: | Contrast-enhanced image Y of the same size of image X |
| 1 2 3 4 5 6 7 8 9 10 11 | Segment the image into a number of non-overlapping tiles where each region is of size (OpenCV default) Compute the histogram of each segmented tiles Let Let FOR each segmented tile Let S = sum of histogram bins of the excess in that bin over middle WHILE IF ELSE |
2.3.3. Grayscale Conversion
2.3.4. Hessian and Median Filter
| Algorithm 2 Hessian Matrix | |
| IN: | Grayscale image X of size |
| OUT: | Hessian-applied grayscale image Y of the same size of Image X |
| 1 2 3 4 5 6 | Convolve the image using Gaussian Kernel in the order of and FOR every pixel in the image Compute the covariance matrix Calculate the local maxima and minima of the image using the eigenvalues from the covariance matrix: Local Maxima = (Hxx + Hyy)/2 + sqrt (4 ∗ Hxy ∗∗ 2 + (Hxx − Hyy) ∗∗ 2)/2 Local Minima = (Hxx + Hyy)/2 − sqrt (4 ∗ Hxy ∗∗ 2 + (Hxx − Hyy) ∗∗ 2)/2 |
2.3.5. Contrast Enhance
2.3.6. Colormap
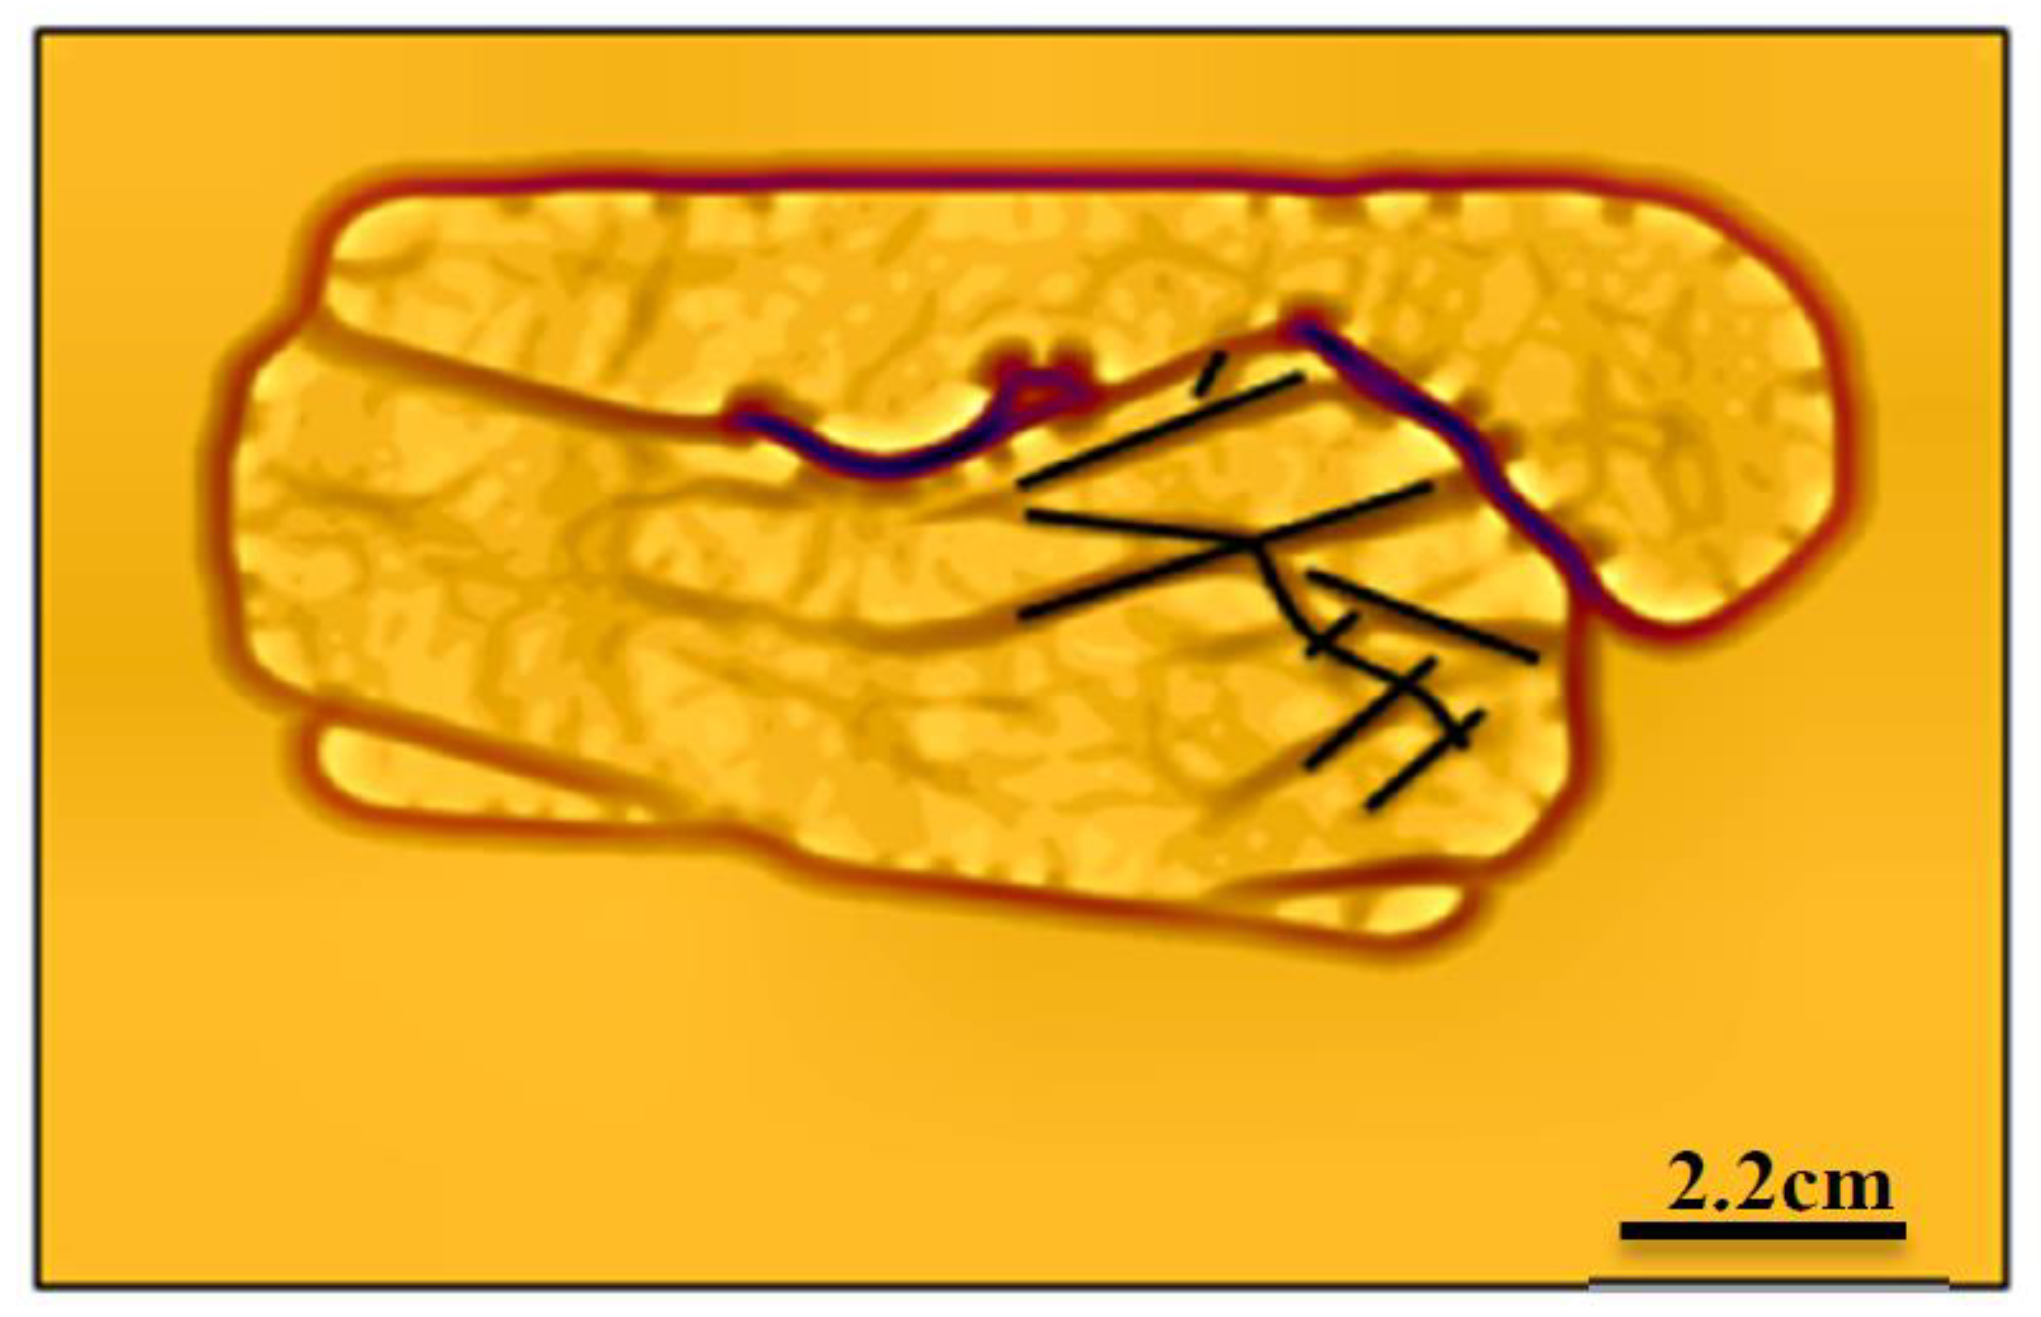
2.4. Data Evaluation: Vein Counting
3. Results and Discussion
- Evaluation analysis of near-infrared LEDs wavelength and arrangement.
- Evaluation analysis of selected wavelength with diffuser in a square LED arrangement.
- Evaluation analysis of square LED arrangement for vein visualization.
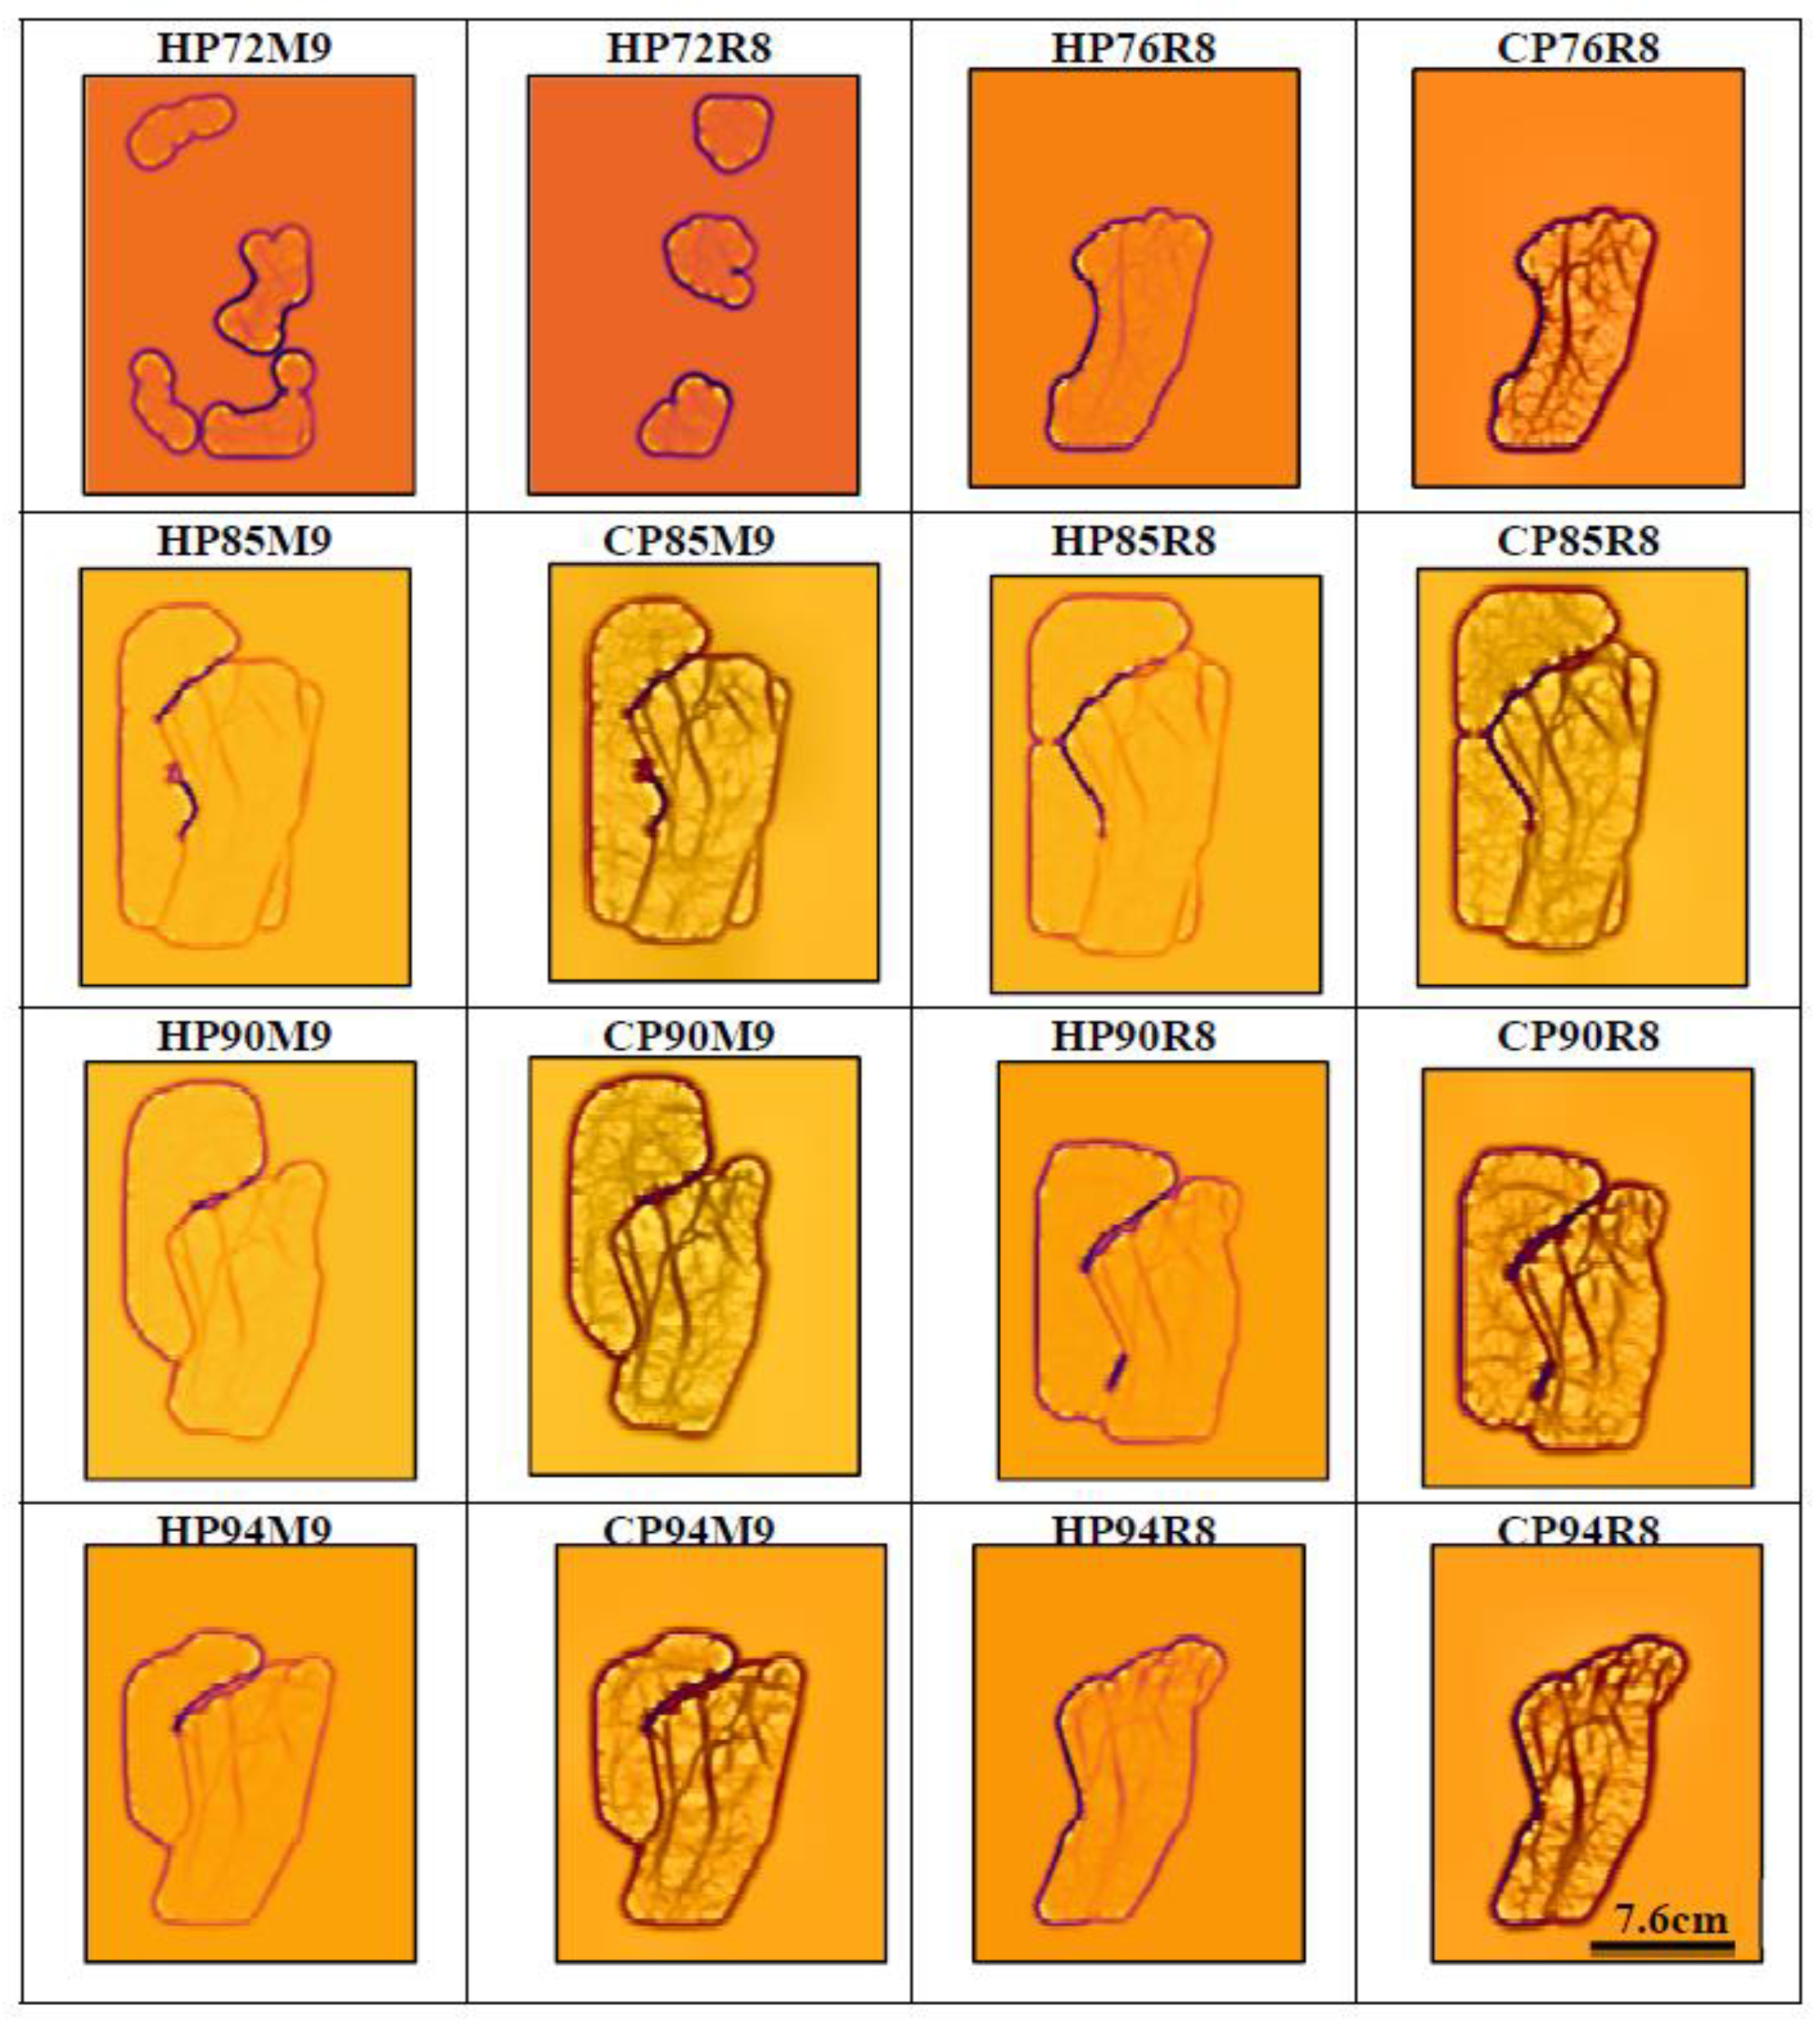
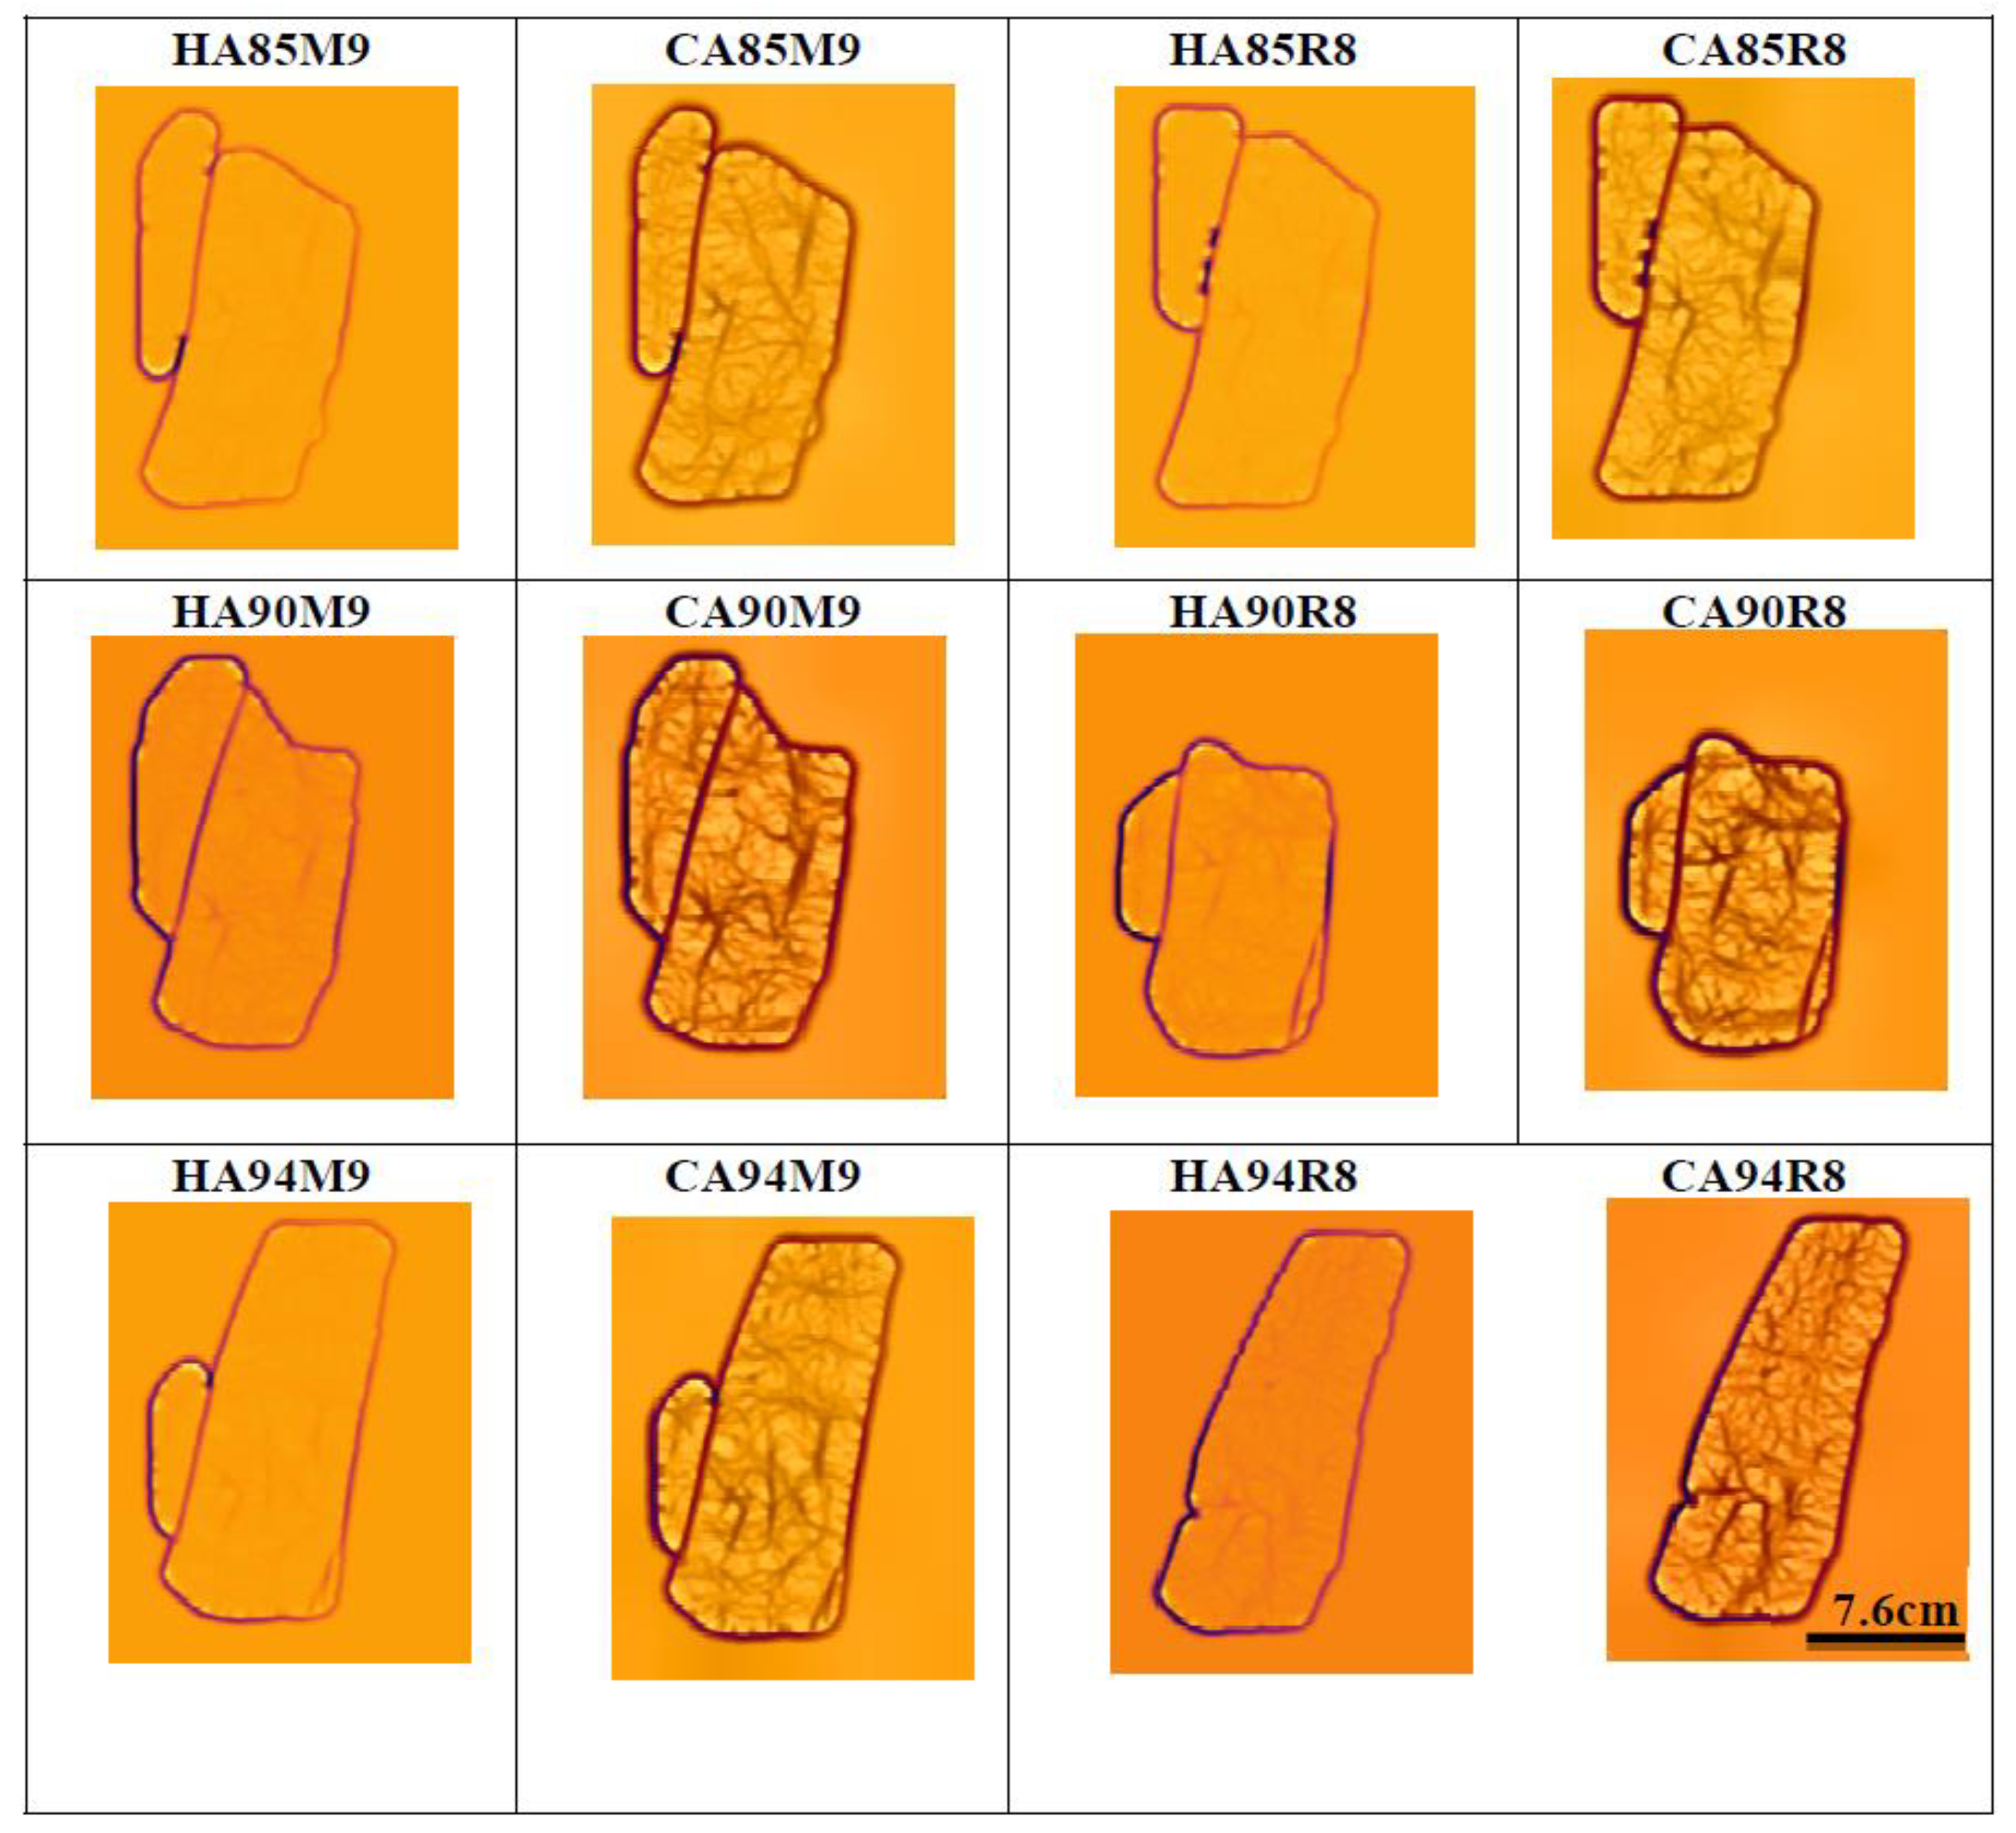
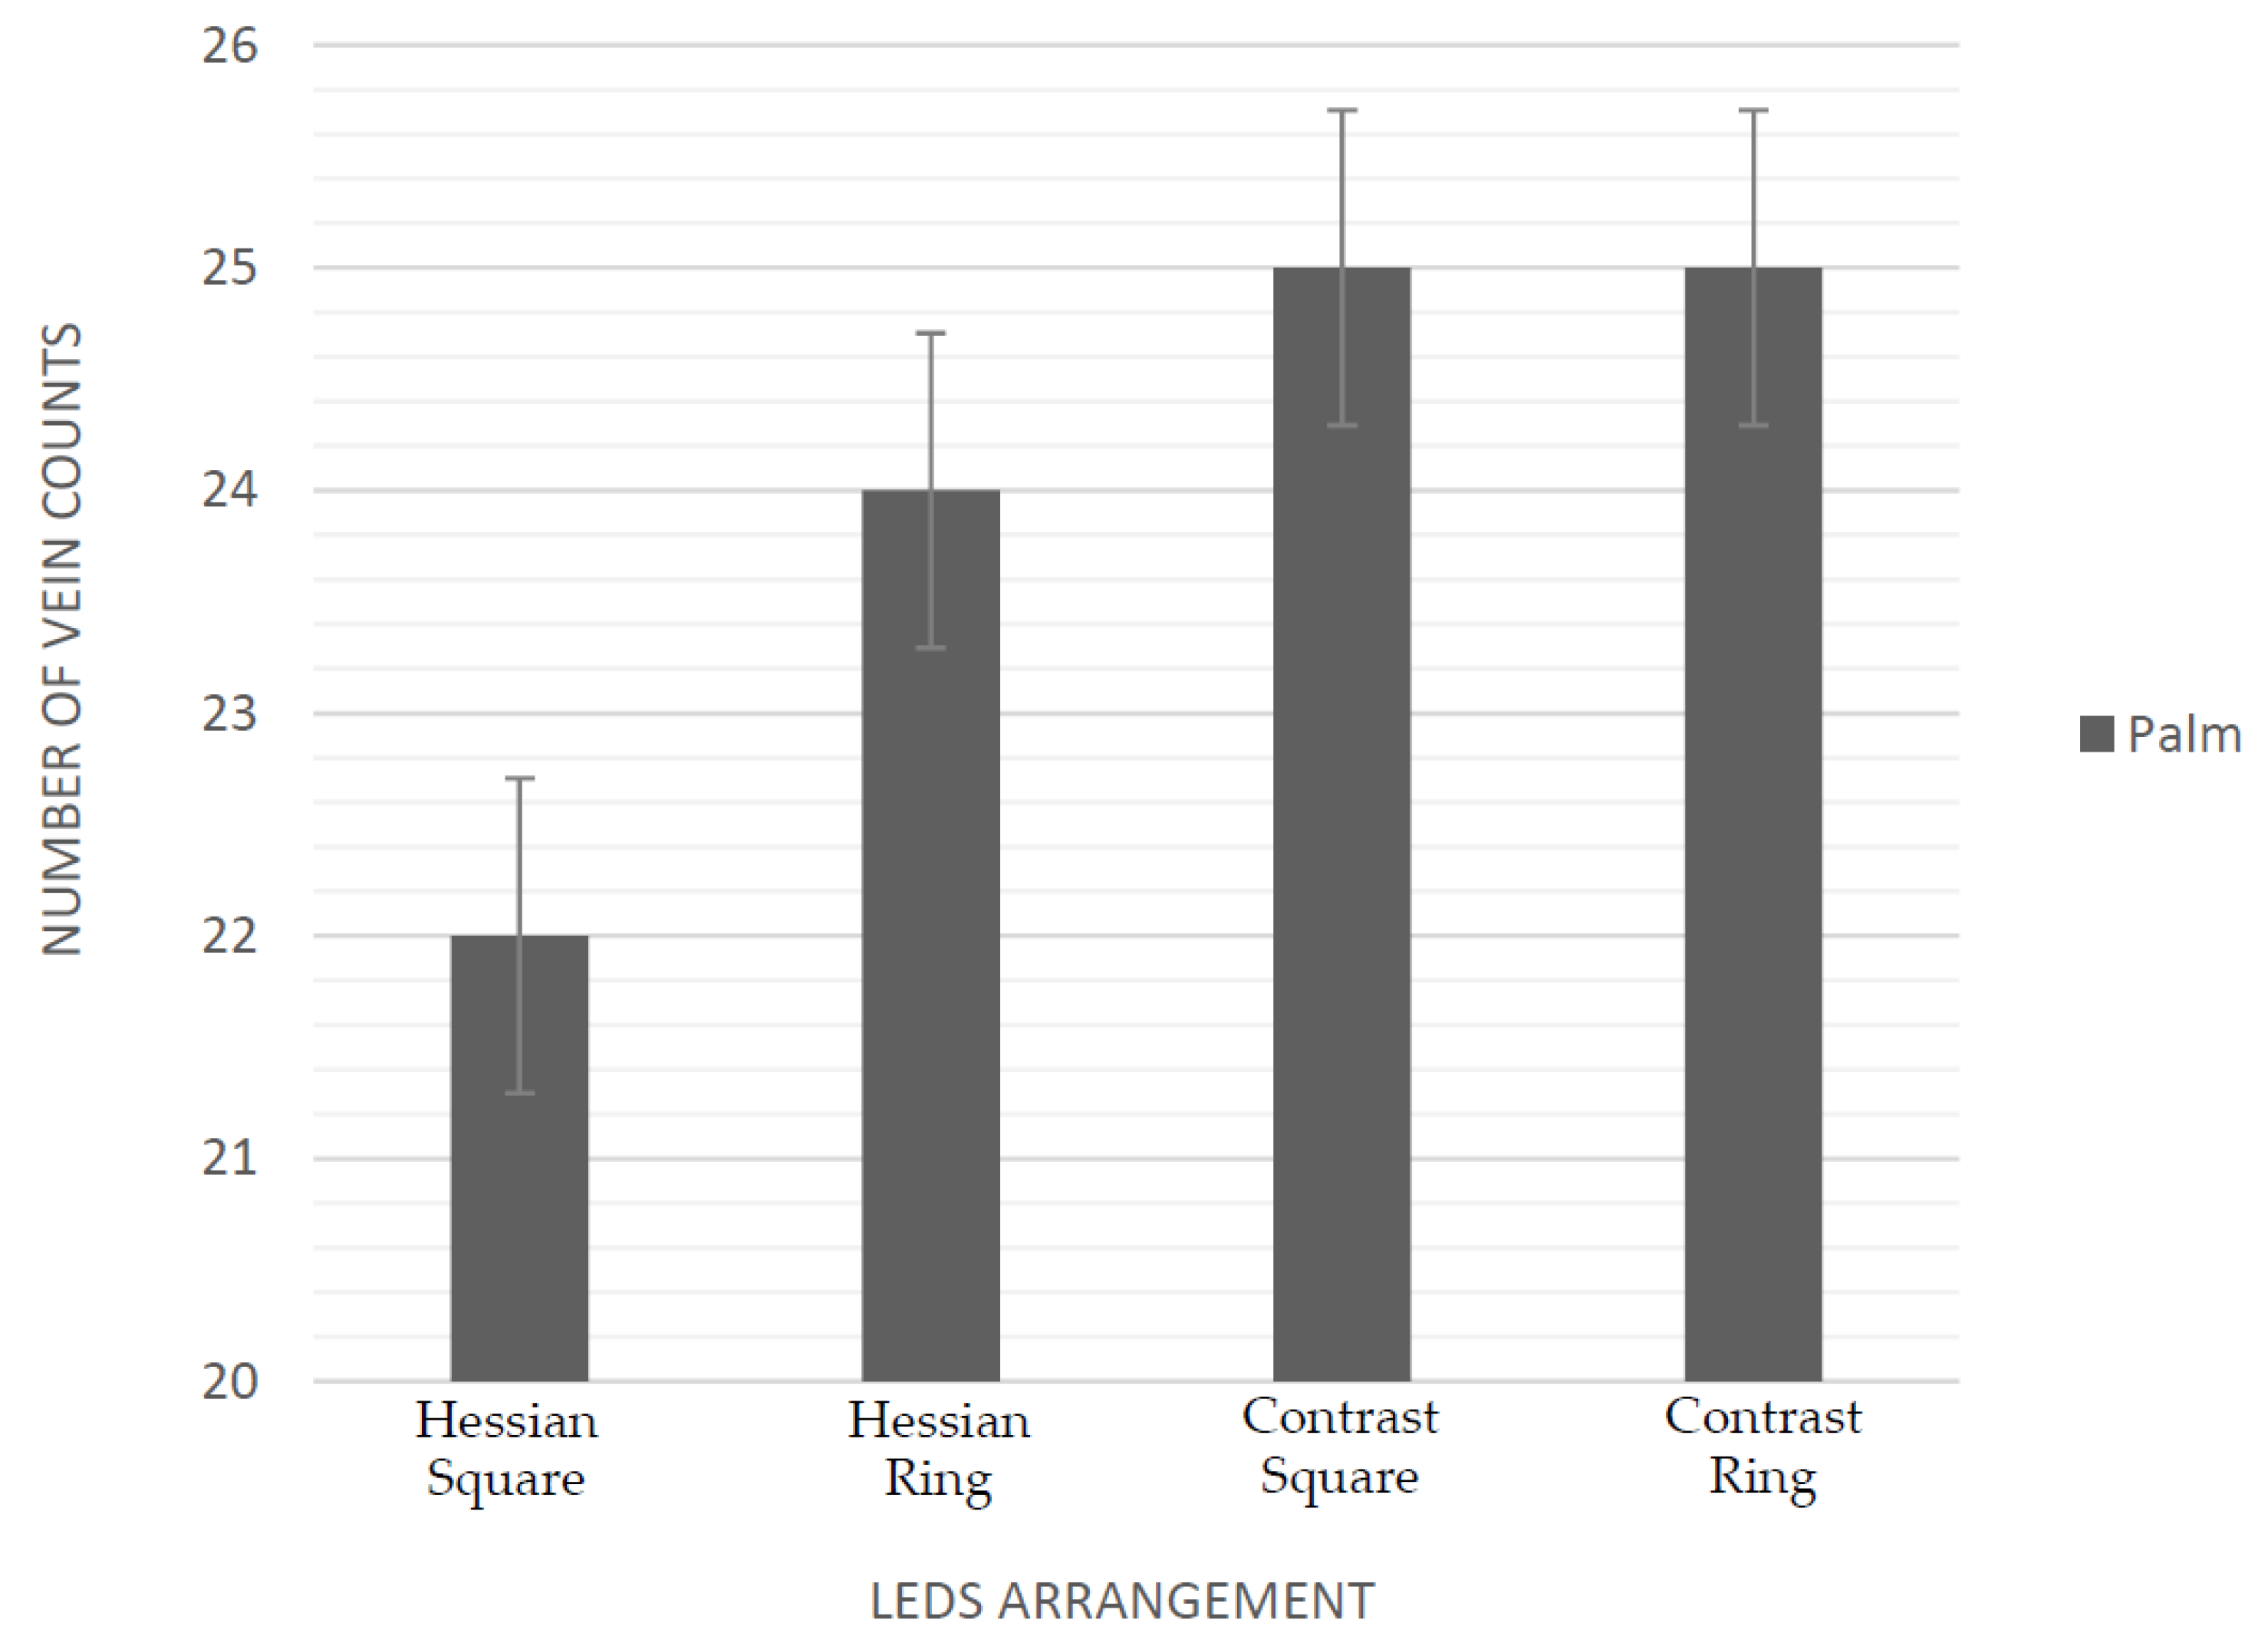
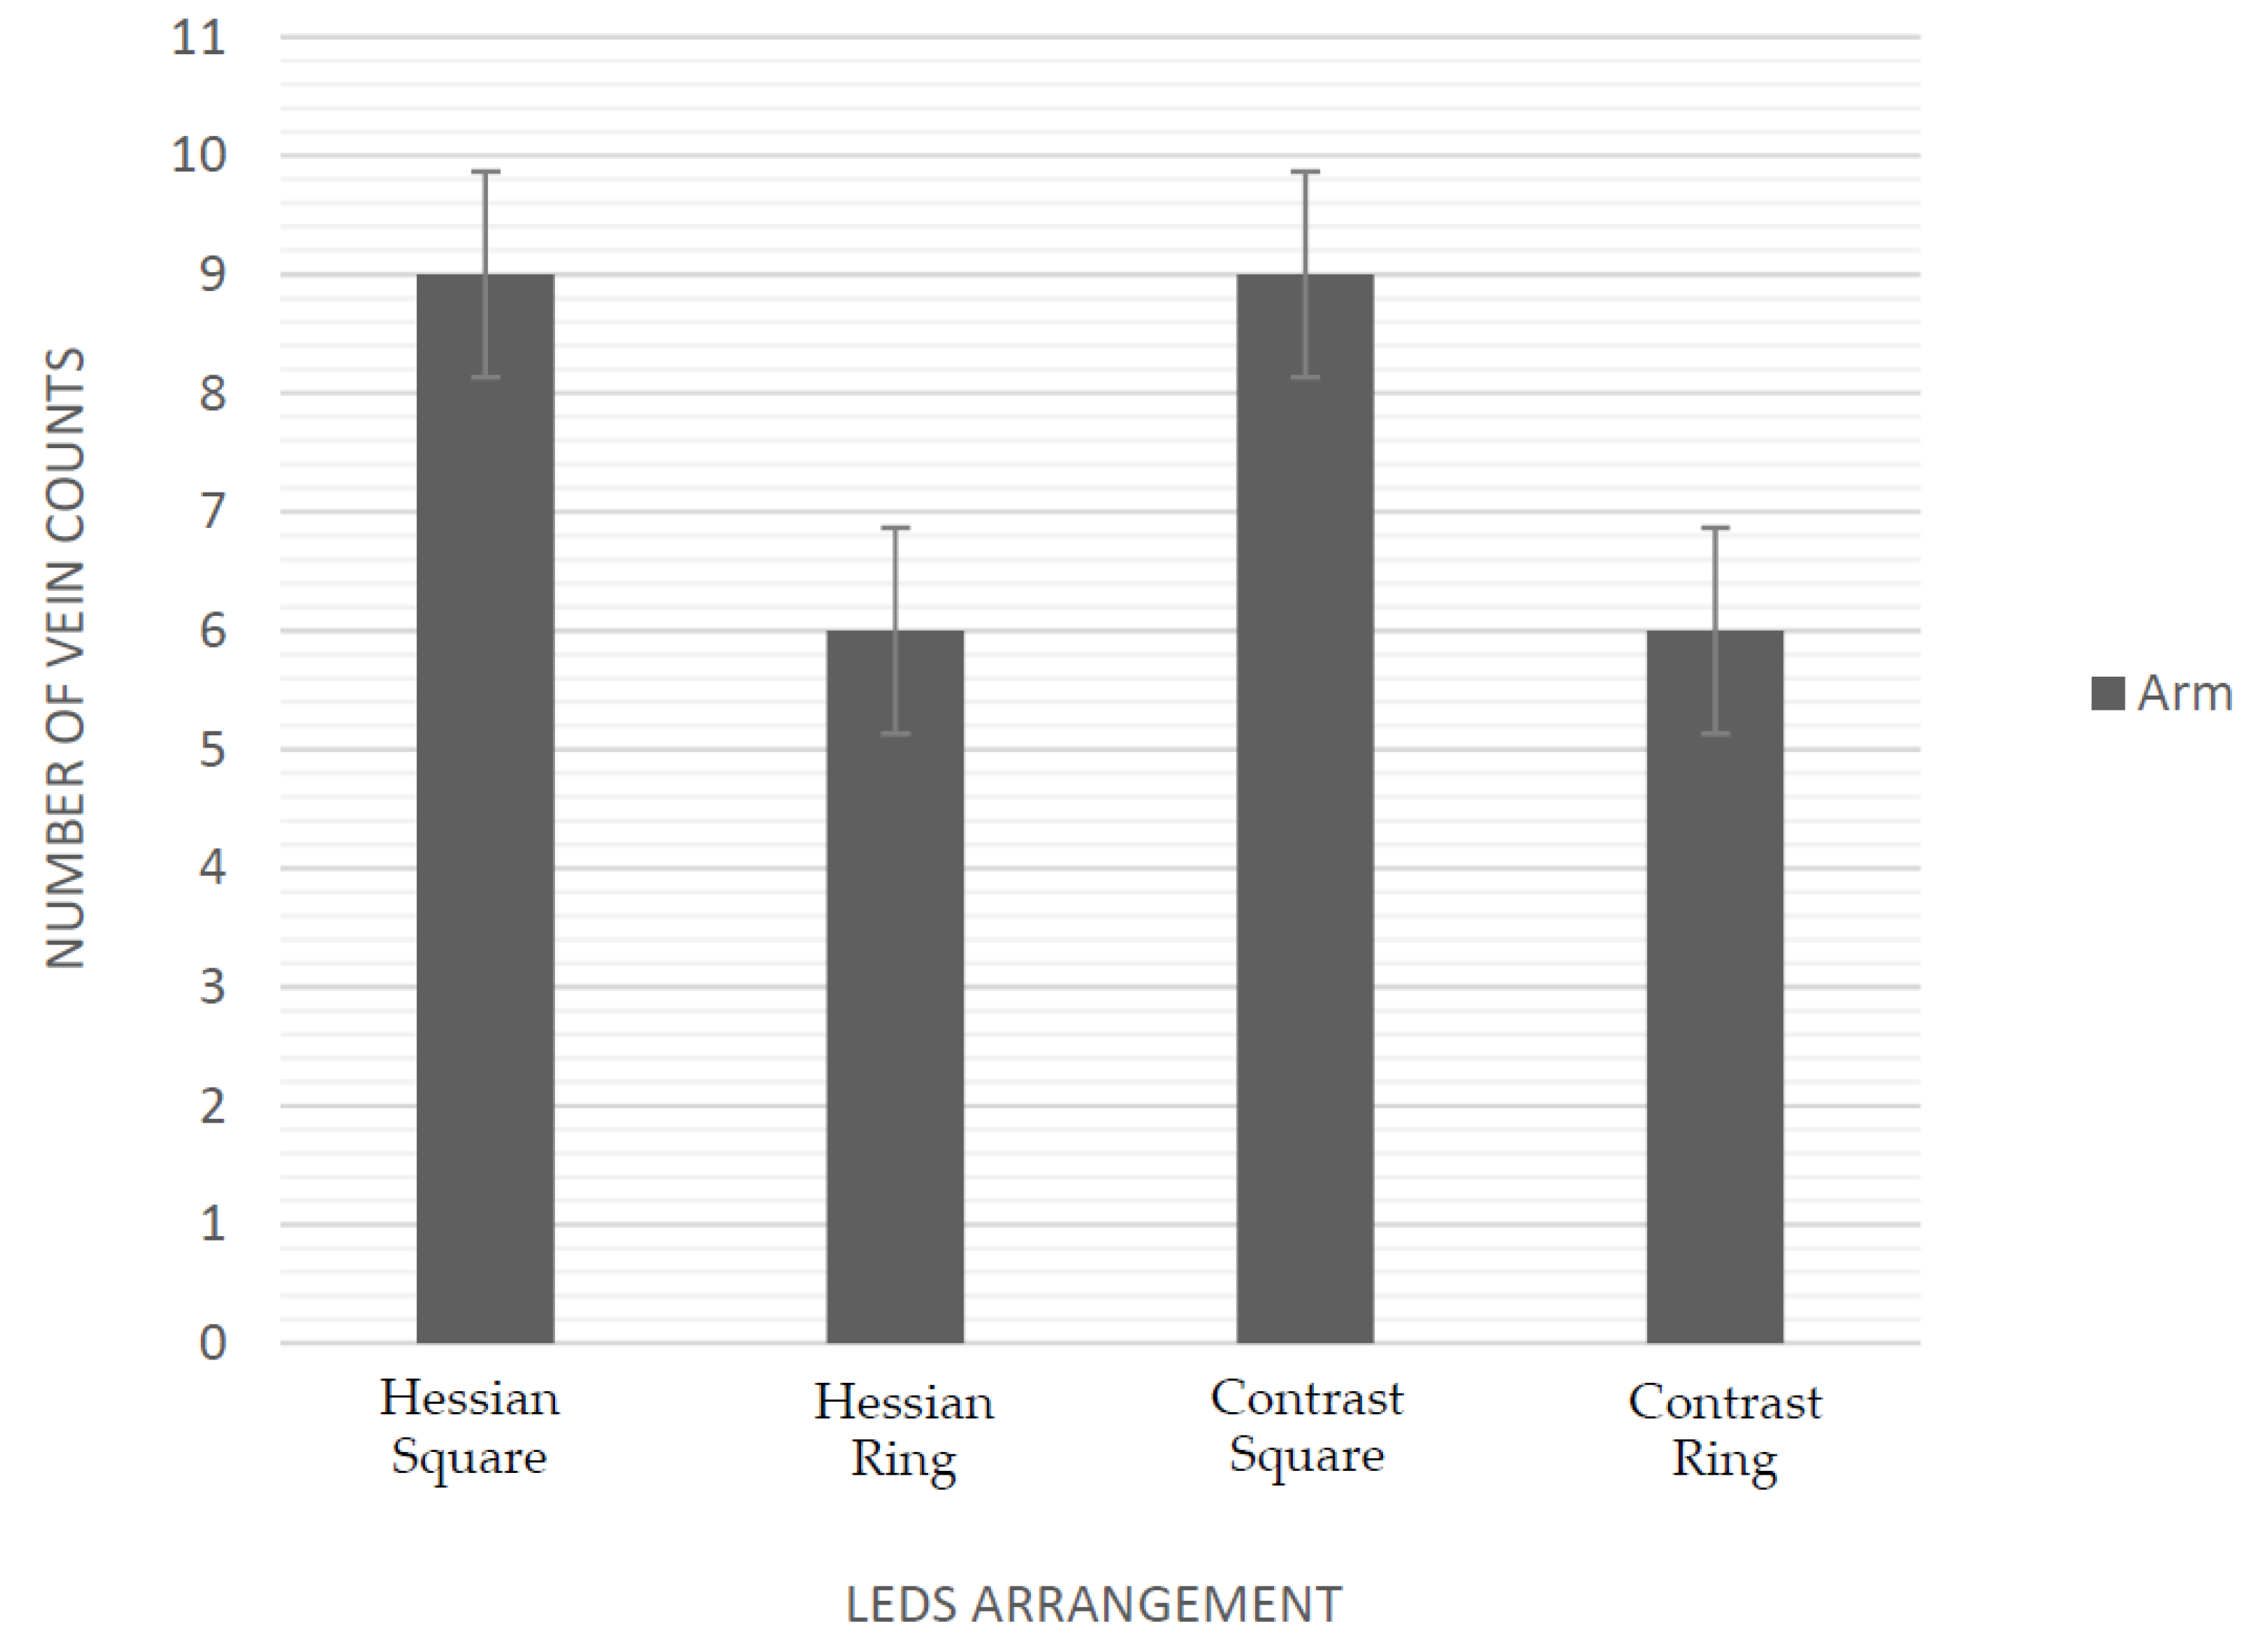
3.1. Evaluation of Near Infrared LEDs Wavelength and Arrangement
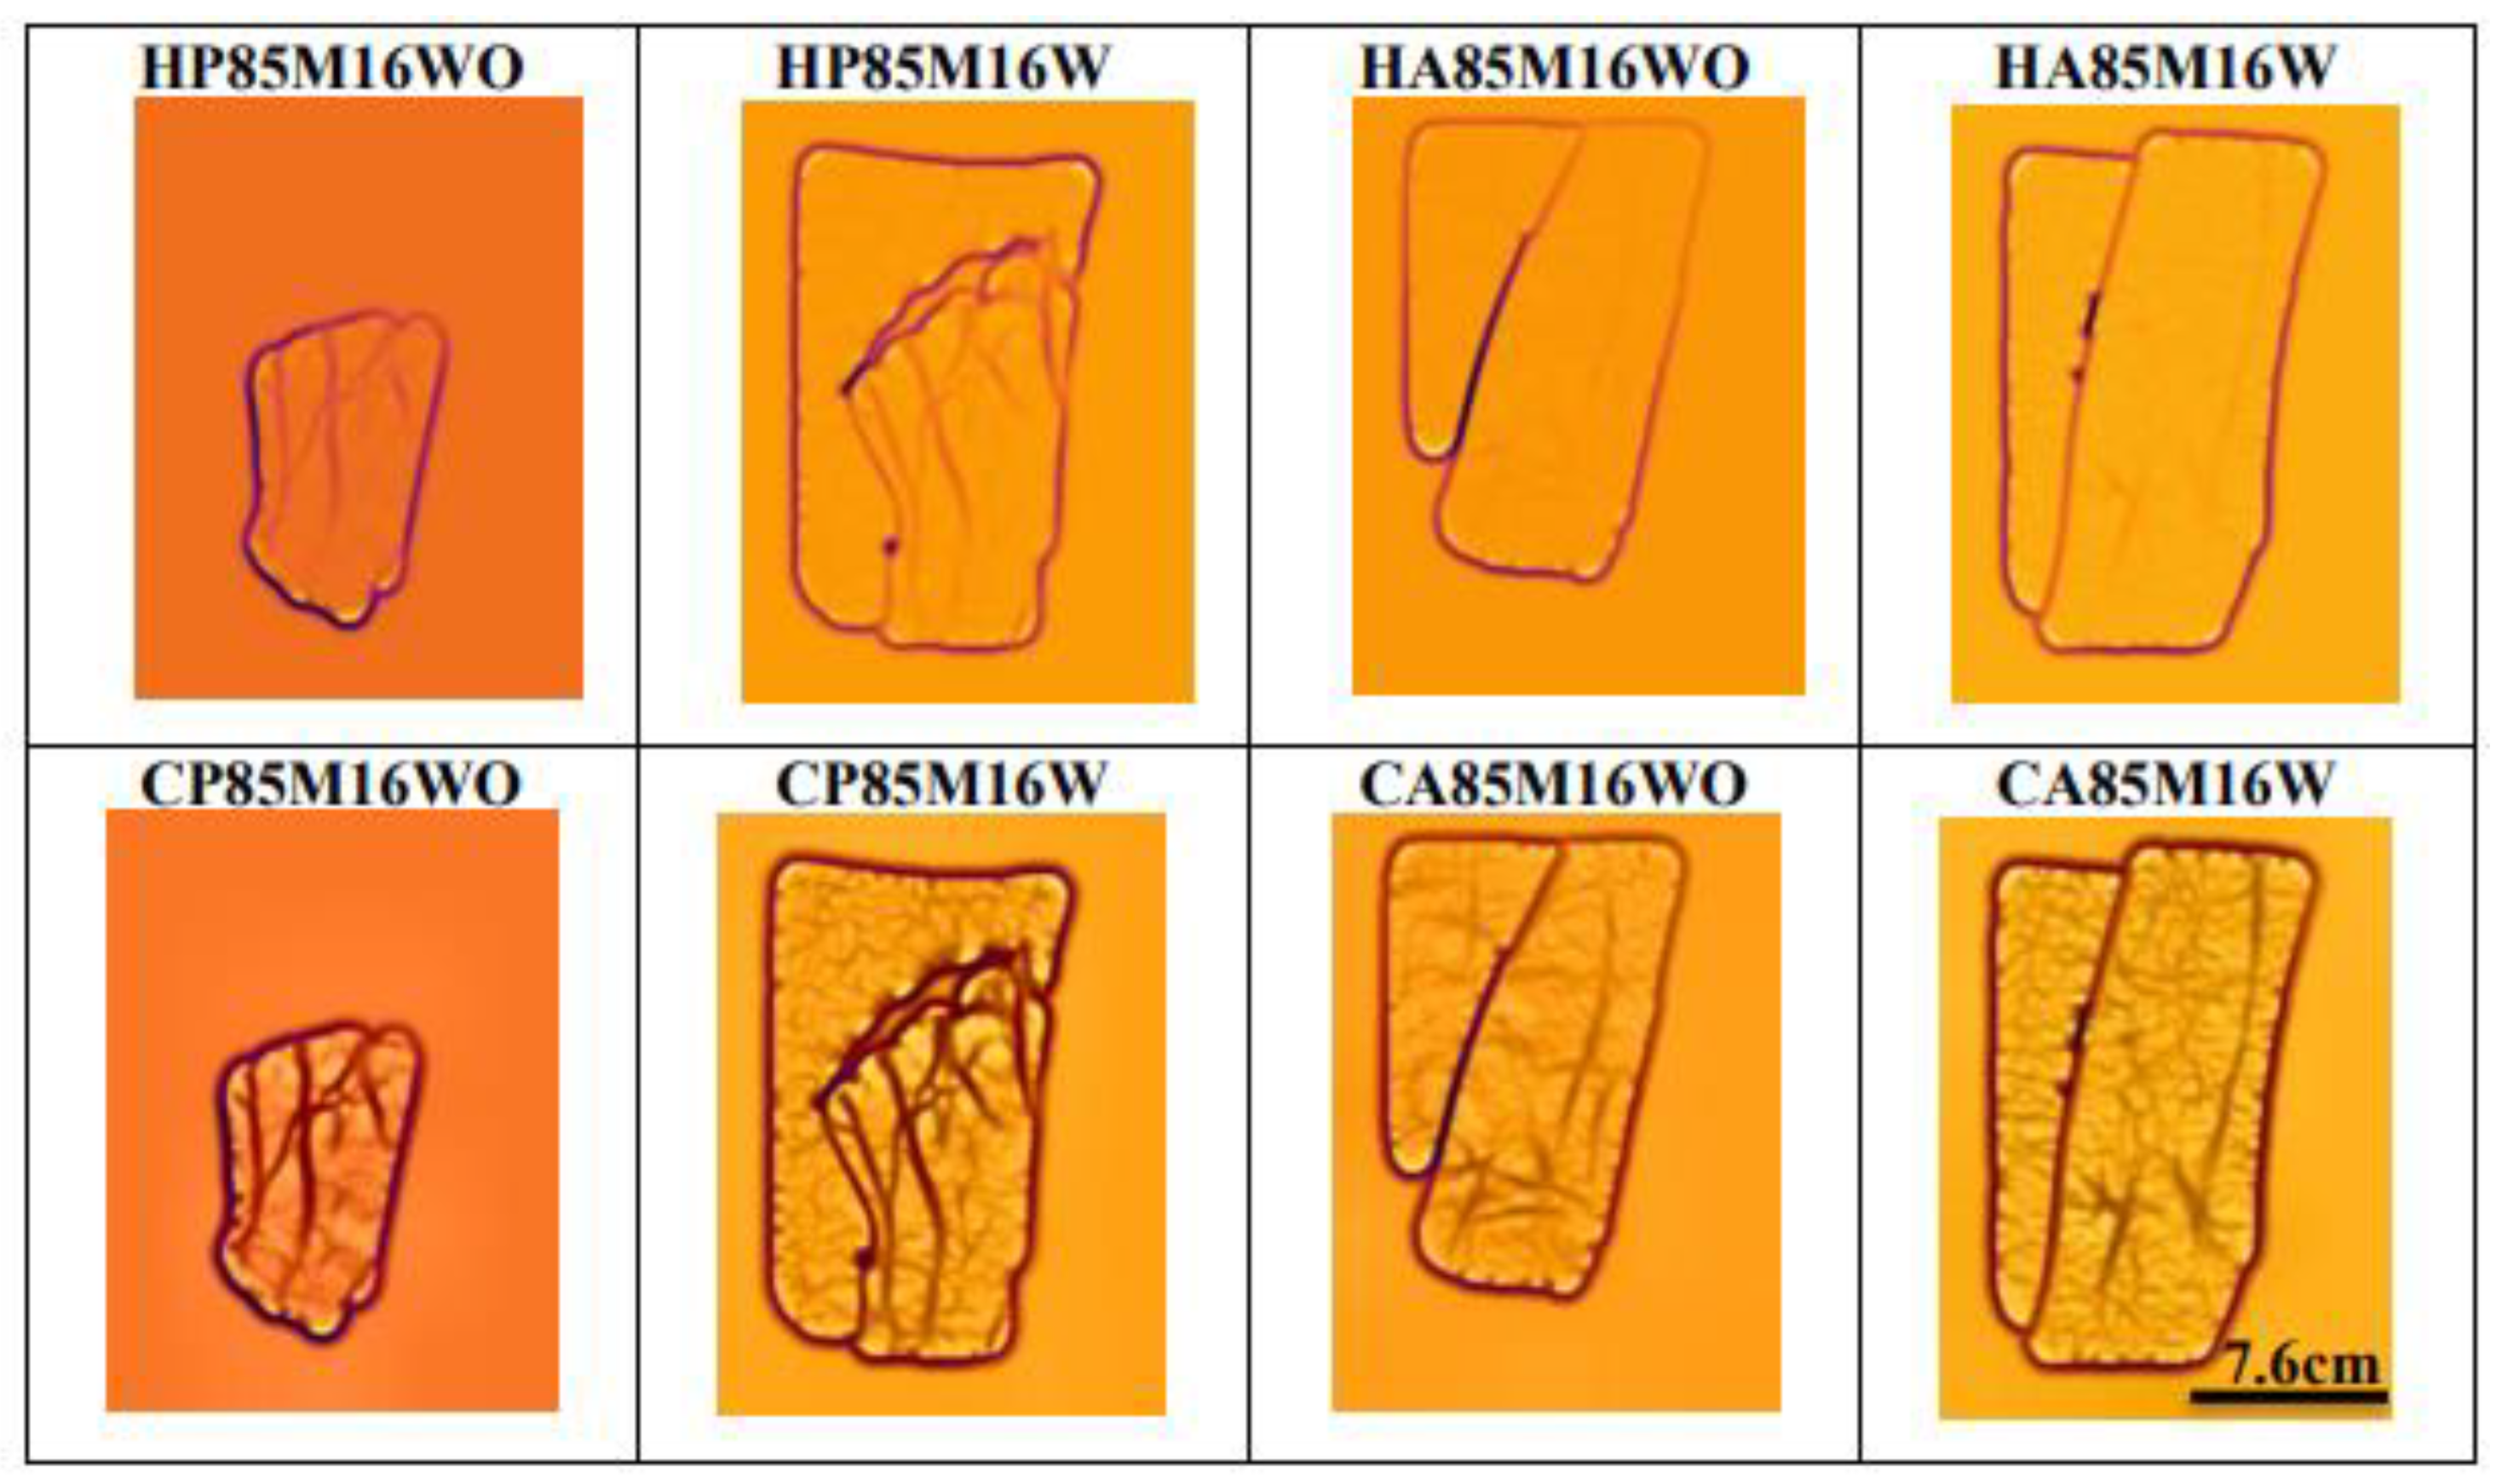
3.2. Evaluation Analysis of Selected Wavelength with Diffuser Using Square LED Arrangement
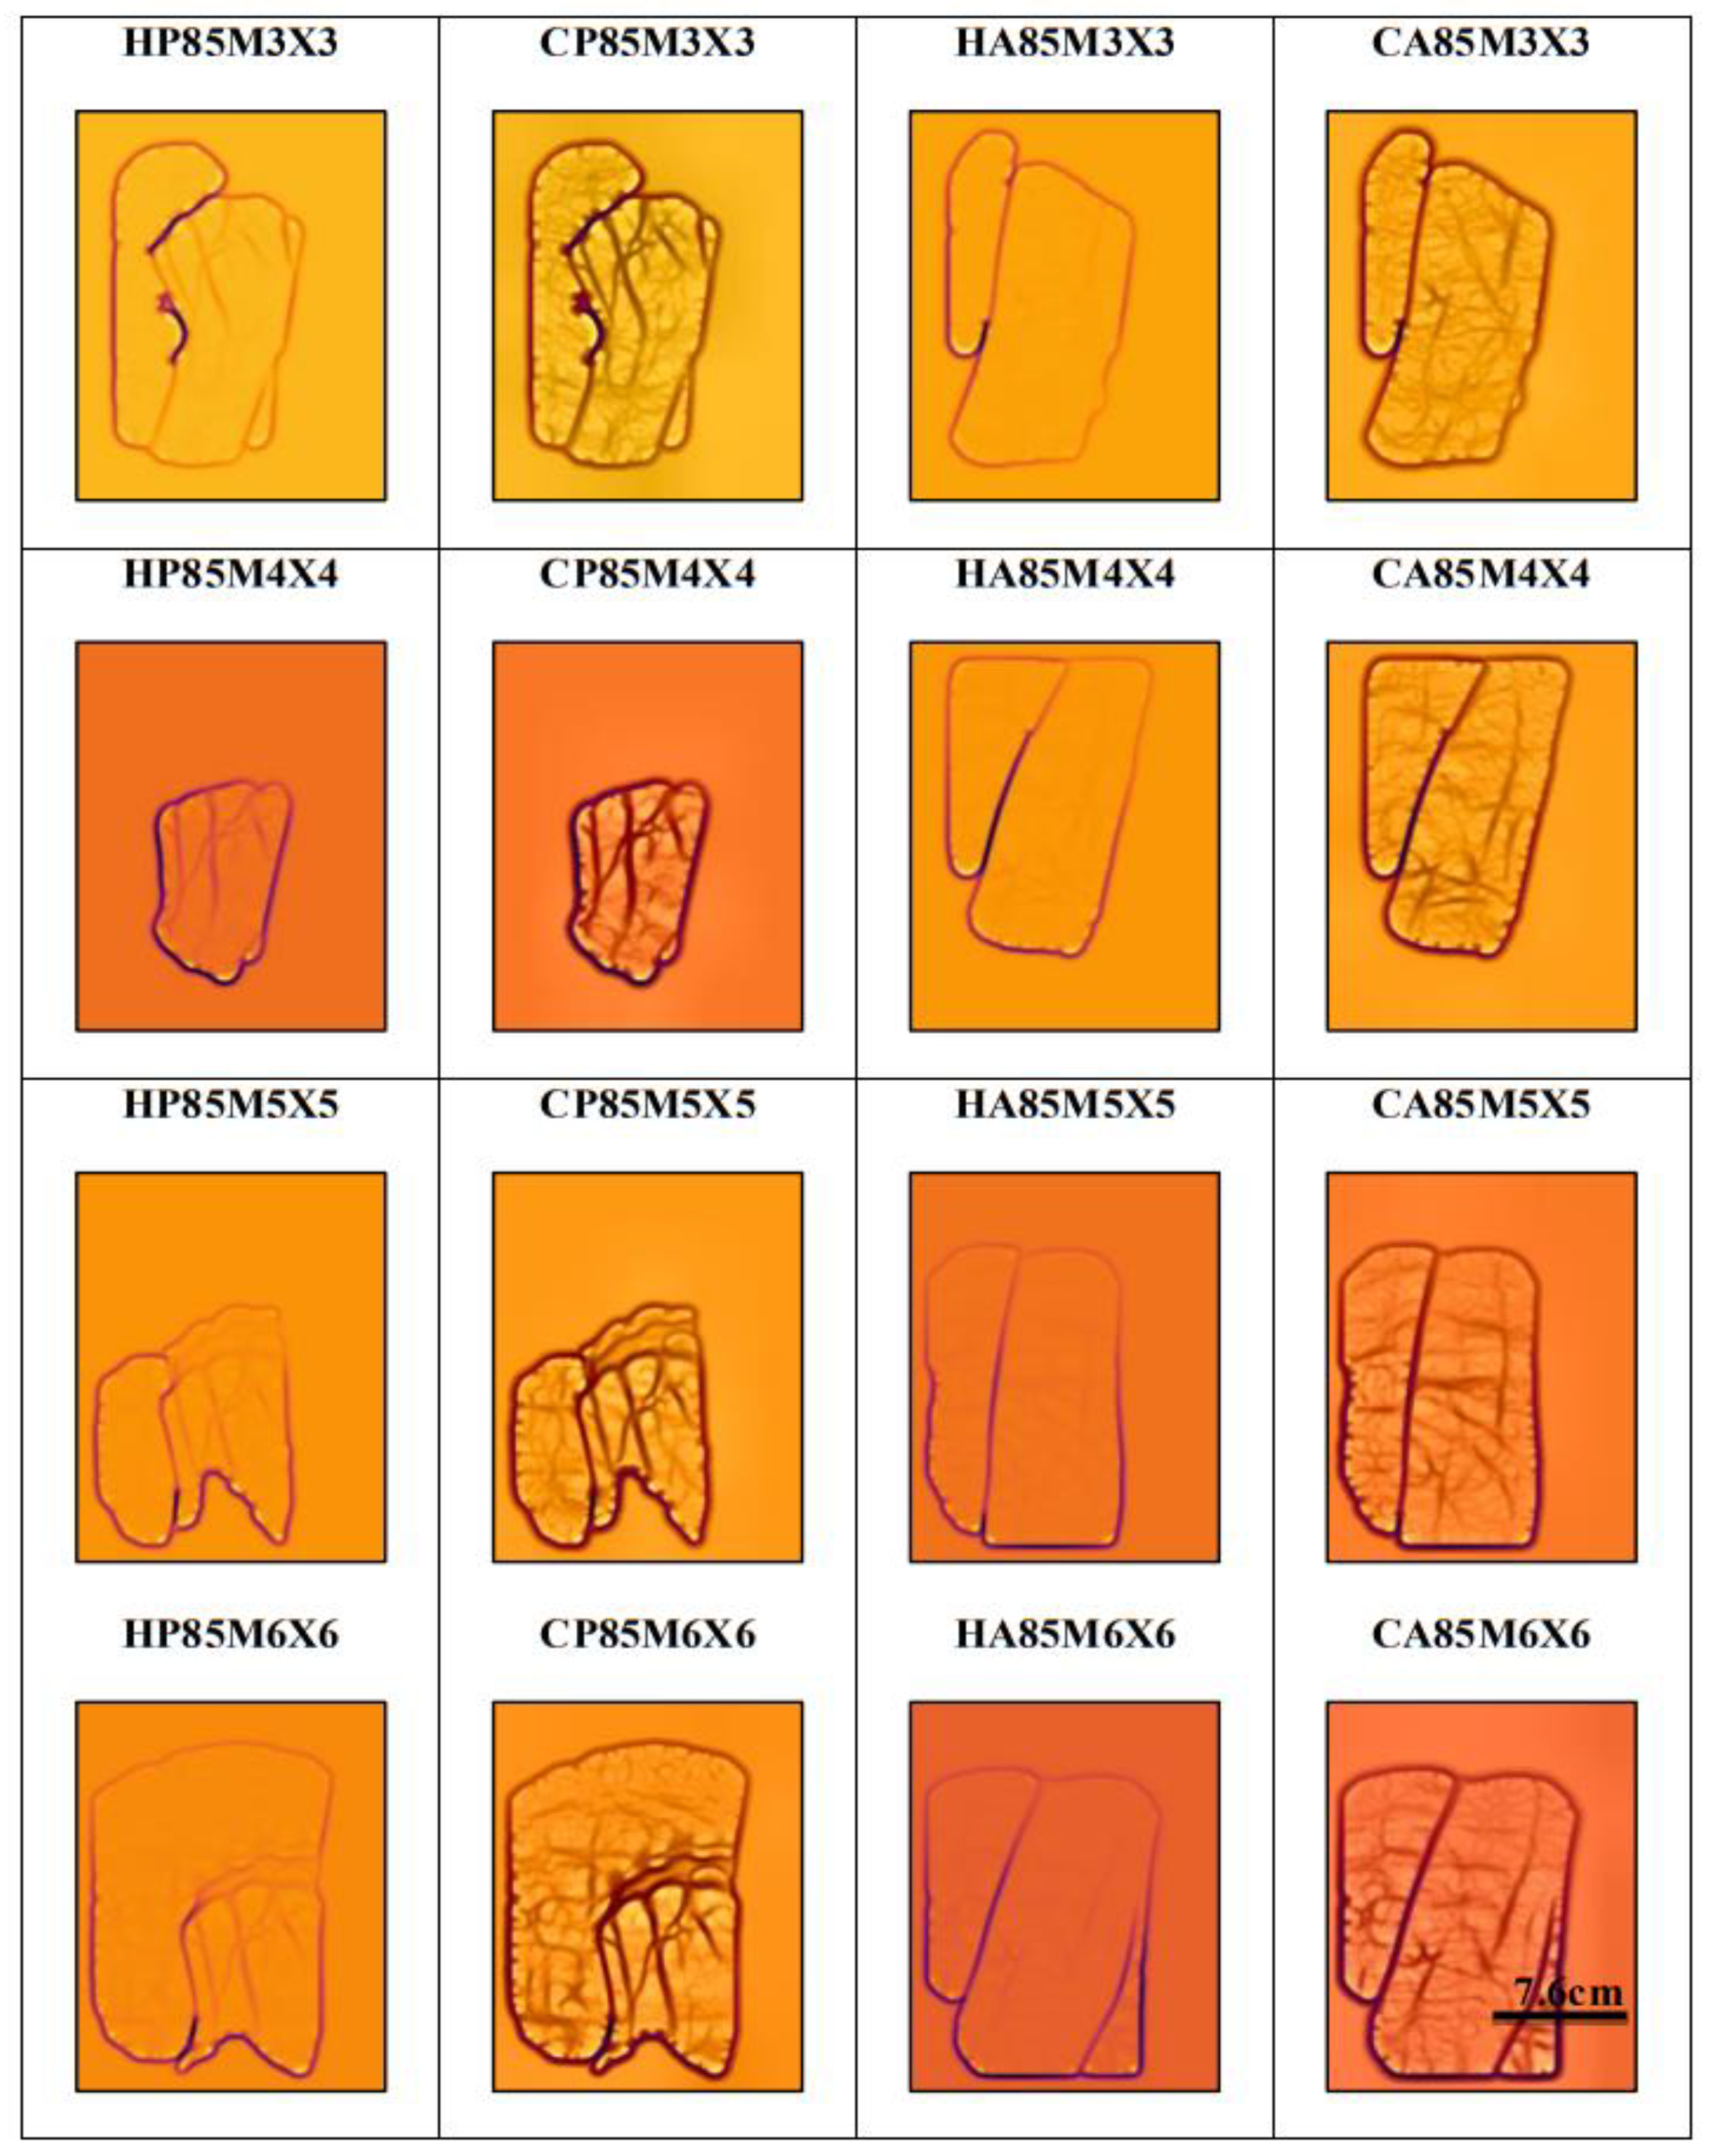
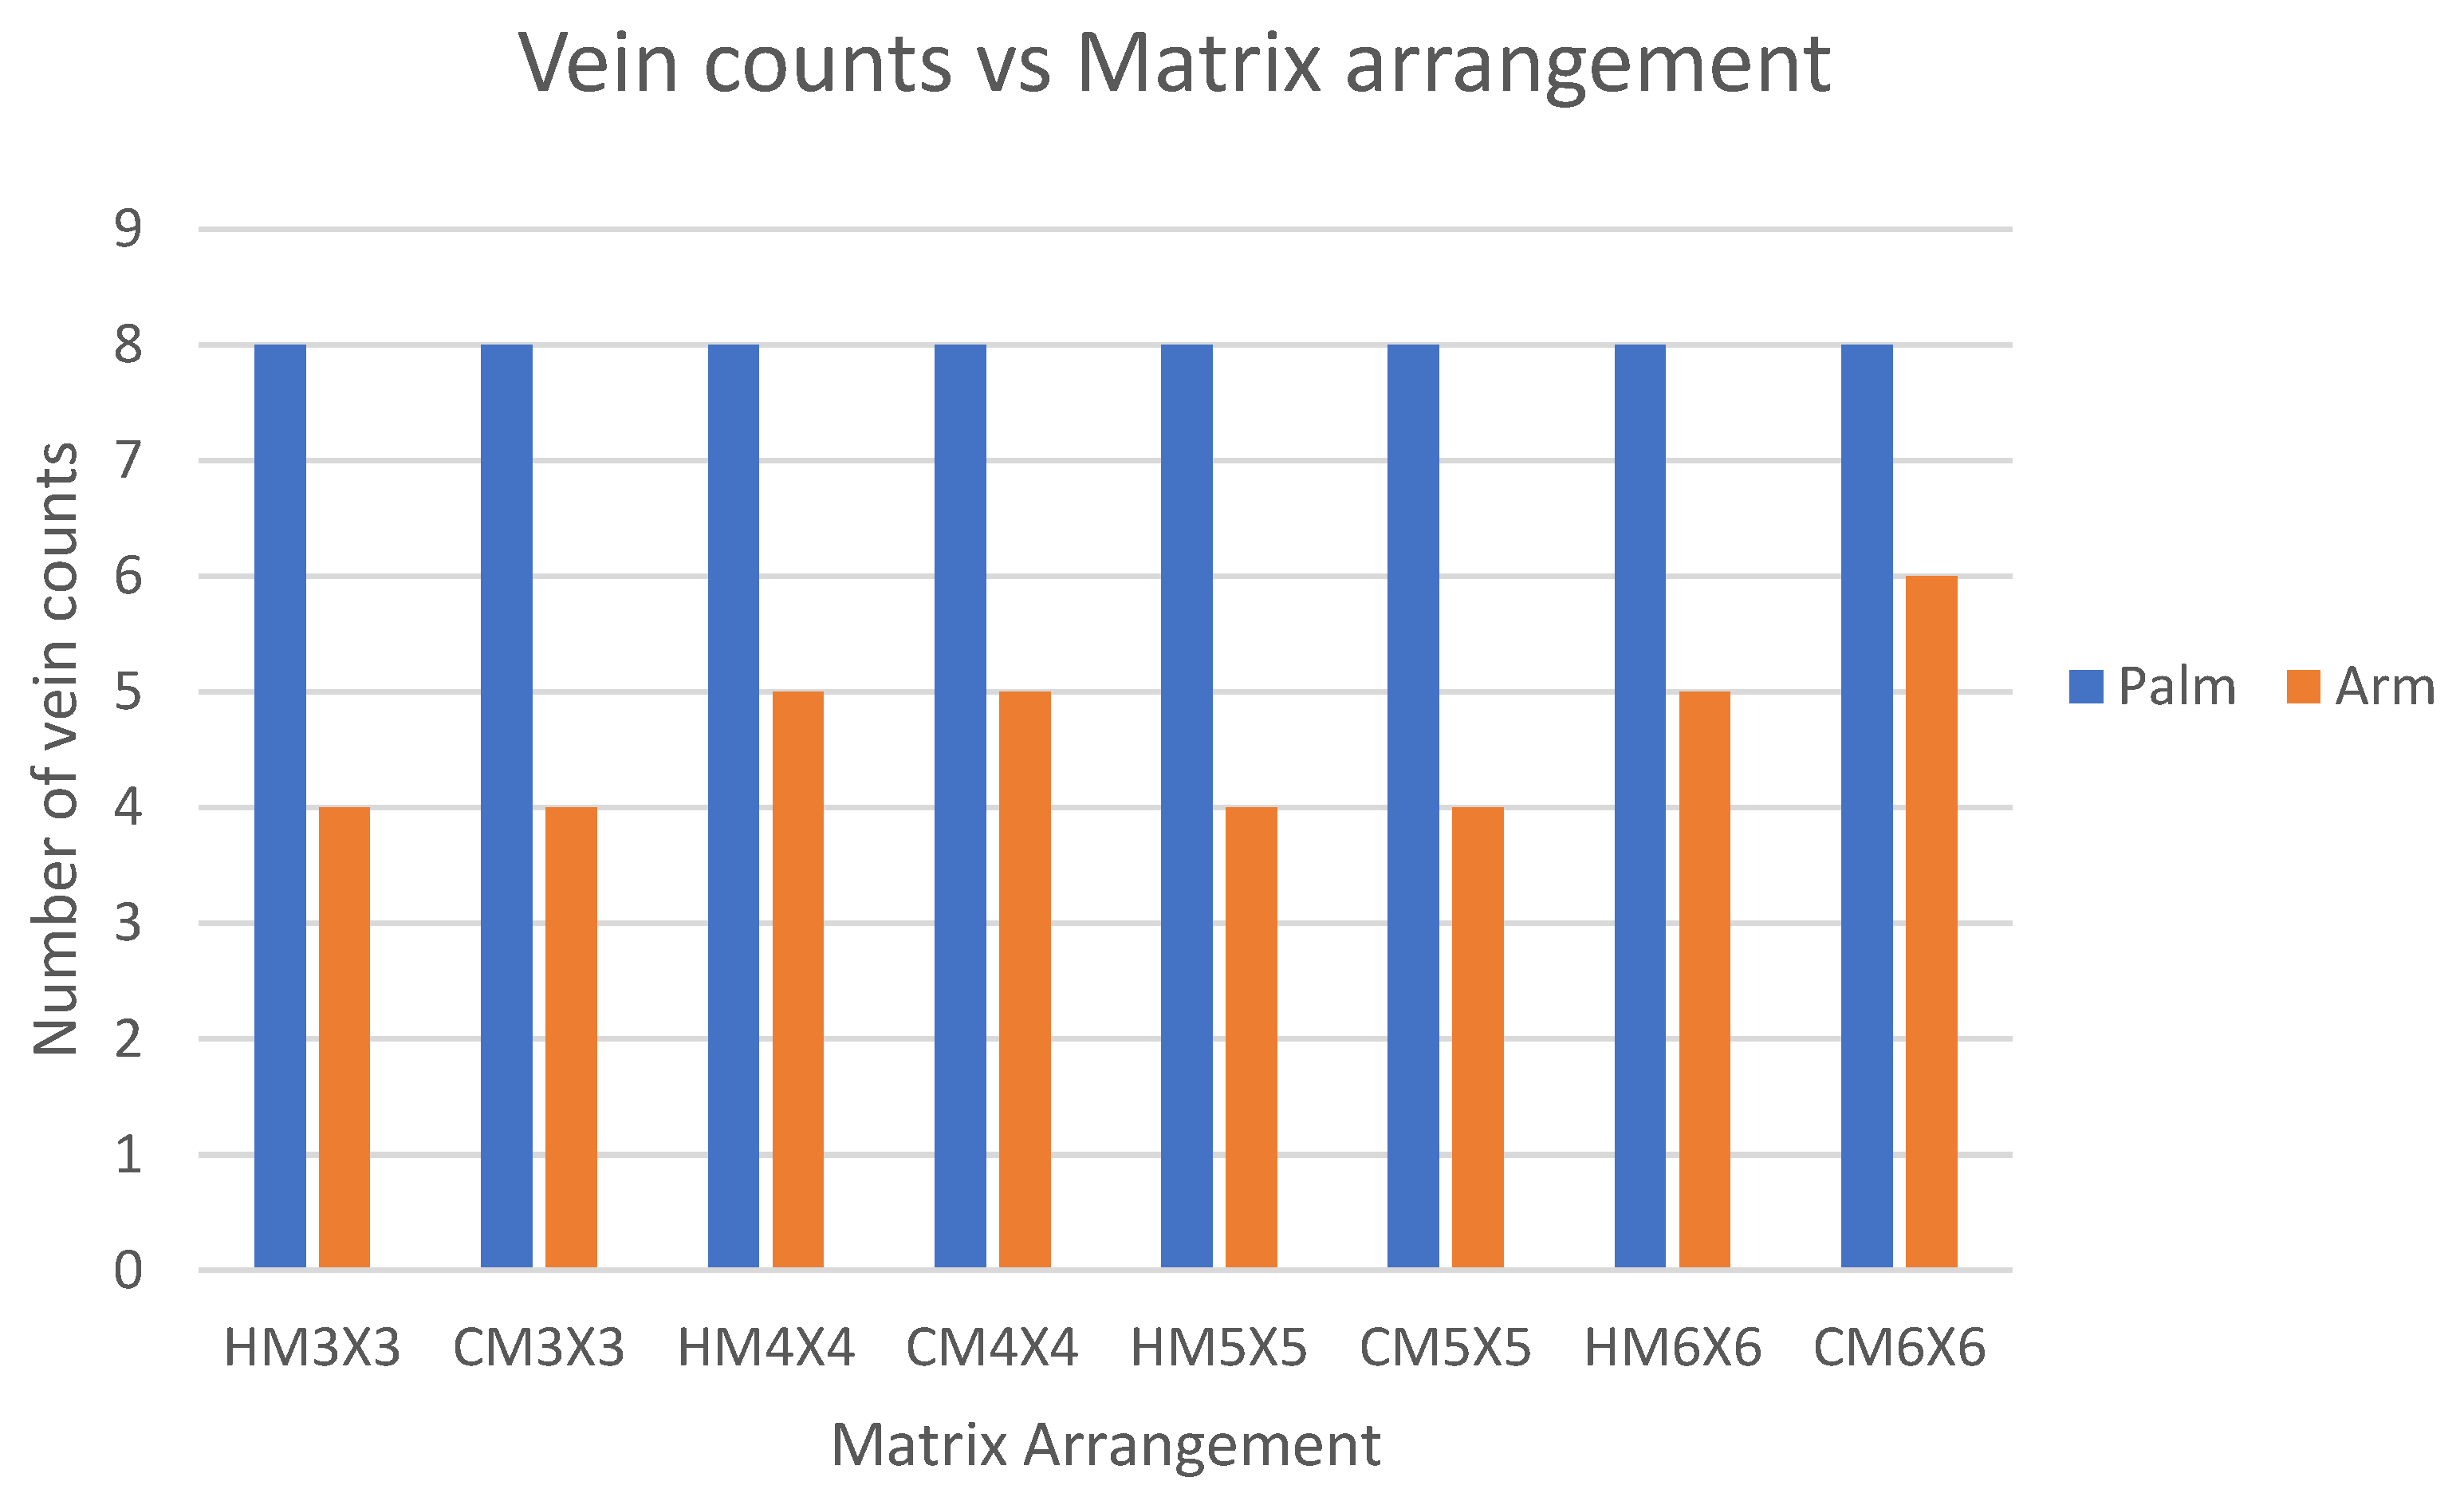
3.3. Evaluation of Square LED Arrangement for the Light Illuminator
4. Conclusions
Author Contributions
Funding
Institutional Review Board Statement
Informed Consent Statement
Acknowledgments
Conflicts of Interest
References
- Cuper, N.J.; Verdaasdonk, R.M.; De Roode, R.; De Vooght, K.M.K.; Viergever, M.A.; Kalkman, C.J.; De Graaff, J.C. Visualizing Veins with Near-Infrared Light to Facilitate Blood Withdrawal in Children. Clin. Pediatr. 2011, 50, 508–512. [Google Scholar] [CrossRef] [PubMed]
- Fuksis, R.; Greitans, M.; Nikisins, O.; Pudzs, M. Infrared Imaging System for Analysis of Blood Vessel Structure. Elektron. Ir Elektrotechnika 2010, 97, 45–48. [Google Scholar]
- Kim, D.; Kim, Y.; Yoon, S.; Lee, D. Preliminary Study for Designing a Novel Vein-Visualizing Device. Sensors 2017, 17, 304. [Google Scholar] [CrossRef] [PubMed]
- Azueto-Ríos, Á.; Hernández-Gómez, L.-E.; Hernández-Santiago, K.-A. Forearm and Hand Vein Detection System for an Infrared Image Database. Res. Comput. Sci. 2016, 127, 137–147. [Google Scholar] [CrossRef]
- Yaprak, E.; Kayaalti-Yuksek, S. Preliminary Evaluation of Near-Infrared Vein Visualization Technology in the Screening of Palatal Blood Vessels. Med. Oral Patol. Oral Cir. Bucal 2018, 23, e98–e104. [Google Scholar] [CrossRef]
- Wang, L.; Leedham, G. Near- and Far- Infrared Imaging for Vein Pattern Biometrics. In Proceedings of the IEEE International Conference on Video and Signal Based Surveillance 2006, AVSS 2006, Sydney, NSW, Australia, 22–24 November 2006. [Google Scholar]
- Qadir, Z.; Direkoğlu, C. European Journal of Engineering and Applied Sciences Time and Cost-Efficient Vein Pattern Recognition and Injection Point Suggestion Using Machine Vision Technology. App. Sci 2019, 2, 58–64. [Google Scholar]
- Alwazzan, M.J. Low Cost Blood Vein Detection System Based on Near-Infrared LEDs and Image-Processing Techniques. Polish J. Med. Phys. Eng. 2020, 26, 61–67. [Google Scholar] [CrossRef]
- VT, G. A Novel Design Proposal for Low-Cost Vein-Viewer for Medical and Non-Contact Biometric Applications Using NIR Imaging. J. Med. Eng. Technol. 2021, 45, 303–312. [Google Scholar] [CrossRef] [PubMed]
- Chowdhury, T.; Khan, S.; Faruk, T.; Islam, M.K. Design and Implementation of a Low-Cost Real-Time Vein Imaging for Developing Countries. In Proceedings of the 2021 International Conference on Automation, Control and Mechatronics for Industry 4.0, ACMI 2021, Rajshahi, Bangladesh, 8–9 July 2021. [Google Scholar] [CrossRef]
- Liu, X.; Chen, H.; Montieri, A.; Pescapè, A. Human Behavior Sensing: Challenges and Approaches. J. Ambient Intell. Humaniz. Comput. 2020, 11, 6043–6058. [Google Scholar] [CrossRef]
- Swarbrick, J.; Boylan, C.J. Encyclopedia of Pharmaceutical Technology: Volume 19—Blood Substitutes: Hemoglobin–Based Oxygen Carriers to Tablet Evaluation Using Near–Infrared Spectroscopy; Informa Health Care: London, UK, 1999. [Google Scholar]
- Madrid García, A.; Horche, P.R. Light Source Optimizing in a Biphotonic Vein Finder Device: Experimental and Theoretical Analysis. Results Phys. 2018, 11, 975–983. [Google Scholar] [CrossRef]
- Juhim, F.; Chee, F.P.; Rahman, A.B.A.; Bade, A. Effect of Exposure Time of Near Infrared Light Radiation (NIR) on Human’s Vein Visualization. Int. J. Recent Technol. Eng. 2020, 8, 2072–2075. [Google Scholar] [CrossRef]
- Nundy, K.K.; Sanyal, S. A Low Cost Vein Detection System Using Integrable Mobile Camera Devices. In Proceedings of the Proceedings of the 2010 Annual IEEE India Conference: Green Energy, Computing and Communication, INDICON 2010, Kolkata, India, 17–19 December 2010. [Google Scholar]
- Crisan, S.; Tebrean, B. Low Cost, High Quality Vein Pattern Recognition Device with Liveness Detection. Workflow and Implementations. Meas. J. Int. Meas. Confed. 2017, 108, 207–216. [Google Scholar] [CrossRef]
- Rother, C.; Kolmogorov, V.; Blake, A. “GrabCut”. In Proceedings of the ACM SIGGRAPH 2004 Papers on—SIGGRAPH’04; ACM Press: New York, NY, USA, 2004; p. 309. [Google Scholar]
- Orchard, M.T.; Bouman, C.A. Color Quantization of Images. IEEE Trans. Signal Process. 1991, 39, 2677–2690. [Google Scholar] [CrossRef]
- Mordvintsev, A.; Abid, K. OpenCV-Python Tutorials Documentation. 2017. Available online: https://opencv24-python-tutorials.readthedocs.io/_/downloads/en/stable/pdf/ (accessed on 16 June 2022).
- Moreland, K. Colour Map Advice for Scientific Visualization. Available online: https://www.kennethmoreland.com/color-advice (accessed on 20 April 2019).
- CLSI. Collection of Diagnostic Venous Blood Specimens-Seventh Edition. GP41; CLSI: Wayne, PA, USA, 2017; Volume 37, p. 84. [Google Scholar]
- Ogden-Grable, H.; Gill, G.W. Phlebotomy puncture juncture: Preventing phlebotomy errors—Potential for harming your patients. Lab. Med. 2005, 36, 430–433. [Google Scholar] [CrossRef]
- Buowari, O.Y. Complications of Venepuncture. Adv. Biosci. Biotechnol. 2013, 4, 126–128. [Google Scholar] [CrossRef]
- Pan, C.-T.; Francisco, M.D.; Yen, C.-K.; Wang, S.-Y.; Shiue, Y.-L. Vein Pattern Locating Technology for Cannulation: A Review of the Low-Cost Vein Finder Prototypes. Sensors 2019, 19, 3573. [Google Scholar] [CrossRef]
- Mela, C.A.; Lemmer, D.P.; Bao, F.S.; Papay, F.; Hicks, T.; Liu, Y. Real-Time Dual-Modal Vein Imaging System. Int. J. Comput. Assist. Radiol. Surg. 2019, 14, 203–213. [Google Scholar] [CrossRef]
- Chandra, F.; Wahyudianto, A.; Yasin, M. Design of Vein Finder with Multi Tuning Wavelength Using RGB LED. J. Phys. Conf. Ser. 2017, 853. [Google Scholar] [CrossRef]
- Ong Michael, G.K.; Connie, T.; Jin Teoh, A.B. A Contactless Biometric System Using Palm Print and Palm Vein Features. In Advanced Biometric Technologies; InTech: Rijeka, Croatia, 2011. [Google Scholar]
- Hwang, H.; Yim, J.; Cho, J.; Cheon, C.; Kwon, Y. 110 GHz Broadband Measurement of Permittivity on Human Epidermis Using 1 Mm Coaxial Probe. In Proceedings of the IEEE MTT-S International Microwave Symposium Digest, Philadelphia, PA, USA, 8–13 June 2003; Volume 1, pp. 399–402. [Google Scholar]
- Juric, S.; Flis, V.; Debevc, M.; Holzinger, A.; Zalik, B. Towards a Low-Cost Mobile Subcutaneous Vein Detection Solution Using Near-Infrared Spectroscopy. Sci. World J. 2014, 2014, 365902. [Google Scholar] [CrossRef]
- Ash, C.; Dubec, M.; Donne, K.; Bashford, T. Effect of Wavelength and Beam Width on Penetration in Light-Tissue Interaction Using Computational Methods. Lasers Med. Sci. 2017, 32, 1909–1918. [Google Scholar] [CrossRef]
- Farkas, J.P.; Hoopman, J.E.; Kenkel, J.M. Five Parameters You Must Understand to Master Control of Your Laser/Light-Based Devices. Aesthetic Surg. J. 2013, 33, 1059–1064. [Google Scholar] [CrossRef] [PubMed]
- Ahmed, K.I.; Habaebi, M.H.; Islam, M.R. A Real Time Vein Detection System. Indones. J. Electr. Eng. Comput. Sci. 2018, 10, 129. [Google Scholar] [CrossRef]
- Crisan, S.; Tarnovan, I.G.; Crisan, T.E. Radiation Optimization and Image Processing Algorithms in the Identification of Hand Vein Patterns. Comput. Stand. Interfaces 2010, 32, 130–140. [Google Scholar] [CrossRef]
- Yamada, K.; Yamada, K.; Katsuda, I.; Hida, T. Cubital Fossa Venipuncture Sites Based on Anatomical Variations and Relationships of Cutaneous Veins and Nerves. Clin. Anat. 2008, 21, 307–313. [Google Scholar] [CrossRef] [PubMed]


| Wavelength | Specifications | Value |
|---|---|---|
| 720 nm | DC Forward Current | 20 mA |
| Power Dissipation | 150 mW | |
| DC Forward Voltage | 1.6–2.0 V | |
| Luminous Intensity | 5.46–9.56 cd | |
| 760 nm | DC Forward Current | 20 mA |
| Power Dissipation | 150 mW | |
| DC Forward Voltage | 1.6–2.0 V | |
| Luminous Intensity | 6.83–10.93 cd | |
| 850 nm | DC Forward Current | 200 mA |
| Power Dissipation | 180 mW | |
| DC Forward Voltage | 1.8–2.3 V | |
| Luminous Intensity | 30.74–92.21 cd | |
| 900 nm | DC Forward Current | 100 mA |
| Power Dissipation | 40 mW | |
| DC Forward Voltage | 2.2 V | |
| Luminous Intensity | 6.83–10.93 cd | |
| 940 nm | DC Forward Current | 100 mA |
| Power Dissipation | 150 mW | |
| DC Forward Voltage | 1.4–1.8 V | |
| Luminous Intensity | 40.98–58.06 cd |
| Wavelength | Angle |
|---|---|
| 720 nm | 30° |
| 760 nm | 30° |
| 850 nm | 30° |
| 900 nm | 30° |
| 940 nm | 30° |
| HP85M16WO | |||||
|---|---|---|---|---|---|
| H | P | 85 | M | 16 | WO |
| Method (Hessian) | ROI (Palm) | Wavelength (850 nm) | LEDs Arrangement (Square LED) | Number of LEDs (16) | Inclusion of Diffuser (No) |
| CA85R8 | |||||
| C | A | 85 | R | 8 | |
| Method (Contrast) | ROI (Arm) | Wavelength (850 nm) | LEDs Arrangement (Ring LED) | Number of LEDs (8) | |
| CP85M3X3 | |||||
| C | P | 85 | M | 3X3 | |
| Method (Contrast) | ROI (Palm) | Wavelength (850 nm) | LEDs Arrangement (Square LED) | Square LED arrangement | |
| Arm (Square) (9 LEDs) | Arm (Ring) (8 LEDs) | Palm (Square) (9 LEDs) | Palm (Ring) (8 LEDs) | |
|---|---|---|---|---|
| 720 nm | X | X | X | X |
| 760 nm | X | X | X | O |
| 850 nm | O | O | O | O |
| 900 nm | O | O | O | O |
| 940 nm | O | O | O | O |
| HPM9 | CPM9 | HPR8 | CPR8 | HAM9 | CAM9 | HAR8 | CAR8 | |
|---|---|---|---|---|---|---|---|---|
| 720 nm | 1 | 1 | 1 | 1 | 0 | 0 | 0 | 0 |
| 760 nm | 0 | 0 | 3 | 3 | 0 | 0 | 0 | 0 |
| 850 nm | 7 | 8 | 7 | 8 | 3 | 3 | 3 | 3 |
| 900 nm | 7 | 8 | 7 | 8 | 3 | 3 | 2 | 2 |
| 940 nm | 7 | 8 | 6 | 5 | 3 | 3 | 1 | 1 |
Publisher’s Note: MDPI stays neutral with regard to jurisdictional claims in published maps and institutional affiliations. |
© 2022 by the authors. Licensee MDPI, Basel, Switzerland. This article is an open access article distributed under the terms and conditions of the Creative Commons Attribution (CC BY) license (https://creativecommons.org/licenses/by/4.0/).
Share and Cite
Abd Rahman, A.B.; Juhim, F.; Chee, F.P.; Bade, A.; Kadir, F. Near Infrared Illumination Optimization for Vein Detection: Hardware and Software Approaches. Appl. Sci. 2022, 12, 11173. https://doi.org/10.3390/app122111173
Abd Rahman AB, Juhim F, Chee FP, Bade A, Kadir F. Near Infrared Illumination Optimization for Vein Detection: Hardware and Software Approaches. Applied Sciences. 2022; 12(21):11173. https://doi.org/10.3390/app122111173
Chicago/Turabian StyleAbd Rahman, Abu Bakar, Floressy Juhim, Fuei Pien Chee, Abdullah Bade, and Fairrul Kadir. 2022. "Near Infrared Illumination Optimization for Vein Detection: Hardware and Software Approaches" Applied Sciences 12, no. 21: 11173. https://doi.org/10.3390/app122111173
APA StyleAbd Rahman, A. B., Juhim, F., Chee, F. P., Bade, A., & Kadir, F. (2022). Near Infrared Illumination Optimization for Vein Detection: Hardware and Software Approaches. Applied Sciences, 12(21), 11173. https://doi.org/10.3390/app122111173