Article

Effects of Loading Stress and Velocity on Compression and Particle Breakage Behaviour of Waste Rocks in Backfill Coal Mining

1
School of Mines, China University of Mining and Technology, Xuzhou 221116, China
2
State Key Laboratory of Coal Resources and Safe Mining, China University of Mining and Technology, Xuzhou 221116, China
3
School of Engineering, Faculty of Science, Engineering and Built Environment, Deakin University, Geelong Waurn Ponds Campus, Waurn Ponds, VIC 3216, Australia
*
Author to whom correspondence should be addressed.
Appl. Sci. 2022, 12(21), 11175; https://doi.org/10.3390/app122111175
Submission received: 17 October 2022 / Revised: 31 October 2022 / Accepted: 1 November 2022 / Published: 4 November 2022
(This article belongs to the Special Issue Disposal and Utilization of Mine Solid Waste)

Abstract

:
Coal mine waste rocks, mainly broken gangue, can be used as filling materials to backfill into goafs. Under the overburden load, the backfill body is vulnerable to compressive deformation and particle breakage. With the increase in mining depth, the overlying strata will impose different loads on waste rock filling materials at different loading velocities, which further affect the material compressive deformation and particle breakage. In this paper, an experimental scheme and a loading device are designed to study the influence of loading stress and velocity on the compressive deformation and particle size distributions of the backfill materials before and after compression. The results show that the axial strain of the gangue filling materials increases rapidly with the axial stress and then gradually stabilizes, showing a logarithmic functional relationship. Increasing the loading velocity will destroy the contact structures among the gangue particles and cause a larger deformation to the filling materials. When the loading stress is relatively low (5 MPa), the gangue particles with a size larger than 20 mm have a stronger bearing capacity compared with particles of 16–20 mm, which are the first particles to be crushed under these conditions. Further increasing the loading velocity will increase the breakage degree of the filling materials. The breakage ratio (BM) has a logarithmic functional relationship with the loading stress and the loading velocity. When the ground stress is lower than 5 MPa, the content of coarse particles should be increased to enhance the bearing capacity of the gangue materials; when the ground stress is higher than 10 MPa, the content of fine particles should be increased to reduce the porosity ratio and the particle breakage ratio.

1. Introduction

Large-scale excavations of coal resources provide energy for social development, but simultaneously cause a variety of ecological and environmental problems that require mitigation and management [1,2,3]. Coal mining causes instability in rock strata, with ground deformation resulting in a caving zone, a fractured zone, and a bending zone that may also result in subsidence at the ground surface. Ground deformation can also impact aquifers and surface water bodies above the coal seam, increasing the risks of slow seepage, water inrush incidents, and damage to the surface structure [4,5,6]. Additional environmental concerns during coal mining and washing arise due to large quantities of waste rocks and gangue that are produced, which occupy valuable land area, release harmful gases into the atmosphere, and potentially pollute groundwater resources with toxic elements. Furthermore, spontaneous combustion, landslides, or other disasters may be triggered because of long-term exposure of these waste materials to the air. These materials detrimentally affect mine safety and the ecological environment [7,8].
The backfill of coal mines with waste rock material and gangue can mitigate many of these environmental concerns. However, familiar recycling and utilization methods, such as using a coal gangue for power generation and brick fabrication, do not use sufficient volumes of waste that has accumulated on the surface at mine sites [9,10,11]. To this end, the waste rock backfill mining method has been proposed. The gangue waste problem could be addressed through backfilling the solid waste rocks into underground goafs and controlling subsidence to limit effects on infrastructure and water resources near the ground surface [12,13,14,15]. However, after the fragmented coal gangue is poured into a goaf as an active ground support, particle breakage due to the overlying pressure and deformation of the gangue backfill body may complicate the backfill process and compromise its effectiveness. The overburden load at varying burial depths has different impacts on the gangue backfill materials. In addition, the settlement velocity of the overlying strata affects the compressive deformation and internal particle breakage of the gangue backfill materials.
Numerous studies examined the deformation and particle breakage behaviour of gangue backfill materials during the compression process. Early studies focused on the mechanical properties of coal gangue during compression. Pappas and Mark [16] investigated the mechanical properties of collapsed rock masses in the goaf and obtained a relationship between tangent modulus, secant modulus, and stress during rock mass compaction. Arasteh et al. [17] developed a computational model for predicting changes in the porosity and permeability of gangue in the goaf under the pressure of the surrounding rock formation. Benarchid et al. [18] studied the breakage performance of the gangue concrete during the compression process and concluded that its compressive strength and particle breakage were approximate to those of concrete made of natural gravel and sand. Arulrajah et al. [19,20] used gangue materials for pavement subbases and performed triaxial compression tests on these materials. They considered that the breakage degree and grading evolution results of the gangue in the pavement subbases were within the limits specified by the local national highway administration. Moreover, they found that the preparation and processing of gangue materials for pavements was significantly increased by mixing a certain proportion of broken glass into these materials.
Subsequent studies focused their attention on the particle size variations of gangue before and after compression. Hane et al. [21] used gangue materials with three sizes (0~10, 0~15 and 0~20 mm) as the aggregates to prepare paste filling materials. They analysed deformation characteristics through unconfined compression tests and found that the waste rocks with a particle size of 0~15 mm, as aggregates of the paste filling materials, had the largest compressive strength. Zhang et al. [22] examined the fractal dimensions of coal gangue particles during compressive loading and found that the fractal dimensions were greatly affected by the axial stress and strength of the waste rocks. By using 3D scanning and other methods, Li et al. [23] investigated the influences of different particle shapes on gangue particle breakage under compression and revealed that cubic gangue particles had a stronger bearing capacity. Salguero et al. [24] replaced partial fine aggregates with gangue to prepare a new concrete, recoding less deformation in the new concrete with a higher compressive strength (56.44 MPa) than in traditional concrete (41.03 MPa). Li et al. [25,26] analysed the deformation behaviours of gangue particles with different sizes when placed under different axial and lateral stresses. In addition, some scholars also tested the effect of the water environment on the compression deformation of crushed gangue [27,28,29,30,31,32] and further explored the environmental effect of the gangue under compression [33,34,35,36,37,38]. In summary, studies to date have focused on the influence of material strength on the compressive deformation of waste rock filling materials and the particle morphological variation during the compression process by numerical simulation. However, few studies are concerned with the effects of loading stress and velocity on the compressive deformation of waste rock filling materials. Moreover, the evolution mechanism of the particle breakages of gangue filling materials before and after compression remains vague and poorly quantified.
Therefore, in this paper, an experimental system is designed consisting of two modules: sieving and compressive loading modules. Detailed test schemes and procedures are also devised. Quantitative models of compressive deformation and particle breakage of the gangue backfill materials are determined. The effects of different loading stresses and velocities on the compressive deformation and particle breakage behaviour of the gangue backfill materials are investigated and the reasons for such effects are analysed.

2. Experimental Descriptions

2.1. Experimental Apparatus

The complete experimental system is composed of two modules: the compressive loading module and the sieving module. The former is used to compress the gangue specimens and record the data for analysing the compression features of the gangue particles. The breakage degree of the compressed gangue particles is quantitatively analysed based on the sieving system to reveal the particles’ fractal characteristics.
The loading module comprises a WAW-1000D electro-hydraulic servo universal test machine as the control centre and a self-developed steel barrel holding the gangue materials. As shown in Figure 1, the test machine can offer a maximum axial force of 1000 kN and has a stroke range of 0~250 mm. It is equipped with data acquisition software by which mechanical parameters such as load and displacement can be measured. The steel barrel has a square cross-section and an inner cuboid chamber of 200 mm × 200 mm × 300 mm (length × width × h eight). Mesh-shaped reinforcing bars with a thickness of 10 mm and a height of 28 mm are arranged at the outer sidewalls of the barrel to prevent deformation and limit the lateral displacement of the gangue materials. The outer dimensions of the barrel are 304 mm × 304 mm × 322 mm.
The sieving module mainly consists of a sieving device and weighing device. The sieving device includes standard square-holed sieves and a vibrating classifier. According to the national industry standard JGJ52-2006 “Standard for technical requirements and test method of sand and crushed stone (or gravel) for ordinary concrete” [39], and in combination with the test scheme, sieves screens with different nominal diameters (1.25, 2.5, 5, 10, 16, 20, 25 mm) were used in this experiment. The weighing device is an electronic scale with a measuring range of 0~3000 g and a precision of 0.01 g.

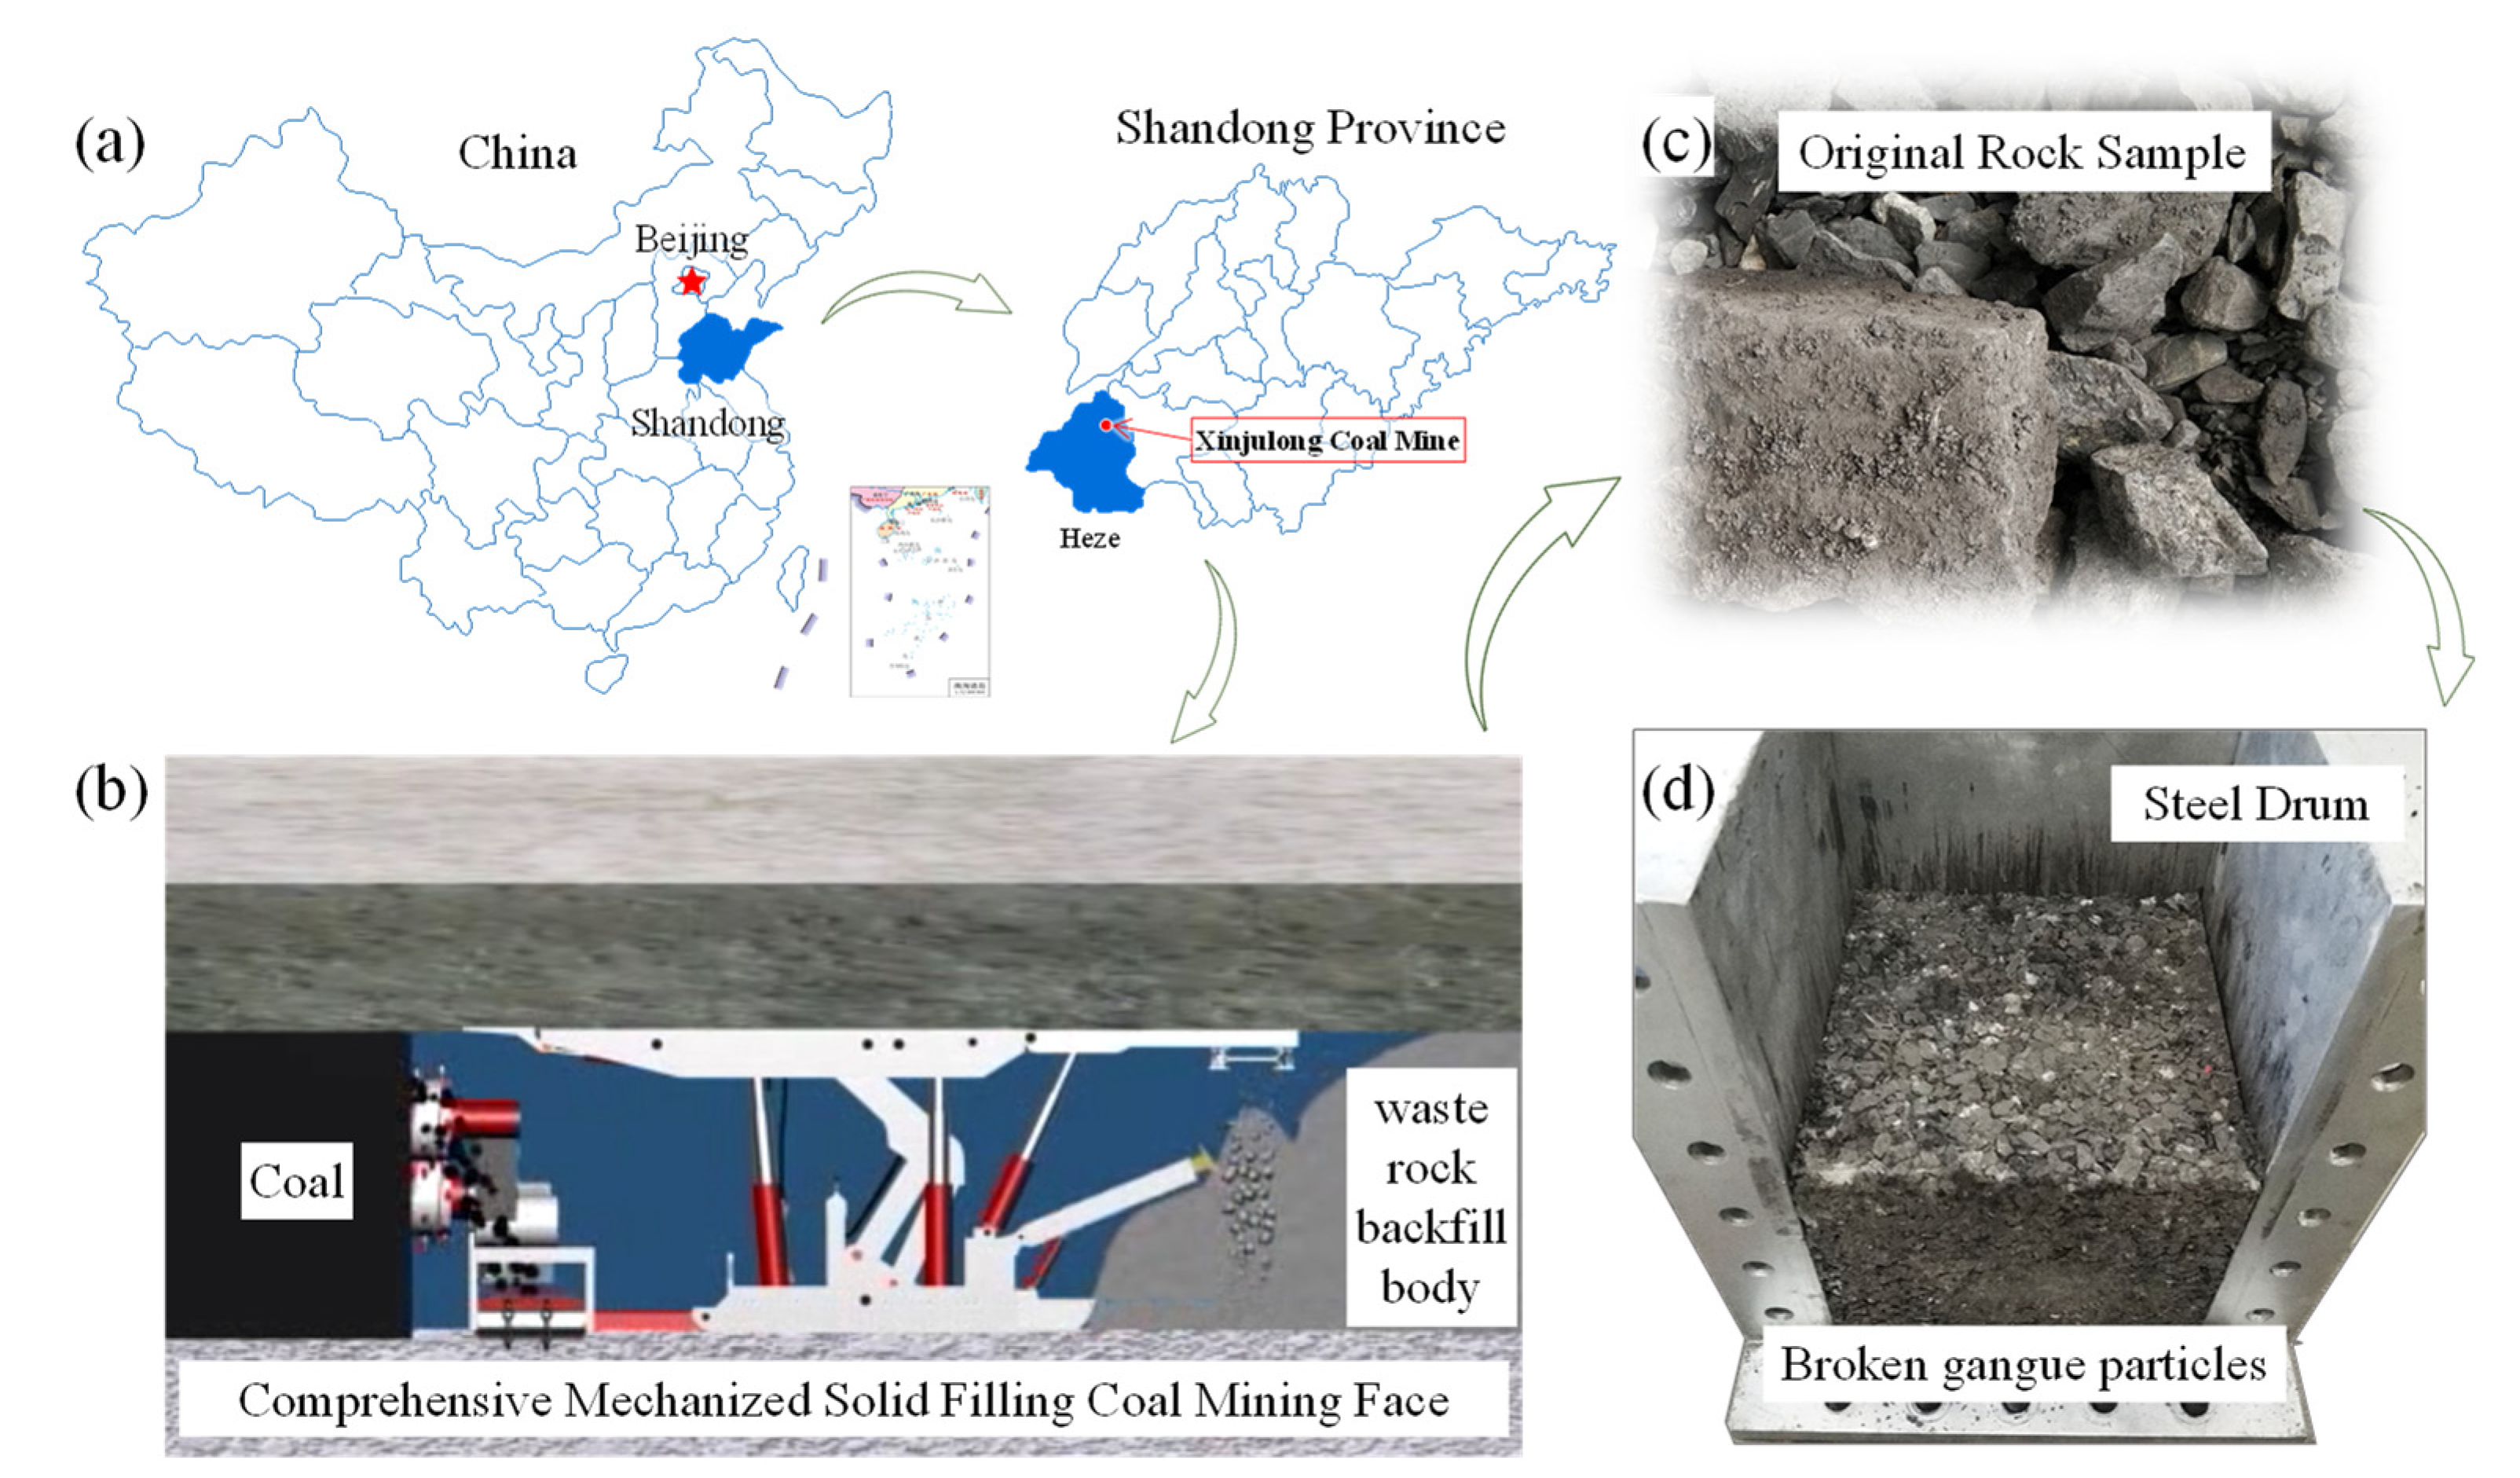
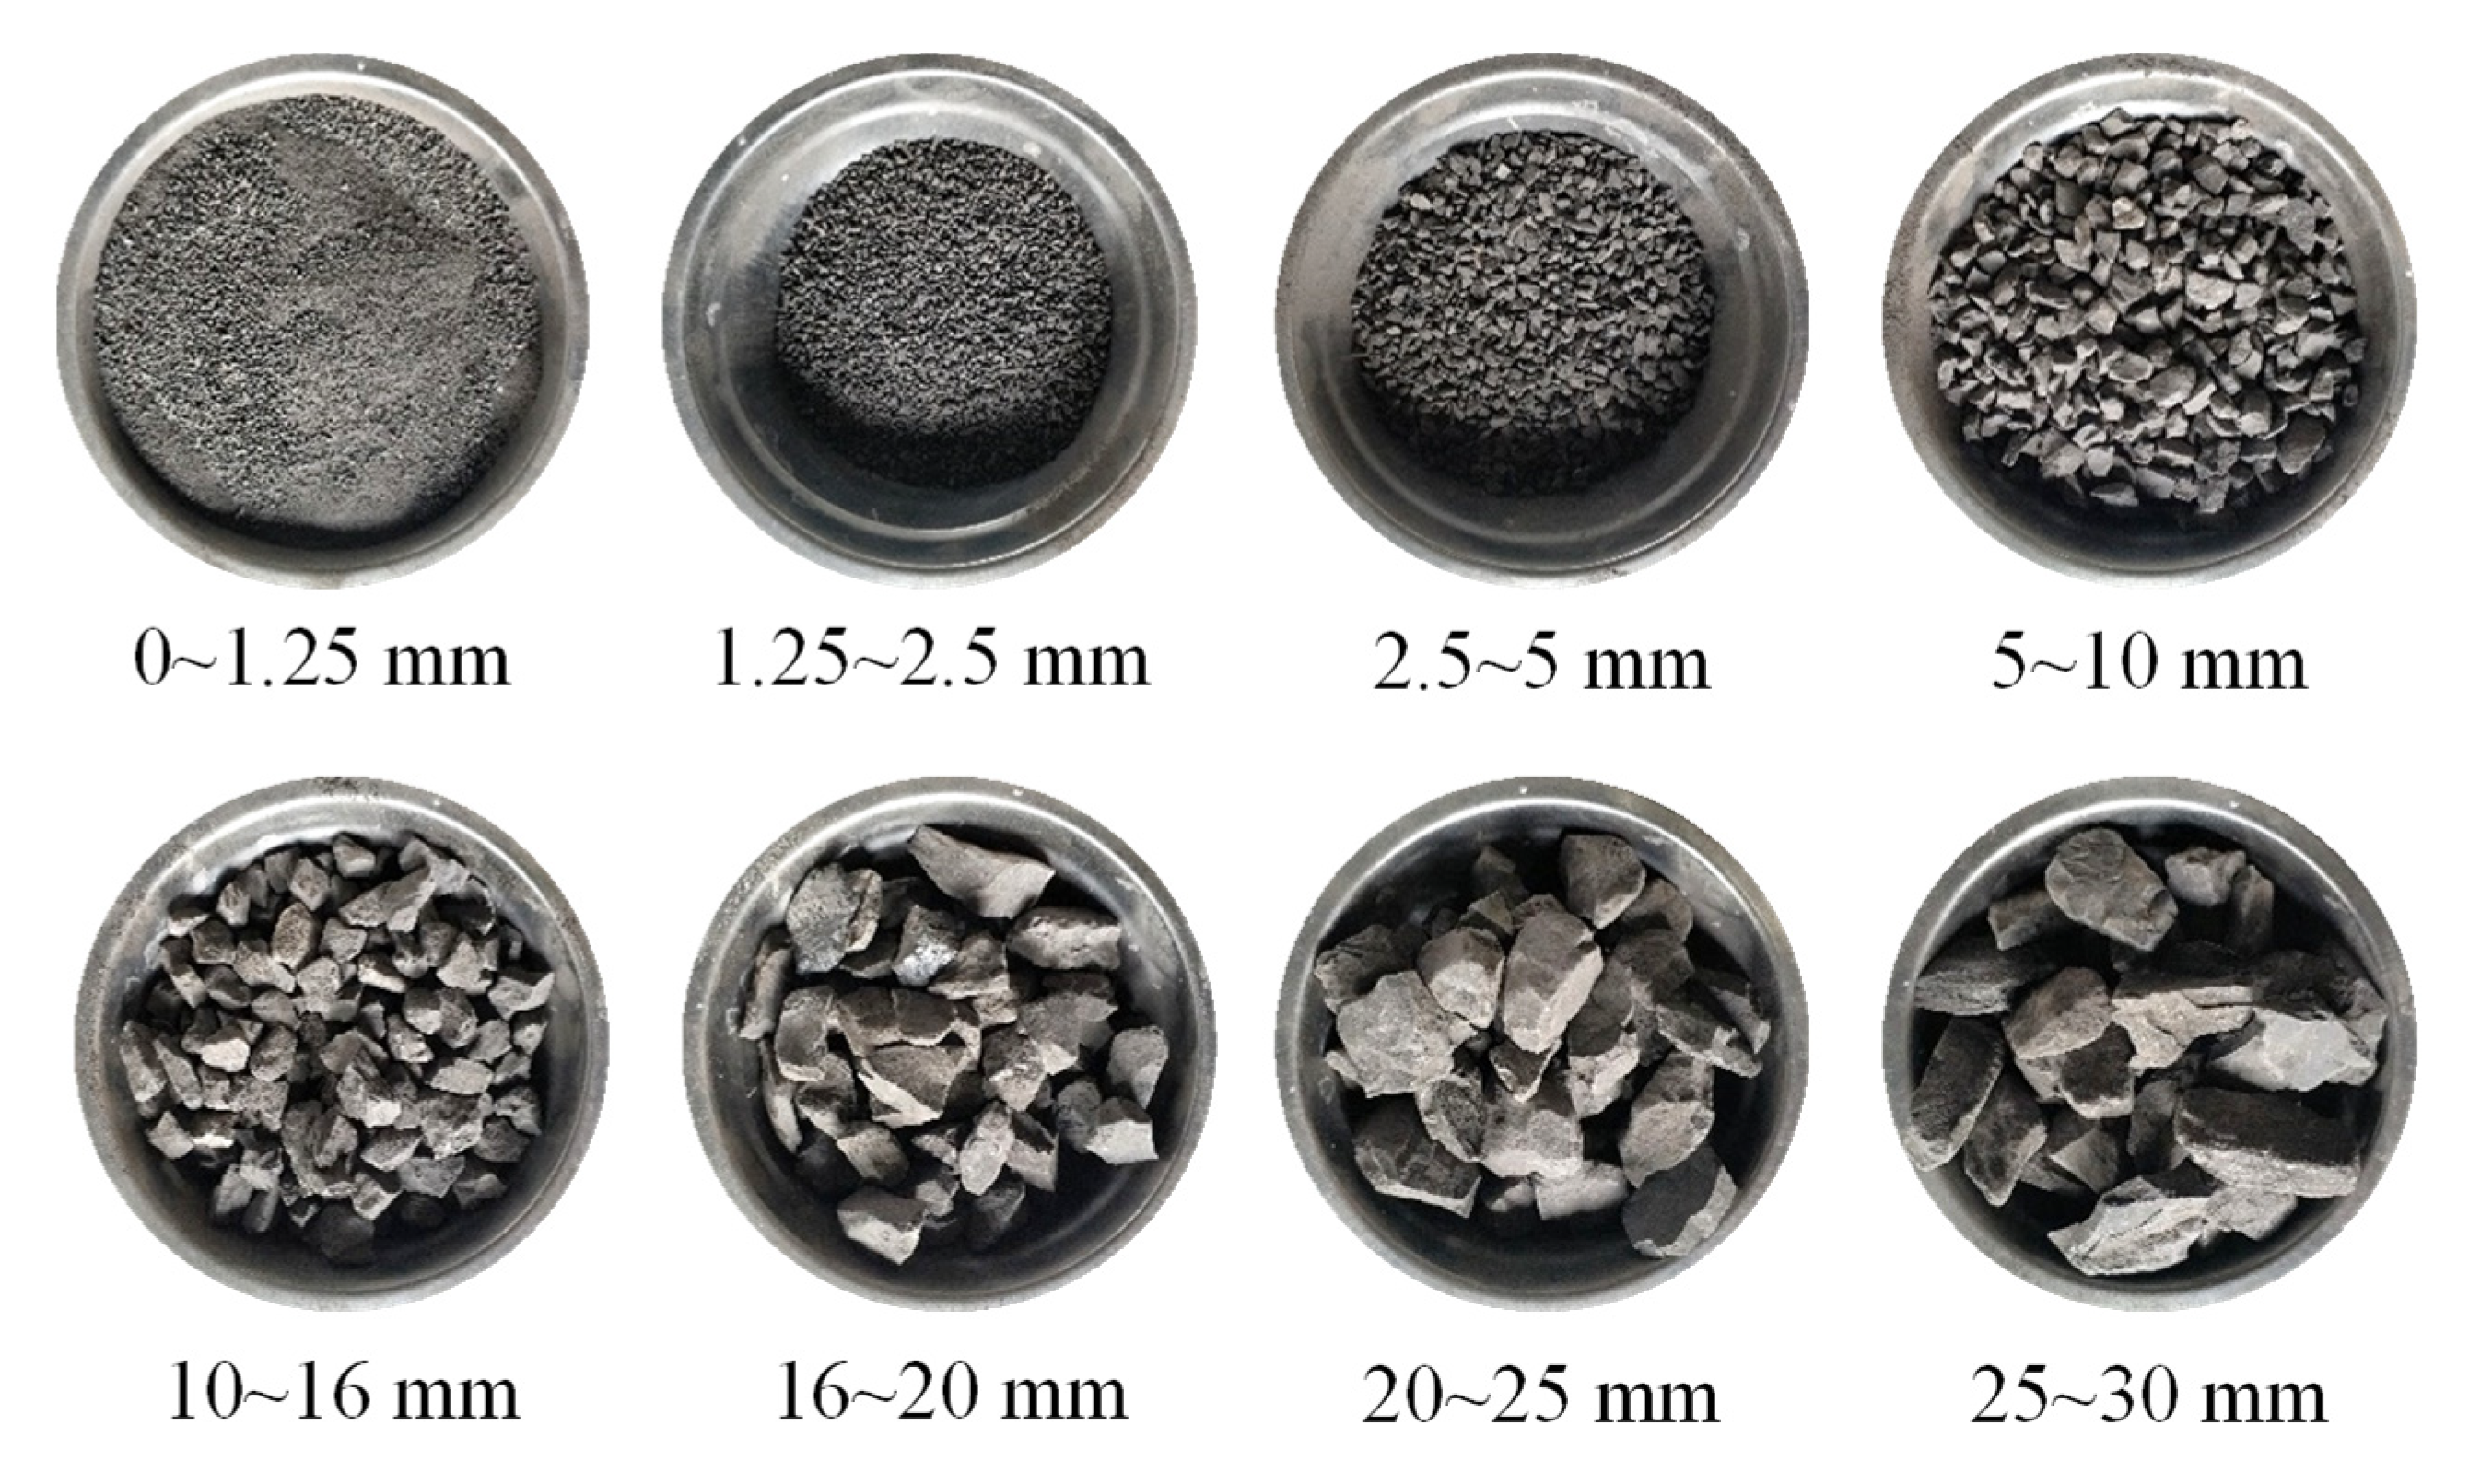
2.2. Specimen Preparation

The gangue materials used in this experiment were sampled from the underground working face of Xinjulong Coal Mine (Figure 2). To ensure the amount of the test materials, about 3 tons of raw materials were collected. The gangue was used to fill the goaf, thus dealing with the gangue waste and reducing the subsidence of the strata and ground surface. The physical and mechanical parameters of the gangue were measured, and the results show that the elastic modulus (E) was 15.21 GPa, the Poisson’s ratio (μ) was 0.28, the uniaxial compressive strength (σc) was 72.23 MPa, the density was 2530 kg/m3, and the moisture content by weight was 0.93%.
The minimum inner diameter of the steel barrel size is 200 mm. In order to reduce the boundary effect in the test, the gangue materials should be broken into particles smaller than 1/5 of the steel barrel size, that is, 30 mm particles. The specific preparation processes are as follows: (1) Weigh 12.8 kg gangue raw materials; (2) crush the raw materials into small particles less than 30 mm using a hammer or a crusher; (3) sieve the gangue particles into eight size grades (0~1.25, 1.25~2.5, 2.5~5, 5~10, 10~16, 16~20, 20~25, and 25~30 mm) and record the mass of each grading particle; (4) place the gangue specimen with different size grades into the steel barrel; and (5) complete the specimen preparation.

2.3. Experimental Scheme

The objective is to disclose the influence mechanism of the axial loading stress and the loading velocity on the compression and particle breakage behaviour of the gangue filling materials under confined lateral displacement. Considering that the coal seam in the filling working face of Xinjulong Coal Mine is about 800 m depth and the vertical ground stress at this depth is about 20 MPa, the maximum loading stress is determined to be 20 MPa in this experiment.
To carry out the experiment, the loading stress and the loading velocity are taken as the main control factors, and each main control factor is divided into 4 levels. Single-factor rotation tests are designed, and a total of 8 groups of tests are performed (Table 1). The loading stress is set at 5, 10, 15, or 20 MPa, and the loading velocity is set at 1, 5, 10, or 15 kN/s.

2.4. Experimental Procedures

To reveal the influences of loading stress and loading velocity on the compression and particle breakage behaviours of the gangue backfill materials, each test was repeated three times according to the test scheme. The mean value of the three test results was taken to eliminate test errors. Specific experimental procedures are as follows:
  • Prepare the specimen and place it into the steel barrel
The specimen preparation methods are described in Section 2.2. After each group of specimens had been thoroughly mixed with different particle sizes, they were each loaded into the steel barrel several times, and the surface of the specimens was then levelled by hand after all of them have been loaded into the steel barrel. Before loading the specimen into the steel drum, lubricant was applied to the inner wall of the steel drum to reduce the error caused by friction. The particle size grades of the specimens are illustrated in Figure 3.
2.
Weigh each specimen and record the initial height in the chamber
After the specimen was placed into the steel barrel, it was covered by the loading plate. The height of the inner chamber (H1 = 300 mm) and the thickness of the loading plate (H2 = 40 mm) are given, and the distance (H3) between the surface of the cover plate and the upper edge of the steel barrel can be measured. The initial height of the particle packing (H0) can then be calculated by the equation: H0 = H1H2H3. The values of H0 should be recorded for calculating the axial strain.
3.
Load and compress the specimen
The steel barrel was placed in the centre of the test platform; hereafter, the test was carried out according to the loading velocity designed in the test scheme. The test was stopped when the set maximum stress was reached. Loads and displacements were recorded until the specimen was unloaded. The compaction process for this test is in accordance with the Energy Industry Standard of the People’s Republic of China “Method of compaction testing of solid backfilling materials (NB/T 51019-2014)” [40].
4.
Remove the specimen and sieve the particles
After the loading process was completed, the steel barrel was disassembled to remove the specimen. The aggregates, having been compressed, were taken out and screened grade by grade. The mass of each grading particle in the specimen was recorded for subsequent analysis. Similarly, the compressed particles are classified into eight grades, i.e., 0~1.25, 1.25~2.5, 2.5~5, 5~10, 10~16, 16~20, 20~25, 25~30 mm.

3. Calculation of Compressive Deformation and Particle Breakage

3.1. Calculation Model of Gangue Compressive Deformation

The loading stress is controlled by the load when the specimen is compressed by the test machine. The loading stress in the specimen (σ) is the ratio of the axial load to the area of the cover plate. The dimensions of the plate are 200 mm × 200 mm, and the area is 0.04 m2. Therefore, the formula for calculating the loading stress is [41,42].
σ = P A
where P is the axial load upon the specimen and A is the area of the caver plate, 0.04 m2.
The axial strain (ε) generated in the specimen is the ratio of the axial displacement to the initial material height in the barrel (H0), then [43,44].
ε = Δ h H 0
In the equation, Δh is the axial displacement of the specimen after compression, and the data are collected by a test system. H0 is the initial material height that is measured after being placed in the barrel.

3.2. Quantitative Model of Gangue Particle Breakage

The breakage ratio (BM) proposed by Marsal Raúl J. [45,46] is used to calculate the change in the mass proportion of each particle group before and after compression and to quantify the breakage degree of the gangue particles before and after compression. BM is defined as the positive sum of the mass difference of each particle group before and after the test, i.e.,
B M = W k i W k f
where Wki denotes the content of the particles with a particular size grade before compression, and Wkf represents the content of the particles with such size grades after compression.

4. Results and Discussion

4.1. Compressive Deformation Evolution

Figure 4 provides the stress–strain curves of the gangue specimens in the loading process. It is observed that, as stress increases, the strain sharply increases at first and then gradually stabilizes. The deformation process of each specimen can be mainly divided into three stages: ① the rapid deformation stage, ② the slow deformation stage, and ③ the stable deformation stage.
The axial stress applied to the specimen is the immediate cause of the axial deformation of the specimen, and the loading stress is the factor directly affecting the axial strain. Theoretically, the stress–strain curves of the three specimens i-1 to i-3 partially display the stress–strain curve of Specimen i-4. It can be seen in Figure 4a that the four curves almost coincide. A good fitting effect is obtained when a logarithmic function is used to describe the stress–strain relationship of samples i-1 to i-4. The fitting equation is y = 0.074 ln(4.95x + 0.99), and the details are given in Figure 5a.
As shown in Figure 4b, the loading velocity has a significant influence on the compressive deformation of the specimen. With increasing loading velocity, the strain in the specimen increases, but it gradually stabilizes when the loading velocity is larger than 5 kN/s. Meanwhile, the corresponding stress amplitudes in stages ① and ② also increase. This is mainly because, under a small loading velocity, the relative movement among the particles is relatively slow, a stable contact structure can be easily generated, and the supporting force of the specimen is increased as a whole. However, under a large loading velocity the relative movement becomes faster due to the impact effect, which destroys the contact structures among the particles and increases the overall deformation of the specimen. When the loading velocity is larger than 5 kN/s, its influence on the overall deformation of the specimen is gradually weakened. Therefore, the loading velocity of 5 kN/s can cause greater damage to the contact structures among the particles. A logarithmic function is used to describe the relationship between loading velocity and strain (at the stress level of 20 MPa). The fitting equation is y = 0.0085 ln(x − 0.98) + 0.37, as illustrated in Figure 5b.
Generally, the loading stress directly affects the axial strain of the gangue specimen, and the axial strain gradually increases with loading velocity and eventually stabilizes.

4.2. Particle Breakage Evolution

Figure 6 shows the accumulated mass proportions of the particles in different size grades and the mass change of each grading particle before and after compressive loading.
Figure 6a highlights the significant effects of loading stress on particle breakage. When increasing loading stress, the shaded area between the cumulative content curves of the particles before and after compression remarkably increases. The curve for the specimen after compression tends to gradually become smooth, indicating that the particle content of each specimen becomes more uniform and continuous and that there is a better effect of particle breakage in the specimen. In the process of axial compression, when the loading stress increases, particles with a size of 16~20 mm are first crushed in large quantities (at the stress level of 5 MPa), and their CPPAC reaches −65.29%. During this period, particles with a size of more than 20 mm have a stronger bearing capacity than those of 16~20 mm. A large number of gangue particles with a particle size larger than 20 mm are crushed when the loading stress is equal to or greater than 10 MPa. Under the loading stress of 20 MPa, lots of particles over 20 mm are crushed, which compensates for the consumption of particles with a size of 16~20 mm and causes the particles with a size of 0~1.25 mm to have the maximal CPPAC (174.74%).
Figure 6b shows that the loading velocity has a limited influence on the degree of particle breakage, but it regulates the particle size distribution of the specimen after compression to a certain degree. Holding the maximum loading stress at 20 MPa, the cumulative content curves of the specimens under different loading velocities are smooth, and the distribution tendency of the CPPAC is the same for different specimens, that is, the CPPAC is always largest for the particles with a size of 0~1.25 mm and smallest for particles with a size of 25~30 mm. However, as loading velocity increases, the gangue particles are subject to a higher impact effect; the contact structures among the particles are damaged and the amount of crushed particles also increases. Taking the particles of 0~1.25 mm as an example, when the loading velocity increases from 1 kN/s to 15 kN/s, the CPPAC grows from 175.14% to 187.47%, with an increment of 7.04%. On the contrary, regarding the particles with the size of 16~20 mm, the CPPAC declines from −16.16% to −44.86% and the change amplitude is 177.59%.
The breakage ratio (BM) is used to quantify the breakage degree of the gangue particles. With the increase in loading stress and loading velocity, the BM of gangue filling materials rapidly increases at first and then stabilizes. Therefore, a better fit can be obtained when logarithmic functions are used to describe the relationships between the breakage ratio and loading stress and between the breakage ratio and loading velocity. The fitting equations are y = 5.07 ln(1.88x + 0.99) and y = 41.76 ln(0.013x + 1.52), respectively, as depicted in Figure 7.
In general, the loading stress greatly affects the particle breakage, and the degree of breakage will continue to increase with an increased loading velocity when the maximum loading stress remains unchanged.
By combining the loading stress and loading velocity to explain their influences on the compressive deformation and particle breakage of the waste rock specimens, it can be deduced that both the axial strain and the particle breakage ratio have a logarithmic functional relationship with these two main control factors. The breakage degree of the waste rock filling materials is therefore closely linked to the compressive deformation under loading. The linear fitting equation for the axial strain and the breakage ratio is y = 54.83x − 0.45. The correlation coefficient (R2) is 0.9771, suggesting a highly linear relationship, as depicted in Figure 8.

5. Conclusions

Laboratory experiment procedures were designed to quantify the influence of loading stress and velocity on the deformation and particle breakage behaviour of the gangue backfill materials. Factors that lead to these influences were also analysed. The following conclusions can be drawn:
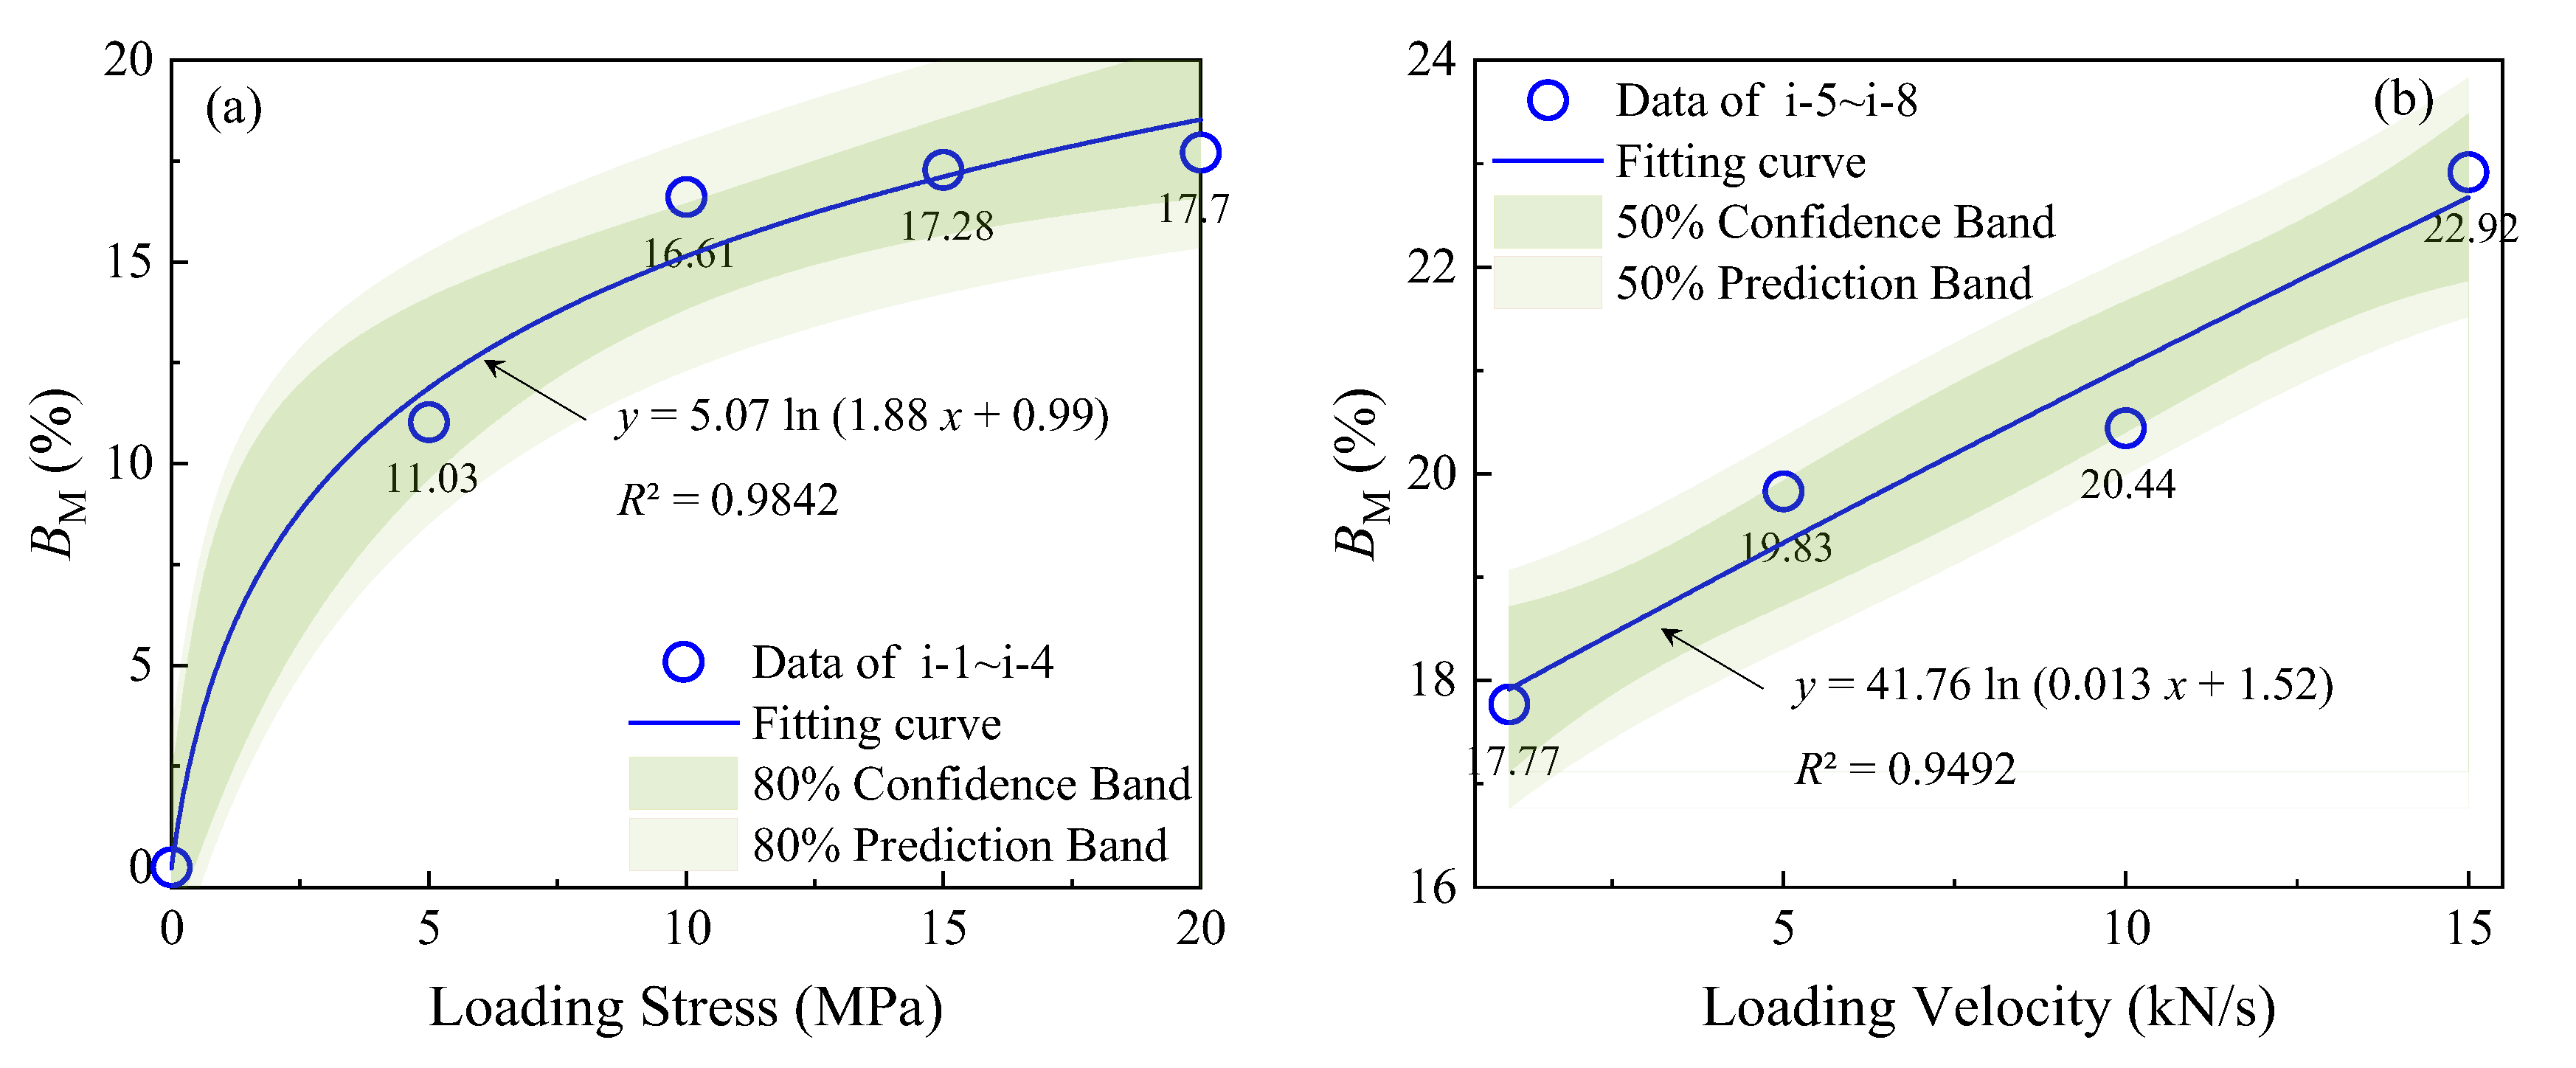
  • Loading stress and strain have a logarithmic relationship. Increasing the loading velocity destroys the contact structures among the gangue particles and leads to a larger deformation of gangue filling materials.
  • With the increase in stress, the particles of 16~20 mm size were the first to be crushed in large quantities, and their CPPAC reached −65.29%. At this time, the large-size gangue particles above 20 mm showed a stronger bearing capacity, and were mainly crushed after a loading stress greater than 10 MPa.
  • Further increasing the loading velocity increases the breakage of the gangue filling materials. The particle breakage ratio has a logarithmic functional relationship with the loading velocity.
  • The compression deformation of gangue backfill materials and particle breakage has a high correlation. When ground stress is lower than 5 MPa, the content of coarse particles should be increased to enhance the bearing capacity of the backfill body. When the ground stress is higher than 10 MPa, the content of fine particles should be increased to reduce the particle fragmentation rate.

Author Contributions

Conceptualization, Y.G. and J.Z.; methodology, M.L.; validation, Y.G. and L.S.; investigation, P.L.; resources, L.S.; data curation, Y.G.; writing—original draft preparation, Y.G.; writing—review and editing, Y.G., W.T. and P.L.; supervision, J.Z. and W.T.; funding acquisition, J.Z., M.L. and W.T. All authors have read and agreed to the published version of the manuscript.

Funding

This research was funded by the National Science Fund for Distinguished Young Scholars [grant number 51725403]; the National Natural Science Foundation of China [grant number 52004271]; the China Postdoctoral Science Foundation [grant number 2021M693417]; the Jiangsu Postdoctoral Research Funding Program [grant number 2021K039A]; the Postgraduate Research & Practice Innovation Program of Jiangsu Province [KYCX22_2611]; and the Graduate Innovation Program of China University of Mining and Technology [grant number 2022WLKXJ005].

Data Availability Statement

The original contributions presented in the study are included in the article. Further inquiries can be directed to the corresponding author.

Acknowledgments

The authors would like to acknowledge the support of the Xinjulong Coal Mine for the specimen collection.

Conflicts of Interest

The authors declare no conflict of interest.

References

  1. Bhuiyan, M.A.H.; Parvez, L.; Islam, M.A.; Dampare, S.B.; Suzuki, S. Heavy metal pollution of coal mine-affected agricultural soils in the northern part of Bangladesh. J. Hazard. Mater. 2010, 173, 384–392. [Google Scholar] [CrossRef]
  2. Shi, J.; Huang, W.; Han, H.; Xu, C. Pollution control of wastewater from the coal chemical industry in China: Environmental management policy and technical standards. Renew. Sustain. Energy Rev. 2021, 143, 110883. [Google Scholar] [CrossRef]
  3. MacCausland, A.; McTammany, M.E. The impact of episodic coal mine drainage pollution on benthic macroinvertebrates in streams in the Anthracite region of Pennsylvania. Environ. Pollut. 2007, 149, 216–226. [Google Scholar] [CrossRef]
  4. Fernández, P.R.; Granda, G.R.; Krzemień, A.; Cortés, S.G.; Valverde, G.F. Subsidence versus natural landslides when dealing with property damage liabilities in underground coal mines. Int. J. Rock Mech. Min. 2020, 126, 104175. [Google Scholar] [CrossRef]
  5. Wang, B.; Xu, J.; Xuan, D. Time function model of dynamic surface subsidence assessment of grout-injected overburden of a coal mine. Int. J. Rock Mech. Min. 2018, 104, 1–8. [Google Scholar] [CrossRef]
  6. Zheng, L.; Chen, X.; Dong, X.; Wei, X.; Jiang, C.; Tang, Q. Using δ34S–SO4 and δ18O–SO4 to trace the sources of sulfate in different types of surface water from the Linhuan coal-mining subsidence area of Huaibei, China. Ecotoxicol. Environ. Saf. 2019, 181, 231–240. [Google Scholar] [CrossRef]
  7. Guo, S.; Zhang, J.; Li, M.; Zhou, N.; Song, W.; Wang, Z.; Qi, S. A preliminary study of solid-waste coal gangue based biomineralization as eco-friendly underground backfill material: Material preparation and macro-micro analyses. Sci. Total Environ. 2021, 770, 145241. [Google Scholar] [CrossRef]
  8. Liang, Y.; Liang, H.; Zhu, S. Mercury emission from spontaneously ignited coal gangue hill in Wuda coalfield, Inner Mongolia, China. Fuel 2016, 182, 525–530. [Google Scholar] [CrossRef]
  9. Capasso, I.; Lirer, S.; Flora, A.; Ferone, C.; Cioffi, R.; Caputo, D.; Liguori, B. Reuse of mining waste as aggregates in fly ash-based geopolymers. J. Clean. Prod. 2019, 220, 65–73. [Google Scholar] [CrossRef]
  10. Barreto, L.; Ghisi, E.; Godoi, C.; Oliveira, F. Reuse of ornamental rock solid waste for stabilization and solidification of galvanic solid waste: Optimization for sustainable waste management strategy. J. Clean. Prod. 2020, 275, 122996. [Google Scholar] [CrossRef]
  11. Castro-Gomes, J.P.; Silva, A.P.; Cano, R.P.; Durán Suarez, J.; Albuquerque, A. Potential for reuse of tungsten mining waste-rock in technical-artistic value added products. J. Clean. Prod. 2012, 25, 34–41. [Google Scholar] [CrossRef]
  12. Miao, X.; Zhang, J.; Feng, M. Waste-filling in fully-mechanized coal mining and its application. J. China Univ. Min. Technol. 2008, 18, 479–482. [Google Scholar] [CrossRef]
  13. Zhang, J.; Zhou, N.; Huang, Y.; Zhang, Q. Impact law of the bulk ratio of backfilling body to overlying strata movement in fully mechanized backfilling mining. J. Min. Sci. 2011, 47, 73–84. [Google Scholar] [CrossRef]
  14. Huang, Y.; Zhang, J.; Zhang, Q.; Nie, S. Backfilling technology of substituting waste and fly ash for coal underground in china coal mining area. Environ. Eng. Manag. J. 2011, 10, 769–775. [Google Scholar] [CrossRef]
  15. Deng, X.; Li, Y.; Wang, F.; Shi, X.; Yang, Y.; Xu, X.; Huang, Y.; de Wit, B. Experimental study on the mechanical properties and consolidation mechanism of microbial grouted backfill. Int. J. Min. Sci. Technol. 2022, 32, 271–282. [Google Scholar] [CrossRef]
  16. Pappas, D.M.; Mark, C. Behavior of Simulated Longwall Gob Material; US Department of the Interior, Bureau of Mines: Washington, DC, USA, 1993.
  17. Arasteh, H.; Saeedi, G.; Farsangi, M.A.E.; Esmaeili, K. A New Model for Calculation of the Plastic Compression Index and Porosity and Permeability of Gob Materials in Longwall Mining. Geotech. Geol. Eng. 2020, 38, 6407–6420. [Google Scholar] [CrossRef]
  18. Benarchid, Y.; Taha, Y.; Argane, R.; Benzaazoua, M. Application of Quebec recycling guidelines to assess the use feasibility of waste rocks as construction aggregates. Resour. Policy 2018, 59, 68–76. [Google Scholar] [CrossRef]
  19. Arulrajah, A.; Ali, M.M.Y.; Disfani, M.M.; Piratheepan, J.; Bo, M.W. Geotechnical Performance of Recycled Glass-Waste Rock Blends in Footpath Bases. J. Mater. Civ. Eng. 2013, 25, 653–661. [Google Scholar] [CrossRef]
  20. Arulrajah, A.; Ali, M.M.Y.; Piratheepan, J.; Bo, M.W. Geotechnical Properties of Waste Excavation Rock in Pavement Subbase Applications. J. Mater. Civ. Eng. 2012, 24, 924–932. [Google Scholar] [CrossRef]
  21. Hane, I.; Belem, T.; Benzaazoua, M.; Maqsoud, A. Laboratory Characterization of Cemented Tailings Paste Containing Crushed Waste Rocks for Improved Compressive Strength Development. Geotech. Geol. Eng. 2017, 35, 645–662. [Google Scholar] [CrossRef]
  22. Zhang, J.; Li, M.; Liu, Z.; Zhou, N. Fractal characteristics of crushed particles of coal gangue under compaction. Powder Technol. 2017, 305, 12–18. [Google Scholar] [CrossRef]
  23. Li, J.; Huang, Y.; Pu, H.; Gao, H.; Li, Y.; Ouyang, S.; Guo, Y. Influence of block shape on macroscopic deformation response and meso-fabric evolution of crushed gangue under the triaxial compression. Powder Technol. 2021, 384, 112–124. [Google Scholar] [CrossRef]
  24. Salguero, F.; Grande, J.A.; Valente, T.; Garrido, R.; de la Torre, M.L.; Fortes, J.C.; Sánchez, A. Recycling of manganese gangue materials from waste-dumps in the Iberian Pyrite Belt—Application as filler for concrete production. Constr. Build. Mater. 2014, 54, 363–368. [Google Scholar] [CrossRef]
  25. Li, M.; Li, A.; Zhang, J.; Huang, Y.; Li, J. Effects of particle sizes on compressive deformation and particle breakage of gangue used for coal mine goaf backfill. Powder Technol. 2020, 360, 493–502. [Google Scholar] [CrossRef]
  26. Li, M.; Zhang, J.; Guo, Y.; Pu, H.; Peng, Y. Influence of particle size distribution on fractal characteristics of waste rock backfill materials under compression. J. Mater. Res. Technol. 2022, 20, 2977–2989. [Google Scholar] [CrossRef]
  27. Ma, D.; Duan, H.; Zhang, J.; Liu, X.; Li, Z. Numerical Simulation of Water–Silt Inrush Hazard of Fault Rock: A Three-Phase Flow Model. Rock Mech. Rock Eng. 2022, 55, 5163–5182. [Google Scholar] [CrossRef]
  28. Ma, L.; Sun, H.; Ngo, I.; Han, J. Infrared radiation quantification of rock damage and its constitutive modeling under loading. Infrared Phys. Technol. 2022, 121, 104044. [Google Scholar] [CrossRef]
  29. Ma, D.; Duan, H.; Zhang, J. Solid grain migration on hydraulic properties of fault rocks in underground mining tunnel: Radial seepage experiments and verification of permeability prediction. Tunn. Undergr. Space Technol. 2022, 126, 104525. [Google Scholar] [CrossRef]
  30. Ma, D.; Duan, H.; Zhang, J.; Bai, H. A state-of-the-art review on rock seepage mechanism of water inrush disaster in coal mines. Int. J. Coal Sci. Technol. 2022, 9, 50. [Google Scholar] [CrossRef]
  31. Zhang, Y.; Feng, G.; Qi, T.; Lusquiños, F. Experimental Research on Internal Behaviors of Caved Rocks under the Uniaxial Confined Compression. Adv. Mater. Sci. Eng. 2017, 2017, 6949264. [Google Scholar] [CrossRef]
  32. Wang, L.; Yin, M.; Kong, H.; Zhang, H. Experimental Study on Breakage Characteristics and Energy Dissipation of the Crushed Rock Grains. KSCE J. Civ. Eng. 2022, 26, 1465–1478. [Google Scholar] [CrossRef]
  33. Liu, H.; Zhang, J.; Li, B.; Zhou, N.; Li, D.; Zhang, L.; Xiao, X. Long term leaching behavior of arsenic from cemented paste backfill made of construction and demolition waste: Experimental and numerical simulation studies. J. Hazard. Mater. 2021, 416, 125813. [Google Scholar] [CrossRef] [PubMed]
  34. Ma, L.; Khan, N.M.; Cao, K.; Rehman, H.; Salman, S.; Rehman, F.U. Prediction of Sandstone Dilatancy Point in Different Water Contents Using Infrared Radiation Characteristic: Experimental and Machine Learning Approaches. Lithosphere 2021, 4, 3243070. [Google Scholar] [CrossRef]
  35. Qi, W.; Huang, Y.; He, H.; Zhang, J.; Li, J.; Qiao, M. Potential Pollution of Groundwater by Dissolution and Release of Contaminants due to Using Gangue for Backfilling. Mine Water Environ. 2019, 38, 281–293. [Google Scholar] [CrossRef]
  36. Liu, H.; Zhang, J.; Li, B.; Zhou, N.; Xiao, X.; Li, M.; Zhu, C. Environmental behavior of construction and demolition waste as recycled aggregates for backfilling in mines: Leaching toxicity and surface subsidence studies. J. Hazard. Mater. 2020, 389, 121870. [Google Scholar] [CrossRef]
  37. Ma, L.; Xu, Y.; Ngo, I.; Wang, Y.; Zhai, J.; Hou, L. Prediction of Water-Blocking Capability of Water-Seepage-Resistance Strata Based on AHP-Fuzzy Comprehensive Evaluation Method—A Case Study. Water 2022, 14, 2517. [Google Scholar] [CrossRef]
  38. Qi, W.; Zhang, J.; Zhang, Q.; Liguori, B. Compression of Aggregates of Acid-Leached Coal Gangues: Implications for Coal Mine Backfill. Adv. Mater. Sci. Eng. 2018, 2018, 7056430. [Google Scholar] [CrossRef] [Green Version]
  39. JGJ 52-2006; Standard for Technical Requirements and Test Method of Sand and Crushed Stone (or Gravel) for Ordinary Concrete. Industry Standard of the People’s Republic of China: Bejing, China, 2007.
  40. NB/T 51019-2014; Energy Industry Standards of the People’s Republic of China; Method of Compaction Testing of Solid Backfilling Materials. National Energy Administration: Bejing, China, 2014.
  41. Zhou, N.; Han, X.; Zhang, J.; Li, M. Compressive deformation and energy dissipation of crushed coal gangue. Powder Technol. 2016, 297, 220–228. [Google Scholar] [CrossRef]
  42. Li, M.; Zhang, J.; Huang, P.; Gao, R. Mass ratio design based on compaction properties of backfill materials. J. Cent. South Univ. 2016, 23, 2669–2675. [Google Scholar] [CrossRef]
  43. Li, M.; Zhang, J.; Zhou, N.; Huang, Y. Effect of Particle Size on the Energy Evolution of Crushed Waste Rock in Coal Mines. Rock Mech. Rock Eng. 2017, 50, 1347–1354. [Google Scholar] [CrossRef]
  44. Yan, H.; Zhang, J.; Wang, J.; Zhou, N.; Zhang, S. Multi-fractal characteristics of particle size distribution of granular backfilling materials under different loads. Mater. Test. 2018, 60, 202–208. [Google Scholar] [CrossRef]
  45. Marsal, R.J. Large Scale Testing of Rockfill Materials. J. Soil Mech. Found. Div. 1967, 93, 27–43. [Google Scholar] [CrossRef]
  46. Hardin, B.O. Crushing of soil particles. J. Geotech. Eng. 1985, 111, 1177–1192. [Google Scholar] [CrossRef]
Figure 1. Compressive loading module and the test system.
Applsci 12 11175 g001
Figure 2. Specimen collection site and gangue particles: (a) is the location of the specimen collection site for Xinjulong coal mine; (b) is a schematic diagram for the application of gangue in the working face; (c) is the original specimen collected; and (d) is the gangue specimen in the test of this paper.
Applsci 12 11175 g002
Figure 3. Gangue particles with different sizes.
Applsci 12 11175 g003
Figure 4. Stress–strain curves of the specimens during the test: (a) is the stress–strain curve for specimens i-1 to i-4; (b) is the stress–strain curve for specimens i-5 to i-8.
Applsci 12 11175 g004
Figure 5. Fitting curves between the main control factors and strain: (a) is the fitted curve of loading stress with strain for specimens i-1 to i-4; (b) is the fitted curve of loading velocity with strain for specimens i-5 to i-8.
Applsci 12 11175 g005
Figure 6. Mass percentage change in particles in different size grades before and after compression graph. CPPAC is the change of particle percentage after compression. If n is the initial mass of the particles in a particular size grade before compression, and m is the mass of the particles in such size grade after compression, then CPPAC = (m − n)/n × 100%. (a) is a graph for specimens i-1 to i-4; (b) is a graph for specimens i-5 to i-8.
Applsci 12 11175 g006
Figure 7. Trend of breakage ratio (BM) with main control factors: (a) is the trend of BM with loading stress for specimens i-1 to i-4; (b) is the trend of BM with loading velocity for specimens i-5 to i-8.
Applsci 12 11175 g007
Figure 8. The fitting relationship between the breakage ratio and the strain.
Applsci 12 11175 g008
Table 1. Single-factor rotation test scheme.
Main Control FactorNumbered SpecimenLoading StressLoading Velocity
Loading stressi-15 MPa1 kN/s
i-210 MPa
i-315 MPa
i-420 MPa
Loading velocityi-520 MPa1 kN/s
i-65 kN/s
i-710 kN/s
i-815 kN/s
Publisher’s Note: MDPI stays neutral with regard to jurisdictional claims in published maps and institutional affiliations.

