Featured Application
Resource and environmental effects of the Tibetan Plateau.
Abstract
Fast and slow earthquakes are predominantly generated along faults constituting active plate boundaries. Characterized by repeated devastating earthquakes and frequent slow slip events and tremors, the Alaska megathrust presents a chance to understand the complicated dynamics of a subduction system changing from steep to shallow dips associated with enigmatically abundant fast and slow seismic events. Based on three-dimensional thermal modeling, we find that the downgoing metamorphosed oceanic crust containing bound water releases a large amount of fluid and causes the recurrence of fast and slow earthquakes by elevated pore fluid pressure and hydrofracturing. The seismogenic interface and the slow slip events (SSEs) identified beneath the Upper Cook Inlet coincide well with the slab metamorphic dehydration regions. The observed slow earthquakes with quasi-stable fault slips preferentially occur, accompanied by high dehydration and temperature downdip along the transition zone.
1. Introduction
Seismic events in a subduction zone are strongly related to its thermal structure. The eastern Aleutian Islands, Alaska Peninsula (southwestern Alaska) and south-central Alaska represent seismically devastating subduction zones constituting an active plate margin with geological and structural complexities under high earthquake risk and are linked to various tectonic processes [1]. The composition of the downgoing oceanic crust beneath Alaska is heterogeneous and varies along strike with distinct topographic features (Figure 1). The contrasting slab morphologies between southwestern and south-central Alaska depend on the effects of variable dynamic, kinematic and geometric factors (e.g., [2]). Southwestern Alaska features active volcanism and abundant seismicity, which extends westward to the Aleutian Islands above a steeply subducting oceanic crust [3,4,5]. Wei et al. [6] have found that the seismic events and arc magmatism occurring here show a trend of along-strike variation. South-central Alaska exhibits a corner geometry in map view (e.g., [7,8]), where the oceanic plate is bounded to the east by the Queen Charlotte-Fairweather transform system [9]. The Yakutat block, a subducted oceanic plateau rafted to its current location by the motion of the Pacific plate for at least 23 Myr [10], is subducted 600 km inland of the trench [9] with a thick oceanic crust [11]. In the mantle wedge, the back-arc low-velocity zone extends to depths of 100–150 km, implying that the downward-moving oceanic plate releases fluid/melts into the mantle wedge through dehydration processes, and the mafic magma is then transferred into the wedge [3,5,12]. Furthermore, the distribution of volcanoes and the associated arc magmatism in south-central Alaska are thought to be controlled by overlying and subducting plates [13].
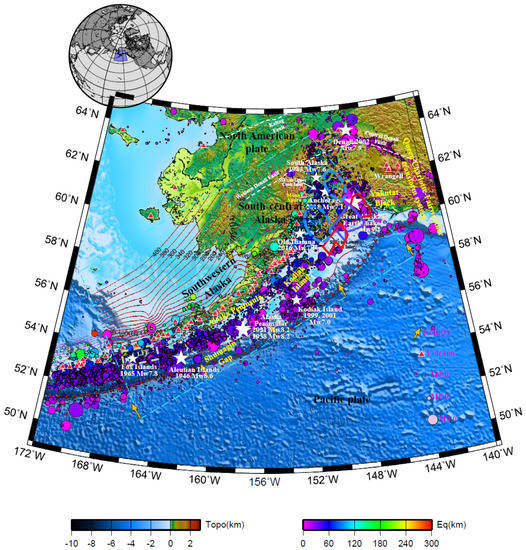
Figure 1.
Tectonic map. The color indicates surface topography (ETOPO, [14]). The light blue dotted line marks the model area. The yellow arrows denote the direction (orientation) and velocity (length) of subduction, and the red barbed lines mark convergent plate boundaries (with the teeth on the overriding plate). The red curves represent the isodepth contours of the subducted Pacific plate with a contour interval of 20 km (Slab 2.0, [15]). Red triangles indicate arc volcanoes [16]. The colored spheres all indicate M > 3 earthquakes (IRIS) from 1 January 2000 to December 2010 and all M > 5.5 earthquakes from 1 January 1900 to December 2000 (Centennial Database). Earthquake magnitudes are indicated by sphere color. The blue ellipses with dashed lines represent the slow slip event patches in the Upper Cook (2008−2012, [17]) and Lower Cook Inlets (2010−2011, [18]). Green areas show the distribution of deep tremors [19]. The green dashed line indicates low-frequency earthquakes [20]. Bold blue bold lines indicate the 1992.0–2004.8 (~M 7.8) Slow Slip Event, and bold red lines indicate the 2009.85–2011.81 (~M 7.2) Slow Slip Event [21,22]. The white dashed lines indicate the Kaltag Fault and Western-Central Denali Fault [23].
Numerous large earthquakes have historically occurred in Alaska, such as the Mw9.2 Great Alaskan earthquake of 1964, the Mw8.6 Aleutian Islands earthquake of 1946, and the Mw 8.2 Alaska Peninsula earthquakes of 1938 and 2021 (Figure 1). After four minutes and thirty-eight seconds, The Great Alaskan Earthquake (Mw9.2) is recognized as the second-most powerful earthquake in recorded world history, during which 970 km of the fault ruptured and moved up to 18 m, and an 8.2 m tsunami destroyed the village of Chenega and caused damage as far away as Hawaii and Japan (Tsunami Research Group, 2015).
In regard to recent GPS observations, slow slip events (SSEs, [24]) in south-central Alaska are segmented due to along-strike variations in plate coupling, such as the SSE patches in the Upper Cook [17,25,26] and Lower Cook Inlets [18]. Deep tremors are estimated to occur in south-central Alaska (e.g., [19,27]) (Figure 1). The segmentation is probably related to the along-strike variations in the effective normal stress on the fault plane due to fluid release from the subducting Yakutat Plateau [21]. Slip pulses that have been identified from GPS site velocities in south-central Alaska are generally associated with the tremor bursts during the 5-year transient events from 2009 to 2013 [28].
Recently, Iwamoto et al. [29] constructed a 3-D thermomechanical model to investigate the thermal structure beneath the south-central Alaska subduction zone. They found that the thicker and higher water content of the Yakutat terrane resulted in tectonic tremors that occurred on the surface of the subducted terrane. However, compared to south-central Alaska, the southwestern Alaska subduction zone has different slab morphologies, and its thermal structure remains enigmatic. Therefore, we developed a large-scale 3-D thermomechanical model to investigate both the south-central and southwestern Alaska subduction zones. This study attempted to focus on the thermal state and water content distribution of the slab, which are compared with the observed occurrences of fast and slow earthquakes in Alaska. In this context, we explored the relationship between the slab dewatering regime and fast and slow earthquakes in Alaska using high-resolution, three-dimensional thermomechanical experiments.
2. Methods and Models
A three-dimensional thermomechanical model originally developed from Stag3D [30] was employed in this study. The subducted oceanic plate geometry followed Slab2 [15]. The subduction direction in the central Aleutians changed from normal to right-lateral strike-slip faulting along the surface of the Queen Charlotte-Fairweather fault system, which underwent strike-slip-dominated deformation [4,9]. The current convergent velocity and direction were obtained from MORVEL [31,32]. The data were deposited into the TPDC repository, which has been granted a persistent identifier https://data.tpdc.ac.cn/en/disallow/8b266d22-fea7-4259-9a5f-8ac0bd9e7869/ (accessed on 4 December 2020).
The model is prescribed with a size of 1600 × 800 × 400 km (width × length × depth) (Figure 2), and the node number is 80 × 80 × 100. The incoming oceanic plate is composed of a MORB layer at the top with a thickness of 7 km and is underlain by an ultramafic rock layer [33]. Moreover, the downgoing lithosphere geometry was kinematically prescribed without slab surface deformation, and the density and viscosity of each layer (e.g., upper crust, lower crust, subducted slab, mantle lithosphere, and asthenosphere for continent and ocean, etc.) remains constant (e.g., Tables in Supplementary Materials). The spatial distribution of ocean seafloor ages followed that from EarthByte [34]. Viscous decoupling was not included in the megathrust due to the uncertainty of frictional heating [35]. The calculation used the plate cooling model [36] with a temperature of 1100 °C at the base of the lithosphere and a mantle temperature of 1400 °C [36,37]. The slab H2O content was calculated for P–T conditions computed from phase diagrams (e.g., [33,38]). The thickness of the oceanic lithosphere was specified according to its age [39]. Because subduction in south-central Alaska has occurred since at least 160 Ma [40,41], we prescribed the subduction time to be at least ≥20 Myr to ensure that the oceanic lithosphere reached a steady state with time, where the temperature variation was less than 0.1% with a lapse in time of ≥5 Myr. The composite model settings, including the model configuration, initial and boundary conditions, and physical parameters, are illustrated in the Supplemental Information.
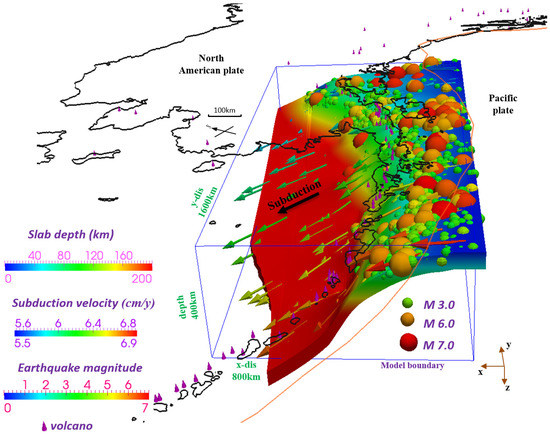
Figure 2.
Model size and setting (including slab depth and subduction velocity). Colored spheres indicate the earthquakes cataloged in Figure 1. The plotted seismic events are less than 2 km above the interface. The earthquake symbol size mimics the average rupture dimensions for a given magnitude. The colored spheres indicate all M > 3 earthquakes (IRIS) from 1 January 2000 to December 2010 and all M > 5.5 earthquakes from 1 January 1900 to December 2000 (Centennial Database).
The modeling results are constrained by observations of the surface heat flow from the global heat flow database [42] and the estimates of the Curie depth [43] along parallel profiles across the arc (Figures S1 and S2). Our model follows the trench temperature boundary of the plate cooling model [36,37]. We tested the resolution and found that the average temperature variance was <1% with a maximum temperature variance of <1.9% between 80 × 80 × 100 and 96 × 96 × 100 meshes. We performed sensitivity tests to investigate the robustness of our modeling results and varied the mantle viscosity from 1.0 × 10¹⁹ Pa s to 1.0 × 10²¹ Pa s and the mantle density from 3250 to 3350 kg/m3. We present the benchmark model results as deviations from the reference models (ΔT and ΔH2O) and show these results at different depth levels within the oceanic slab. The tests show that mantle density variations (±50 kg/m3) induce small temperature variations of ~10 °C at depth.
3. Results
3.1. Three-Dimensional Slab Thermal Regime
The 3-D slab thermal state of the subducting plate is compared with the spatial distribution of seismic events according to the temperature distribution of the plate’s inner surface at different vertical distances. Figure 3a exhibits the temperature structure of the incoming plate and the earthquake distribution near the subduction interface with a resolution of 20 × 10 × 4 km (width × length × depth). The temperature distribution on internal surfaces of the dipping oceanic lithosphere is measured vertically downward from the plate interface at different vertical distances (Figure 3): 0, 4, and 8 km. The comparison between different intraslab depths allowed us to further evaluate the slab geometry-dependent thermal regime.
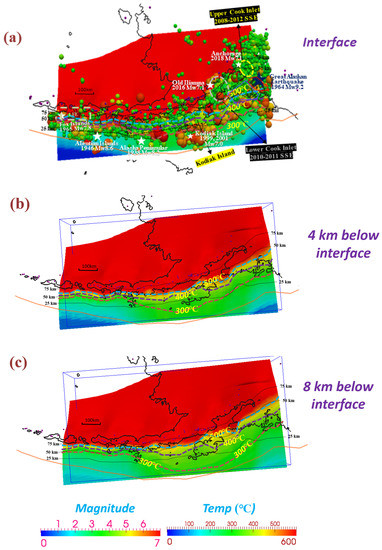
Figure 3.
Slab temperatures were calculated vertically below the interface at depths of (a) 0, (b) 4, and (c) 8 km. The black dashed lines represent the interface isodepth contours of 25, 50, and 75 km. The yellow and gray dashed circles represent the slow slip event patches in the Upper Cook (2008–2012, [17]) and Lower Cook Inlets (2010–2011, [18]). The green dashed line indicates low-frequency earthquakes [20]. Bold blue lines indicate the 1992.0–2004.8 (~M 7.8) Slow Slip Event, and bold red lines indicate the 2009.85–2011.81 (~M 7.2) Slow Slip Event [21,22]. The blue, purple, and dark red dashed lines represent the isotherm contours of 500, 400, and 300 °C, respectively.
The surface temperature of the dipping oceanic lithosphere depended largely on the subduction angle and obliquity along the plate interface geometry. The surface temperature of the slab beneath south-central Alaska (Figure 3a) at a given depth was approximately 50–100 °C higher than that beneath southwestern Alaska due to a smaller subduction angle and a younger plate (45 vs. 55 Ma). Moreover, the flatness of the slab geometry led to the slow increase of the slab surface temperature from 300 to 600 °C beneath the offshore of south-central Alaska. In contrast, the slab surface temperature rapidly transitioned from 300 to 500 °C beneath the offshore of southwestern Alaska due to slab bending. As the slab dip angle decreased from westward to eastward, the distance between the 300 and 500 °C isotherms on the plate interface increased and finally reached a maximum beneath south-central Alaska. Furthermore, the surface temperature of the slab beneath Kodiak Island in south-central Alaska varied from 300 to 600 °C in the depth range of 20–55 km, whereas the surface temperature of the slab beneath other islands of southwestern Alaska significantly exceeded 600 °C at depths of >50 km. The slab surface temperature beneath the coastline of south-central Alaska decreased southeastward from 600 to 400 °C. We also observed similar temperature trends inside the subducting plate at various intraslab depths (4 and 8 km), as our calculation results show in Figure 3b,c. However, the slab’s surface (0 km) temperature was warmer than that inside the subducting plate below the same location because it is closer to the overlying lithosphere. In addition, when the model takes into account the horizontal convergence velocity and the thermal structure of the incoming and overriding plates [44,45], its coupling depth remains not fully determined due to the complexity of dehydration and decoupling.
3.2. Slab Water Content Variation
Based on facies diagrams of MORB and ultramafic rocks in the subducted plates around the Pacific (e.g., [33,38]), we evaluated the water content in hydrous minerals of the Alaskan oceanic plate and calculated the water content and dehydration at the subduction plate surface (Figure 4 and Figure 5). The water contents of MORBs and ultramafic rocks follow the estimates for the subducted oceanic crust (e.g., [33,46,47,48]).
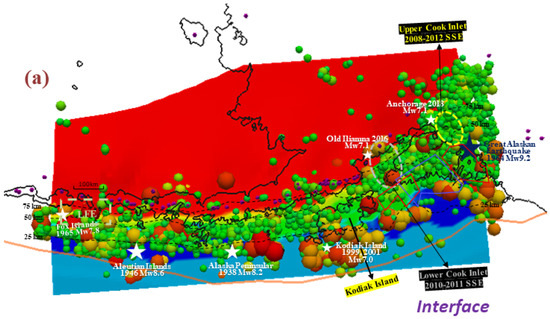
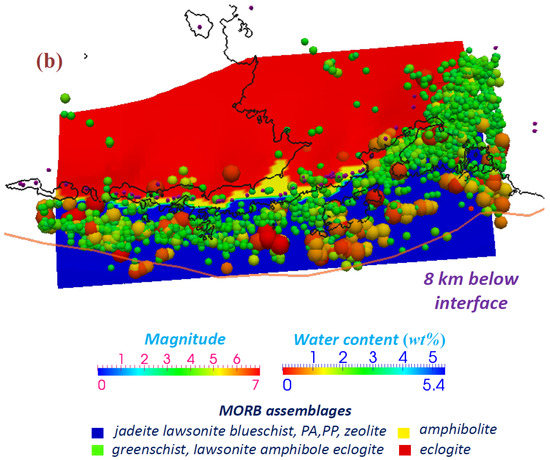
Figure 4.
Slab water content (wt%) was calculated at depths of (a) 0 (subduction interface) and (b) 8 km vertically below the interface. The black dashed lines represent the isodepth contours of 25, 50, and 75 km. The yellow and gray dashed circles represent the slow slip event patches in the Upper Cook (2008–2012, [17]) and Lower Cook Inlets (2010–2011, [18]). The green dashed line indicates low-frequency earthquakes [20]. Bold blue lines indicate the 1992.0–2004.8 (~M 7.8) Slow Slip Event, and bold red lines indicate the 2009.85–2011.81 (~M 7.2) Slow Slip Event [21,22].
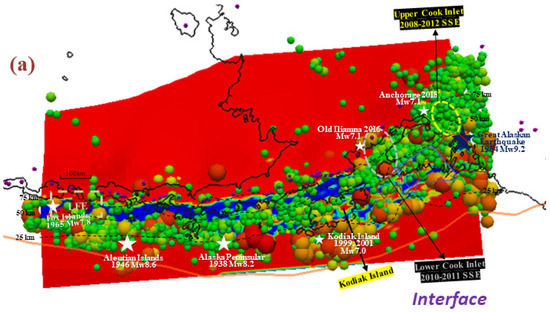
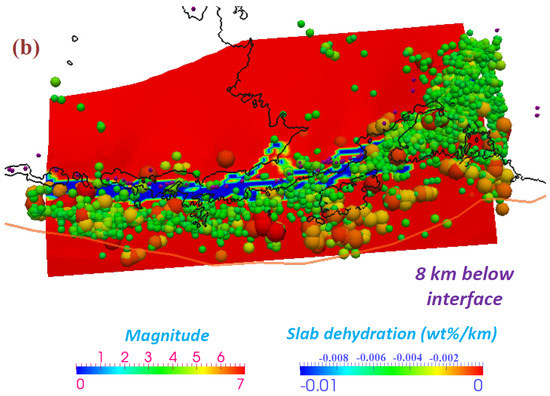
Figure 5.
Slab water content (wt%) was calculated at depths of (a) 0 (subduction interface) and (b) 8 km vertically below the interface. The black dashed lines represent the isodepth contours of 25, 50, and 75 km. The yellow and gray dashed circles represent the slow slip event patches in the Upper Cook (2008–2012, [17]) and Lower Cook Inlets (2010–2011, [18]). The green dashed line indicates low-frequency earthquakes [20]. Bold blue lines indicate the 1992.0–2004.8 (~M 7.8) Slow Slip Event, and bold red lines indicate the 2009.85–2011.81 (~M 7.2) Slow Slip Event [21,22].
Our results show that below south-central Alaska and southwestern Alaska, the prehnite-actinolite (4–5 wt%) and lawsonite blueschist (5.4 wt%) in the MORB (Figure 4a) underwent a gradual transition into greenschist (3 wt%) and lawsonite amphibole eclogite (3 wt%). As the depth of the slab increased, metamorphism caused the formation of eclogite (0 wt%). We found that most of the regions with relatively high water content were located below offshore Alaska, particularly at shallow depths (0–35 km). It is noteworthy that the slab surface beneath Kodiak Island had a higher water content than the other islands. Furthermore, lawsonite blueschist (5.4 wt%) was located 8 km below the interface (Figure 4b), which is also considered a possible boundary between MORB and ultramafic rocks. The lawsonite blueschist (5.4 wt%) in the ultramafic rocks (Figure 4b) finally transitioned into garnet harzburgite (0 wt%) and spinel harzburgite (0 wt%) due to metamorphism.
In addition, the regions where the slab dehydration rate exceeds 0.01 wt%/km are exhibited in Figure 5a,b. The dehydration front of the slab’s upper surface (Figure 5a) extended along the trench, and the depths varied from 25 to 75 km below south-central Alaska to southwestern Alaska. Among them, the dehydration regions were mostly located below offshore Alaska. It is also worth noting that all of Kodiak Island is located above the dewatering region compared with other islands.
4. Discussion
4.1. Subduction Thermal Regime and Earthquakes
We compared the slab thermal regime with the M > 3 earthquakes near the interplate surface from 1900 to 2010, plotted as colored spheres in Figure 3. The features of the Alaskan earthquake distribution (Figure 3a) show that most of the seismic events are distributed beneath the offshore forearc. The interplate 300–500 °C geotherms are outlined 100–200 km southward of offshore Alaska and are accompanied by frequent seismic ruptures on the subduction interface. Moreover, a large number of recorded M > 5 earthquakes are clustered near Kodiak Island (Figure 3a). In contrast, regular earthquakes with recorded magnitudes of M3–M5.5 were mostly distributed below offshore of southwestern Alaska and the east side of south-central Alaska. The slab surface temperatures of these regular earthquakes below southwestern Alaska were less than 600 °C, whereas the slab surface temperatures of these regular earthquakes below south-central Alaska were more than 600 °C. Zanjani et al. [49] have suggested that the intermediate-depth earthquakes beneath south-central Alaska occur in the temperature range of 500–900 °C. This is consistent with our results. The SSEs occurring in the Upper and Lower Cook Inlets are also located in regions with slab surface temperatures over 600 °C below south-central Alaska.
By comparing our work with previous results [50], Qu et al. [35] suggested that the interplate temperature below south-central Alaska is predicted to gradually increase from 300 to 800 °C with increasing depth (Figure S5) rather than rapidly increasing from 400–600 °C to 800–1100 °C. In this study, we compared the P–T conditions with those of previous studies (e.g., [50,51,52,53,54,55]) to further verify that our results were reasonable (Figure S6). In general, globally exhumed rock records [52,54] are suggested to well-constrain the global subduction thermal regime. We found that our P–T results (blue curve in Figure S6) are concordant with the results from Syracuse et al. [51], Penniston-Dorland et al. [52], and Brown and Johnson [54]. Compared with other models (e.g., [50,53,55]), the temperature in our model is warmer than that in the decoupling models (orange curves in Figure S6) at pressures < 2.5 GPa (depth < 70 km) because these models assumed maximum plate decoupling depths. Hence, the thermal structure of the subducting plate beneath south-central Alaska and southwestern Alaska that we obtained based on the 3-D model is acceptable.
4.2. Slab-Derived Fluids and Earthquakes
Likewise, we compared the slab water content with the M > 3 earthquakes near the interplate surface from 1900 to 2010, plotted as colored spheres in Figure 4 and Figure 5. The regular earthquakes with recorded magnitudes of M3–M5.5 are mostly distributed along the dewatering zone (Figure 5a). Most of the M > 5 earthquakes are located in the updip part of the dewatering zone. The SSEs beneath the Upper Cook Inlet are located in the dewatering zone (yellow dashed circle, Figure 5a), whereas the SSEs beneath the Lower Cook Inlet are located partly in the downdip part of the dewatering zone (gray dashed circle, Figure 5a). The temperature variations along the arc control the fluid’s release of hydrous minerals, resulting in a heterogeneous distribution of tremor events beneath the Unalaska and Akutan Islands [20,56]. The great Mw7.1 (Anchorage, 2018) earthquake ruptured beneath the Upper Cook Inlet, and the Mw9.2 Great Alaskan Earthquake (1964) ruptured from the Copper River Delta to Kodiak Island above the subduction. Miller et al. [57] have suggested that high pore pressures do not exist on the surface slab beneath Kodiak Island at a depth of ~8–20 km. As we thought, the dehydration should occur deeper in the slab. From our results, we found that the distribution of fast and slow earthquakes coincides with the dewatering zone both on the slab’s upper surface and inside the slab, likely due to the dehydration front variation with depth.
The slab water content heterogeneity usually leads to the release of large volumes of fluid from the oceanic plate when particular subduction pathways experience sufficiently high temperatures and pressures [58,59]. The area where the water content of the rock changes significantly from the plate interface to the intraslab at 8 km (Figure 4a,b) indicates that abundant fluids are released from the dehydrated slab under notable temperature and subsequent viscosity differences. Slab-derived fluids are a crucial part of flux melting. High-permeability systems are dominated by buoyancy, and fluid flow is primarily vertical, but if compaction pressure is included, the upslope flow within high-permeability layers in the slab produced by local dehydration reactions is enhanced [60]. Explicitly modeling water migration in subduction dynamic models through a compacting and decompacting solid matrix shows that a shallow release depth (e.g., 40 km) leads the water mainly through the trenchward (upslab) pathway [61]. Thus, we suggest that the fluids released from the slab beneath south-central and southwestern Alaska can be transported to shallow-medium depths.
Furthermore, if enough fluid is released from the dipping oceanic lithosphere into the mantle wedge, the forearc mantle can constitute an important reservoir of water (e.g., [62]). In this case, such a reservoir hydrates the plate interface and increases the pore fluid pressure (e.g., [63]). Hydrous phases such as serpentine progressively dehydrate, release fluids and cause dehydration embrittlement [64,65,66]. Then, when the effective normal stress is reduced, the occurrence of earthquakes will be facilitated. In other cases, rheological weakening [67] and the chemical reaction kinetics of self-sustained oscillations of serpentinite [68] are other candidates used to interpret the relations between fluids and slow earthquakes, but these processes are also based on a hydrous wedge. Consequently, we consider that the occurrence of interplate earthquakes, such as those recorded along the coast and the SSEs detected in and around the Upper Cook Inlet, is possibly facilitated by fluid migration and dehydration embrittlement. In a recent study, Iwamoto et al. [29] inferred that the released water beneath south-central Alaska may be transported to the plate boundary and cause the occurrence of tectonic tremors, which coincides with our conclusion. Moreover, Wei et al. [6] also suggested that the slab beneath southwestern Alaska is more hydrated, which is consistent with our results.
4.3. Fast and Slow Earthquakes in Major Subduction Zones
The distribution of regional seismic events coincides with the variation in the hydrous state of the slab, as previously investigated in the Japan, Hikurangi, Cascadia, north-central Chile, and Sumatra subduction zones (e.g., [69,70,71,72,73,74]). More importantly, this distribution exhibits an angle-dependent subduction trend in the temperature-dehydration diagram, as shown by the inclinations of the ellipses representing different subduction zones (Figure S7). The variety of dip angles leads to a wide range of temperature changes from beneath southwestern Alaska to south-central Alaska. The slab below southwestern Alaska exhibits more similarity with the Hikurangi subduction zone, while the slab below south-central Alaska is somewhat analogous to the north-central Chile subduction zone, where tectonic tremors and SSEs have been identified; however, the subduction angle is slightly smaller. The Alaska subduction zone thus features different faulting behaviors with various magnitudes of energy release, including slow slip, tectonic tremors, common and large earthquakes, and a wide spectrum of slip velocities, from ultrafast and fast to slow and very slow faulting processes.
Notably, slow earthquakes preferentially occur under hot quasi-stable fault slips, while low temperatures for fault hydrofracturing are favorable for causing regular small-moderate seismic events (M < 5.5). Slow earthquakes are probably controlled by porosity- and chemical-pressurization-induced oscillatory instabilities in the ductile realm [68,75] and represent a transition from brittle failure to aseismic creep. In contrast, in the brittle realm, great earthquakes controlled by the friction properties of a coupled plate interface rupture the updip high-temperature hydrothermal megathrust, thus reconciling the fault slip budget discrepancy between the shallow and deep portions of the subduction channel. Accordingly, fast and slow earthquakes, as well as aseismic slip events, are essentially the same, and together, they represent the modes of fault slip.
5. Conclusions
Through 3-D thermal models and phase diagrams of hydrous minerals in the subducted Pacific plate, the 3-D subduction thermal structure and the petrological metamorphic distribution beneath Alaska are investigated. We draw the following conclusions:
- (1)
- The metamorphosed and downgoing oceanic crust containing bound water releases a large amount of fluid, which results in the recurrence of fast and slow earthquakes beneath south-central and southwestern Alaska by elevated pore fluid pressure and hydrofracturing.
- (2)
- The seismic transition zone and the slow slip events (SSEs) identified beneath the Upper Cook Inlet coincide with the slab metamorphic dehydration regions.
- (3)
- The slow earthquakes observed beneath Alaska with quasi-stable fault slip preferentially occur, accompanied by high dehydration and temperatures. Fast earthquakes occur updip along the dehydration zones under conditionally low temperatures and dehydration.
Supplementary Materials
The following supporting information can be downloaded at: https://www.mdpi.com/article/10.3390/app122111139/s1. References [76,77,78,79,80,81,82,83,84,85,86,87,88,89,90,91,92,93,94,95,96] are mentioned in the Supplementary Materials file. The Supplementary Materials include Figure S1 Seafloor age and surface heat flow observations in Alaska; Figure S2. Comparison between the observation and calculation of surface heat flow; Figure S3. Refocus on plate decoupling assumption and the observation of surface heat flow in NE Japan; Figure S4. The integrated observation of surface heat flow in NE Japan and Cascadia; Figure S5. Comparison between our model result and Wada and Wang (2009); Figure S6. Comparison of the subduction P–T conditions between this study (blue curve), previous thermal models (other colored curves) and the observation of exhumed rocks (colored ellipses and diamonds); Figure S7. Conceptual sketch of the temperature-dehydration diagram for roughly estimated seismic (fast and slow earthquakes) and aseismic slips in different subduction zones based on this study and our previous series study; Table S1: Model Parameters; Table S2: Parameters for all domains.
Author Contributions
Y.J. conceived the original idea, designed the 3-D thermomechanical code, performed the numerical experiments, and interpreted the results. R.Q. and W.Z. elaborated on the numerical study, and Y.J., Y.Z. (Youjia Zhao) and Y.Z. (Ye Zhu) provided comments. All authors discussed the results and interpretations and participated in writing the paper. All authors have read and agreed to the published version of the manuscript.
Funding
This work was supported by funds from the Pioneer Hundred Talents Program of the Chinese Academy of Sciences and the Second Tibetan Plateau Scientific Expedition and Research Program (2019QZKK0708).
Institutional Review Board Statement
Not applicable.
Informed Consent Statement
Not applicable.
Data Availability Statement
Data are available in the figures and tables or from the authors upon reasonable request. The ParaView data for this paper are available at https://data.tpdc.ac.cn/en/data/8b266d22-fea7-4259-9a5f-8ac0bd9e7869/ and accessed on 4 December 2020.
Acknowledgments
We thank P. Tackley for sharing the original Stag3D code developed in this study. We also thank Taras Gerya and Junmeng Zhao for their constructive comments, which allowed us to improve this paper. We thank IRIS for their earthquake catalog at http://geoserver.iris.edu/ (accessed on 1 January 2020). Some figures were created using the Generic Mapping Tools developed by Wessel and Smith [97].
Conflicts of Interest
All the authors certify that they have no affiliations with or involvement in any organization or entity with any financial interest (such as honoraria; educational grants; participation in speakers’ bureaus; membership, employment, consultancies, stock ownership, or other equity interest; and expert testimony or patent-licensing arrangements) or nonfinancial interest (such as personal or professional relationships, affiliations, knowledge or beliefs) in the subject matter or materials discussed.
References
- Martin-Short, R.; Allen, R.; Bastow, I.D.; Porritt, R.W.; Miller, M.S. Seismic imaging of the Alaska subduction zone: Implications for slab geometry and volcanism. Geochem. Geophys. Geosystems 2018, 19, 4541–4560. [Google Scholar] [CrossRef]
- Li, Z.H.; Gerya, T.; Connolly, J.A. Variability of subducting slab m-orphologies in the mantle transition zone: Insight from petrological-thermomechanical modeling. Earth-Sci. Rev. 2019, 196, 102874. [Google Scholar] [CrossRef]
- Zhao, D.; Christensen, D.; Pulpan, H. Tomographic imaging of the Alaska subduction zone. J. Geophys. Res. Solid Earth 1995, 100, 6487–6504. [Google Scholar] [CrossRef]
- Qi, C.; Zhao, D.; Chen, Y.; Ruppert, N.A. New insight into the crust and upper mantle structure under Alaska. Polar Sci. 2007, 1, 85–100. [Google Scholar] [CrossRef][Green Version]
- You, T.; Zhao, D. Seismic anisotropy and heterogeneity in the Alaska subduction zone. Geophys. J. Int. 2012, 190, 629–649. [Google Scholar]
- Wei, S.S.; Ruprecht, P.; Gable, S.L.; Huggins, E.G.; Ruppert, N.; Gao, L.; Zhang, H. Along-strike variations in intermediate-depth seismicity and arc magmatism along the Alaska Peninsula. Earth Planet. Sci. Lett. 2021, 563, 116878. [Google Scholar] [CrossRef]
- Eberhart-Phillips, D.; Christensen, D.H.; Brocher, T.M.; Hansen, R.; Ruppert, N.A.; Haeussler, P.J.; Abers, G.A. Imaging the transition from Aleutian subduction to Yakutat collision in central Alaska, with local earthquakes and active source data. J. Geophys. Res. Solid Earth 2006, 111, B11303. [Google Scholar] [CrossRef]
- Jadamec, M.A.; Billen, M.I. The role of rheology and slab shape on rapid mantle flow: Three-dimensional numerical models of the Alaska sl-ab edge. J. Geophys. Res. Solid Earth 2012, 117, 338–341. [Google Scholar] [CrossRef]
- Martin-Short, R.; Allen, R.M.; Bastow, I.D. Subduction geometry beneath south central Alaska and its relationship to volcanism. Geophys. Res. Lett. 2016, 43, 9509–9517. [Google Scholar] [CrossRef]
- Finzel, E.S.; Trop, J.M.; Ridgway, K.D.; Enkelmann, E. Upper plate proxies for flat-slab subduction processes in southern Alaska. Earth Planet. Sci. Lett. 2011, 303, 348–360. [Google Scholar] [CrossRef]
- Abers, G.A.; Nakajima, J.; van Keken, P.E.; Kita, S.; Hacker, B.R. Thermalpetrological controls on the location of earthquakes within subducting plates. Earth Planet. Sci. Lett. 2013, 369, 178–187. [Google Scholar] [CrossRef]
- Zhao, D.; Yu, S.; Liu, X. Seismic anisotropy tomography: New insight into subduction dynamics. Gondwana Res. 2016, 33, 24–43. [Google Scholar] [CrossRef]
- Yang, X.; Gao, H. Segmentation of the Aleutian-Alaska subduction zone revealed by full-wave ambient noise tomography: Implications for the along-strike variation of volcanism. J. Geophys. Res. Solid Earth 2020, 125, e2020JB019677. [Google Scholar] [CrossRef]
- Smith, W.H.; Sandwell, D.T. Global sea floor topography from satellite altimetry and ship depth soundings. Science 1997, 277, 1956–1962. [Google Scholar] [CrossRef]
- Hayes, G.P.; Moore, G.L.; Portner, D.E.; Hearne, M.; Flamme, H.; Furtney, M.; Smoczyk, G.M. Slab2, a comprehensive subduction zone geometry model. Science 2018, 362, 58–61. [Google Scholar] [CrossRef] [PubMed]
- Siebert, L.; Simkin, T.; Kimberly, P. Volcanoes of the World, 3rd ed.; University of California Press: Berkeley, CA, USA, 2010; Volume 568. [Google Scholar]
- Fu, Y.; Freymueller, J.T. Repeated large slow slip events at the southcentral Alaska subduction zone. Earth Planet. Sci. Lett. 2013, 375, 303–311. [Google Scholar] [CrossRef]
- Wei, M.; McGuire, J.J.; Richardson, E. A slow slip event in the south central Alaska Subduction Zone and related seismicity anomaly. Geophys. Res. Lett. 2012, 39, 15. [Google Scholar] [CrossRef]
- Gomberg, J.; Prejean, S. Triggered tremor sweet spots in Alaska. J. Geophys. Res. Solid Earth 2013, 118, 6203–6218. [Google Scholar] [CrossRef]
- Li, B.; Ghosh, A. Near-continuous tremor and low-frequency earthquake activities in the Alaska-Aleutian subduction zone revealed by a mini seismic array. Geophys. Res. Lett. 2017, 44, 5427–5435. [Google Scholar] [CrossRef]
- Li, S.; Freymueller, J.; McCaffrey, R. Slow slip events and time-dependent variations in locking beneath lower cook inlet of the Alaska-Aleutian subduction zone. J. Geophys. Res. Solid Earth 2016, 121, 1060–1079. [Google Scholar] [CrossRef]
- Segou, M.; Parsons, T. The role of seismic and slow slip events in triggering the 2018 M7. 1 Anchorage earthquake in the southcentral Alaska subduction zone. Geophys. Res. Lett. 2020, 47, e2019GL086640. [Google Scholar] [CrossRef]
- Elliott, J.; Freymueller, J.T. A block model of present-day kinematics of Alaska and western Canada. J. Geophys. Res. Solid Earth 2020, 125, e2019JB018378. [Google Scholar] [CrossRef]
- Dragert, H.; Wang, K.; James, T.S. A silent slip event on the deeper Cascadia subduction interface. Science 2001, 292, 1525–1528. [Google Scholar] [CrossRef]
- Ohta, Y.; Freymueller, J.T.; Hreinsdóttir, S.; Suito, H. A large slow slip event and the depth of the seismogenic zone in the south-central Alaska subduction zone. Earth Planet. Sci. Lett. 2006, 247, 108–116. [Google Scholar] [CrossRef]
- Freymueller, J.T.; Woodard, H.; Cohen, S.C.; Steven, C.; Cross, R.; Elliott, J.; Larsen, C.F.; Hreinsdottir, S.; Zweck, C. Active deformation processes in Alaska, based on 15 years of GPS measurements. Act. Tecton. Seism. Potential Alsk. 2008, 179, 1–42. [Google Scholar]
- Wech, A.G. Extending Alaska’s plate boundary: Tectonic tremor generated by Yakutat subduction. Geology 2016, 44, 587–590. [Google Scholar] [CrossRef]
- Rousset, B.; Fu, Y.; Bartlow, N.; Bürgmann, R. Weeks-long and years-long slow slip and tectonic tremor episodes on the south central Alaska Megathrust. J. Geophys. Res. Solid Earth 2019, 124, 13392–13403. [Google Scholar] [CrossRef]
- Iwamoto, K.; Suenaga, N.; Yoshioka, S. Relationship between tectonic tremors and 3-D distributions of thermal structure and dehydration in the Alaska subduction zone. Sci. Rep. 2022, 12, 6234. [Google Scholar]
- Tackley, P.J.; Xie, S. Stag3D: A Code for Modeling Thermo-Chemical Multiphase Convection in Earth’s Mantle. In Computational Fluid and Solid Mechanics; Bathe, K.J., Ed.; Elsevier: Amsterdam, The Netherlands, 2003; pp. 1524–1527. [Google Scholar]
- DeMets, C.; Dixon, T.H. New kinematic models for Pacific-North America motion from 3 Ma to present, I: Evidence for steady motion and biases in the NUVEL-1A model. Geophys. Res. Lett. 1999, 26, 1921–1924. [Google Scholar] [CrossRef]
- DeMets, C.; Gordon, R.G.; Argus, D.F. Geologically current plate motions. Geophys. J. Int. 2010, 181, 1–80. [Google Scholar] [CrossRef]
- Hacker, B.R.; Abers, G.A.; Peacock, S.M. Subduction factory 1. T-heoretical mineralogy, densities, seismic wave speeds, and H2O contents. J. Geophys. Res. Solid Earth 2003, 108, 2029. [Google Scholar] [CrossRef]
- Müller, R.D.; Sdrolias, M.; Gaina, C.; Roest, W.R. Age, spreading rates, and spreading asymmetry of the world’s ocean crust. Geochem. Geophys. Geosystems 2008, 9, 8150. [Google Scholar] [CrossRef]
- Qu, R.; Ji, Y.; Zhu, W. Variations in Wedge Earthquake Distribution along the Strike Underlain by Thermally Controlled Hydrated Megathrusts. Appl. Sci. 2021, 11, 7268. [Google Scholar] [CrossRef]
- Grose, C.J.; Afonso, J.C. Comprehensive plate models for the thermal evolution of oceanic lithosphere. Geochem. Geophys. Geosystems 2013, 14, 3751–3778. [Google Scholar] [CrossRef]
- Stein, C.A.; Stein, S. A model for the global variation in oceanic depth and heat flow with lithospheric age. Nature 1992, 359, 123–129. [Google Scholar] [CrossRef]
- Omori, S.; Kita, S.; Maruyama, S.; Santosh, M. Pressure–temperature conditions of ongoing regional metamorphism beneath the Japanese Islands. Gondwana Res. 2009, 16, 458–469. [Google Scholar] [CrossRef]
- Yoshii, T. Regionality of group velocities of Rayleigh waves in the Pacific and thickening of the plate. Earth Planet. Sci. Lett. 1975, 25, 305–312. [Google Scholar] [CrossRef]
- Fisher, M.A.; Magoon, L.B. Geologic framework of lower Cook Inlet. Am. Assoc. Pet. Geol. Bull. 1978, 62, 373–402. [Google Scholar]
- Wang, Y.; Tape, C. Seismic velocity structure and anisotropy of the Alaska subduction zone based on surface wave tomography. J. Geophys. Res. Solid Earth 2014, 119, 8845–8865. [Google Scholar] [CrossRef]
- Pollack, H.N.; Hurter, S.J.; Johnson, J.R. Heat flow from the earth’s interior: Analysis of the global data set. Rev. Geophys. 1993, 31, 267–280. [Google Scholar] [CrossRef]
- Li, C.F.; Lu, Y.; Wang, J. A global reference model of Curie-point depths based on EMAG2. Sci. Rep. 2017, 7, 45129. [Google Scholar] [CrossRef] [PubMed]
- Kerswell, B.C.; Kohn, M.J.; Gerya, T.V. Backarc Lithospheric Thickness and Serpentine Stability Control Slab-Mantle Coupling Depths in Subduction Zones. Geochem. Geophys. Geosystems 2021, 22, e2020GC009304. [Google Scholar] [CrossRef]
- Ruh, J.B.; Le Pourhiet, L.; Agard, P.; Burov, E.; Gerya, T. Tectonic slicing of subducting oceanic crust along plate interfaces: Numerical modeling. Geochem. Geophys. Geosystems 2015, 16, 3505–3531. [Google Scholar] [CrossRef]
- Faccenda, M. Water in the slab: A trilogy. Tectonophysics 2014, 614, 1–30. [Google Scholar] [CrossRef]
- Hernández-Uribe, D.; Palin, R.M. A revised petrological model for subducted oceanic crust: Insights from phase equilibrium modelling. J. Metamorph. Geol. 2019, 37, 745–768. [Google Scholar] [CrossRef]
- Condit, C.B.; Guevara, V.E.; Delph, J.R.; French, M.E. Slab dehydration in warm subduction zones at depths of episodic slip and tremor. Earth Planet. Sci. Lett. 2020, 552, 116601. [Google Scholar] [CrossRef]
- Aziz Zanjani, F.; Lin, G. Double Seismic Zones along the Eastern Aleutian-Alaska Subduction Zone Revealed by a High-Precision Earthquake Relocation Catalog. Seismol. Soc. Am. 2022, 93, 2753–2769. [Google Scholar] [CrossRef]
- Wada, I.; Wang, K. Common depth of slab-mantle decoupling: Reconciling diversity and uniformity of subduction zones. Geochem. Geophys. Geosystems 2009, 10, 10. [Google Scholar] [CrossRef]
- Syracuse, E.M.; van Keken, P.E.; Abers, G.A. The global range of subduction zone thermal models. Phys. Earth Planet. Inter. 2010, 183, 73–90. [Google Scholar] [CrossRef]
- Penniston-Dorland, S.C.; Kohn, M.J.; Manning, C.E. The global range of subduction zone thermal structures from exhumed blueschists and eclogites: Rocks are hotter than models. Earth Planet. Sci. Lett. 2015, 428, 243–254. [Google Scholar] [CrossRef]
- Van Keken, P.E.; Hacker, B.R.; Syracuse, E.M.; Abers, G.A. Subduction factory: 4. Depth-dependent flux of H2O from subducting slabs worldwide. J. Geophys. Res. Solid Earth 2011, 116, B01401. [Google Scholar] [CrossRef]
- Brown, M.; Johnson, T. Secular change in metamorphism and the onset of global plate tectonics. Am. Mineral. 2018, 103, 181–196. [Google Scholar] [CrossRef]
- Abers, G.A.; van Keken, P.E.; Wilson, C.R. Deep decoupling in subduction zones: Observations and temperature limits. Geosphere 2020, 16, 1408–1424. [Google Scholar] [CrossRef]
- Katsumata, A.; Kamaya, N. Low-frequency continuous tremor around the Moho discontinuity away from volcanoes in the southwest Japan. Geophys. Res. Lett. 2003, 30, 20–21. [Google Scholar] [CrossRef]
- Miller, P.K.; Saffer, D.M.; Abers, G.A.; Shillington, D.J.; Bécel, A.; Li, J.; Bate, C. P-and S-Wave Velocities of Exhumed Metasediments From the Alaskan Subduction Zone: Implications for the In Situ Conditions Along the Megathrust. Geophys. Res. Lett. 2021, 48, e2021GL094511. [Google Scholar] [CrossRef]
- Jaeckel, K.; Bebout, G.E.; Angiboust, S. Deformation-enhanced fluid and mass transfer along Western and Central Alps paleo-subduction interfaces: Significance for carbon cycling models. Geosphere 2018, 14, 2355–2375. [Google Scholar] [CrossRef]
- Taetz, S.; John, T.; Bröcker, M.; Spandler, C.; Stracke, A. Fast intraslab fluid-flow events linked to pulses of high pore fluid pressure at the subducted plate interface. Earth Planet. Sci. Lett. 2018, 482, 33–43. [Google Scholar] [CrossRef]
- Wilson, C.R.; Spiegelman, M.; van Keken, P.E.; Hacker, B.R. Fluid flow in subduction zones: The role of solid rheology and compaction pressure. Earth Planet. Sci. Lett. 2014, 401, 261–274. [Google Scholar] [CrossRef]
- Wang, H.; Huismans, R.S.; Rondenay, S. Water migration in the subduction mantle wedge: A two-phase flow approach. J. Geophys. Res. Solid Earth 2019, 124, 9208–9225. [Google Scholar] [CrossRef]
- Arcay, D.; Tric, E.; Doin, M.P. Numerical simulations of subduction zones: Effect of slab dehydration on the mantle wedge dynamics. Phys. Earth Planet. Inter. 2005, 149, 133–153. [Google Scholar] [CrossRef]
- Liu, Y. Numerical simulations on megathrust rupture stabilized under strong dilatancy strengthening in slow slip region. Geophys. Res. Lett. 2013, 40, 1311–1316. [Google Scholar] [CrossRef]
- Jung, H.; Green Ii, H.W.; Dobrzhinetskaya, L.F. Intermediate-depth earthquake faulting by dehydration embrittlement with negative volume change. Nature 2004, 428, 545–549. [Google Scholar] [CrossRef]
- Brantut, N.; Sulem, J. Strain localization and slip instability in a strain-rate hardening, chemically weakening material. J. Appl. Mech. 2012, 79, 031004. [Google Scholar] [CrossRef]
- Stefanou, I.; Sulem, J.; Brantut, N. Dehydration embrittlement and compaction instabilities in subduction zones. AGUFM 2018, 2018, T21B-07. [Google Scholar]
- Gao, X.; Wang, K. Rheological separation of the megathrust seismoge-nic zone and episodic tremor and slip. Nature 2017, 543, 416–419. [Google Scholar] [CrossRef]
- Poulet, T.; Veveakis, E.; Regenauer-Lieb, K.; Yuen, D.A. Thermo-poro-mechanics of chemically active creeping faults: 3. The role of serpentinite in episodic tremor and slip sequences, and transition to chaos. J. Geophys. Res. Solid Earth 2014, 119, 4606–4625. [Google Scholar] [CrossRef]
- Ji, Y.; Yoshioka, S.; Matsumoto, T. Three-dimensional numerical modeling of temperature and mantle flow fields associated with subduction of the Phillippine sea plate, southwest japan. J. Geophys. Res. Solid Earth 2016, 121, 4458–4482. [Google Scholar] [CrossRef]
- Ji, Y.; Yoshioka, S.; Manea, V.C.; Manea, M.; Matsumoto, T. Three-dimensional numerical modeling of thermal regime and slab dehydration beneath Kanto and Tohoku, Japan. J. Geophys. Res. Solid Earth 2017, 122, 332–353. [Google Scholar] [CrossRef]
- Ji, Y.; Yoshioka, S.; Banay, Y.A. Thermal state, slab metamorphism and interface seismicity in the Cascadia subduction zone based on 3-D modeling: 3-D thermomechanical model for Cascadia. Geophys. Res. Lett. 2017, 44, 9242–9252. [Google Scholar] [CrossRef]
- Ji, Y.; Yoshioka, S.; Manea, V.; Manea, M.; Suenaga, N. Three-Dimensional Thermal Structure, Metamorphism and Seismicity beneath north-central Chile. J. Geodyn. 2019, 129, 299–312. [Google Scholar] [CrossRef]
- Ji, Y.; Yan, R.; Zeng, D.; Xie, C.; Zhu, W.; Qu, R.; Yoshioka, S. Slab dehydration in Sumatra: Implications for fast and slow earthquakes and arc magmatism. Geophys. Res. Lett. 2021, 48, e2020GL090576. [Google Scholar] [CrossRef]
- Suenaga, N.; Ji, Y.; Yoshioka, S.; Feng, D. Subduction thermal regime, slab dehydration, and seismicity distribution beneath Hikurangi based on 3D simulations. J. Geophys. Res. Solid Earth 2018, 123, 3080–3097. [Google Scholar] [CrossRef]
- Veveakis, E.; Poulet, T.; Alevizos, S. Thermo-poro-mechanics of chemically active creeping faults: 2. Transient considerations. J. Geophys. Res. Solid Earth 2014, 119, 4583–4605. [Google Scholar] [CrossRef]
- Hirth, G.; Kohlstedf, D. Rheology of the upper mantle and the mantle wedge: A view from the experimentalists. Geophys. Monogr.-Am. Geophys. Union 2003, 138, 83–106. [Google Scholar]
- Ranalli, G. Rheology of the Earth; Springer Science & Business Media: Berlin/Heidelberg, Germany, 1995. [Google Scholar]
- White, R.S.; McKenzie, D.; O’Nions, R.K. Oceanic crustal thickness from seismic measurements and rare earth element inversions. J. Geophys. Res. Solid Earth 1992, 97, 19683–19715. [Google Scholar] [CrossRef]
- Li, C.F.; Wang, J.; Lin, J.; Wang, T. Thermal evolution of the North Atlantic lithosphere: New constraints from magnetic anomaly inversion with a fractal magnetization model. Geochem. Geophys. Geosystems 2013, 14, 5078–5105. [Google Scholar] [CrossRef]
- Turcotte, D.L.; Schubert, G. Geodynamics, 2nd ed.; Cambridge University Press: Cambridge, UK, 2002; p. 186. [Google Scholar]
- Furukawa, Y. Depth of the decoupling plate interface and thermal structure under arcs. J. Geophys. Res. Solid Earth 1993, 98, 20005–20013. [Google Scholar] [CrossRef]
- Peacock, S.M.; Wang, K. Seismic consequences of warm versus cool subduction metamorphism: Examples from southwest and northeast Japan. Science 1999, 286, 937–939. [Google Scholar] [CrossRef]
- Wada, I.; Wang, K.; He, J.; Hyndman, R.D. Weakening of the subduction interface and its effects on surface heat flow, slab dehydration, and mantle wedge serpentinization. J. Geophys. Res. Solid Earth 2008, 113, B04402. [Google Scholar] [CrossRef]
- Ashi, J.; Tokuyama, H.; Ujiie, Y.; Taira, A. Heat flow estimation from gas hydrate BSRs in the Nankai Trough: Implications for thermal structures of the Shikoku Basin. Eos Trans. AGU 1999, 80, 929–930. [Google Scholar]
- Ashi, J.; Tokuyama, H.; Taira, A. Distribution of methane hydrate BSRs and its implication for the prism growth in the Nankai Trough. Mar. Geol. 2002, 187, 177–191. [Google Scholar] [CrossRef]
- Tanaka, A. Geothermal gradient and heat flow data in and around Japan (II): Crustal thermal structure and its relationship to seismogenic layer. Earth Planets Space 2004, 56, 1195–1199. [Google Scholar] [CrossRef]
- Tanaka, A.; Yamano, M.; Yano, Y.; Sasada, M. Geothermal gradient and heat flow data in and around Japan (I): Appraisal of heat flow from geothermal gradient data. Earth Planets Space 2004, 56, 1191–1194. [Google Scholar] [CrossRef]
- Matsumoto, T. Terrestrial heat flow distribution in Japan area based on the temperature logging in the borehole of NIED Hi-net. AGU 2007, T23A–1217, 10–14. [Google Scholar]
- Oleskevich, D.A.; Hyndman, R.D.; Wang, K. The updip and downdip limits to great subduction earthquakes: Thermal and structural models of Cascadia, south Alaska, SW Japan, and Chile. J. Geophys. Res. Solid Earth 1999, 104, 14965–14991. [Google Scholar] [CrossRef]
- van Keken, P.E.; Kiefer, B.; Peacock, S.M. High-resolution models of subduction zones: Implications for mineral dehydration reactions and the transport of water into the deep mantle. Geochem. Geophys. Geosystems 2002, 3, 1056. [Google Scholar] [CrossRef]
- Penniston-Dorland, S.C.; Gorman, J.K.; Bebout, G.E.; Piccoli, P.M.; Walker, R.J. Reaction rind formation in the Catalina Schist: Deciphering a history of mechanical mixing and metasomatic alteration. Chem. Geol. 2014, 384, 47–61. [Google Scholar] [CrossRef]
- Wang, K.; Hyndman, R.D.; Yamano, M. Thermal regime of the southwest Japan subduction zone: Effects of age history of the subducting plate. Tectonophysics 1995, 248, 53–69. [Google Scholar] [CrossRef]
- Iwamori, H. Heat sources and melting in subduction zones. J. Geophys. Res. Solid Earth 1997, 102, 14803–14820. [Google Scholar] [CrossRef]
- Christensen, U.R. The influence of trench migration on slab penetration into the lower mantle. Earth Planet. Sci. Lett. 1996, 140, 27–39. [Google Scholar] [CrossRef]
- Yoshioka, S.; Murakami, K. Temperature distribution of the upper surface of the subducted Philippine Sea Plate along the Nankai Trough, southwest Japan, from a three-dimensional subduction model: Relation to large interplate and low-frequency earthquakes. Geophys. J. Int. 2007, 171, 302–315. [Google Scholar] [CrossRef]
- Grevemeyer, I.; Diaz-Naveas, J.L.; Ranero, C.R.; Villinger, H.W.; Leg, O.D.P. Heat flow over the descending Nazca plate in central Chile, 32 S to 41 S: Observations from ODP Leg 202 and the occurrence of natural gas hydrates. Earth Planet. Sci. Lett. 2003, 213, 285–298. [Google Scholar] [CrossRef]
- Wessel, P.; Smith, W.H. New, improved version of Generic Mapping Tools released. Eos Trans. Am. Geophys. Union 1998, 79, 579. [Google Scholar] [CrossRef]


Publisher’s Note: MDPI stays neutral with regard to jurisdictional claims in published maps and institutional affiliations. |
© 2022 by the authors. Licensee MDPI, Basel, Switzerland. This article is an open access article distributed under the terms and conditions of the Creative Commons Attribution (CC BY) license (https://creativecommons.org/licenses/by/4.0/).