

Implementation of Demand Forecasting Module of ERP System in Mass Customization Industry—Case Studies †
 , ,
, ,  and
and
Abstract
1. Introduction
- Details of the problem description in the mass-customization industry;
- Forecasting methods in the mass-customization industry based on the literature;
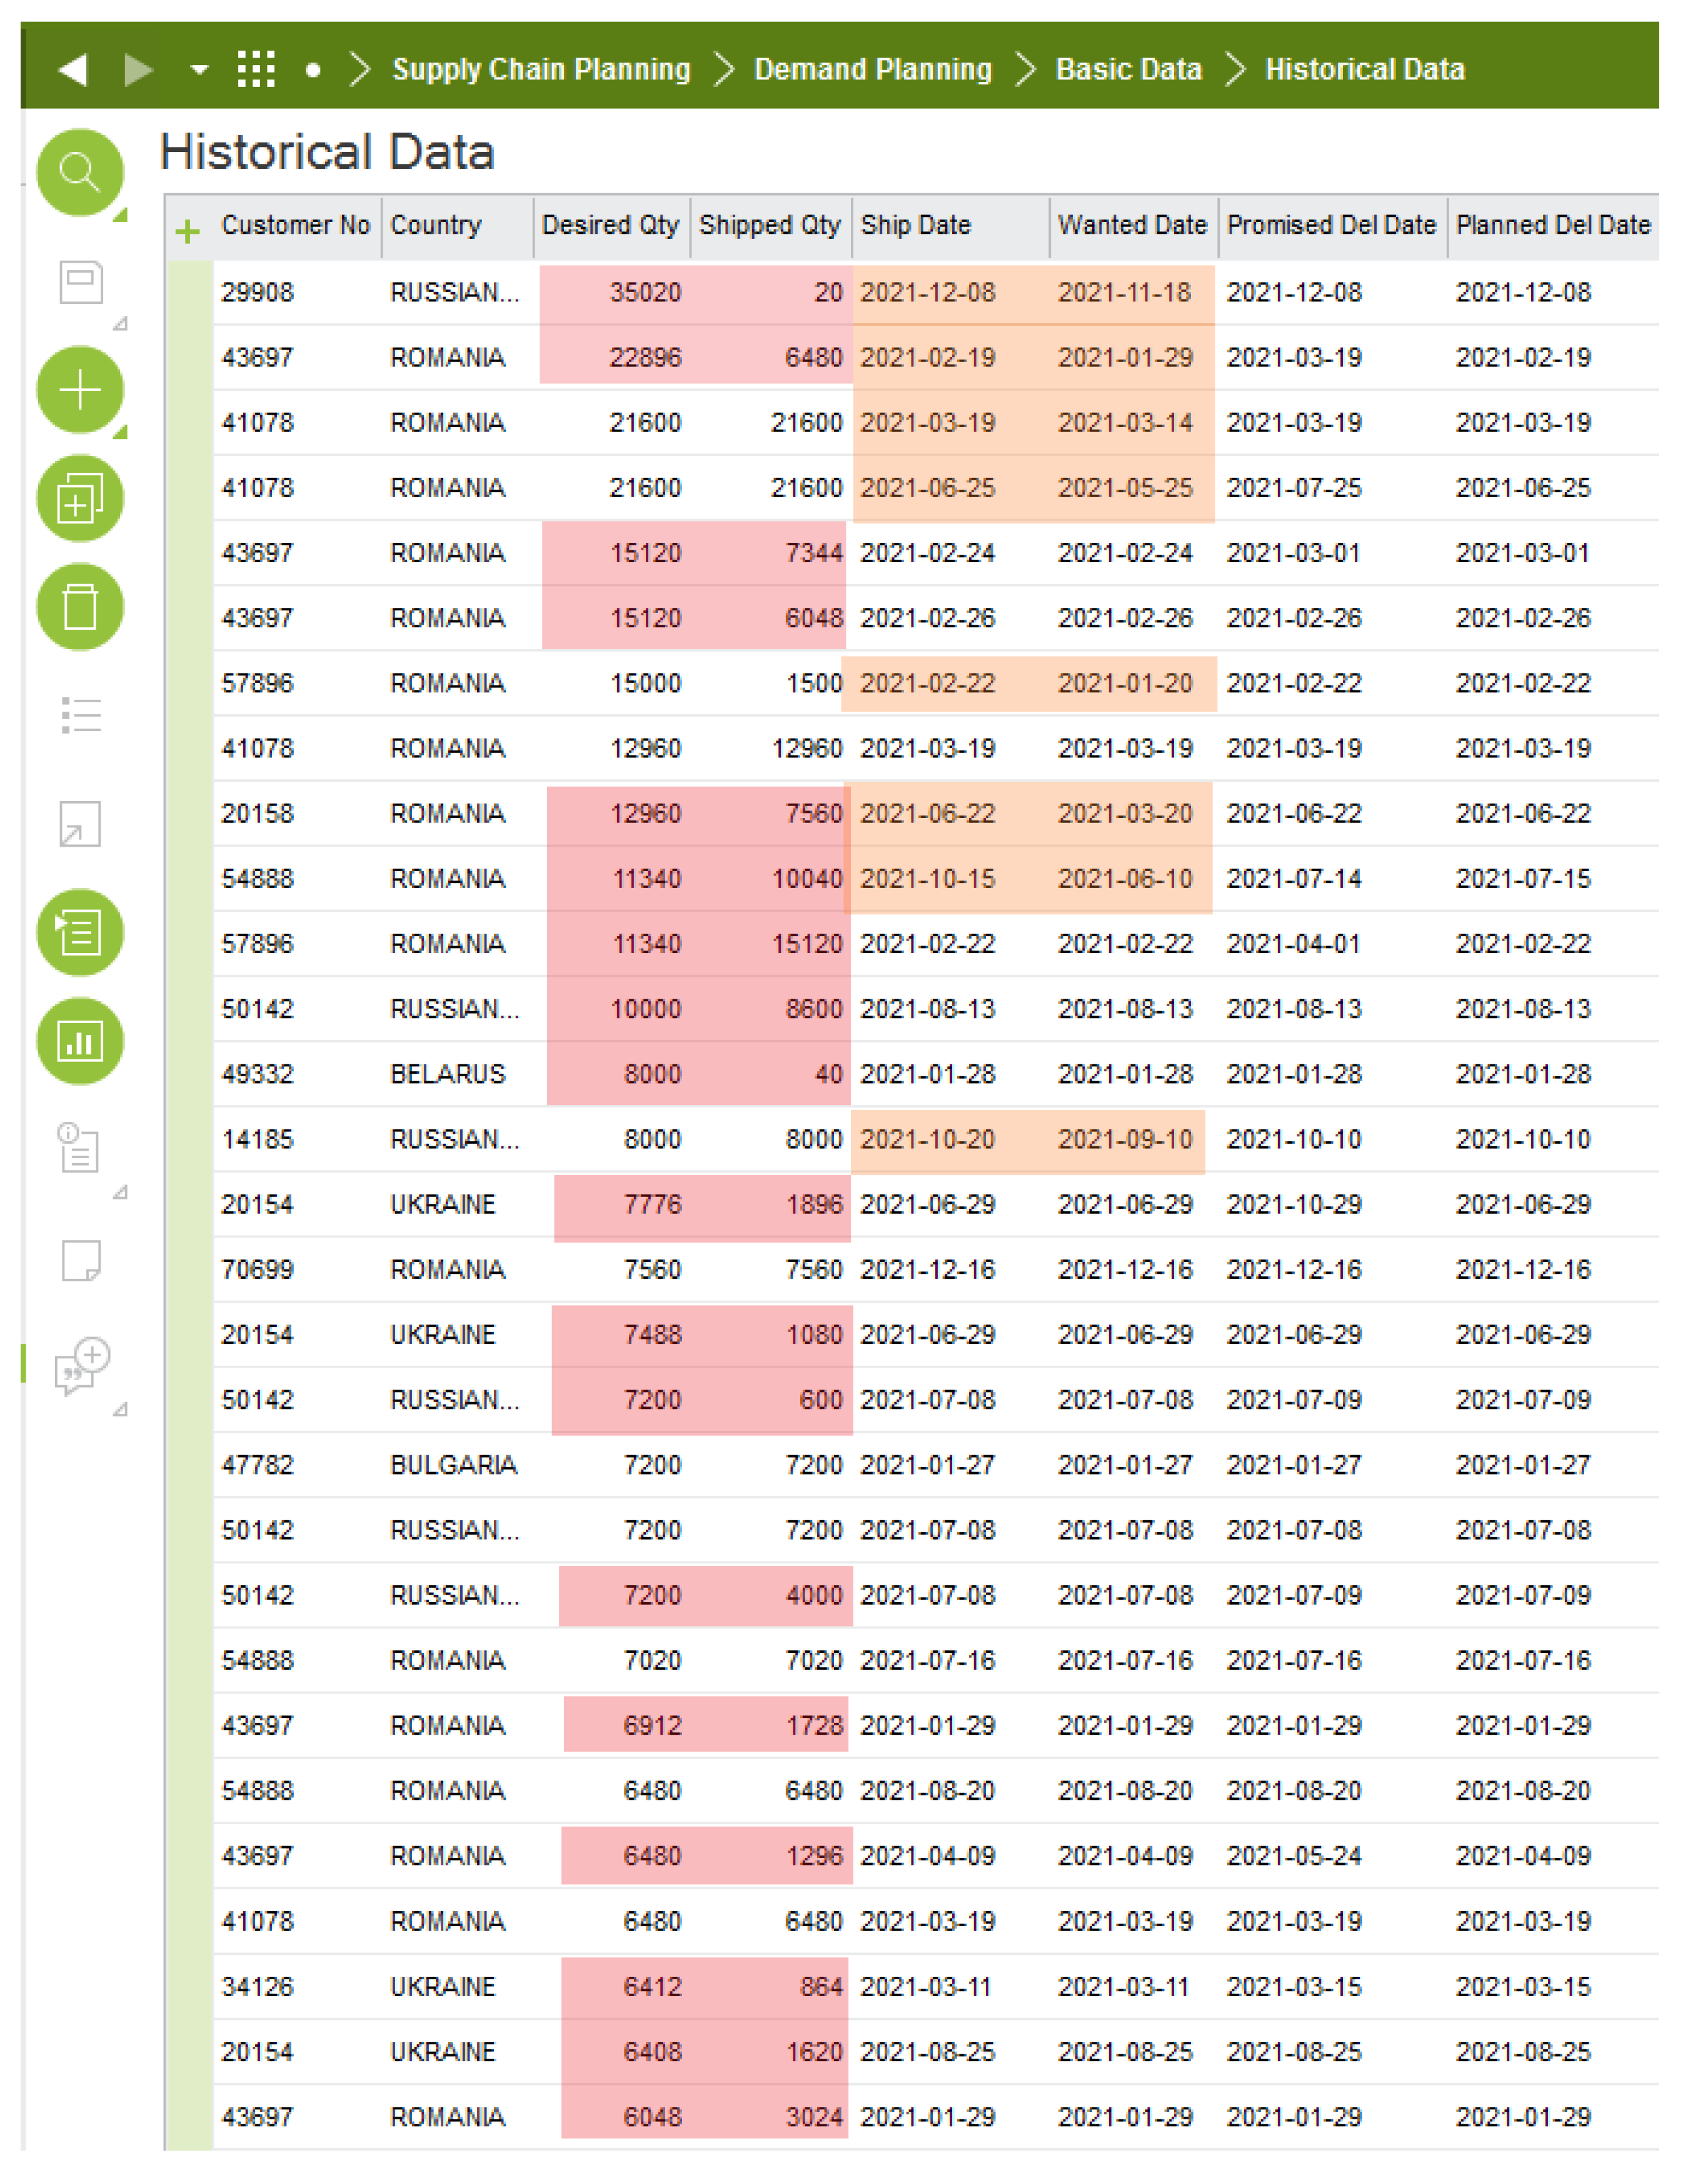
- Analysis of the correct reflection of historical demand in ERP systems to also consider lost sales;
- Analysis of standard methodologies for implementing ERP systems in terms of adaptation to the specific requirements of implementing a forecasting module;
- A detailed completion of the steps in the proposed implementation methodology, which was generally introduced in the previous paper; an evaluation of the proposed methodology in mass-customization companies;
- A detail of method for grouping forecast parts in the mass-customization industry to reduce the labour intensity of forecast and based on data integration in the ERP system.
2. Mass Customization Production Characteristics
3. Demand Forecasting in Mass Customization Production
- Naive methods;
- Moving average;
- Holt–Winters exponential smoothing models;
- Seasonal Box–Jenkins model;
- Croston model;
- Linear regression;
- and, some of them, ARIMA.
- Lack of forecasting skills in the company;
- Lack of an appropriate tool to calculate historical demand, understood as real sales and lost sales;
- The inability to analyse all sales parts, due to too many sales parts for different markets.
- Analysis of business processes belonging to a given functional area;
- Mapping of processes to system functionality;
- Parameterization and configuration (possible modifications);
- Migration of static data (master data);
- Training;
- Operational tests.
- An analysis of the client’s historical data and other data influencing the forecast;
- Advice on the shape and method of forecast creation:
- −
- Define the recipient for which the forecast is created (forecasting may concern recipients at various levels of management: operational, tactical or strategic),
- −
- Defining the level of the product structure (individual products, groups of products or the entire assortment can be forecasted),
- −
- Defining time horizon of forecast (short-term, medium-term, long-term),
- Teaching theoretical foundations and practical procedure.
4. Research Methodology
5. Forecasting for Mass Customization
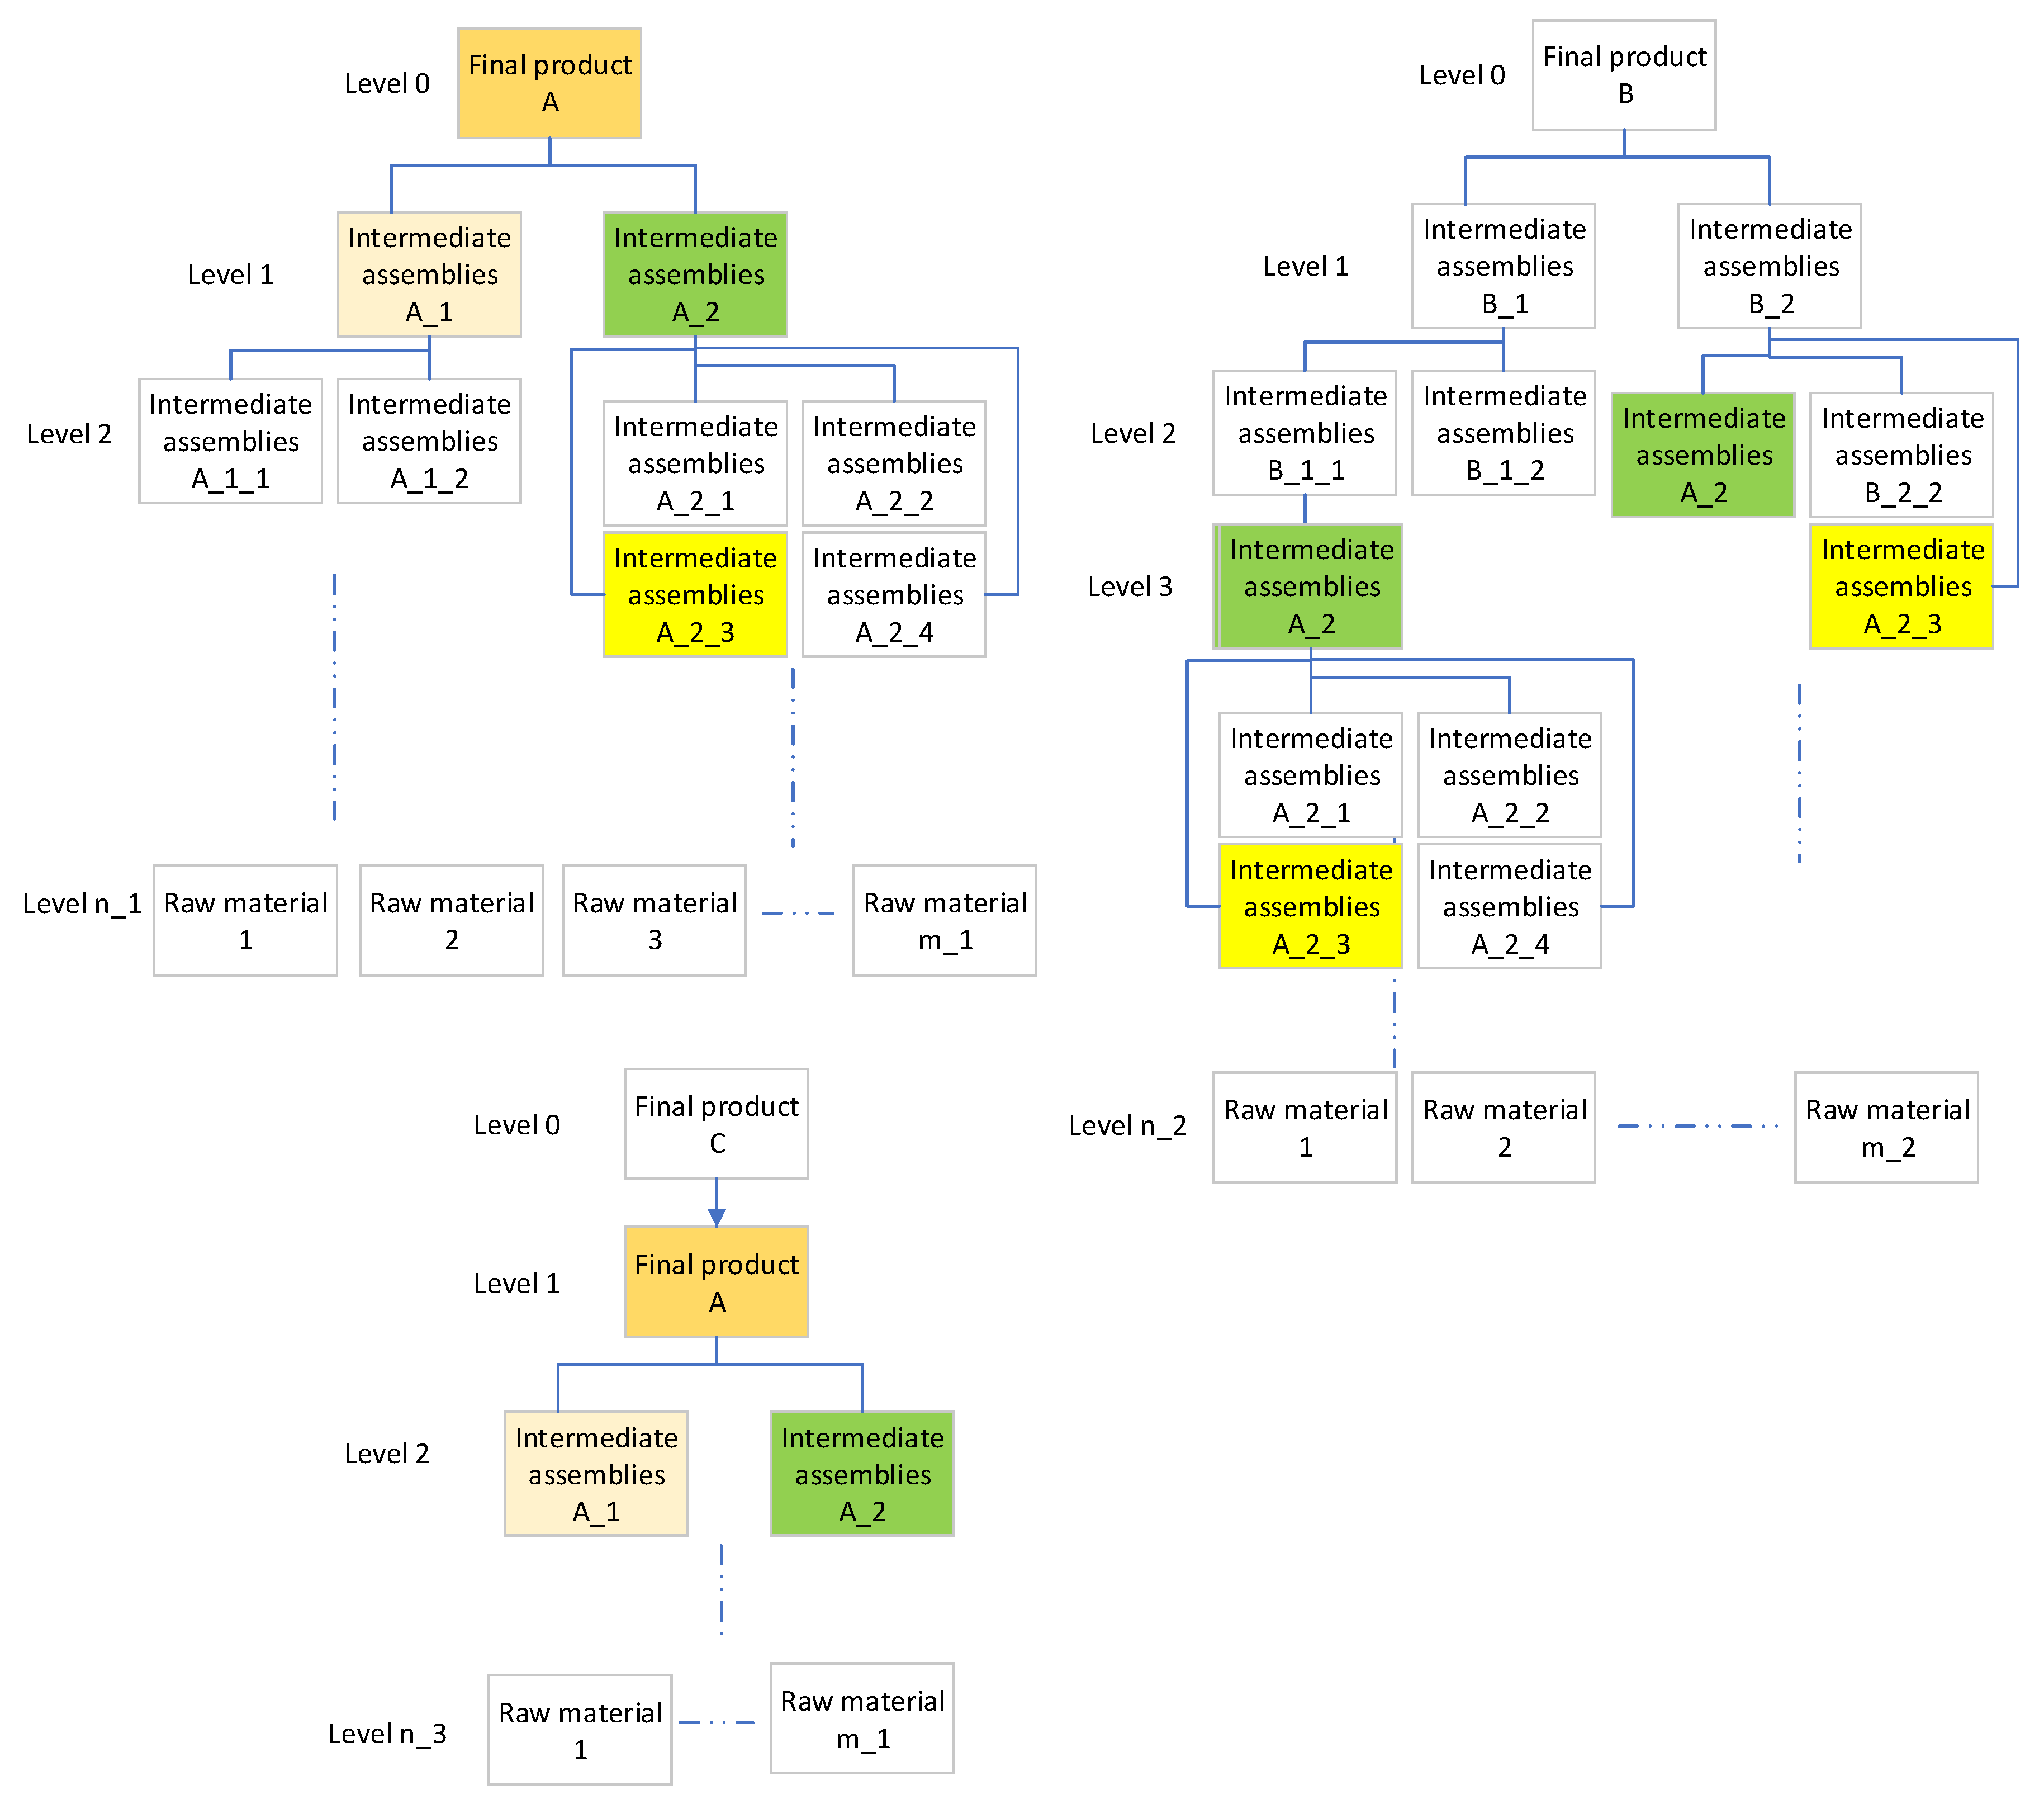
- BOMs, which contained hierarchy information that determined the level of the inventory part in the graph. A value 0 means that the part is a finished product, while a value of 1 means that the part is an intermediate product on a level 1 in the BOM. Similarly, for values of 2, 3, and higher. Level 3 intermediates form level 2 intermediates, level 2 intermediates form level 1 intermediates, and level 1 intermediates form the finished products. We had information about the id of the inventory part and the id of the final product, so if the value of hierarchy is 0, then id of inventory part and id of final product are the same in the dataset. We did not take into account the amount of upstream intermediates that goes into downstream products;
- ABC and XYZ analysis—ABC analysis divides an inventory into three categories related to the value of inventory costs. ‘A’ parts are very important for an organization. ‘B’ parts are important, but of course less important than ‘A’ items and more important than ‘C’ parts. ‘C’ items are marginally important. XYZ classification is one method of classifying resources according to regularity of demand, it implies a division by rate of consumption or sales: X-high rate of consumption, Y-medium rate of consumption, and Z-low rate of consumption. Through these analyses, we get a breakdown of products and intermediates into nine groups: AX, AY, AZ, BX, BY, BZ, CX, CY, and CZ.
- Reading the level 0 position;
- Checking whether there is a level 0 part that is at level 1 or higher in the hierarchy of another finished product. If so, check that there is no other finished product in this hierarchy. If not, we assigned products to one group, if so, the ABC/XYZ category was checked and the item was assigned to the group with the higher category value. If the ABC/XYZ analysis did not give a clear answer, the company planner should decide;
- Checking whether there is a level 1 part that is at level 1 or higher in the hierarchy of another finished product and starting with parts from the highest ABC/XYZ category and highest demand. Check that there is no other level 1 product in this hierarchy. If there is no other, we assigned the products to one group. If another level 1 product in this hierarchy exists, then the ABC/XYZ category is checked and the part is assigned to the group with the higher category value. If the ABC/XYZ analysis did not give a clear answer, the company planner should decide;
- Similarly, we checked level 2 and level 3 parts. Based on the planner feedback, we searched the graphs up to level 4.
6. Development Data-Driven Implementation Methodology
6.1. Standard Methodologies for ERP Implementation
6.2. Proposed Methodology
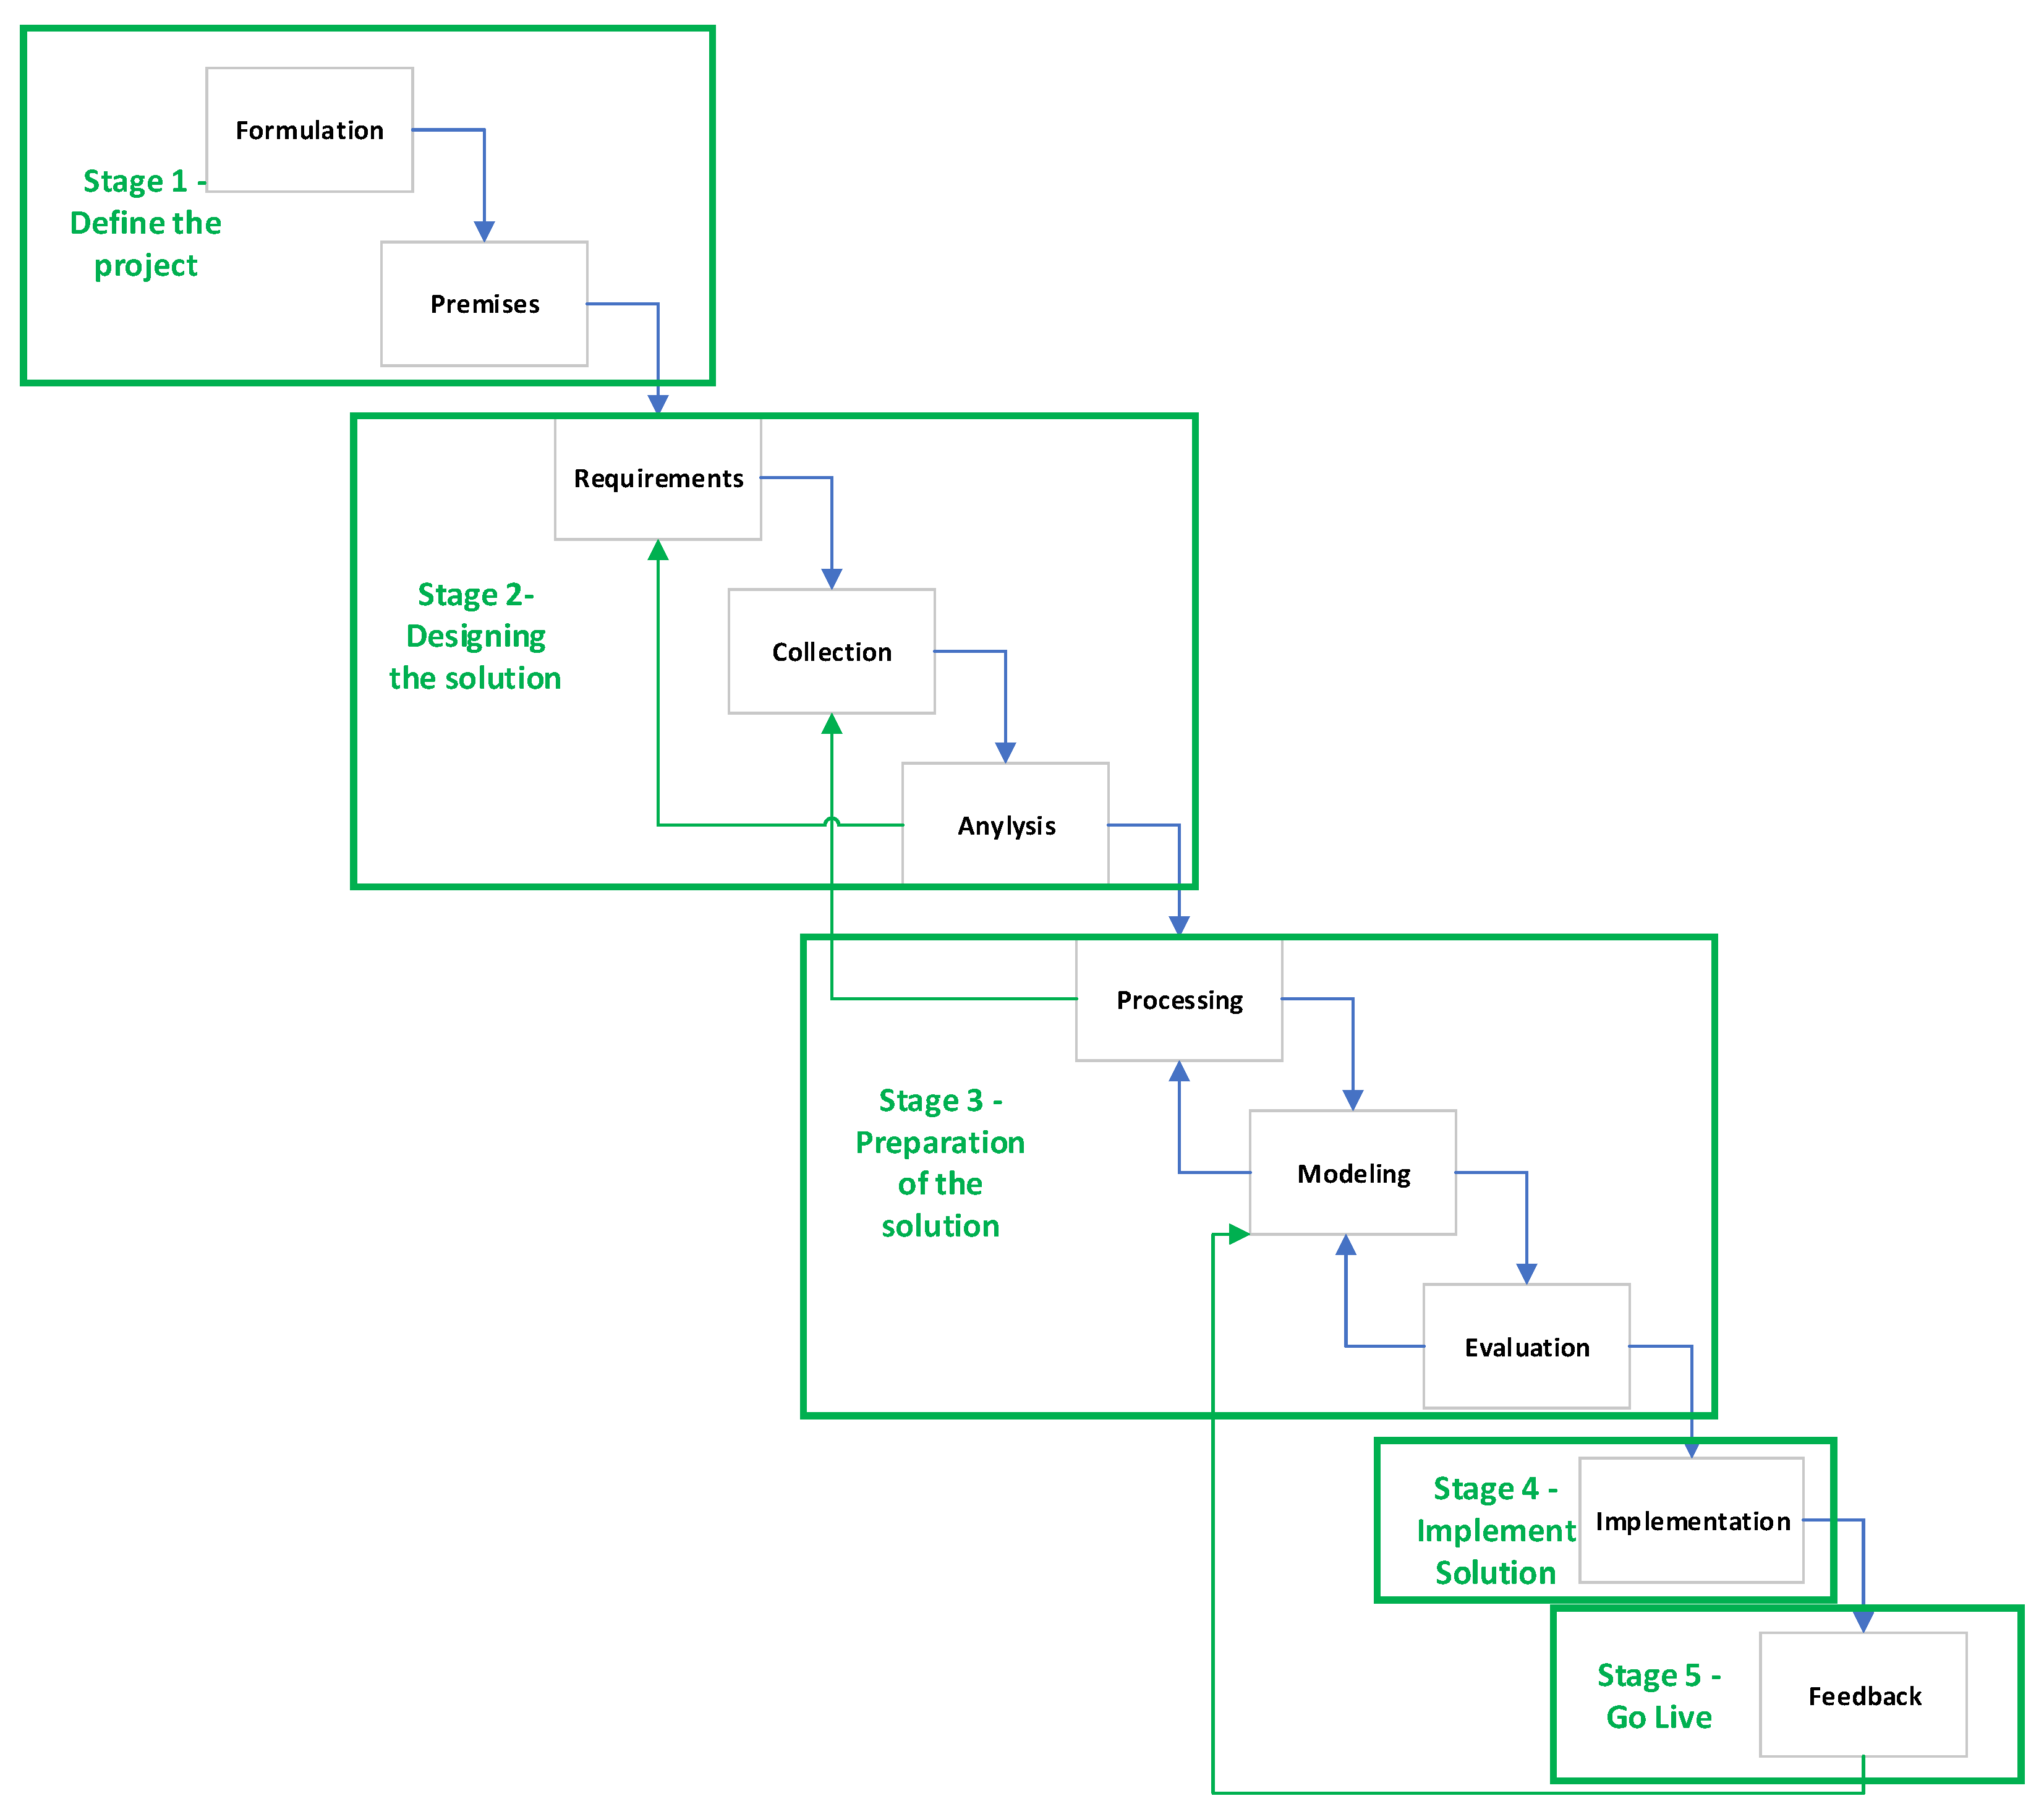
- (1)
- Formulation of the forecasting problem;
- (2)
- Analysis of prognostic premises;
- (3)
- Establishing data requirements;
- (4)
- Data collection;
- (5)
- Data analysis-understanding data;
- (6)
- Data processing;
- (7)
- Modelling;
- (8)
- Evaluation;
- (9)
- Implementation;
- (10)
- Feedback.
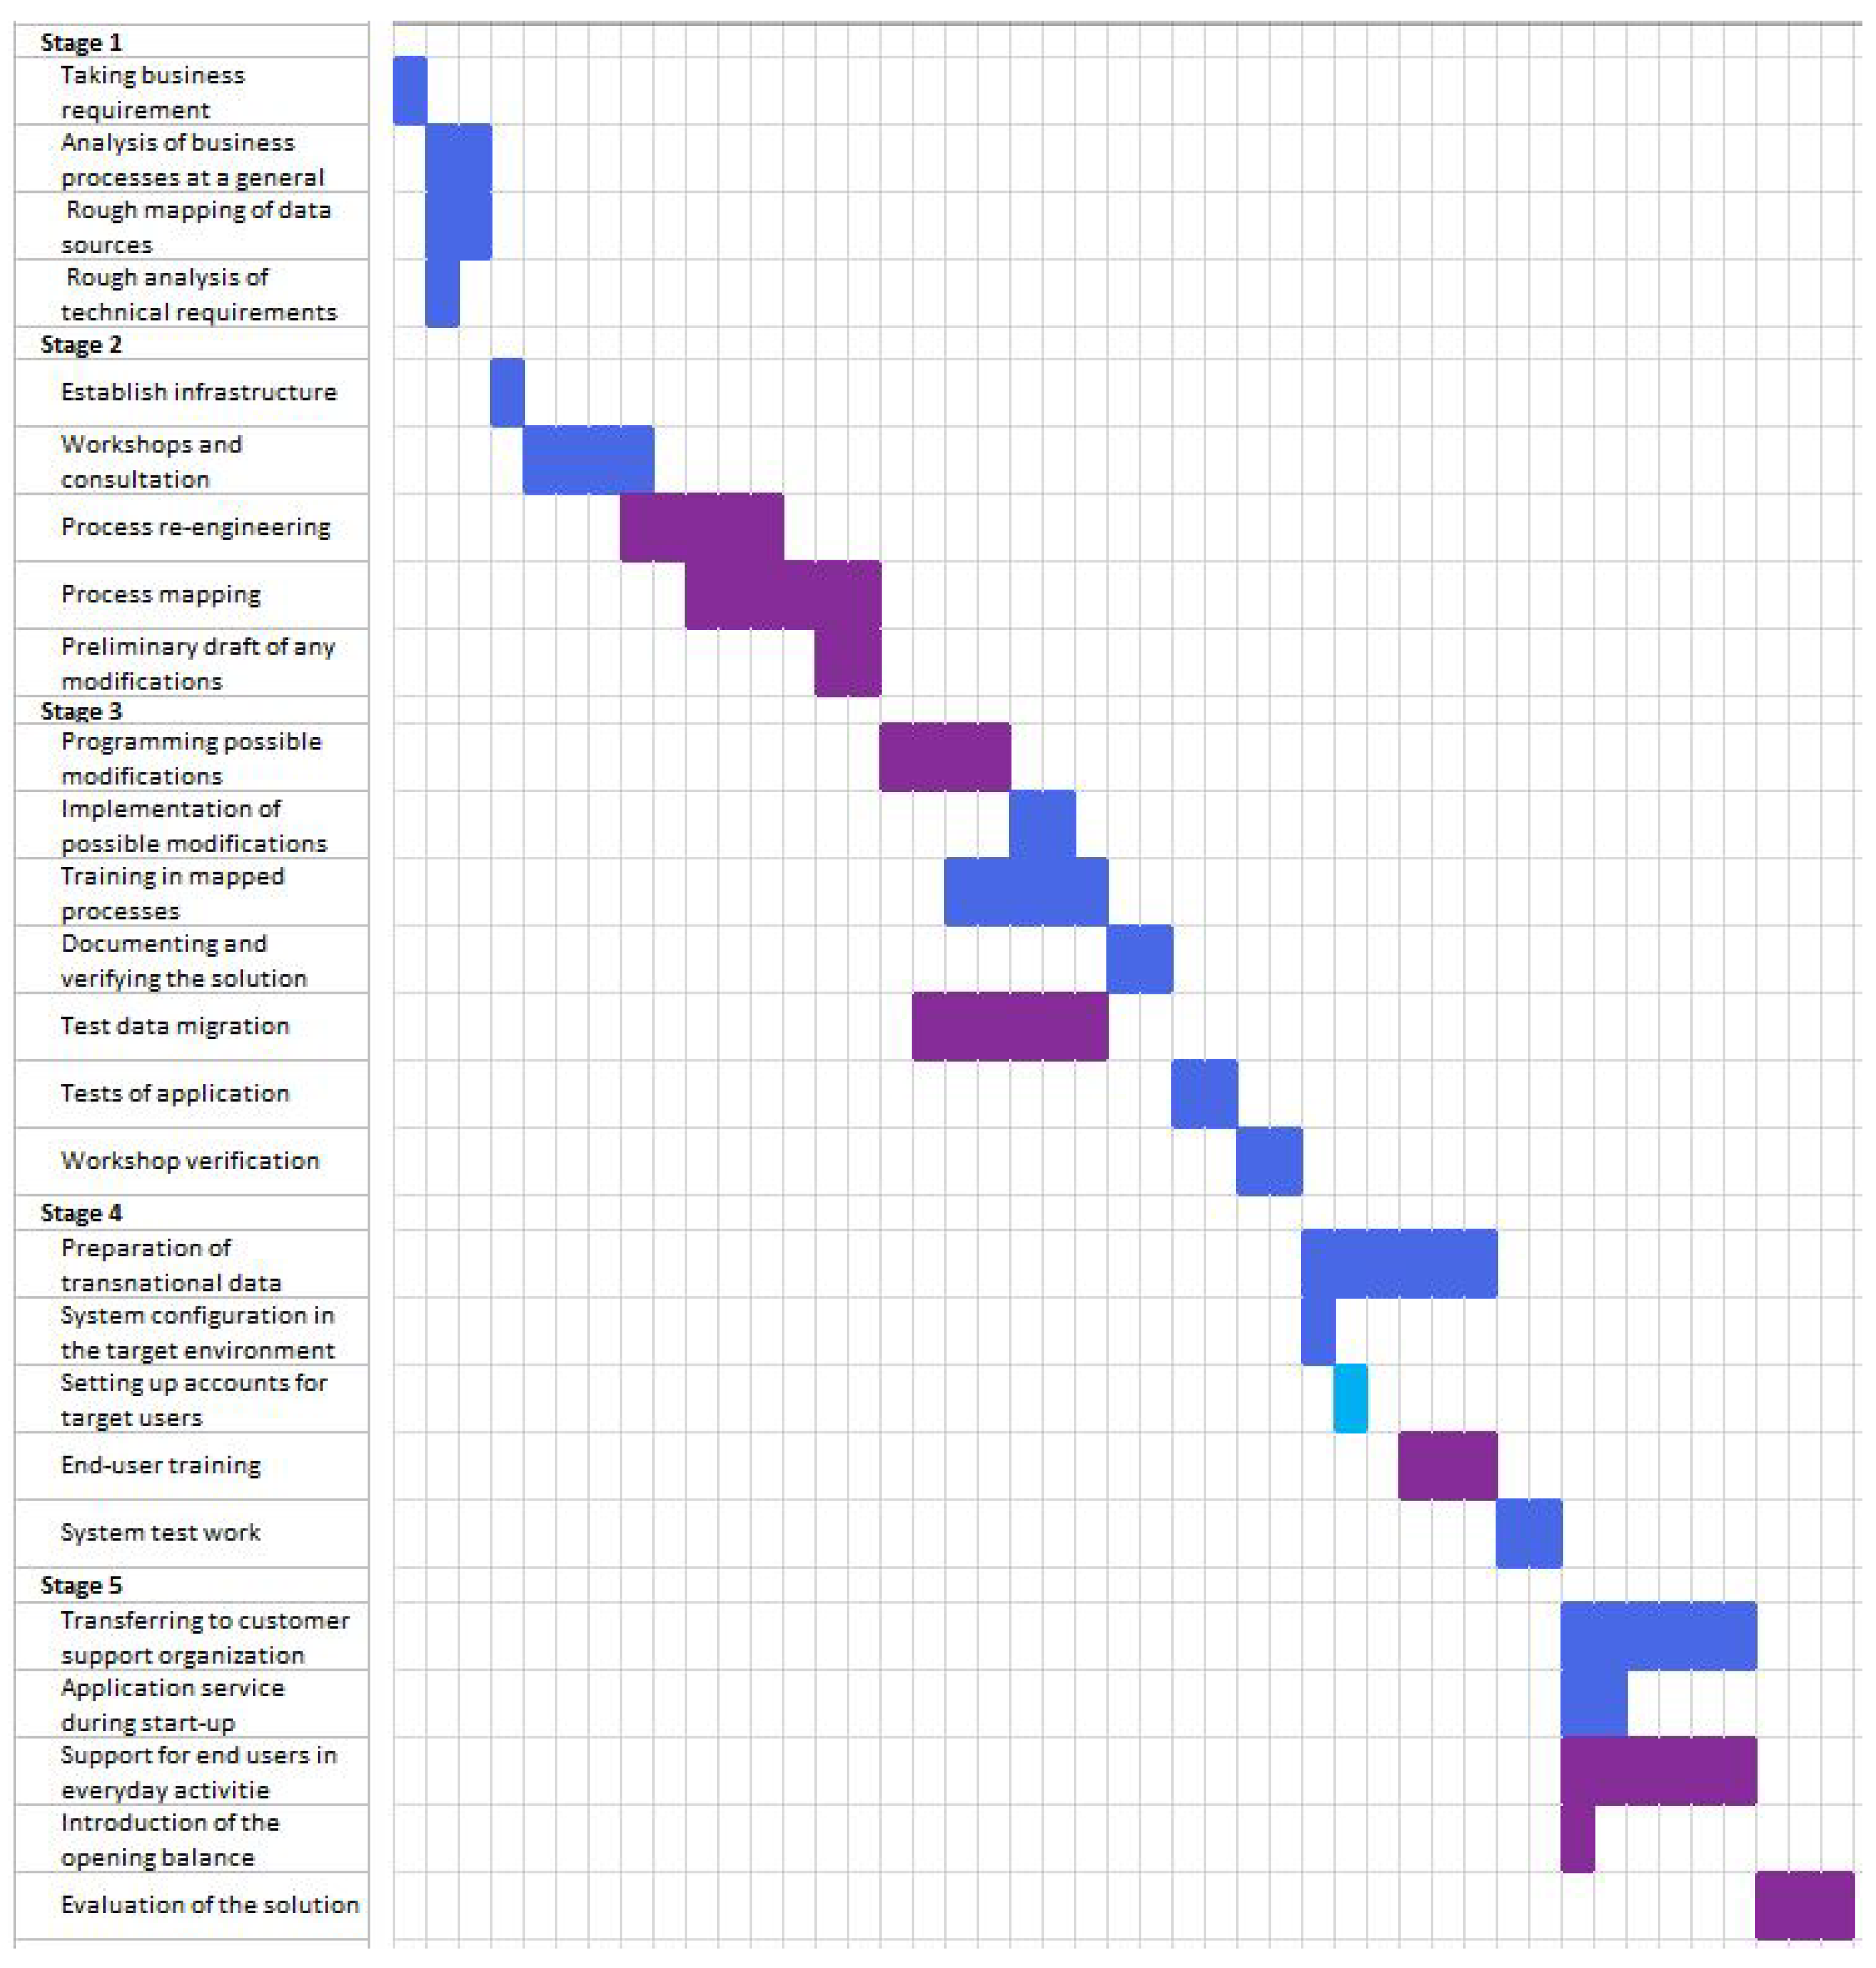
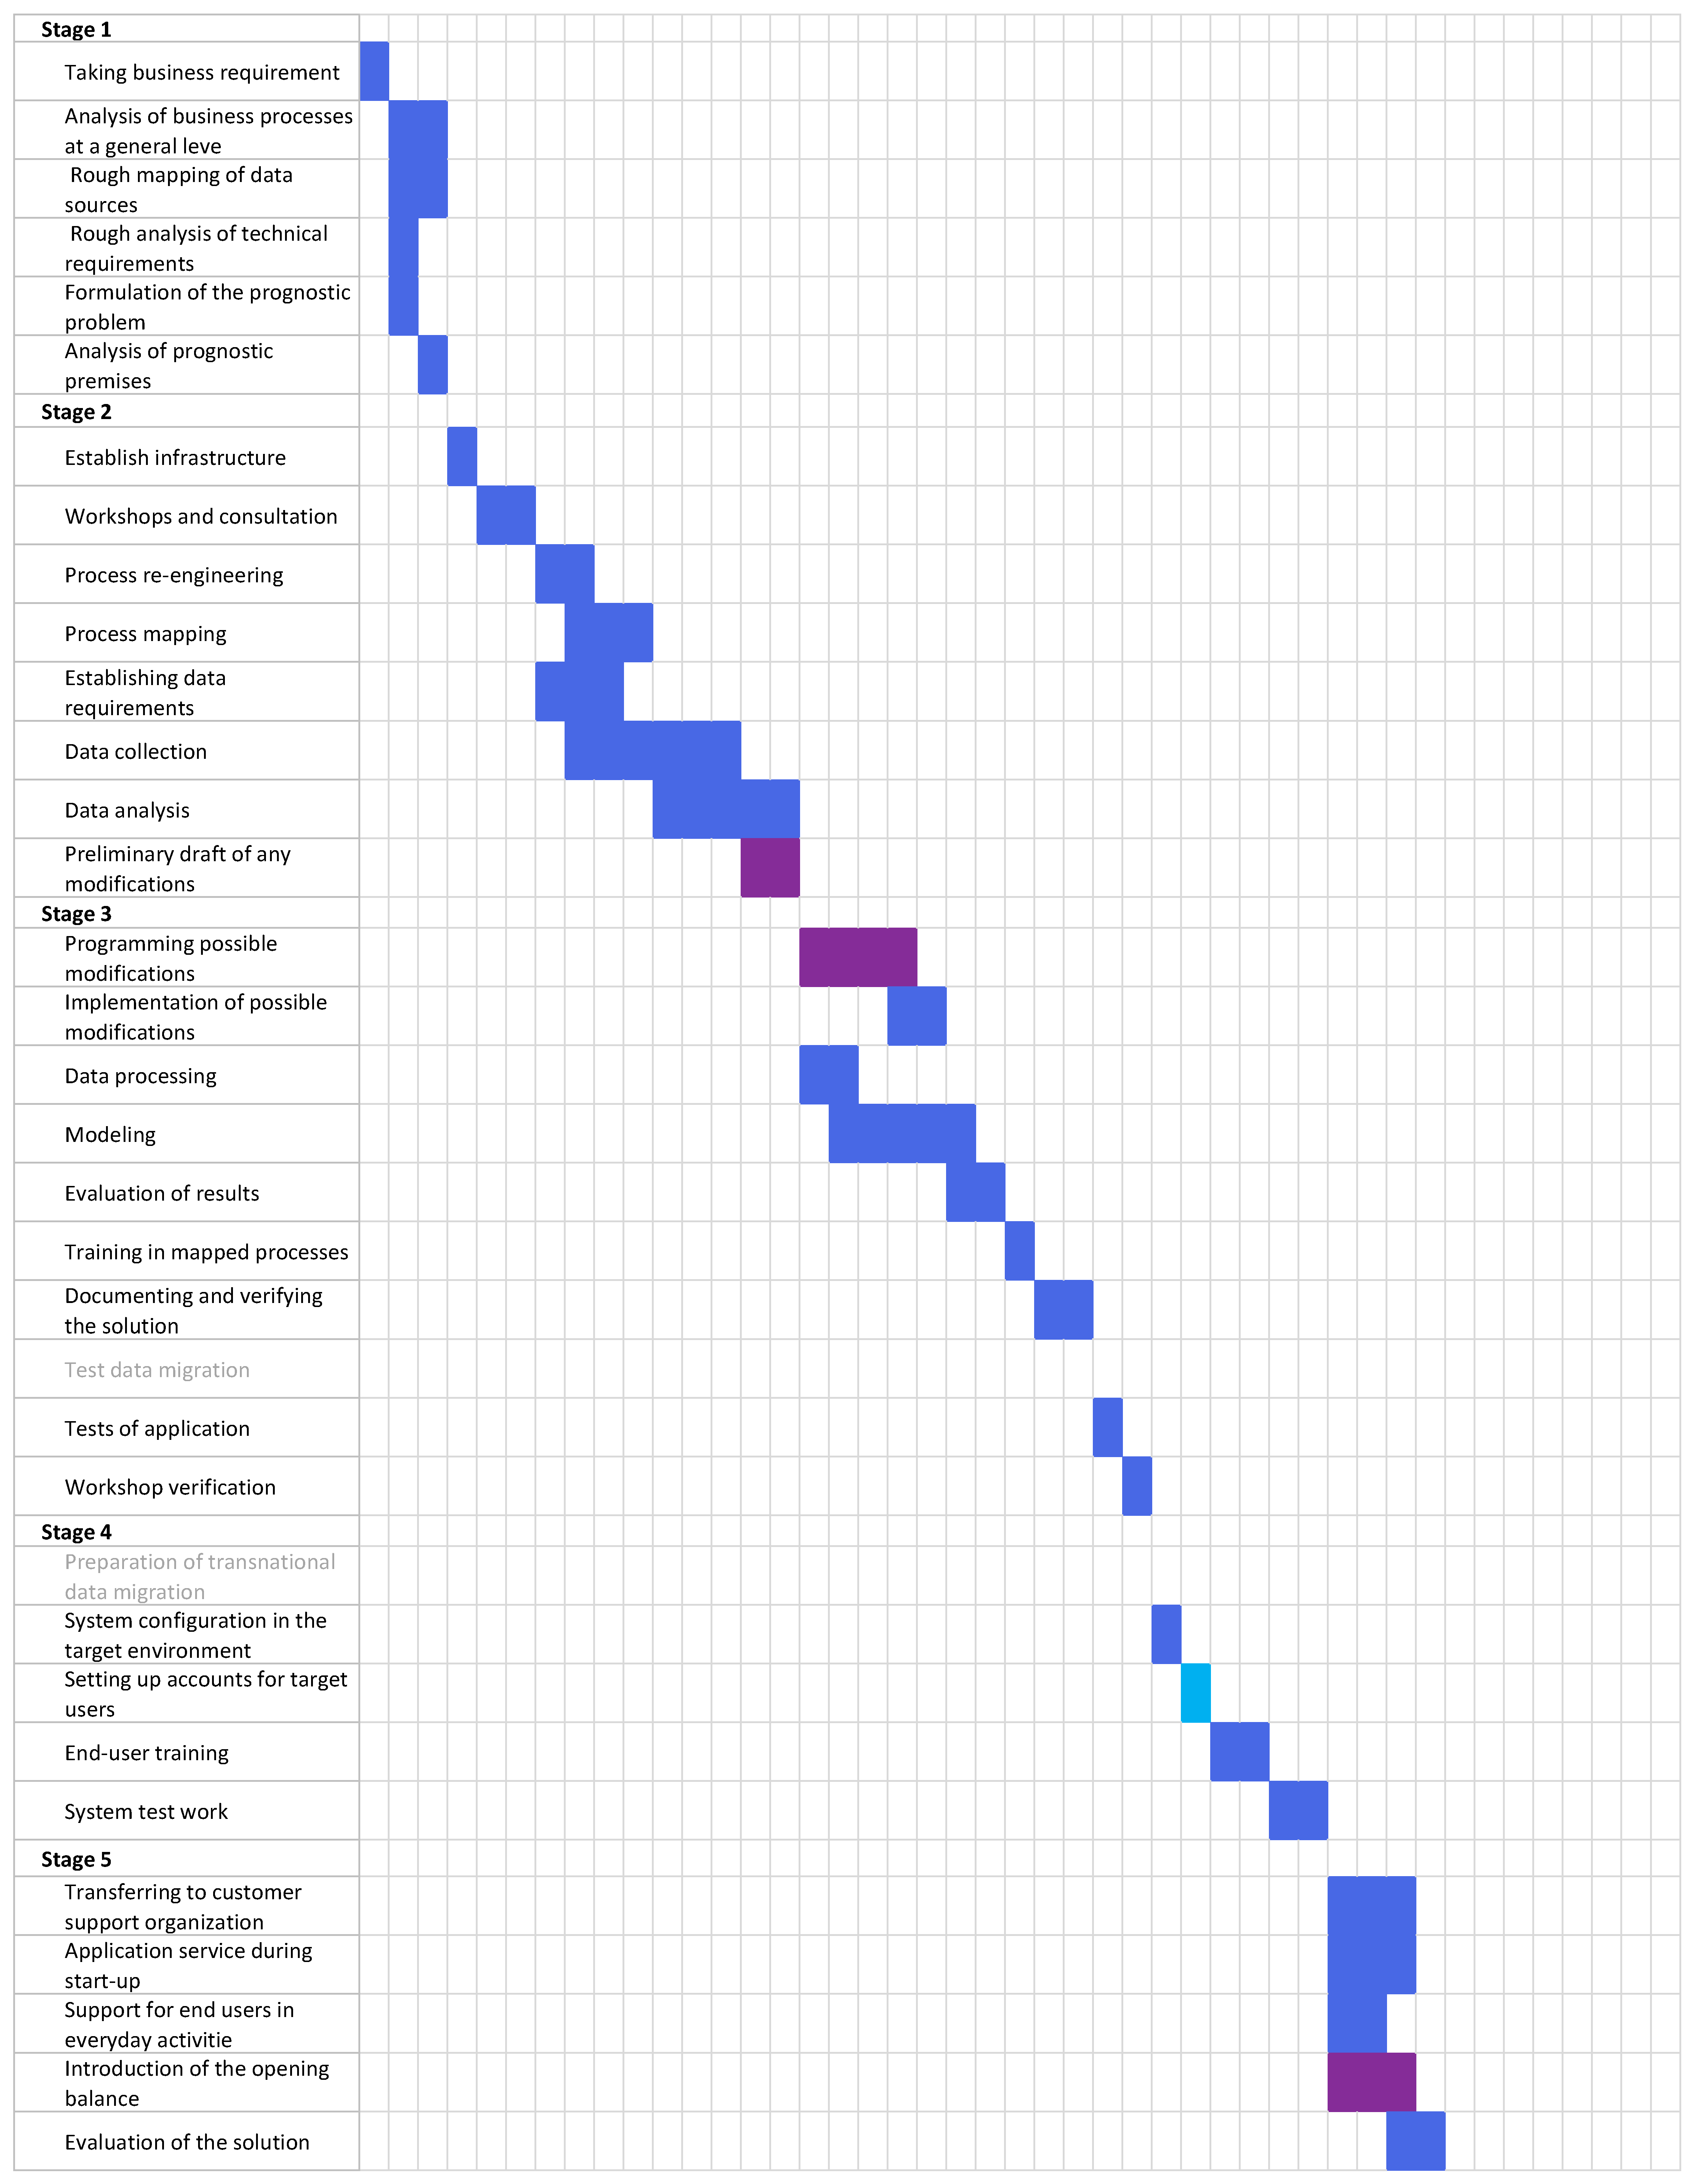
- Stage 1The first stage of the project is to define the project. In this implementation phase, based on standard methodology, the following activities are carried out: taking business requirements, analysis of business processes at a general level, rough mapping of data sources, and rough analysis of technical requirements. On this basis, a rough analysis of the demand forecasting process should be performed, as well as an outline of the mapping of the forecasting process taking place in the ERP system functionalities, so that the customer’s process is changed as little as possible. However, for the forecasting module, two additional elements should be considered: formulation of the prognostic problem and analysis of the prognostic premises.As part of the formulation of the forecasting problem, the forecasting objectives should be set up. Consequently, the client, in cooperation with the implementation consultant, determines:
- -
- Which products should be forecast: single products, product groups, or an assortment;
- -
- Who will be the recipients of forecasts in the company;
- -
- Who will be the executors of forecasts, i.e., it is necessary to determine what the composition of the team executing the forecast will be;
- -
- How the roles of persons from the team will be assigned;
- -
- Who from the team will have authority for which stages of the forecast execution;
- -
- The process for executing the forecasts within the company, i.e., what the flow of information between the participants in the process will look like.
The outcome of the analysis of prognostic premises is hypotheses about the factors shaping the phenomenon and the identification of the data set needed to make a forecast. This requires a quantitative and value assessment of the assortment by demand (ABC and XYZ analysis). Knowledge of demand in past periods—both in terms of quantity and value—is crucial for decision-making. Therefore, based on the data from the previous ERP system, the results of the ABC analysis of historical turnover value data for individual items over a longer period (e.g., one year) and the XYZ analysis in terms of quantity should be combined. As a result of the analysis, it should be determined:- -
- The frequency of forecasting, i.e., how often the forecast will need to be recalculated and how often new relevant data will come in;
- -
- The minimum satisfactory forecast accuracy to be able to use the results for decision-making;
- -
- Definition of the forecast horizon.
The first mapping of data sources also takes place in this phase. The client prepares a sample of the most important parts. Most often they are very valuable and frequently rotating items, i.e., they belong to the AX, AY, BX, and BY groups in the ABC and XYZ classification. - Stage 2Designing the solution in standard methodology by performing the following standard activities:
- Establish the infrastructure;
- Workshops and consultations;
- Process re-engineering;
- Process mapping;
- Preliminary draft of any modifications.
This phase is one of the most labour-intensive and the success of the implementation depends on its effects. As part of the infrastructure preparation for the implementation of the demand forecasting module, the installation is performed. For the demand forecasting module in the IFS application system, additional components are installed: forecasting server and client application for forecasting. As part of the workshops and consultations, training is carried out related to the methodology of forecasting based on data, familiarizing the client with the operation of the system so that the next activity, which is re-engineering of processes, can be performed. As part of the process of re-engineering, the target formulation of the prognostic problem and the analysis of prognostic premises are performed. Then, as part of the process mapping activity, the following is performed: establishing data requirements, data collection, and data analysis.In addition, in this phase, as part of the changes to the methodology, we are adding the following elements required to implement the forecasting module. It should be determined:- −
- Whether all input data will come from the IFS Application ERP system or whether it will also be imported from external sources; if data from external systems will be used, determine how this data will be migrated, to an auxiliary view in the ERP system;
- −
- Whether the input data will be volume or value sales data and what the series will look like;
- −
- The purpose of defining the series is to indicate in the ERP system the object from which historical demand data will be taken, on the basis of which forecasts will be generated; in principle, the time series should map the sales network, understood as geographical areas, distribution channels, customer groups, or individual customers;
- -
- Data constraints are needed to eliminate data redundancy, e.g., stock transfers or double-entry accounting.
As part of the data collection step, a migration of historical data from previous transaction systems is performed. Data analysis then follows. This is a very important stage, as it enables the established assumptions and data requirements to be verified and the outcome of the analysis shapes the way the data are handled in the next stage. As part of this stage, an assessment of data quality (frequency, variability), the presence of missing data, atypical observations, and the identification of uncertainty factors is performed. The reasons for abnormal observations and the significance of random variations in demand are checked. In addition, an assessment of the demand profile and an evaluation of the pattern of demand changes is performed as part of this stage. - Stage 3Preparation of the solution performed for the following standard activities:
- Programming possible modifications;
- Implementation of possible modifications;
- Training in mapped processes;
- Documenting and verifying the solution;
- Tests;
- Workshop verification;
- Test data migration.
Due to demand forecasting module requirement, as part of this stage, the training additionally includes data processing, modelling, and evaluation of the results. Modelling is usually the most labour-intensive stage, as the data cleaning stage is facilitated by using data from the ERP system. Furthermore, it is an iterative stage whose number of iterations depends on the results of the next stage, which is evaluation. This step compares different solutions for different models and their parameters and examines the impact of various elements, such as marketing campaigns. Evaluation consists of assessing the acceptability and quality of the forecast. Evaluation answers the question: Does the model used really answer the question posed, or does it need to be adjusted? This stage is iterative, performed until the evaluation of the applied predictive models to the data is positive. The three steps are feedback-coupled. Therefore, the evaluation stage also belongs to the test phase of the implementation of the demand forecasting module. Then, during the workshop verification, the above three steps are carried out by the users of the system themselves, with the support of the consultant, but the emphasis is on making the new users as independent as possible. As part of the test data migration, a larger sample of logistics and historical demand data has migrated to increase the volume of data tested. The coordination stage with the team implementing the logistics, sales, and production modules is important here. - Stage 4Implement a solution that performs the following standard activities:
- Preparation of transnational data migration;
- System configuration in the target environment;
- Setting up accounts for target users;
- End-user training;
- System test work.
In the demand forecasting module, it is important to transfer all activities and repeat them on the full data sample in the target configuration. As part of the testing, the prepared forecast should be validated and a sales and production plan should be prepared based on it. Thus, integration with other modules is confirmed. - Stage 5Go Live performs the following standard activities:
- Transferring to customer support organization;
- Application service during start-up;
- Support for end users in everyday activities;
- Introduction of the opening balance;
- Evaluation of the solution.
From the point of view of the demand forecasting module, the most important activities of this stage are two elements: User support and Evaluation of the solution. The evaluation of the solution can only take place during the feedback stage. Afterwards, the new data on the actual performance of sales flows in the feedback stage follows. Data of the actual consumption of the forecast are periodically supplemented with successive periods as they flow into the database (as they may be more frequent than the forecast period). This gives the opportunity to correct the forecast (or modify it) over time—i.e., gradual adaptation to the changed external conditions.
6.3. Impact of New Methodology for Implementation in the Mass Customization Companies
- Formulation of the forecasting problem—in this phase, two elements are most relevant to the mass customization industry:
- Establishing the role of traders in the forecasting process—individually won contracts can be so large and non-cyclical that they result in high forecast unverifiability. Hence, traders should be able to manually adjust the forecast with the knowledge they have from the market;
- To determine the product groups that will be forecast together.
- Analyse the forecasting rationale—if the problem is formulated well enough in the previous step, the rationale analysis should be classic and not contain too many unexpected difficulties;
- Determining input data requirements—an important step for this type of industry is precisely the appropriate establishment of the input data requirements. Therefore, it is necessary to properly define proxy indices and put them together into a forecast;
- Data collection—the collection of data is from previous companies’ systems or indicates external sources;
- Data analysis—classical, but in this industry, this stage can be time-consuming;
- Data processing—as the industry is characterized by high variability, there will be outlier observations in the data sets, for which a difficult decision has to be made as to whether, or how to, include them in the modelling stage or not;
- Modelling stage—in this industry, in addition to properly modelling the grouping of items, it is often necessary to take into account data from traders. That is, to develop an appropriate information flow over manual adjustments to forecasts created by predictive models;
- Evaluation—due to the manual revisions of forecasts, evaluation is a more time-consuming stage due to the inability to rely only on statistical measures of forecast quality.
7. Discussion and Conclusions
- Creating direct predictions for intermittent goods directly, by incorporating usage statistics in final products and production lead time requirements. This would not necessitate additional data collection and could be realized within a normal implementation regime;
- Combining forecasts with the DDMRP (Demand Driven Material Requirements Planning) approach to calculate the inventory of subordinate items, assuming that for non-key level 1 intermediates, whose inventory cost is not large, we maintain a sufficiently large safety stock (buffer);
- Creation of hierarchical models and partial pooling to better capture the uncertainty characteristic for low volume productions.
Author Contributions
Funding
Institutional Review Board Statement
Informed Consent Statement
Data Availability Statement
Conflicts of Interest
Sample Availability
Abbreviations
| ERP | Enterprise Resource Planning |
| MRP | Material Requirements Planning |
| DDMRP | Data-driven Material Requirements Planning |
| BOM | Bill of Materials |
| S&OP | Sales and Operations Planning |
References
- Guo, S.; Choi, T.M.; Shen, B.; Jung, S. Inventory Management in Mass Customization Operations: A Review. IEEE Trans. Eng. Manag. 2019, 66, 412–428. [Google Scholar] [CrossRef]
- Jin, M.; Wang, H.; Zhang, Q.; Zeng, Y. Supply chain optimization based on chain management and mass customization. Inf. Syst. E-Bus. Manag. 2020, 18, 647–664. [Google Scholar] [CrossRef]
- Fattahi, A.; Dasu, S.; Ahmadi, R. Mass Customization and the “Parts-Procurement Planning Problem”. Manag. Sci. 2022, 68, 5778–5797. [Google Scholar] [CrossRef]
- ElMadany, H.; Alfonse, M.; Aref, M. Forecasting in Enterprise Resource Planning (ERP) Systems: A Survey. In Digital Transformation Technology; Springer: Singapore, 2022; pp. 395–406. [Google Scholar] [CrossRef]
- Siddiqui, R.; Azmat, M.; Ahmed, S.; Kummer, S. A hybrid demand forecasting model for greater forecasting accuracy: The case of the pharmaceutical industry. Supply Chain. Forum Int. J. 2022, 23, 124–134. [Google Scholar] [CrossRef]
- Pekša, J. Extensible Portfolio of Forecasting Methods for ERP Systems: An Integration Approach. Inf. Technol. Manag. Sci. 2018, 21, 64–68. [Google Scholar] [CrossRef]
- Tiwari, S. Supply chain integration and Industry 4.0: A systematic literature review. Benchmarking Int. J. 2020, 28, 990–1030. [Google Scholar] [CrossRef]
- Erkayman, B. Transition to a JIT production system through ERP implementation: A case from the automotive industry. Int. J. Prod. Res. 2019, 57, 5467–5477. [Google Scholar] [CrossRef]
- Torn, I.; Vaneker, T. Mass Personalization with Industry 4.0 by SMEs: A concept for collaborative networks. Procedia Manuf. 2019, 28, 135–141. [Google Scholar] [CrossRef]
- Kim, M.; Jeong, J.; Bae, S. Demand Forecasting Based on Machine Learning for Mass Customization in Smart Manufacturing; Association for Computing Machinery: New York, NY, USA, 2019; ICDMML 2019; pp. 6–11. [Google Scholar] [CrossRef]
- Ren, S.; Chan, H.L.; Siqin, T. Demand forecasting in retail operations for fashionable products: Methods, practices, and real case study. Ann. Oper. Res. 2020, 91, 761–777. [Google Scholar] [CrossRef]
- Fattahi, A.; Dasu, S.; Ahmadi, R. Mass customization and “Forecasting Options’ penetration rates problem”. Oper. Res. 2019, 67, 1120–1134. [Google Scholar] [CrossRef]
- Liu, N.; Chow, P.S.; Zhao, H. Challenges and critical successful factors for apparel mass customization operations: Recent development and case study. Ann. Oper. Res. 2019, 291, 531–563. [Google Scholar] [CrossRef]
- Nagpal, S.; Khatri, S.K.; Kumar, A. Comparative study of ERP implementation strategies. In Proceedings of the 2015 Long Island Systems, Applications and Technology, Farmingdale, NY, USA, 1 May 2015; pp. 1–9. [Google Scholar]
- El Mariouli, M.; Laassiri, J. Applying Agile Procedure Model to Improve ERP Systems Implementation Strategy. In Information Systems and Technologies to Support Learning; Rocha, Á., Serrhini, M., Eds.; Springer International Publishing: Cham, Switzerland, 2019; pp. 471–481. [Google Scholar]
- Kraljić, A.; Kraljić, T. Agile software engineering practices and ERP implementation with focus on SAP activate methodology. In Proceedings of the International Conference on Business Informatics Research, Stockholm, Sweden, 24–26 September 2018; Springer: Berlin/Heidelberg, Germany, 2018; pp. 190–201. [Google Scholar]
- Barth, C.; Koch, S. Critical success factors in ERP upgrade projects. Ind. Manag. Data Syst. 2019, 119, 656–675. [Google Scholar] [CrossRef]
- Reitsma, E.; Hilletofth, P. Critical success factors for ERP system implementation: A user perspective. Eur. Bus. Rev. 2018, 30, 285–310. [Google Scholar] [CrossRef]
- Gavali, A.; Halder, S. Identifying critical success factors of ERP in the construction industry. Asian J. Civ. Eng. 2020, 21, 311–329. [Google Scholar] [CrossRef]
- Grobler-Debska, K.; Żak, B.; Baranowski, J.; Kucharska, E.; Domagala, A. Research on effective analysis and forecasting of demand in ERP systems-case studies. In Proceedings of the 2021 25th International Conference on Methods and Models in Automation and Robotics (MMAR), Międzyzdroje, Poland, 23–26 August 2021; pp. 291–296. [Google Scholar] [CrossRef]
- Pollard, D.; Chuo, S.; Lee, B. Strategies for mass customization. J. Bus. Econ. Res. (JBER) 2008, 6. [Google Scholar] [CrossRef]
- Orošnjak, M.; Jocanović, M.; Karanović, V.; Vekić, A.; Medić, N. Transformation from mass production to mass customization in SCM: Obstacles and advantages. Acta Tech. Corviniensis-Bull. Eng. 2017, 10, 29–34. [Google Scholar]
- Bergman, J.J.; Noble, J.S.; McGarvey, R.G.; Bradley, R.L. A Bayesian approach to demand forecasting for new equipment programs. Robot. Comput.-Integr. Manuf. 2017, 47, 17–21. [Google Scholar] [CrossRef]
- Bacchetti, A.; Saccani, N. Spare parts classification and demand forecasting for stock control: Investigating the gap between research and practice. Omega 2012, 40, 722–737. [Google Scholar] [CrossRef]
- Best ERP Software. Available online: https://www.selecthub.com/erp-software/ (accessed on 1 March 2021).
- Panorama Consulting Solutions. 2018 ERP Report. Available online: https://cdn2.hubspot.net/hubfs/2184246/2018%20ERP%20Report.pdf (accessed on 1 March 2021).
- Grabski, S.V.; Leech, S.A. Complementary controls and ERP implementation success. Int. J. Account. Inf. Syst. 2007, 8, 17–39. [Google Scholar] [CrossRef]
- Mabert, V.A.; Soni, A.; Venkataramanan, M. Enterprise resource planning: Managing the implementation process. Eur. J. Oper. Res. 2003, 146, 302–314. [Google Scholar] [CrossRef]
- Domagała, A.; Grobler-Dębska, K.; Wąs, J.; Kucharska, E. Post-Implementation ERP Software Development: Upgrade or Reimplementation. Appl. Sci. 2021, 11, 4937. [Google Scholar] [CrossRef]
- Kraljic, A.; Kraljic, T.; Poels, G.; Devos, J. ERP implementation methodologies and frameworks: A literature review. In Proceedings of the 8th European Conference on IS Management and Evaluation (ECIME), Ghent, Belgium, 11–12 September 2014; Academic Conferences and Publishing International Limited: Reading, UK, 2014; pp. 309–316. [Google Scholar]
- Bancroft, N.; Seip, H.; Sprengel, A. Implementing SAP R/3. How to Introduce a Large System into a Large Organization, 2nd ed.; Conn: Greenwich, CT, USA, 1998. [Google Scholar]
- Kuruppuarachchi, P.R. Organisational factors and IT projects-a critical review. In Proceedings of the 2000 IEEE International Conference on Management of Innovation and Technology. ICMIT 2000.‘Management in the 21st Century’ (Cat. No. 00EX457), Singapore, 12–15 November 2000; Volume 2, pp. 496–501. [Google Scholar]
- Markus, M.; Tanis, C. Chapter 10: The Enterprise System Experience-From Adoption to Success. In Framing the Domains of IT Management: Projecting the Future Through the Past; Pinnaflex Educational Resources Inc.: Cincinnati, OH, USA, 2000; pp. 173–207. [Google Scholar]
- Mäkipää, M. Implementation of Enterprise Resource Planning System–theoretical research approach and empirical evaluation in two cases. In Proceedings of the 26th Information Systems Research Seminar in Scandinavia, Porvoo, Finland, 9–12 August 2003. [Google Scholar]
- Parr, A.N.; Shanks, G. A taxonomy of ERP implementation approaches. In Proceedings of the 33rd Annual Hawaii International Conference on System Sciences, Maui, HI, USA, 7 January 2000; p. 10. [Google Scholar]
- Umble, E.J.; Haft, R.R.; Umble, M.M. Enterprise Resource Planning: Implementation Procedures and Critical Success Factors; Elsevier: Amsterdam, The Netherlands, 2003; Volume 146, pp. 241–257. [Google Scholar]


| Author(s) | ERP Implementation Model |
|---|---|
| Bancroft et al. [31] | (1) Focus, (2) Creating As-Is picture, (3) Creating of the To-Be design, (4) Construction and testing, (5) Actual Implementation |
| Kuruppuarachchi [32] | (1) Initiation, (2) Requirement definition, (3) Acquisition/development, (4) Implementation, (5) Termination |
| Markus and Tanis [33] | (1) Project chartering, (2) The project, (3) Shakedown, (4) Onward and upward |
| Makipaa [34] | (1) Initiative, (2) Evaluation, (3) Selection, (4) Modification, Business process Re-engineering, and Conversion of Data, (5) Training, (6) Go-Live, (7) Termination, (8) Exploitation and Development |
| Parr and Shanks [35] | (1) Planning, (2) Project: setup, re-engineer, design, configuration and testing, installation, (3) Enhancement |
| Umble et al. [36] | (1) Review the pre-implementation process to date, (2) Install and test any new hardware, (3) Install the software and perform the computer room pilot, (4) Attend system training, (5) Train on the conference room pilot, (6) Established security and necessary permissions, (7) Ensure that all data bridges are sufficiently robust, and the data are sufficiently accurate, (8) Document policies and procedures, (9) Bring the entire organization online, either in a total cut over or in a phased approach, (10) Celebrate, (11) Improve continually |
| Verviell and Halingten | (1) Planning, (2) Information search, (3) Selection, (4) Evaluations, (5) Negotiation |
| IFS Implementation Methodology | (1) Initiate Project, (2) Designing the solution, (3) Preparation of the solution, (4) Implement Solution, (5) Go Live. |
| INFOR Deployment Method | (1) Inception, (2) Elaboration, (3) Construction, (4) Transition and Optimize. |
| MICROSOFT Dynamics Sure Step Methodology | (1) Diagnostic and Analysis, (2) Design, (3) Development and (4) Operation. |
| ORACLE - A.I.M. (Applications Implementation Methodology) | (1) Definition, (2) Operations Analysis, (3) Solution Design, (4) Build, (5) Transition, (6) Production. |
| SAP–ASAP methodology | (1) Project Preparation, (2) Blueprint, (3) Realization, (4) Final Preparation, (5) Go Live Support, (6) Operate. |
Publisher’s Note: MDPI stays neutral with regard to jurisdictional claims in published maps and institutional affiliations. |
© 2022 by the authors. Licensee MDPI, Basel, Switzerland. This article is an open access article distributed under the terms and conditions of the Creative Commons Attribution (CC BY) license (https://creativecommons.org/licenses/by/4.0/).
Share and Cite
Grobler-Dębska, K.; Kucharska, E.; Żak, B.; Baranowski, J.; Domagała, A. Implementation of Demand Forecasting Module of ERP System in Mass Customization Industry—Case Studies. Appl. Sci. 2022, 12, 11102. https://doi.org/10.3390/app122111102
Grobler-Dębska K, Kucharska E, Żak B, Baranowski J, Domagała A. Implementation of Demand Forecasting Module of ERP System in Mass Customization Industry—Case Studies. Applied Sciences. 2022; 12(21):11102. https://doi.org/10.3390/app122111102
Chicago/Turabian StyleGrobler-Dębska, Katarzyna, Edyta Kucharska, Bartłomiej Żak, Jerzy Baranowski, and Adam Domagała. 2022. "Implementation of Demand Forecasting Module of ERP System in Mass Customization Industry—Case Studies" Applied Sciences 12, no. 21: 11102. https://doi.org/10.3390/app122111102
APA StyleGrobler-Dębska, K., Kucharska, E., Żak, B., Baranowski, J., & Domagała, A. (2022). Implementation of Demand Forecasting Module of ERP System in Mass Customization Industry—Case Studies. Applied Sciences, 12(21), 11102. https://doi.org/10.3390/app122111102