
Echelle Grating Spectroscopic Technology for High-Resolution and Broadband Spectral Measurement


Abstract
1. Introduction
2. Fundamental Characteristics
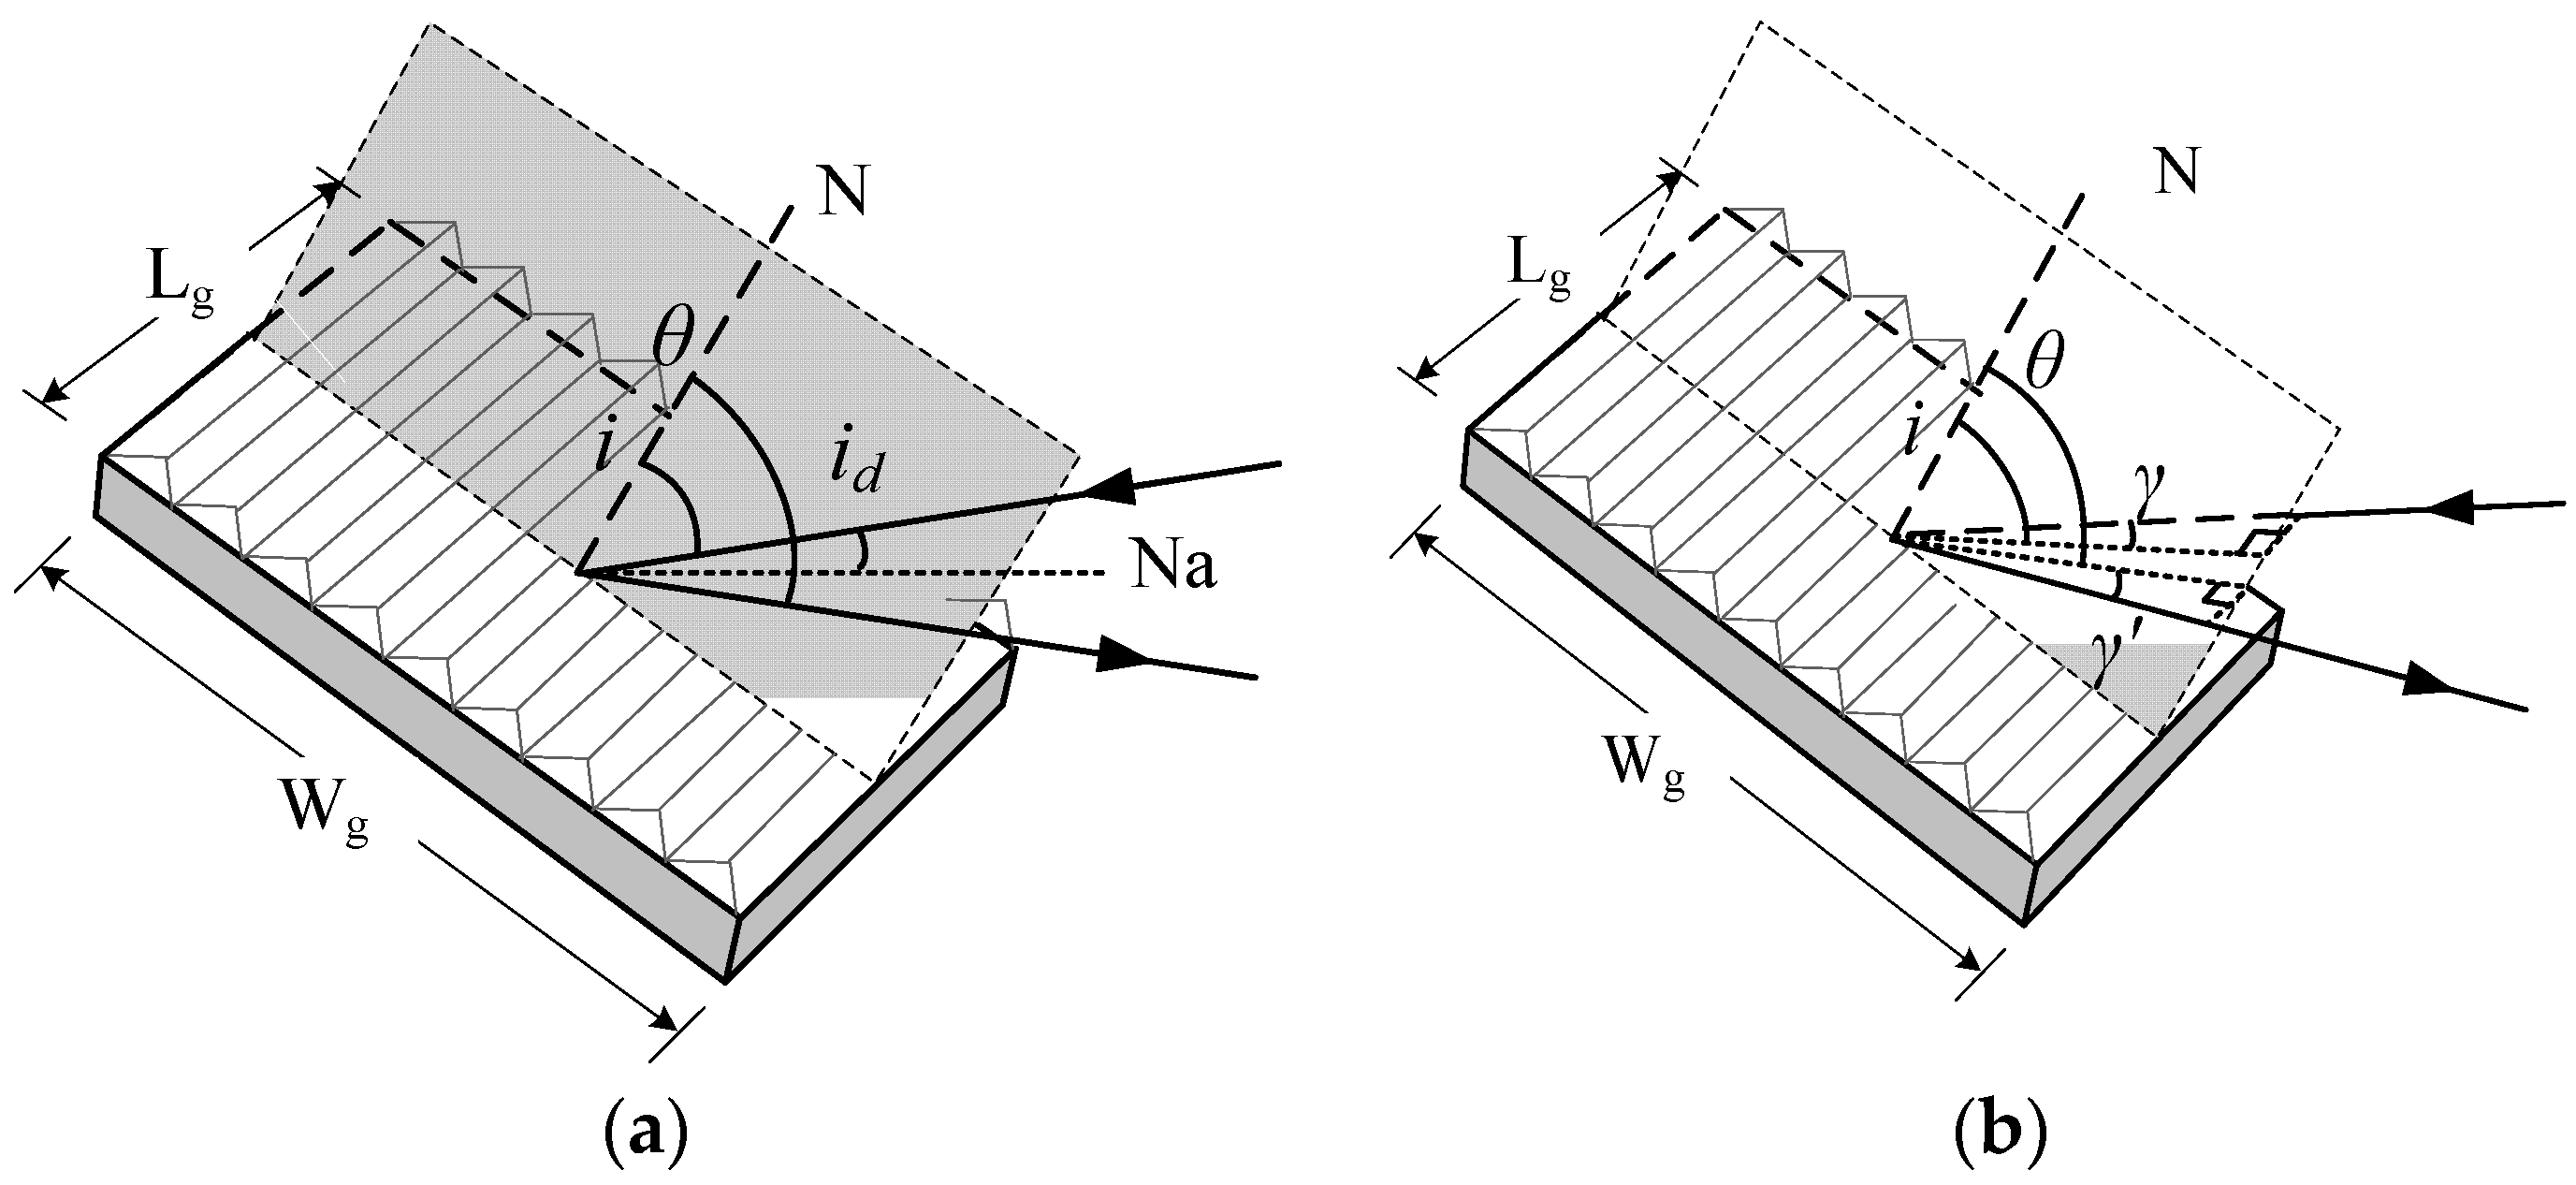
2.1. High Resolving Power
2.2. Blaze in Full Spectrum
3. Optical Layout
3.1. Littrow Mode
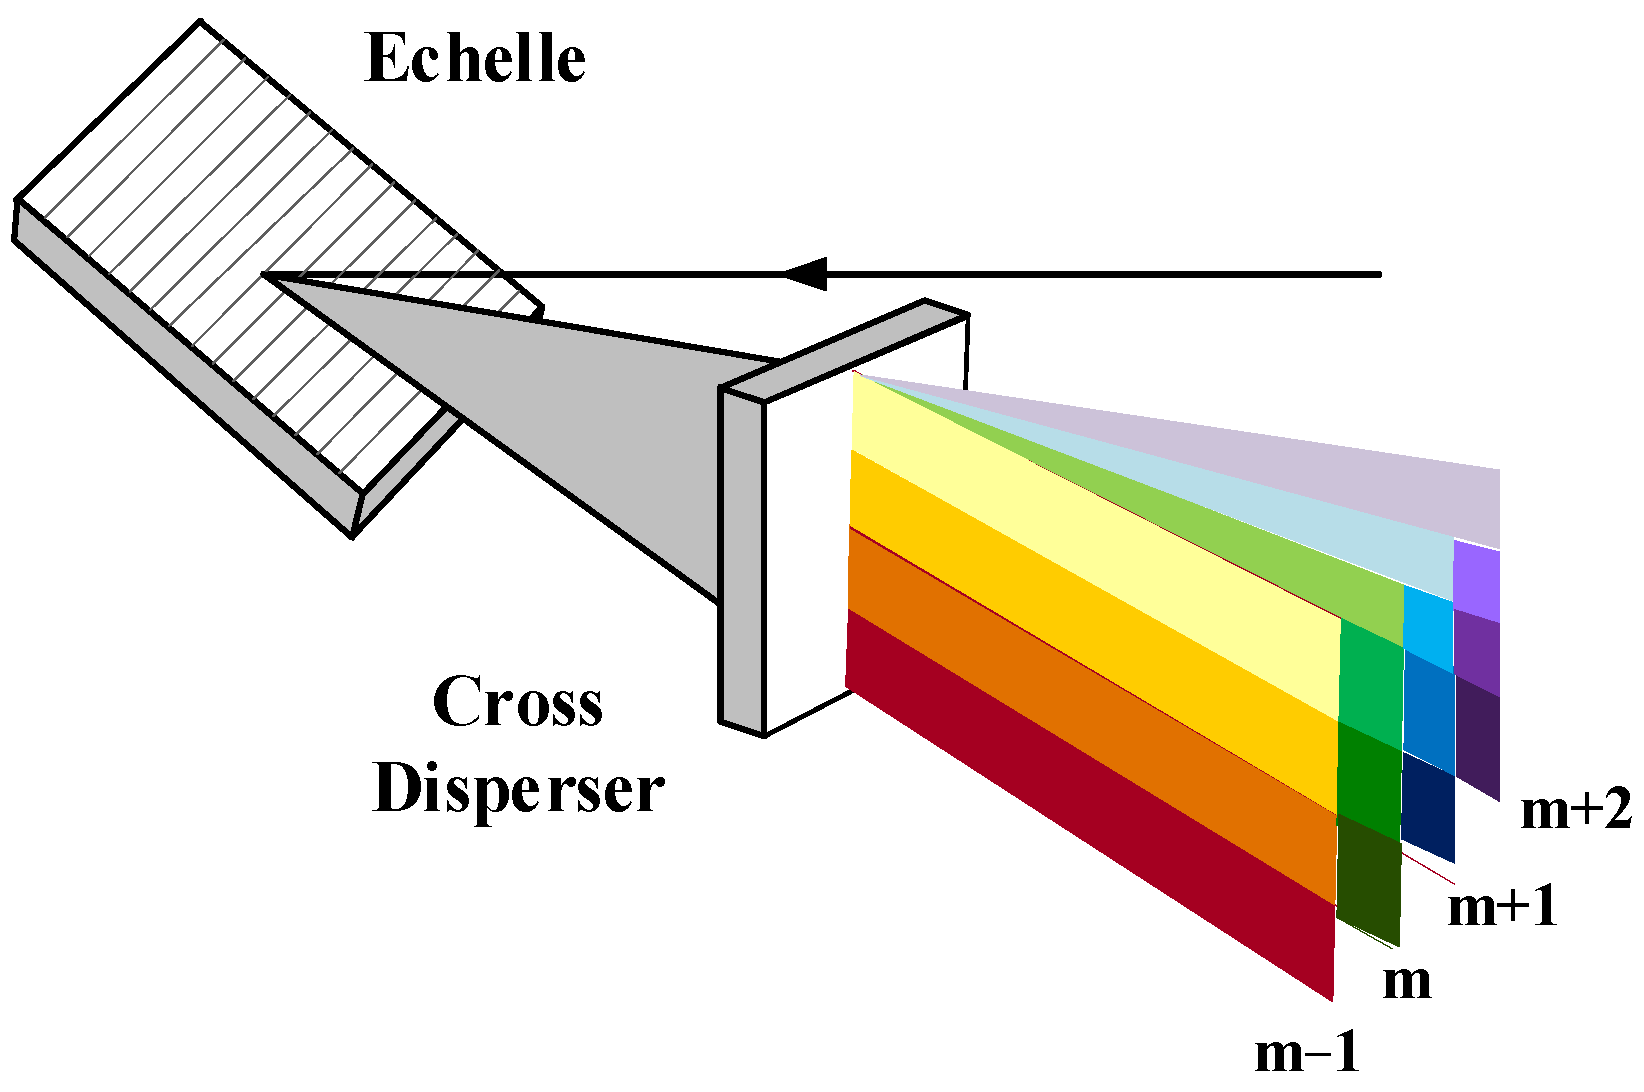
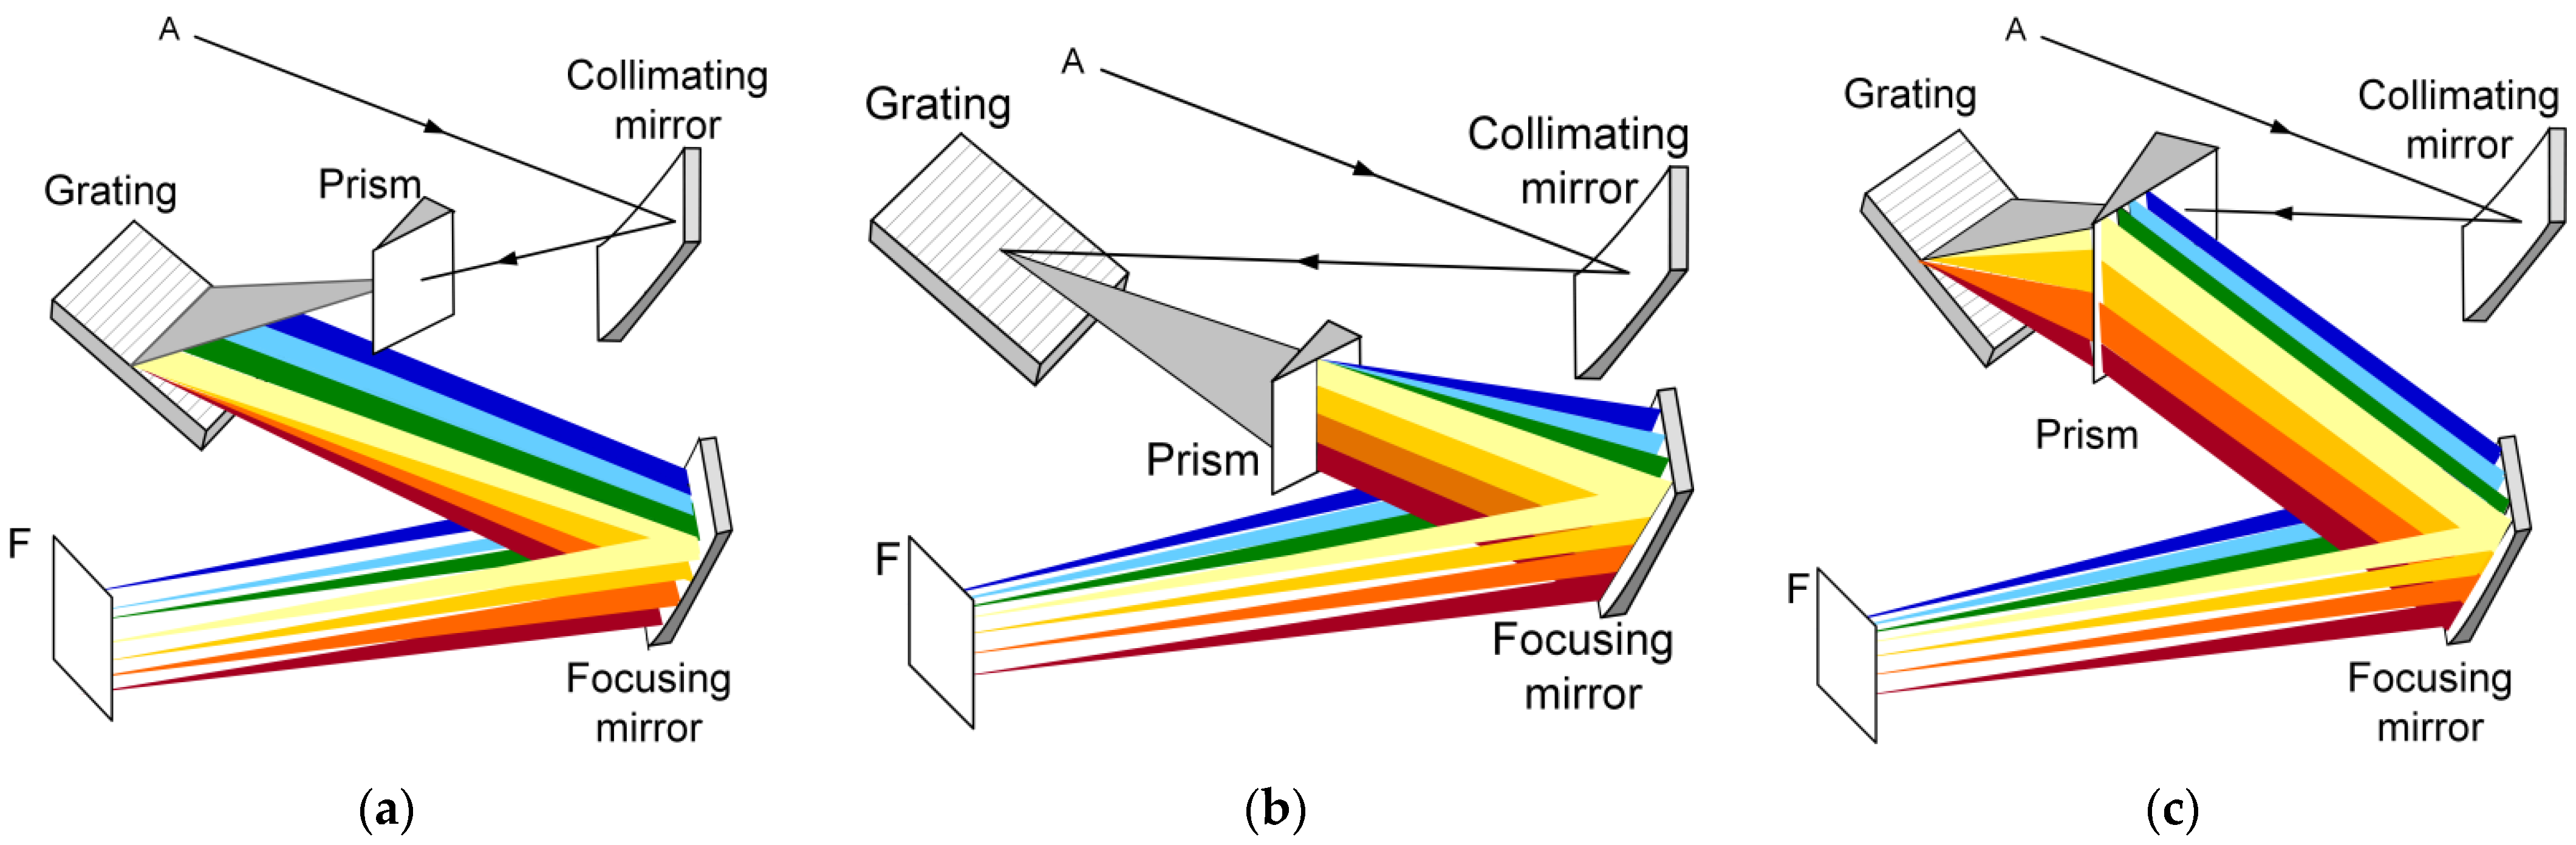
3.2. Cross-Dispersion Layout
3.3. Collimating/Focusing Optics
3.4. Detector
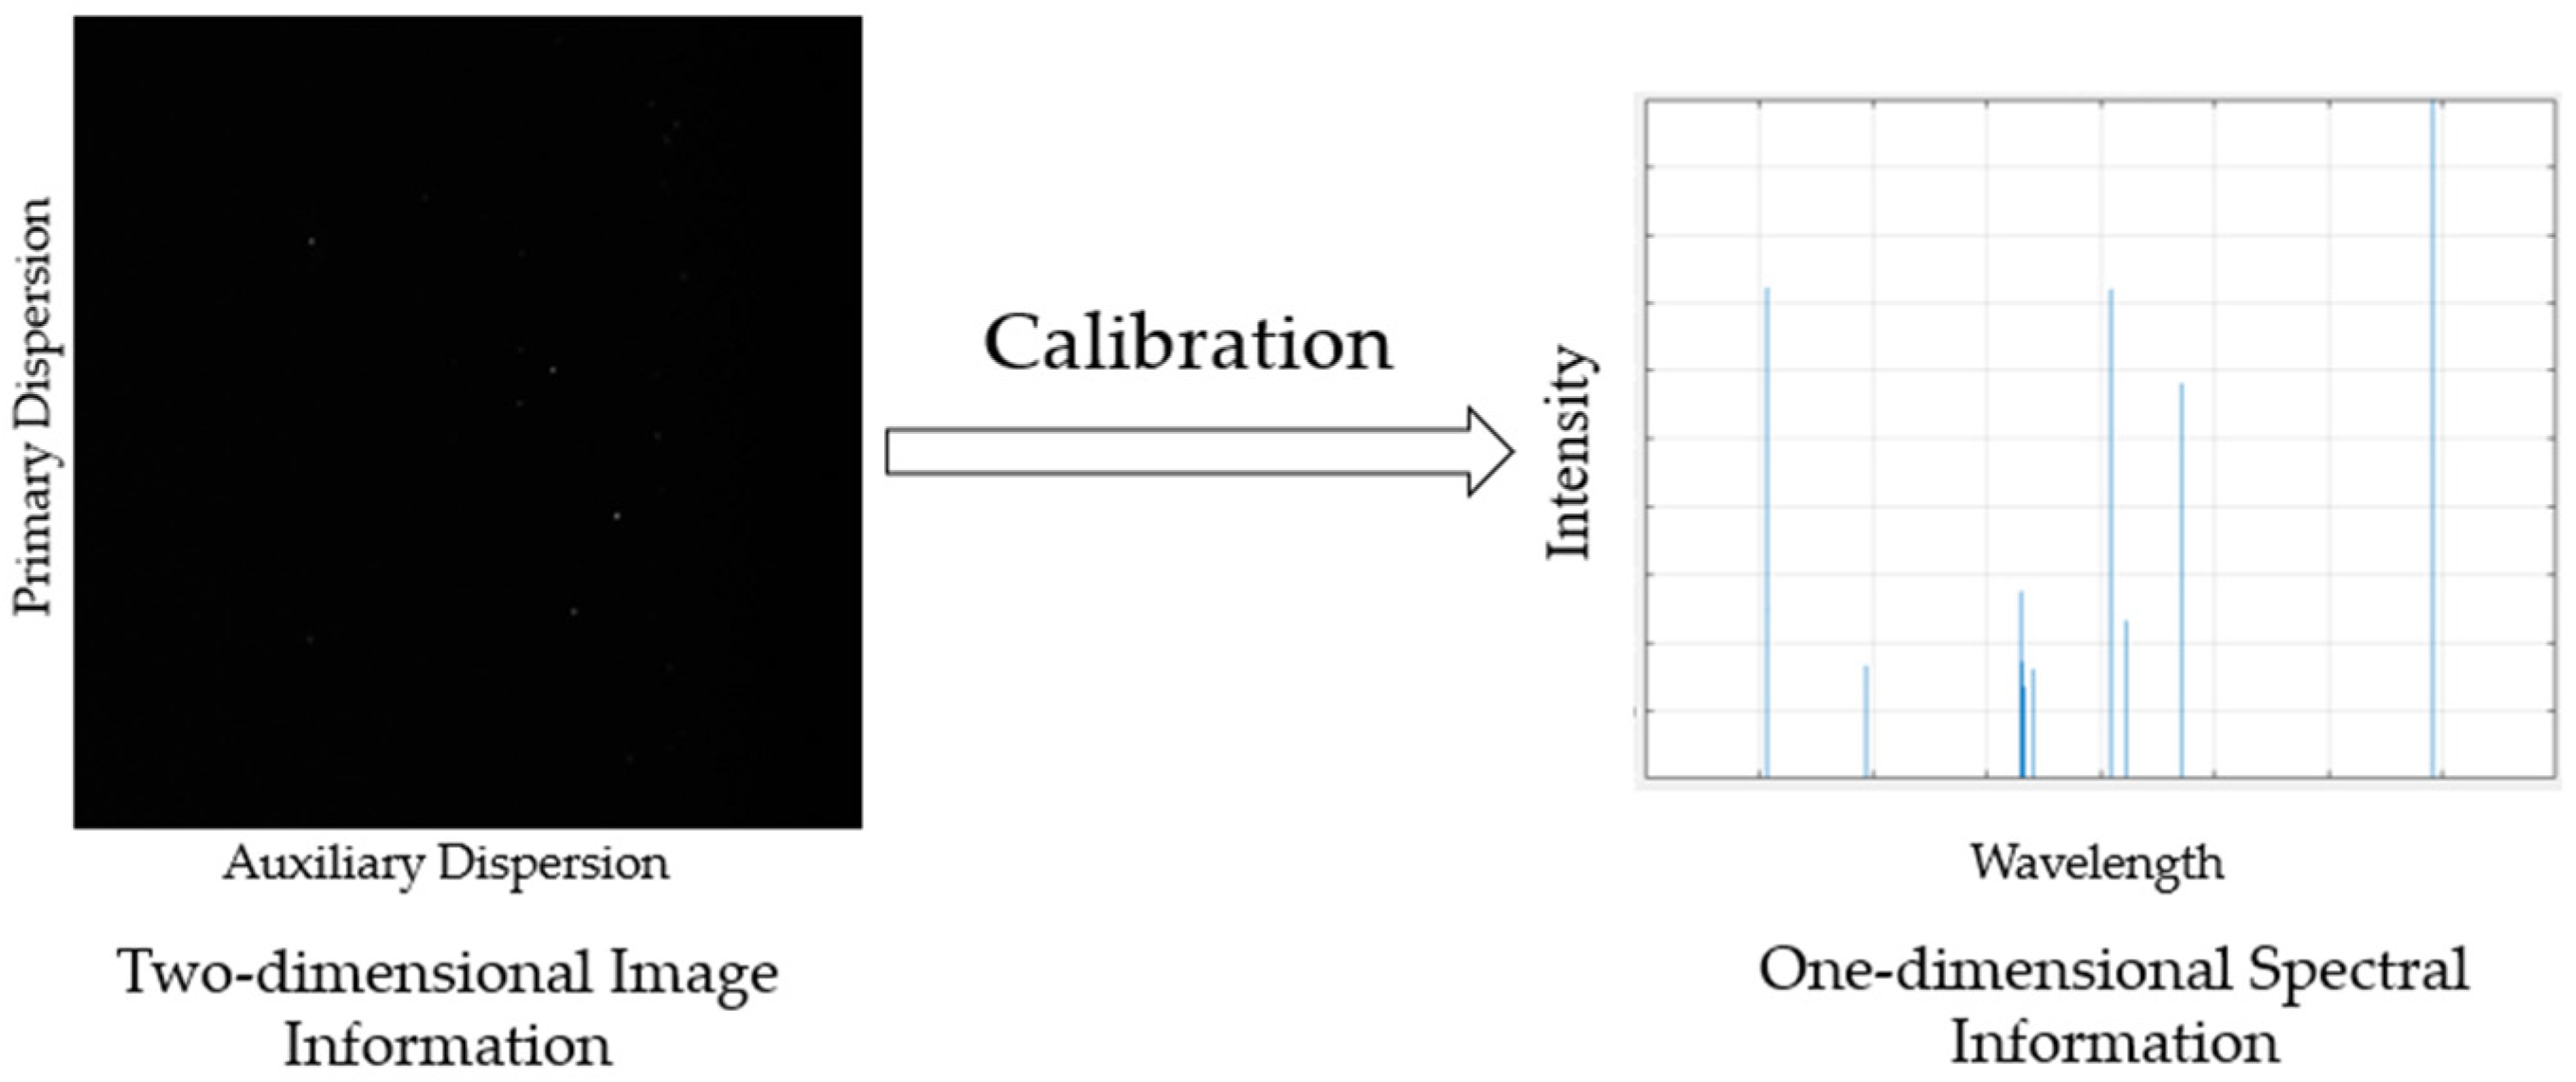
4. Calibration
5. Applications
5.1. Commercial Instruments
5.2. Astronomical Instruments
6. Discussions and Outlook
7. Conclusions
Author Contributions
Funding
Institutional Review Board Statement
Informed Consent Statement
Data Availability Statement
Conflicts of Interest
References
- Neumann, W. Fundamentals of Dispersive Optical Spectroscopy Systems (Pm242); SPIE Press: Bellingham, DC, USA, 2013. [Google Scholar]
- Lentini, N.; Tiong, B.C.K.; Dubois, L.; Feger, T.; Coutts, D.W.; Fallscheer, C.; Schwab, C. A high resolution echelle spectrograph for exoplanet searches with small aperture telescopes. In Proceedings of the Ground-Based and Airborne Instrumentation for Astronomy VII, Austin, TX, USA, 10–14 June 2018; Volume 10702. [Google Scholar]
- Bourdarot, G.; Le Coarer, E.; Bonfils, X.; Alecian, E.; Rabou, P.; Magnard, Y. NanoVipa: A miniaturized high-resolution echelle spectrometer, for the monitoring of young stars from a 6U Cubesat. CEAS Space J. 2017, 9, 411–419. [Google Scholar] [CrossRef]
- Fantoni, R.; Almaviva, S.; Caneve, L.; Colao, F.; Maddaluno, G.; Gasior, P.; Kubkowska, M. Hydrogen isotope detection in metal matrix using double-pulse laser-induced breakdown-spectroscopy. Spectrochim. Acta Part B At. Spectrosc. 2017, 129, 8–13. [Google Scholar] [CrossRef]
- Miyabe, M.; Oba, M.; Jung, K.; Iimura, H.; Akaoka, K.; Kato, M.; Otobe, H.; Khumaeni, A.; Wakaida, I. Laser ablation absorption spectroscopy for isotopic analysis of plutonium: Spectroscopic properties and analytical performance. Spectrochim. Acta Part B At. Spectrosc. 2017, 134, 42–51. [Google Scholar] [CrossRef]
- Wang, P.; Chen, J.; Wu, X.; Tian, Y.; Zhang, R.; Sun, J.; Zhang, Z.; Wang, C.; Bai, P.; Guo, L.; et al. Determination of blood species using echelle Raman spectrometer and surface enhanced Raman spectroscopy. Spectrochim. Acta A 2022, 281, 121640. [Google Scholar] [CrossRef]
- Harrison, G.R.; Davis, S.P.; Robertson, H.J. Precision Measurement of Wavelengths with Echelle Spectrographs. J. Opt. Soc. Am. 1953, 43, 853–859. [Google Scholar] [CrossRef]
- Harrison, G.R. The Production of Diffraction Gratings: II. The Design of Echelle Gratings and Spectrographs1. JOSA 1949, 39, 522–527. [Google Scholar] [CrossRef]
- Harrison, G.R. The Production of Diffraction Gratings I. Development of the Ruling Art. JOSA 1949, 39, 413–426. [Google Scholar] [CrossRef]
- Harrison, G.R.; Loewen, E.G.; Wiley, R.S. Echelle gratings: Their testing and improvement. Appl. Opt. 1976, 15, 971–976. [Google Scholar] [CrossRef]
- Harrison, G.R. The diffraction grating—An opinionated appraisal. Appl. Opt. 1973, 12, 2039–2049. [Google Scholar] [CrossRef]
- Harrison, G.R.; Archer, J.E.; Camus, J. A Fixed-Focus Broad-Range Echelle Spectrograph of High Speed and Resolving Power. J. Opt. Soc. Am. 1952, 42, 706–709. [Google Scholar] [CrossRef]
- Zander, A.T.; Keliher, P.N. Examination of the Spectral Efficiency of an Echelle Grating Monochromator. Appl. Spectrosc. 1979, 33, 499–502. [Google Scholar] [CrossRef]
- Ying-Chao, L.; Chun-Sheng, L.; Hong-Xia, W.; Wen-Yu, J.; Liu-Zhen, S.; Yu-Qing, Y.; Guang, Y.; Di, T. Research on Detection Technology of Inductively Coupled Plasma Optical Emission Spectrometer Based on Digital Micromirror Device. Chin. J. Anal. Chem. 2022, 50, 1150–1157. [Google Scholar]
- Chen, S.; Tang, Y.; Bayanheshig, X.; Qi, X.; Zhu, W. A new type of wide spectral coverage echelle spectrometer design for ICP-AES. In Optical Design and Testing V; SPIE: Bellingham, DC, USA, 2012; Volume 8557. [Google Scholar]
- Becker-Ross, H.; Florek, S.; Franken, H.; Radziuk, B.; Zeiher, M. A scanning echelle monochromator for ICP-OES with dynamic wavelength stabilization and CCD detection. J. Anal. Atom. Spectrom. 2000, 15, 851–861. [Google Scholar] [CrossRef]
- Fichet, P.; Tabarant, M.; Salle, B.; Gautier, C. Comparisons between LIBS and ICP/OES. Anal. Bioanal. Chem. 2006, 385, 338–344. [Google Scholar] [CrossRef] [PubMed]
- Sedykh, E.M.; Gromyak, I.N.; Lorents, K.A.; Skripnik, A.Y.; Kolotov, V.P. A Methodological Approach to the Analysis of Rocks and Meteorites by Inductively Coupled Plasma Atomic Emission Spectrometry. J. Anal. Atom. Spectrom. 2019, 74, 393–400. [Google Scholar] [CrossRef]
- Harnly, J.M. The future of atomic absorption spectrometry: A continuum source with a charge coupled array detector. J. Anal. Atom. Spectrom. 1999, 14, 137–146. [Google Scholar] [CrossRef]
- Welz, B.; Becker-Ross, H.; Florek, S.; Heitmann, U.; Vale, M.G.R. High-resolution continuum-source atomic absorption spectrometry: What can we expect? J. Brazil. Chem. Soc. 2003, 14, 220–229. [Google Scholar] [CrossRef]
- Shameem, K.M.M.; Dhanada, V.S.; George, S.D.; Kartha, V.B.; Santhosh, C.; Unnikrishnan, V.K. Assessing the feasibility of a low-throughput gated echelle spectrograph for Laser-induced Breakdown spectroscopy (LIBS)-Raman measurements at standoff distances. Opt. Laser Technol. 2022, 153, 108264. [Google Scholar] [CrossRef]
- Taleb, A.; Shen, C.; Mory, D.; Cieślik, K.; Merk, S.; Aziz, M.R.; Caricato, A.P.; Gerhard, C.; Pelascini, F.; Hermann, J. Echelle spectrometer calibration by means of laser plasma. Spectrochim. Acta. Part B At. Spectrosc. 2021, 178, 106144. [Google Scholar] [CrossRef]
- Rao, A.P.; Jenkins, P.R.; Auxier, J.D.; Shattan, M.B.; Patnaik, A.K. Enabling orders of magnitude sensitivity improvement for quantification of Ga in a Ce matrix with a compact Echelle spectrometer. J. Anal. Atom. Spectrom. 2022, 37, 1975–1980. [Google Scholar] [CrossRef]
- Lizon, J.L.; Klein, B.; Oliva, E.; Löwinger, T.; Escude, G.A.; Baade, D.; Bristow, P.; Dorn, R.J.; Follert, R.; Grunhut, J.; et al. Opto-mechanical design of a new Cross Dispersion Unit for the CRIRES plus high resolution spectrograph for the VLT. In Proceedings of the Ground-Based and Airborne Instrumentation for Astronomy V, Montréal, QC, Canada, 22–26 June 2014; Volume 9147. [Google Scholar]
- Lotem, H. Littrow-mounted diffraction grating cavity. Appl Opt. 1994, 33, 930–934. [Google Scholar] [CrossRef] [PubMed]
- Lu, P.P.; Sun, K.X.; Byer, R.L.; Britten, J.A.; Hoaglan, C.R. Precise diffraction efficiency measurements of large-area greater-than-99%-efficient dielectric gratings at the Littrow angle. Opt. Lett. 2009, 34, 1708. [Google Scholar] [CrossRef] [PubMed]
- Masters, R.; Hsiech, C.; Pardue, H.L. Advantages of an off-Littrow mounting of an echelle grating. Appl. Opt. 1988, 27, 3895–3897. [Google Scholar] [CrossRef] [PubMed]
- Schroeder, D.J. Design considerations for astronomical echelle spectrographs. Publ. Astron. Soc. Pac. 1970, 82, 1253. [Google Scholar] [CrossRef]
- Schroeder, D.J.; Hilliard, R.L. Echelle efficiencies: Theory and experiment. Appl. Opt. 1980, 19, 2833–2841. [Google Scholar] [CrossRef]
- Wang, X.-L.; Chang, L.; Wang, L.; Ji, H.-X.; Xian, H.; Tang, Z.; Xin, Y.-X.; Wang, C.-J.; He, S.-S.; Zhang, J.-J.; et al. The Coude Echelle Spectrograph for the Lijiang 1.8m telescope. Res. Astron. Astrophys. 2020, 20, 032. [Google Scholar] [CrossRef]
- Lizon, J.L.; Klein, B.; Molina-Conde, I.; Oliva, E.; Escude, G.A.; Bristow, P.; Dorn, R.J.; Follert, R.; Hatzes, A.; Heiter, U.; et al. Very accurate cryogenic mechanisms for CRIRES. In Proceedings of the Optical and Infrared Interferometry and Imaging VI, Austin, TX, USA, 11–15 June 2018; Volume 10701. [Google Scholar]
- Kerber, F.; Frey, B.J.; Leviton, D.B.; Bristow, P.; Rosa, M.R. Calibration of the ZnSe pre-disperser on ESO’s cryogenic IR echelle spectrograph (CRIRES): Comparison of the first results from CRIRES and the laboratory data from CHARMS. Proc. SPIE-Int. Soc. Opt. Eng. 2006, 6269, 1317–1328. [Google Scholar]
- Farsad, M. A design cycle for echelle spectrometers. In Proceedings of the International Optical Design Conference, Denver, CO, USA, 9–13 July 2017; Volume 10590. [Google Scholar]
- Ge, J.; Angel, J.; Jacobsen, B.; Woolf, N.; Fugate, R.Q.; Black, J.H.; Lloyd-Hart, M. An optical ultrahigh-resolution cross-dispersed echelle spectrograph with adaptive optics. Publ. Astron. Soc. Pac. 2002, 114, 879–891. [Google Scholar] [CrossRef][Green Version]
- Oliva, E.; Origlia, L.; Maiolino, R.; Gennari, S.; Biliotti, V.; Rossetti, E.; Baffa, C.; Leone, F.; Montegriffo, P.; Lolli, M.; et al. GIANO: An ultra-stable IR echelle spectrometer optimized for high precision radial velocity measurements and for high throughput low resolution spectroscopy. In Ground-Based Instrumentation for Astronomy, PTS 1-3; Springer: Berlin/Heidelberg, Germany, 2004; Volume 5492, pp. 1274–1279. [Google Scholar]
- Tull, R.G.; Macqueen, P.J.; Sneden, C.; Lambert, D.L. The High-Resolution Cross-Dispersed Echelle White-Pupil Spectrometer of the McDonald Observatory 2.7-m Telescope. Publ. Astron. Soc. Pac. 1995, 107, 251–264. [Google Scholar] [CrossRef]
- Sun, C.; Yang, J.; Zhu, J.; Ma, T.; Feng, S.; Song, N.; Guo, X.; Guo, H. Optical design of echelle spectrometer with ultra-wide wavelength range and high resolution. Opt. Precis. Eng. 2021, 29, 45–53. [Google Scholar] [CrossRef]
- Wu, S.; Wang, T.; Huang, C.; Gu, J.; Yu, L.; Xue, H.; Shen, Y. Advanced optical design of Czerny-Turner spectrometer with high flux and low aberration in broadband. Appl. Opt. 2022, 61, 3077. [Google Scholar] [CrossRef] [PubMed]
- Zhou, Q.; Zou, Z. Astigmatism-free Czerny–Turner spectrometer with a low f-number by a bicylinder lens. Appl. Opt. 2022, 61, 7985. [Google Scholar] [CrossRef] [PubMed]
- Shafer, A.B.; Megill, L.R.; Droppleman, L. Optimization of the Czerny-Turner Spectrometer. J. Opt. Soc. Am. 1964, 54, 879–886. [Google Scholar] [CrossRef]
- Zhang, Y.; Yang, H.; Huang, Z.; Jin, G. Optical Path Difference in Off-Plane Quasi-Littrow Dispersion Mountings. Spectrosc. Spect. Anal. 2013, 33, 1992–1996. [Google Scholar]
- Wood, M.P.; Lawler, J.E. Aberration-corrected echelle spectrometer for measuring ultraviolet branching fractions of iron-group ions. Appl. Opt. 2012, 51, 8407–8412. [Google Scholar] [CrossRef] [PubMed]
- Fu, X.; Duan, F.; Jiang, J.; Huang, T.; Ma, L.; Lv, C. Astigmatism-corrected echelle spectrometer using an off-the-shelf cylindrical lens. Appl. Opt. 2017, 56, 7861–7868. [Google Scholar] [CrossRef]
- Yin, L.; Yang, J.; Lu, Y.; Zhang, R.; Sun, C.; Cui, J. High-accuracy spectral reduction algorithm for the echelle spectrometer. Appl. Opt. 2016, 55, 3574–3581. [Google Scholar] [CrossRef]
- Li, Y.; Jiang, W.; Li, C.; Ma, Z.; Yang, Y.; Tian, D. Spectral reduction model for an echelle spectrometer based on a digital micromirror device and photomultiplier. Appl. Opt. 2021, 60, 9101–9109. [Google Scholar] [CrossRef]
- Pfeiffer, M.J.; Frank, C.; Baumüller, D.; Fuhrmann, K.; Gehren, T. FOCES—A fibre optics Cassegrain échelle spectrograph. Astron. Astrophys. Suppl. 1998, 130, 381–393. [Google Scholar] [CrossRef]
- Zhang, Y.; Duan, W.; Li, W. Design of Echelle Spectrometer with a Three-Mirror Anastigmat System. J. Tianjin Univ. 2022, 55, 519–526. [Google Scholar]
- Yang, Z.; Li, Z.; Pu, E.; Yan, L.; Wang, C.; Chen, L.; Li, P.; Yang, W.; Zhang, Y. High-Resolution Echelle Grating Spectrometer Based on Off-Axis Three-Mirror Reflective Optical System. Acta Opt. Sin. 2021, 41, 2212001. [Google Scholar]
- Zander, A.T.; Miller, M.H.; Hendrick, M.S.; Eastwood, D. Spectral Efficiency of the SpectraSpan III Echelle Grating Spectrometer. Appl. Spectrosc. 1985, 39, 1–5. [Google Scholar] [CrossRef]
- Cothran, C.D.; Fung, J.; Brown, M.R.; Schaffer, M.J. Fast high resolution echelle spectroscopy of a laboratory plasma. Rev. Sci. Instrum. 2006, 77, 063504. [Google Scholar] [CrossRef]
- Zhang, R.; Ren, W.; Xu, Z.; Wang, H.; Jiang, J.; Wang, Y.; Luo, X. Single-pixel echelle spectrometer based on compressive sensing. Optik 2021, 240, 166813. [Google Scholar] [CrossRef]
- Karanassios, V.; Horlick, G. Spectral Characteristics of a New Spectrometer Design for Atomic Emission Spectroscopy. Appl. Spectrosc. 1986, 40, 813–820. [Google Scholar] [CrossRef]
- Baldwin, D.P.; Zamzow, D.S.; Eckels, D.E.; Miller, G.P. AOTF-echelle spectrometer for air-ICP-AES continuous emission monitoring of heavy metals and actinides. Environ. Monit. Remediat. Technol. 1999, 3534, 478–487. [Google Scholar]
- Shannone, C. A Mathematical Theory of Communication; Wiley-IEEE Press: Hoboken, NJ, USA, 1948. [Google Scholar]
- Li, Y.; Duan, F.; Fu, X.; Huang, T. Optical Design of Small High Resolution Echelle Spectrograph. Chin. J. Sens. Actuators 2017, 30, 1139–1144. [Google Scholar]
- Becker-Ross, H.; Florek, S.V. Echelle spectrometers and charge-coupled devices. Spectrochim. Acta Part B At. Spectrosc. 1997, 52, 1367–1375. [Google Scholar] [CrossRef]
- Finkelstein, N.A. The Measurement of Wavelength in Echelle Spectra. J. Opt. Soc. Am. 1953, 43, 90. [Google Scholar] [CrossRef]
- Mcneill, J.J. Wavelength Measurement in Echelle Spectra. J. Opt. Soc. Am. 1959, 49, 441. [Google Scholar] [CrossRef]
- Dantzler, A.A. Echelle spectrograph software design aid. Appl. Opt. 1985, 24, 4504. [Google Scholar] [CrossRef] [PubMed]
- Zhang, R.; Yin, L.; Li, X.; Cui, J.; Yang, J.; Sun, C. Wavelength calibration model for prism-type echelle spectrometer by reversely solving prism’s refractive index in real time. Appl. Opt. 2016, 55, 4153–4158. [Google Scholar] [CrossRef]
- Brandt, G.M.; Brandt, T.D.; Mccully, C. Automatic Échelle Spectrograph Wavelength Calibration. Astron. J. 2020, 160, 25. [Google Scholar] [CrossRef]
- Sadler, D.A.; Littlejohn, D.; Perkins, C.V. Automatic wavelength calibration procedure for use with an optical spectrometer and array detector. J. Anal. Atom. Spectrom. 1995, 10, 253–257. [Google Scholar] [CrossRef]
- Zhang, R.; Li, X.; Cui, J. Establishment and correction of an Echelle cross-prism spectrogram reduction model. Opt. Commun. 2017; 403, 401–407. [Google Scholar]
- Duan, F.; Qin, Y.; Fu, X.; Ma, L.; Huang, T.; Zhang, C. Simple spectral reduction algorithm used for the echelle spectrometer. Appl. Opt. 2018, 57, 8921–8927. [Google Scholar] [CrossRef] [PubMed]
- Luan, S.; Schleicher, R.G.; Pilon, M.J.; Bulman, F.D.; Coleman, G.N. An echelle polychromator for inductively coupled plasma optical emission spectroscopy with vacuum ultraviolet wavelength coverage and charge injection device detection. Spectrochim. Acta Part B At. Spectrosc. 2001, 56, 1143–1157. [Google Scholar] [CrossRef]
- Barnard, T.W.; Crockett, M.I.; Ivaldi, J.C.; Lundberg, P.L. Design and evaluation of an echelle grating optical system for ICP-OES. Anal. Chem. 1993, 65, 1225–1230. [Google Scholar] [CrossRef]
- Koch, J.; Okruss, M.; Franzke, J.; Florek, S.V.; Niemax, K.; Becker-Ross, H. Element-selective detection of gas chromatographic eluates by near infrared Échelle optical emission spectrometry on microwave-induced plasmas. Spectrochim. Acta Part B At. Spectrosc. 2004, 59, 199–207. [Google Scholar] [CrossRef]
- Zander, A.T.; Chien, R.L.; Cooper, C.B.; Wilson, P.V. An image-mapped detector for simultaneous ICP-AES. Anal. Chem. 1999, 71, 3332–3340. [Google Scholar] [CrossRef]
- Pilon, M.J.; Denton, M.B.; Schleicher, R.G.; Moran, P.M.; Smith, S.B. Evaluation of a New Array Detector Atomic Emission Spectrometer for Inductively Coupled Plasma Atomic Emission Spectroscopy. Appl. Spectrosc. 1990, 44, 1613–1620. [Google Scholar] [CrossRef]
- Rolland-Thompson, J.; Bauer, A.; Yates, D.; Farsad, M. Echelle Spectrometer for Inductively Coupled Plasma Optical Emission Spectroscopy (ICP-OES), Has Imaging System Comprises Primary, Secondary, and Tertiary Tilted Mirrors. U.S. Patent US546397P, 16 August 2019. [Google Scholar]
- Salin, E.D.; Ingle, J.D. Performance of a time multiplex multiple slit multielement flame atomic absorption spectrometer. Anal. Chem. 1978, 50, 1745–1752. [Google Scholar] [CrossRef]
- Sneddon, J.; Farah, B.D.; Farah, K.S. Multielement Atomic Absorption Spectrometry: A Historical Perspective. Microchem. J. 1993, 48, 318–325. [Google Scholar] [CrossRef]
- Hamly, J.M. Multielement Atomic Absorption with a Continuum Source. Anal. Chem. 1986, 58, 933A–943A. [Google Scholar] [CrossRef]
- Radziuk, B.; Rdel, G.; Stenz, H.; Becker-Ross, H.; Florek, S. Spectrometer system for simultaneous multi-element electrothermal atomic absorption spectrometry using line sources and Zeeman-effect background correction. J. Anal. Atom. Spectrom. 1995, 10, 127–136. [Google Scholar] [CrossRef]
- Becker-Ross, H.; Okruss, M.; Florek, S.; Heitmann, U.; Huang, M.D. Echelle-spectrograph as a tool for studies of structured background in flame atomic absorption spectrometry. Spectrochim. Acta. Part B At. Spectrosc. 2002, 57, 1493–1504. [Google Scholar] [CrossRef]
- Bauer, H.E.; Leis, F.; Niemax, K. Laser induced breakdown spectrometry with an echelle spectrometer and intensified charge coupled device detection. Spectrochim. Acta. Part B At. Spectrosc. 1998, 53, 1815–1825. [Google Scholar] [CrossRef]
- Fichet, P.; Menut, D.; Brennetot, R.; Vors, E.; Rivoallan, A. Analysis by laser-induced breakdown spectroscopy of complex solids, liquids, and powders with an echelle spectrometer. Appl. Opt. 2003, 42, 6029–6035. [Google Scholar] [CrossRef]
- Hoehse, M.; Mory, D.; Florek, S.; Weritz, F.; Gornushkin, I.; Panne, U. A combined laser-induced breakdown and Raman spectroscopy Echelle system for elemental and molecular microanalysis. Spectrochim. Acta Part B At. Spectrosc. 2009, 64, 1219–1227. [Google Scholar] [CrossRef]
- Chen, S.; Qi, X.; Guo, T.Y.; Xia, Ù.C.H. A Portable Echelle Spectrograph Design for Laser-induced Breakdown Spectrometry. Chin. J. Lumin. 2013; 34, 672–677. [Google Scholar]
- Fabre, C.; Dubessy, J.; Boiron, M.; Brennetot, R.; Fichet, P.; Vors, E.; Lacour, J.; Rivoallan, A. A LIBS spectral database obtained in Martian conditions with an echelle spectrometer for in situ analysis of Mars soils and rocks. In Laser Induced Plasma Spectroscopy and Applications; Optical Society of America: Washington, DC, USA, 2002; p. E3. [Google Scholar]
- Shameem, K.M.; Dhanada, V.S.; Harikrishnan, S.; George, S.D.; Kartha, V.B.; Santhosh, C.; Unnikrishnan, V.K. Echelle LIBS-Raman system: A versatile tool for mineralogical and archaeological applications. Talanta 2020, 208, 120482. [Google Scholar] [CrossRef]
- Massey, P.; Hanson, M.M. Astronomical Spectroscopy. In Planets, Stars and Stellar Systems: Volume 2: Astronomical Techniques, Software, and Data; Oswalt, T.D., Bond, H.E., Eds.; Springer: Dordrecht, The Netherlands, 2013; pp. 35–98. [Google Scholar]
- Tousey, R.; Purcell, J.D.; Garrett, D.L. An echelle spectrograph for middle ultraviolet solar spectroscopy from rockets. Appl. Opt. 1967, 6, 365–372. [Google Scholar] [CrossRef]
- Schroeder, D.J. An Echelle Spectrometer-Spectrograph for Astronomical Use. Appl. Opt. 1967, 6, 1976–1980. [Google Scholar] [CrossRef] [PubMed]
- Tousey, R. Highlights of twenty years of optical space research. Appl. Opt. 1967, 6, 2044–2069. [Google Scholar] [CrossRef] [PubMed]
- Epps, H.W.; Vogt, S.S. Extremely achromatic f/1.0 all-spherical camera constructed for the high-resolution echelle spectrometer of the Keck telescope. Appl. Opt. 1993, 32, 6270–6279. [Google Scholar] [CrossRef] [PubMed]
- Vogt, S.S.; Allen, S.L.; Bigelow, B.C.; Bresee, L.; Brown, W.E.; Cantrall, T.; Conrad, A.; Couture, M.; Delaney, C.; Epps, H.W.; et al. HIRES: The high-resolution echelle spectrometer on the Keck 10-m Telescope. In Instrumentation in Astronomy VIII; SPIE: Bellingham, DC, USA, 1994. [Google Scholar]
- Ge, J.; Zhao, B.; Powell, S.; Wang, J.; Fletcher, A.; Chang, L.; Groot, J.; Wan, X.; Jakeman, H.; Myers, D.; et al. Design and Performance of a New Generation, Compact, Low Cost, Very High Doppler Precision and Resolution Optical Spectrograph. In Proceedings of the Ground-Based and Airborne Instrumentation for Astronomy IV, Edinburgh, UK, 26–30 June 2016; Volume 8446. [Google Scholar]
- Aceituno, J.; Sánchez, S.F.; Grupp, F.; Lillo, J.; Hernán-Obispo, M.; Benitez, D.; Montoya, L.M.; Thiele, U.; Pedraz, S.; Barrado, D.; et al. CAFE: Calar Alto Fiber-fed Echelle spectrograph. Astron. Astrophys. 2013, 552, A31. [Google Scholar] [CrossRef]
- Bernstein, R.A.; Shectman, S.A.; Gunnels, S.; Mochnacki, S.; Athey, A. MIKE: A double echelle spectrograph for the Magellan Telescopes at Las Campanas Observatory. In Instrument Design & Performance for Optical/Infrared Ground-Based Telescopes, PTS 1-3; SPIE: Bellingham, DC, USA, 2003; Volume 4841, pp. 1694–1704. [Google Scholar]
- Eastman, J.D.; Brown, T.M.; Hygelund, J.; van Eyken, J.; Tufts, J.R.; Barnes, S. NRES: The Network of Robotic Echelle Spectrographs. In Proceedings of the Ground-Based and Airborne Instrumentation for Astronomy V, Montréal, QC, Canada, 22–26 June 2014; Volume 9147. [Google Scholar]
- Siverd, R.J.; Brown, T.M.; Hygelund, J.; Henderson, T.; Tufts, J.R.; Eastman, J.D.; van Eyken, J.; Barnes, S. NRES: The Network of Robotic Echelle Spectrographs. In Proceedings of the Ground-Based and Airborne Instrumentation for Astronomy IV, Edinburgh, UK, 26–30 June 2016; Volume 9908. [Google Scholar]
- Siverd, R.J.; Brown, T.M.; Barnes, S.; Bowman, M.K.; De Vera, J.; Foale, S.; Harbeck, D.R.; Henderson, T.; Hygelund, J.; Kirby, A.; et al. NRES: The Network of Robotic Echelle Spectrographs. In Proceedings of the Ground-based and Airborne Instrumentation for Astronomy VII, Austin, TX, USA, 10–14 June 2018; Volume 10702. [Google Scholar]
- Thibault, S.; Rabou, P.; Donati, J.F.; Desaulniers, P.; Dallaire, X.; Artigau, E.; Pepe, F.; Micheau, Y.; Vallée, P.; Barrick, G.; et al. SPIRou@ CFHT: Spectrograph Optical Design. In Proceedings of the Ground-Based and Airborne Instrumentation for Astronomy IV, Edinburgh, UK, 26–30 June 2016; Volume 8446. [Google Scholar]
- Donati, J.F.; Kouach, D.; Lacombe, M.; Baratchart, S.; Doyon, R.; Delfosse, X.; Artigau, É.; Moutou, C.; Hébrard, G.; Bouchy, F.; et al. SPIRou: A nIR spectropolarimeter/high-precision velocimeter for the CFHT. In Handbook of Exoplanets; Deeg, H.J., Belmonte, J.A., Eds.; Springer: Cham, Swizerland, 2018; ISBN 978-3-319-30648-3. [Google Scholar]
- Artigau, É.; Kouach, D.; Donati, J.-F.; Doyon, R.; Delfosse, X.; Baratchart, S.; Lacombe, M.; Moutou, C.; Rabou, P.; Parès, L.P.; et al. SPIRou: The near-infrared spectropolarimeter/high-precision velocimeter for the Canada-France-Hawaii telescope. In Proceedings of the Ground-Based and Airborne Instrumentation for Astronomy V, Montréal, QC, Canada, 22–26 June 2014; Volume 9147. [Google Scholar]
- Oliva, E.; Tozzi, A.; Ferruzzi, D.; Origlia, L.; Hatzes, A.; Follert, R.; Lowinger, T.; Piskunov, N.; Heiter, U.; Lockhart, M.; et al. Concept and optical design of the cross-disperser module for CRIRES. In Proceedings of the Ground-Based and Airborne Instrumentation for Astronomy V, Montréal, QC, Canada, 22–26 June 2014; Volume 9147. [Google Scholar]
- Brucalassi, A.; Dorn, R.J.; Follert, R.; Hatzes, A.; Bristow, P.; Seemann, U.; Cumani, C.; Eschbaumer, S.; Haimerl, A.; Haug, M.; et al. Full System Test and early Preliminary Acceptance Europe results for CRIRES. In Proceedings of the Ground-based and Airborne Instrumentation for Astronomy VII, Austin, TX, USA, 10–14 June 2018; Volume 10702. [Google Scholar]
- Follert, R.; Taubert, D.; Hollandt, J.; Monte, C.; Oliva, E.; Seemann, U.; Löwinger, T.; Anwand-Heerwart, H.; Schmidt, C.; Dorn, R.J.; et al. Characterizing the cross dispersion reflection gratings of CRIRES. In Proceedings of the Advances in Optical and Mechanical Technologies for Telescopes and Instrumentation II, Edinburgh, UK, 26 June–1 July 2016; Volume 9912. [Google Scholar]
- Dorn, R.J.; Follert, R.; Bristow, P.; Cumani, C.; Eschbaumer, S.; Grunhut, J.; Haimerl, A.; Hatzes, A.; Heiter, U.; Hinterschuster, R.; et al. The “ plus “ for CRIRES: Enabling better science at infrared wavelength and high spectral resolution at the ESO VLT. In Proceedings of the Ground-based and Airborne Instrumentation for Astronomy VI, Edinburgh, UK, 26–30 June 2016; Volume 9908. [Google Scholar]
- Baranne, A. Equipement spectrographique du foyer coudé du télescope de 3.60 mètres. Etude de faisabilité d’un spectrographe universel. In Proceedings of the ESO/CERN Conference on Auxiliary Instrumentation for Large Telescopes, Geneva, Switzerland, 2–5 May 1972; pp. 227–239. [Google Scholar]
- Schwab, C.; Rakich, A.; Gong, Q.; Mahadevan, S.; Halverson, S.P.; Roy, A.; Terrien, R.C.; Robertson, P.M.; Hearty, F.R.; Levi, E.I.; et al. Design of NEID, an extreme precision Doppler spectrograph for WIYN. In Proceedings of the Ground-based and Airborne Instrumentation for Astronomy VI, Edinburgh, UK, 26–30 June 2016; Volume 9908. [Google Scholar]
- Mueller, M.; Baldwin, D.; Bean, J.; Bergner, H.; Bigelow, B.; Chun, M.Y.; Crane, J.; Foster, J.; Fűrész, G.; Gauron, T.; et al. The Opto-Mechanical Design of the GMT-Consortium Large Earth Finder (G-CLEF). In Proceedings of the Ground-based and Airborne Instrumentation for Astronomy VII, Austin, TX, USA, 10–14 June 2018; Volume 10702. [Google Scholar]
- Szentgyorgyi, A.; Baldwin, D.; Barnes, S.; Bean, J.; Ben-Ami, S.; Brennan, P.; Budynkiewicz, J.; Chun, M.Y.; Conroy, C.; Crane, J.D.; et al. The GMT-Consortium Large Earth Finder (G-CLEF): An optical echelle spectrograph for the Giant Magellan Telescope (GMT). In Proceedings of the Ground-based and Airborne Instrumentation for Astronomy VII, Austin, TX, USA, 10–14 June 2018; Volume 10702. [Google Scholar]
- Ben-Ami, S.; Crane, J.D.; Evans, I.; Mcmuldroch, S.; Mueller, M.; Podgorski, W.; Szentgyorgyi, A. The optical design of the G-CLEF Spectrograph: The first light instrument for the GMT. In Proceedings of the Ground-based and Airborne Instrumentation for Astronomy VII, Austin, TX, USA, 10–14 June 2018; Volume 10702. [Google Scholar]
- Pepe, F.A.; Cristiani, S.; Rebolo Lopez, R.; Santos, N.C.; Amorim, A. ESPRESSO: The Echelle spectrograph for rocky exoplanets and stable spectroscopic observations. In Proceedings of the Ground-Based and Airborne Instrumentation for Astronomy III, San Diego, CA, USA, 27 June–2 July 2010; Volume 7735. [Google Scholar]
- Spanò, P.; Mégevand, D.; Herreros, J.M.; Zerbi, F.M.; Cabral, A.; Di Marcantonio, P.; Lovis, C.; Cristiani, S.; Rebolo, R.; Santos, N.; et al. Optical design of the ESPRESSO spectrograph at VLT. In Proceedings of the Ground-Based and Airborne Instrumentation for Astronomy III, San Diego, CA, USA, 27 June–2 July 2010; Volume 7735. [Google Scholar]
- Pepe, F.; Molaro, P.; Cristiani, S.; Rebolo, R.; Santos, N.; Dekker, H.; Mégevand, D.; Zerbi, F.; Cabral, A.; Di Marcantonio, P.; et al. ESPRESSO: The next European exoplanet hunter. Astron. Nachr. 2014, 335, 8–20. [Google Scholar] [CrossRef]
- Lizon, J.L.; Dekker, H.; Manescau, A.; Megevan, D.; Pepe, F.A.; Riva, M. A large mosaic echelle grating for ESPRESSO spectrograph. In Proceedings of the Optical and Infrared Interferometry and Imaging VI, Austin, TX, USA, 11–15 June 2018; Volume 10701. [Google Scholar]
- Pallavicini, R.; Zerbi, F.M.; Spano, P.; Conconi, P.; Mazzoleni, R.; Molinari, E.; Strassmeier, K.G. The ICE spectrograph for PEPSI at the LBT: Preliminary optical design. In Instrument Design & Performance for Optical/infrared Ground-based Telescopes, PTS 1-3; SPIE: Bellingham, DC, USA, 2003; Volume 4841, pp. 1345–1356. [Google Scholar]
- Strassmeier, K.G.; Woche, M.; Ilyin, I.; Popow, E.; Bauer, S.-M.; Dionies, F.; Fechner, T.; Weber, M.; Hofmann, A.; Storm, J.; et al. PEPSI: The Potsdam Echelle Polarimetric and Spectroscopic Instrument for the LBT. In Ground-based and Airborne Instrumentation for Astronomy II, PTS 1-4; SPIE: Bellingham, DC, USA, 2008; Volume 7014. [Google Scholar]
- Strassmeier, K.; Ilyin, I.; Järvinen, A.; Weber, M.; Woche, M.; Barnes, S.I.; Bauer, S.-M.; Beckert, E.; Bittner, W.; Bredthauer, R.; et al. PEPSI: The high-resolution échelle spectrograph and polarimeter for the Large Binocular Telescope. Astron. Nachr. 2015, 336, 324–361. [Google Scholar] [CrossRef]
- Strassmeier, K.G.; Ilyin, I.; Weber, M.; Järvinen, A.; Woche, M.; Järvinen, S.; Sablowski, D.; Mallonn, M.; Keles, E.; Carroll, T.; et al. Want a PEPSI? Performance status of the recently commissioned high-resolution spectrograph and polarimeter for the 2 × 8.4 m Large Binocular Telescope. In Proceedings of the Ground-based and Airborne Instrumentation for Astronomy VII, Austin, TX, USA, 10–14 June 2018; Volume 10702. [Google Scholar]
- Crause, L.A.; Sharples, R.M.; Bramall, D.G.; Schmoll, J.; Clark, P.; Younger, E.J.; Tyas, L.M.; Ryan, S.G.; Brink, J.D.; Strydom, O.J.; et al. Performance of the Southern African Large Telescope (SALT) High Resolution Spectrograph (HRS). In Proceedings of the Ground-Based and Airborne Instrumentation for Astronomy V, Montréal, QC, Canada, 22–26 June 2014; Volume 9147. [Google Scholar]
- Pinto, M.T.; Chanumolu, A.; Quirrenbach, A.; Reffert, S.; Zechmeister, M.; Bauer, F. Physical modeling of echelle spectrographs: The CARMENES case study. In Proceedings of the Modeling, Systems Engineering, and Project Management for Astronomy VIII, Austin, TX, USA, 10–12 June 2018; Volume 10705. [Google Scholar]
- Quirrenbach, A.; Amado, P.J.; Ribas, I.; Reiners, A.; Caballero, J.A.; Seifert, W.; Aceituno, J.; Azzaro, M.; Baroch, D.; Barrado, D.; et al. CARMENES: High-resolution spectra and precise radial velocities in the red and infrared. In Proceedings of the Ground-based and Airborne Instrumentation for Astronomy VII, Austin, TX, USA, 10–14 June 2018; Volume 10702. [Google Scholar]
- Seifert, W.; Xu, W.; Stahl, O.; Hagen, H.J.; Carrasco, M.S.; Veredas, G.; Caballero, J.A.; Guardia, J.; Helmling, J.; Hernandez, L.; et al. CARMENES: The VIS channel spectrograph in operation. In Proceedings of the Ground-based and Airborne Instrumentation for Astronomy VI, Edinburgh, UK, 26–30 June 2016; Volume 9908. [Google Scholar]
- Kotani, T.; Tamura, M.; Nishikawa, J.; Ueda, A.; Kuzuhara, M.; Omiya, M.; Hashimoto, J.; Ishizuka, M.; Hirano, T.; Suto, H.; et al. The infrared Doppler (IRD) instrument for the Subaru telescope: Instrument description and commissioning results. In Proceedings of the Ground-based and Airborne Instrumentation for Astronomy VII, Austin, TX, USA, 10–14 June 2018; Volume 10702. [Google Scholar]
- Tokovinin, A.; Fischer, D.A.; Bonati, M.; Giguere, M.J.; Moore, P.; Schwab, C.; Spronck, J.F.P.; Szymkowiak, A. CHIRON-A Fiber Fed Spectrometer for Precise Radial Velocities. Publ. Astron. Soc. Pac. 2013, 125, 1336–1347. [Google Scholar] [CrossRef]
- Crane, J.D.; Shectman, S.A.; Butler, R.P.; Thompson, I.B.; Birk, C.; Jones, P.; Burley, G.S. The Carnegie Planet Finder Spectrograph: Integration and commissioning. In Proceedings of the Ground-Based and Airborne Instrumentation for Astronomy III, San Diego, CA, USA, 27 June–2 July 2010; Volume 7735. [Google Scholar]
- Wiedemann, G.; Jennings, D.E. Immersion grating for infrared astronomy. Appl. Opt. 1993, 32, 1176. [Google Scholar] [CrossRef]
- Sarugaku, Y.; Otsubo, S.; Ikeda, Y.; Kobayashi, N.; Kimura, N.; Kato, K.; Kondo, S.; Kawakita, H. Conceptual design of a compact space-borne IR high-resolution cross-dispersed spectrograph realized by germanium immersion grating and all-cordierite reflective optical system. In Proceedings of the Space Telescopes and Instrumentation 2020: Optical, Infrared, and Millimeter Wave, Online, 14–18 December 2020; Volume 11443. [Google Scholar]
- Wu, Z.; Liu, Q.; Lu, J.; Zhou, N.; Huang, B. Study on the immersion grating with dielectric film. In Proceedings of the Holography, Diffractive Optics, and Applications XI, Nantong, China, 10–19 October 2021; Volume 11898. [Google Scholar]
- Ge, J.; Powell, S.; Zhao, B.; Wang, J.; Fletcher, A.; Schofield, S.; Liu, J.; Muterspaugh, M.; Blake, C.; Barnes, R. High Resolution Florida IR Silicon Immersion Grating Spectrometer and an M Dwarf Planet Survey. In Proceedings of the Ground-Based and Airborne Instrumentation for Astronomy IV, Amsterdam, The Netherlands, 1–6 July 2012; Volume 8446. [Google Scholar]
- Ge, J.; Powell, S.; Zhao, B.; Schofield, S.; Varosi, F.; Warner, C.; Liu, J.; Sithajan, S.; Avner, L.; Jakeman, H. On-sky Performance of a High Resolution Silicon Immersion Grating Spectrometer. In Proceedings of the Ground-Based and Airborne Instrumentation for Astronomy V, Montréal, QC, Canada, 22–26 June 2014; Volume 9147. [Google Scholar]


| Observatory | Spectrometer Model | Spectral Range (nm) | Resolution |
|---|---|---|---|
| Cala Alto Observatory | CAFE | 365–980 | 70,000 |
| CARMENES | 520–1710 | 93,400, 82,000 | |
| Cerro Tololo Inter-American Observatory | CHIRON [119] | 410–880 | 80,000 |
| European Southern Observatory | CRIRES+ | 950–5300 | 50,000, 100,000 |
| ESPRESSO | 380–780 | 59,000, 134,000, ≈200,000 | |
| Kitt Peak National Observatory | EXPERT-III | 380–900 | 56,000, 110,000 |
| NEID | 380–930 | 100,000 | |
| Las Campanas Observatory | G-CLEF | 350–950 | 19,000, 108,000 |
| MIKE | 320–1000 | 19,000, 25,000 | |
| NRES | 390–860 | 53,000 | |
| PFS [120] | 388–668 | 38,000 | |
| Mauna Kea Observatory | IRD | 970–1750 | 70,000 |
| SPIRou | 980–2440 | 70,000 | |
| Mt. Graham International Observatory | PEPSI | 384–913 | 50,000, 130,000, 250,000 |
| South African Astronomical Observatory | SALT-HRS | 370–890 | 15,000, 40,000, 65,000 |
| Lijiang Observatory in China | CES [30] | 570–1030 | 37,000 |
Publisher’s Note: MDPI stays neutral with regard to jurisdictional claims in published maps and institutional affiliations. |
© 2022 by the authors. Licensee MDPI, Basel, Switzerland. This article is an open access article distributed under the terms and conditions of the Creative Commons Attribution (CC BY) license (https://creativecommons.org/licenses/by/4.0/).
Share and Cite
Zhang, Y.; Li, W.; Duan, W.; Huang, Z.; Yang, H. Echelle Grating Spectroscopic Technology for High-Resolution and Broadband Spectral Measurement. Appl. Sci. 2022, 12, 11042. https://doi.org/10.3390/app122111042
Zhang Y, Li W, Duan W, Huang Z, Yang H. Echelle Grating Spectroscopic Technology for High-Resolution and Broadband Spectral Measurement. Applied Sciences. 2022; 12(21):11042. https://doi.org/10.3390/app122111042
Chicago/Turabian StyleZhang, Yinxin, Wanzhuo Li, Wenhao Duan, Zhanhua Huang, and Huaidong Yang. 2022. "Echelle Grating Spectroscopic Technology for High-Resolution and Broadband Spectral Measurement" Applied Sciences 12, no. 21: 11042. https://doi.org/10.3390/app122111042
APA StyleZhang, Y., Li, W., Duan, W., Huang, Z., & Yang, H. (2022). Echelle Grating Spectroscopic Technology for High-Resolution and Broadband Spectral Measurement. Applied Sciences, 12(21), 11042. https://doi.org/10.3390/app122111042