1. Introduction
Sticking daily routines is a great tool to support the care of older adults or persons living with dementia in their home being useful for caregivers and the patient itself. The daily routine is a sequence of recurrent activities performed by a person every day [
1]. Routine means organization and discipline and can bring several benefits to in-person care, such as the improvement of mental health by reducing anxiety and stress levels and physical health and productivity [
2,
3]. In the case of dementia, it helps prevent faster cognitive decline allowing the detection of subtle changes or deviations in time [
4]. Having a rather chaotic lifestyle can negatively impact health in the long term [
5]. For example, sleep deprivation can lead to the probability of developing cardiovascular or nervous system diseases and diabetes in time, while irregular meals or late meals can affect emotional or mental state, increase the likelihood of developing digestive system diseases and decrease the defense capacity of the immune system.
In this context, it is useful to provide solutions to allow the detection of recurrent patterns of activities and to objectively infer the daily routine of a person out of Internet of Things (IoT)-monitored data. The large-scale adoption of wearable IoT devices eases the data collection, but inferring personalized daily routines is not an easy task as it is affected by many variables (e.g., time frame, weekday or weekend, chronic condition, etc.) and differentiation factors [
6]. Nevertheless, monitoring the person’s daily routine using IoT wearable devices is a promising research field [
7], insufficiently explored, with applicability in personalizing health and care services. Discovering the person’s daily life routine from sensors’ data and deviations from it can help in assessing the health status of the person enabling the healthcare personnel to proactively intervene to avoid the person’s institutionalization [
8]. For example, sleeping more than usual can be a symptom of depression, while frequent going to the toilet can be associated with a urinary tract infection.
Most of nowadays research is focused on identifying the activities of daily living (ADL) to observe abnormal data [
9,
10,
11,
12]. Only a few research is looking at the activity length and sequence of such activities to detect the person’s recurrent behavior patterns that are part of their daily routine and relevant deviations from it. The use of IoT sensors can generate large volumes of data that require efficient algorithms capable of processing this data and associated search space to identify recurrent behavioral patterns [
13]. The collected data could be incomplete and inaccurate, and in this case, algorithms capable of handling data quality issues are required [
13]. Metaheuristics algorithms could be a viable solution for solving such types of problems since they provide a near-optimal solution for problems with incomplete and inaccurate data or when the computing power is limited, and the execution time must be low [
14]. They can provide approximate solutions with lower computational overhead than state-of-the-art solutions such as neural networks or exhaustive search algorithms and better solutions than deterministic and rule-based algorithms [
15].
In this paper, we propose the use of a genetic metaheuristic for the detection of recurrent activity sequences that form a person’s daily routine. An individual is encoded as a sequence of activities performed by a person in a day while its quality is evaluated using a fitness function that considers four types of probabilities, previously introduced by us in [
16]: the probability of transition among activities, the probability that an activity is the first or last in a recurrent pattern of activities, and the pattern length probability. A method based on the average daily activity time variability is defined to enrich the inferred activity patterns with time-related information. For the selection process of the parent chromosomes, we have used a tournament-based strategy, and the population evolution is ensured by applying crossover and mutation operators. To avoid premature convergence a roulette wheel selection strategy is used for the dynamic selection of the operators to be used in generating the next generation of offspring.
The genetic heuristic has good results for constraint-based optimization problems that can be translated into digging for the best solutions in the search space, as in the case of the routine detection problem. The length of the daily activities has a certain degree of flexibility and is bounded by upper and lower values, while the transition among activities can happen with different probabilities. Moreover, this type of constraint is rather personalized as they depend on the wishes and needs of each person. Consequently, the space and datasets for searching the routine are large and hard to explore. The genetic heuristic is more suitable compared to the deterministic algorithms as it uses the history encoded in the chromosomes of the previous population to guide the search. Therefore, our genetic-based solution can identify more than one routine for a person, while most state-of-the-art deterministic approaches [
16,
17,
18] can identify only one rigid routine. This solution is more realistic since a person can have several variations of recurrent daily activity patterns that differ slightly depending on contextual factors. For the duration of activities, we use an interval determined by the dispersion of the duration values of that activity around the average value, which is a more flexible approach than deterministic ones [
16], which use only one value namely the average time. Finally, the tournament-based strategy combined with roulette wheel selection for generating new populations of chromosomes guides the search process with a good balance between exploitation and exploration of the search space for routine detection. As reported in other literature works [
19], the balance is important to identify regions in the areas that are closer to daily routines with good quality and to dismiss the parts already explored or with poor quality solutions.
The novel contributions of this paper are the following:
A heuristic approach based on a genetic algorithm for identifying the recurrent activity patterns of a person and constructing the daily routine. The chromosomes are encoded using the person’s ADL and a probability-based fitness function is used to evaluate the quality of the population. Thus, it allows the extraction of several patterns of activities that differ slightly from each other capturing the day-to-day contextual variations that occur in a person’s daily routine.
A tournament-based strategy for dynamic selection of operators applied for generating the offspring, while the time variability of activities of daily living is addressed using the dispersion of the duration values of that activity around the average value.
Study the impact of the population size and number of generations on the fitness function evolution and convergence by using multiple linear regression analysis.
The paper is structured as follows:
Section 2 reviews the state of the art and presents the progress beyond,
Section 3 presents the genetic solution for detecting recurrent activity patterns forming the person’s daily routine using genetic algorithms,
Section 4 presents the experimental results,
Section 5 discusses the impact of the adjustable parameters on the performance of the genetic algorithm, and
Section 6 presents conclusions and possible further developments.
2. Related Work
Most state-of-the-art approaches to detecting frequent activity patterns of persons and daily routines can be classified as machine learning-based supervised and unsupervised approaches [
7,
18,
20] and statistical or model-based approaches [
17,
21,
22].
Many authors are addressing the detection of frequent daily activity patterns and routines of a person using unsupervised or supervised machine learning-based solutions. Mohan et al. [
13] propose an unsupervised approach consisting of two steps for extracting the daily routine. In the first step, the activity data corresponding to each day are segmented into groups of locations with homogeneous distribution using the superpixels extracted via energy-driven sampling, while the second step groups the activity segments using the hierarchical graph-based region growth algorithm. In the clustering process, each activity segment is represented by the activity start and end time, the activity duration, the activity location distribution, and the location of previous activities. Even though the approach can capture the gradual change of the routine, there are some disadvantages such as the high number of parameters that need to be fine-tuned and the fact that it relies only on the person’s movement data. Combined with IoT devices ML techniques are proven to be very useful for classification problems in the healthcare domain [
23]. Adaptive neuro-fuzzy inference system provides good results on coagulation and flocculation problems classification. Seiter et al. [
24] propose the use of topic models to extract daily routines in the case of patients who are in the hemiparetic rehabilitation period. The time and frequency domain-related features are extracted from sensors’ data and preprocessed in activity words that are used as a vocabulary for the topic model. The activity vocabulary is built using either the K-mean algorithm to cluster the feature vectors or using rules to extract characteristics of activity routine. The main disadvantage of the approach is that, in the case of some patients, the accuracy of the results obtained is quite low (about 56% in the case of the clustered approach and 66% in the case of the rule-based approach). The hierarchical density-based spatial clustering of applications with noise (HDBSCAN) algorithm is used in [
25] to cluster sleep events and extract sleep patterns. The sleep event is represented as a vector of features that stores information about the sleep start and end time, the sleep duration, the number of sleep interruptions, and the interruption category (i.e., toss and turns, awakenings, breaks). The HDBSCAN algorithm groups sleep events into nocturnal and daytime sleep patterns, from which the corresponding sleep routines will then be extracted. Even if the approach is promising, there is no relevant qualitative evaluation of the obtained results provided. Similarly, the DBSCAN algorithm is used to group instances of each activity type based on duration and start time in [
26]. The clustering results are used to extract the average start time and the duration of each activity. The daily routine is defined as a sequence of activities ordered according to the activities’ start time.
Quaid et al. [
27] propose a reweighted genetic algorithm-based feature selection and classification algorithm that can be used for human behavior recognition. Accelerometer signal data gathered from wearable devices are encoded into chromosomes, and a genetic algorithm is used to identify and select the classification parameters. The authors report an 85.4% accuracy, better than the compared classical techniques. Maučec et al. [
7] use the partition around medoids clustering to identify partitions of daily routines. Two vectors, one for active sensors and one for daily activities, are submitted to the clustering algorithm. The similarity between vectors is determined using the generalized Hamming distance and the Levenshtein distance, but no qualitative evaluation of the obtained results is provided. The Gap-BIDE algorithm is combined with collaborative clustering to extract flexible daily routines by considering variations in terms of activities sequence and timespan in [
28]. The routine is defined based on the time spent by the person in each room in [
20]. The time is estimated with a Bluetooth-based location system and supervised machine learning algorithms. Routine detection is performed with the affinity propagation algorithm using as input the time vectors of each of the monitored days and grouping them into clusters from which different routines are extracted. The main drawback is that the routine is extracted using only a single feature, namely the time spent by the person in each room. Shahid et al. [
18] learn the routine of older persons by extracting features such as activities’ duration and frequency from sensors’ data. However, this approach does not consider contextual information that could reduce the false positives in the identified routines. Genetic algorithms have proved to be useful for various domains that resemble daily living activities identification and classification such as disassembly sequence planning, a combinatorial optimization problem [
29]. Heuristics such as red deer and whale optimization can be considered alone or hybridized with a genetic algorithm and simulated annealing to obtain more accurate results [
30]. An approach based on spatiotemporal fusion adaptive resonance theory (ART) neural network to learn the person’s daily routine is proposed in [
6]. The spatiotemporal information is encoded as input features of the neural network. It allows learning for each activity the time interval, the duration, the day of the week, and the location in which is carried. A limitation is that there is no meaningful symbolic representation of the learned patterns, and the interpretation of the learned routine is done manually. The complexity of home healthcare under pandemic situations such as COVID-19 has been addressed in [
31,
32]. Routing and scheduling caregivers to visit patients’ homes considering economic, environmental, and social criteria is rather difficult. Multi-objective optimization heuristic has been proposed on top of the IoT monitoring further improving the home care processes.
The statistical and model-based approaches are aiming to construct a deterministic model of the frequent behavioral patterns and use the model to detect the person’s routines. Wang et al. [
17] determine the daily routine based on the data provided by the smartphone and environmental sensors. The person’s daily behaviors are created using hidden Markov models and include sequences of performed activities and their location. To extract the daily routine, the maximum probability transitions and the Viterbi algorithm are used. One limitation of this approach is that it considers the logical relationship of the behavior occurrence without interpreting their time rule. The daily routine is detected based on the data collected with Beacon technology in [
16]. The person’s daily routine is extracted using a Markov-based model and includes sequences of performed activities and their duration. The main drawback of this approach is that it can identify only a single rigid routine.
Friedrich et al. [
21] propose an approach based on activity probability maps, where the sensors data are used to identify the daily routine. Activity maps are created for each room of the house where the person lives and contain the probability that a sensor is activated. Similarly, in [
33], a model-based approach is described in which activity maps are used to encode the information (i.e., activity, intensity, and spatial distribution) about the daily life activities collected from binary sensors. A set of activity maps is created. Each map is modeled one hour from the considered days. The smallest bounding circle is identified as part of the routine. The approach does not consider the time when the monitored person is not at home, and more experiments need to choose the best timeframe to build the activity maps. Probabilistic models are used in [
22] to model the daily habits of the elders as a two-layer tree, the first layer containing the activities, and the second layer containing the probabilities of performing an activity. The proposed approach is not able to recognize the activities that have been performed by multiple persons in the house. In [
34], an approach that combines frequent pattern mining with complex event processing to extract the social routines of a person is proposed. The approach considers, as features, the time interval in which social activity takes place, as well as specific context information such as: whether it is a working day or a weekend day, whether it is a rainy or sunny day, etc. A limitation of this approach is that it is not able to provide information about the sociability level and detect other behavioral patterns (i.e., physical activity and mobility patterns). Soussa et al. [
33] use the sensors data to build behavioral patterns that include the room’s occupancy and sleep computed using a density function, house entry, and exit computed as average times and frequency in a day. A drawback of this approach is that it was tested only on two persons monitored over a period of 25 days.
Analyzing the above state of the art, we did not find any relevant approaches to address the problem of daily routine detection using approximation methods such as bio-inspired heuristics. Existing solutions use classifiers or rule-based models that can identify rigid sequences of daily life activities as routines lacking flexibility and failing to detect gradual or contextual changes. They need large amounts of annotated data and the finetuning of many adjustable parameters to obtain satisfactory results. The solution proposed in this paper is based on an approximation method that successfully identifies more than one routine, capturing several variations of recurrent daily activity patterns. These routines slightly differ in terms of the sequence of activities that are performed as well as their duration. The metaheuristic-based solution is more suitable than a classifier to provide good results with smaller amounts of data as the search spaces are personalized. Moreover, we must consider that the data monitored a long time ago (for example, a year ago) may not be relevant for learning the current routine of a person as the routine may change over time. In contrast with deterministic approaches, our solution can provide good solutions in a reasonable time without going through the entire search space and features only tew parameters that need to be tuned.
3. Materials and Methods
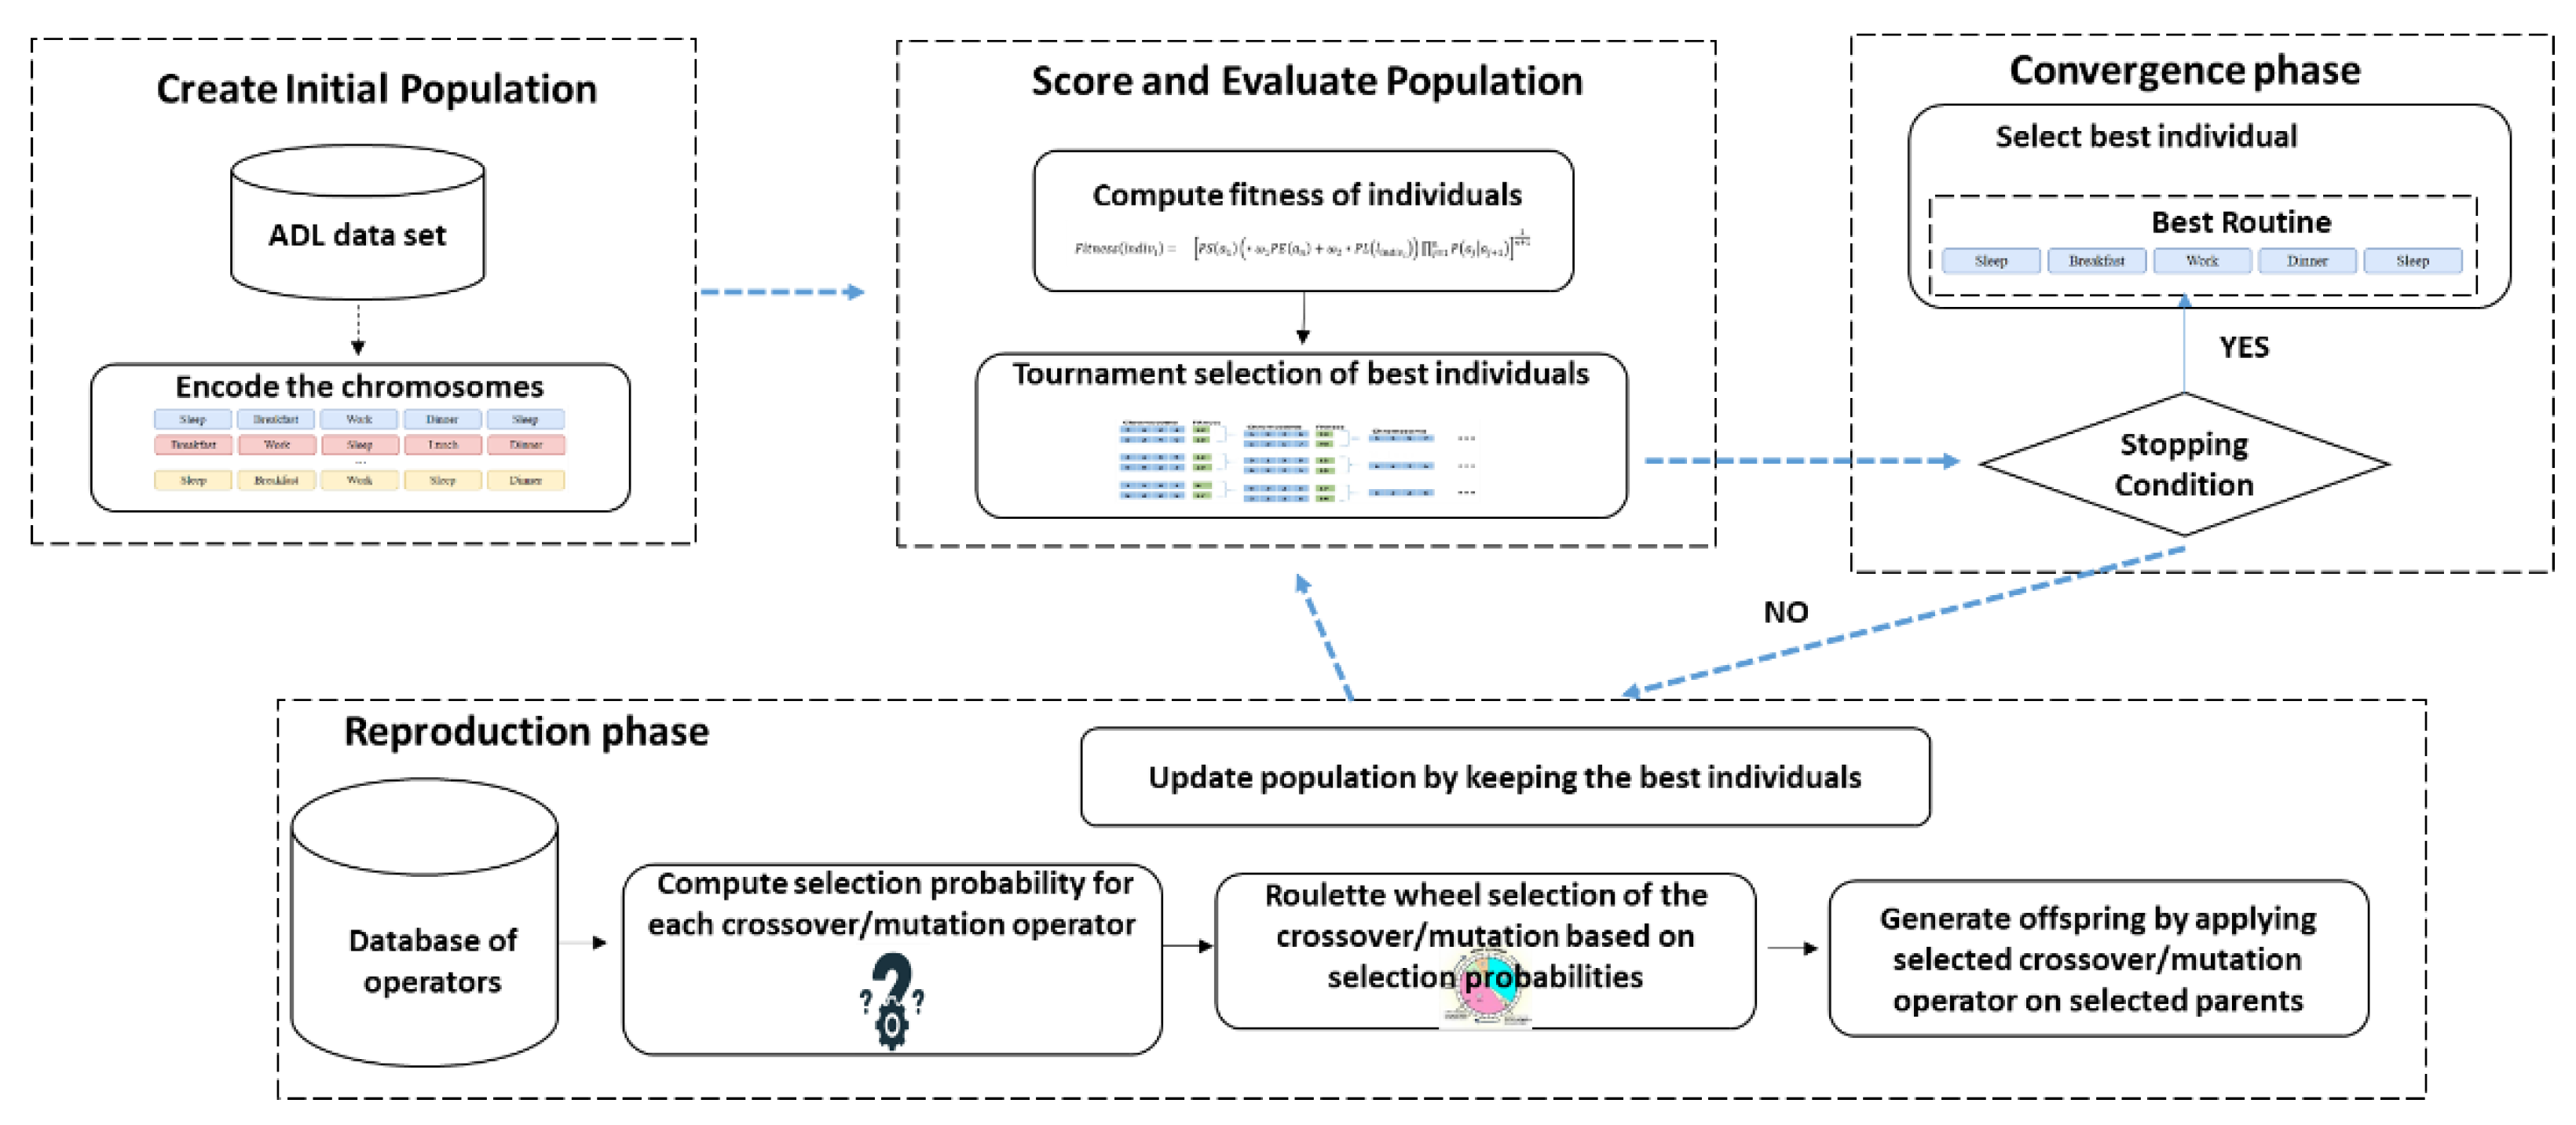
Genetic algorithms (GA) are stochastic search methods that mimic natural biological evolution [
35]. They apply the survival of the fittest principle and operate on a population of individuals to produce better individuals in the next generation. The main steps of applying GA to solve a specific problem are to define a suitable representation of an individual and generate the initial population, define a fitness function for evaluating the individuals and select the best ones, and define an appropriate interpretation for crossover and mutation operators that will be used to generate new offspring and update the population (see
Figure 1).
In the next paragraphs, these steps are followed to describe how GA is used to detect the recurrent activity sequences carried out by humans to construct a person’s daily routine.
An individual (also named chromosome) is encoded as a sequence of ADL representing a potential frequent pattern, part of the daily routine of a person:
where
) represents the historical monitored data (i.e., monitored days) of a person,
are activities performed by the person, and
is a transition between two activities (i.e.,
follows
).
The generation of the first population of individuals has a great impact on the individuals’ evolution and eventually on the algorithm convergence. In our case, we have opted for the random generation of the initial population considering the historically monitored activities of the person on daily basis:
The approach is suitable because the daily routine we want to extract must contain some of the activities patterns already observed in the historical monitored data of a person (
). To assess the quality of an individual and to select the best ones from the population we have defined a probabilities-based fitness function:
In (3),
is the length of the individual
,
is the number of activities in the sequence,
is the start probability of the first activity in the sequence,
is the end probability of the last activity in the sequence,
is the length probability computed for the individual
,
is the transition probability from
to activity
.
and
are the weights associated to the end and length probabilities such that relation (4) is true. In our experiments,
is set to the value of 0.4 and
to the value of 0.6.
The four types of probabilities were defined by us in [
16] were a Markov model-based solution was introduced for routine detection. In this paper, we have adapted and re-used their calculation method for the fitness function definition.
The start and the end probability of an activity
(activity that is most likely to be the first or last activity in the daily routine) are computed by counting the number of appearances of the activity
at the beginning and end of the pattern sequences in specific days and we divide it with the number of days of monitored data available for the person:
The transition probability
is calculated by dividing the number transitions form
to
to the number of all transitions between
and all the other activities available different from
[
16]:
where
and
.
The length probability of a sequence of activities is defined as the probability of having a routine of a certain length and is calculated by counting the number of days that have the same length divided by the total number of days present in the population of individuals:
where
.
To determine the individuals in the current population that will be chosen to transmit their genetic material to the next generation, we have used a tournament-based approach. In the tournament selection, several individuals are randomly selected from the population. The best ones among them as ranked using the fitness function become parents of the next generation of individuals (also called offspring) who are created using some operators.
To avoid the premature convergence of the genetic algorithm when the population reaches a suboptimal state the operators can no longer produce offspring with fitness values better than that of their parents, we dynamically apply several crossover and mutation operators as suggested in [
36]. The selection of the crossover operator that will be applied in each generation is performed dynamically based on the rules presented below that compute the progress rate of applying a specific crossover operator,
. If the offspring
dominates the parents
and
then the progress rate of the crossover operator
is set to the value 1. When the offspring
does not dominate the parents, then the progress rate value for the crossover operator is set to 0.5. If the offspring
dominates either the parent
P1 or the parent
P2 or no dominance relation exists with the other one, then:
Finally, if the offspring D dominates at least one parent, then:
In relation (9) and (10), is the current generation, is the maximum number of generations, and are two parameters that set the velocity of progress which are fine-tuned on an experimental basis. In our experiments, and were set to a value of 0.3.
The scheme for dynamic selection of crossover and mutation operators allows to balance between the exploration and exploitation of the search space avoiding the local optimum and premature convergence. The crossover represents a search within a region closer to a potential solution, while the mutation leads to a solution outside the region. At the same time, the dynamic selection scheme allows the consideration of a variety of operators to guide the search and generate the next population. As there is a variety of operators in the literature, the main criteria used in choosing the operators were the encoding type used in the genetic algorithm for routine detection as well as the reports from literature papers [
37].
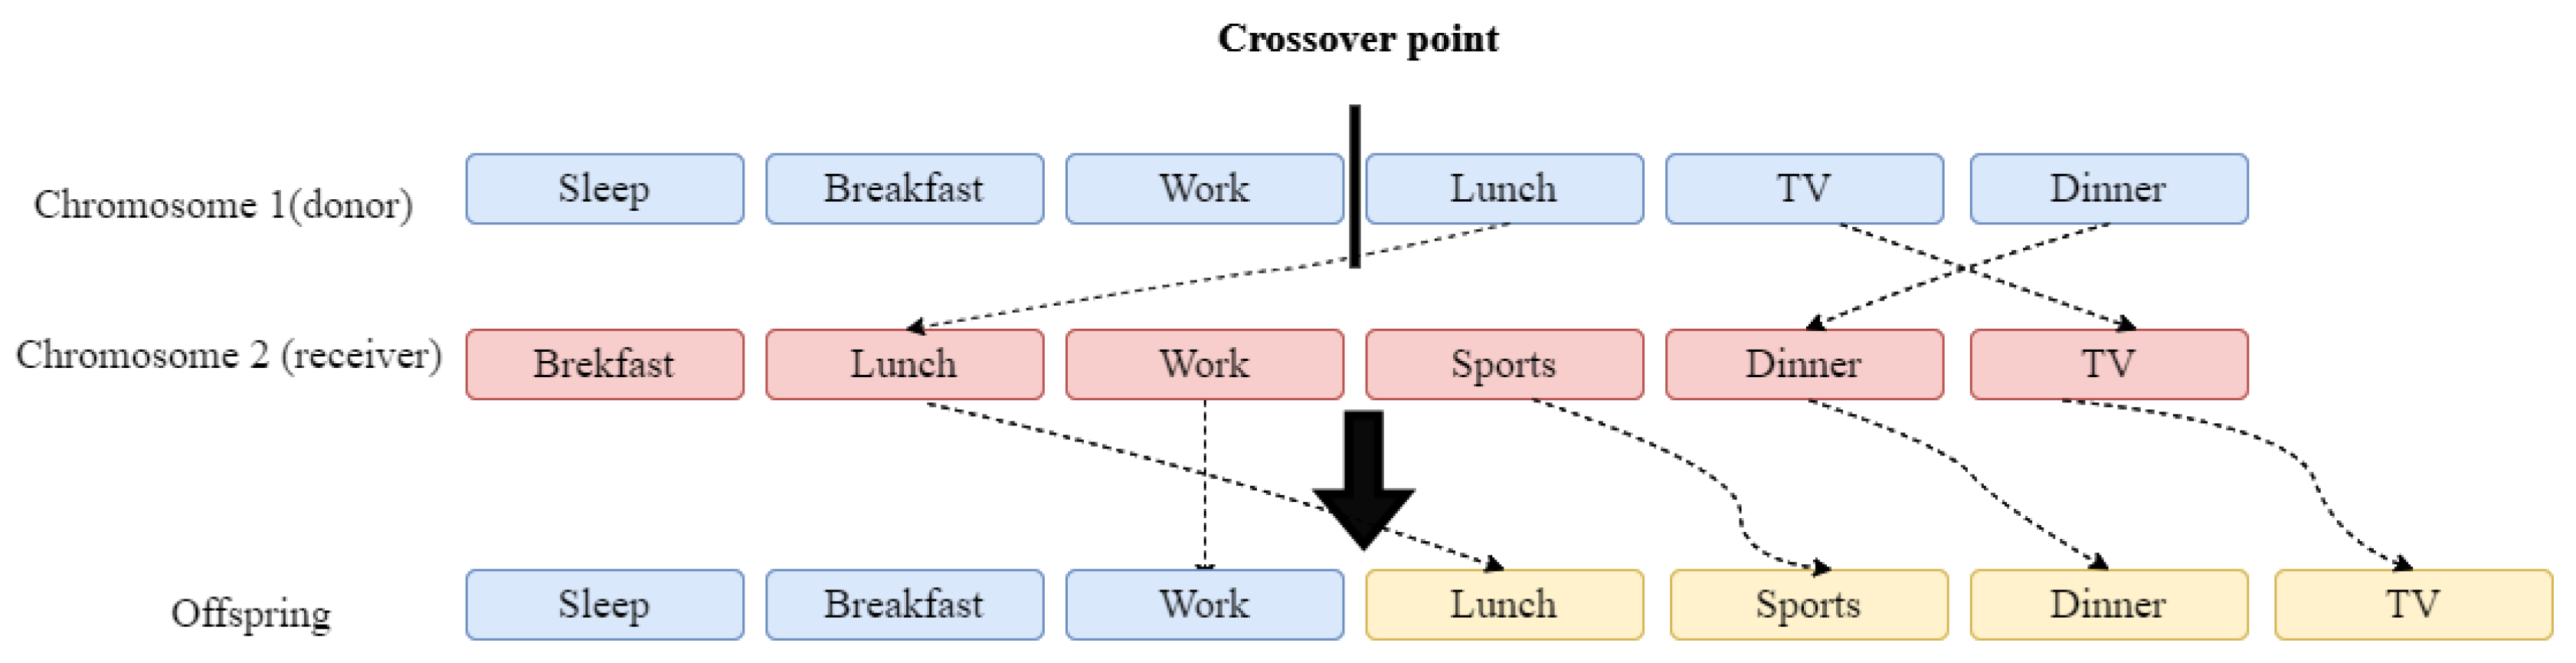
We have considered three types of crossover operators, namely one-point crossover, two-point crossover, and maximal preservation crossover. The crossover operators require two parents to generate the offspring, one being the donor and the other the receiver.
In one-point crossover, a crossover point is randomly generated based on the length of the shortest parent:
Both parents are then split at the location defined by the crossover point. The first offspring will get the first part of the first parent and the second part of the second parent, while the second offspring will get the first part of the second parent and the second part of the first parent (see
Figure 2).
In two-point crossover, two different crossover points are generated that should have a smaller value than the length of the shortest parent. The two points are used to split both parents into three parts. The two offspring chromosomes will have the first and last subsequence of the same parent, but the middle sequence will be from the other parent (see
Figure 3).
The maximal preservation crossover [
23,
24] is a method that produces only one offspring.
Figure 3 and
Figure 4 show how we apply the maximal preservation crossover for the case in which the donor and receiver parents have the same gene and for the case when they do not have the same genes. The crossover point is randomly generated within the donor’s length. The donor sequence is split, and the first part is copied into the offspring, while the second part is reordered based on the receiver parent. In the case in which the donor and receiver parents have the same gene (see
Figure 4), the genes of the second part of the donor will be copied into the offspring based on the order in which they appear in the receiver parent.
In the case in which the donor and receiver parents do not have the same genes (see
Figure 5), the remaining genes from the receiver that are found in the donor will be rearranged in the order in which they appear in the receiver parent, while also keeping the genes that are present only in the recipient (i.e., sport) and then they will be copied in the offspring. In this case, if a gene from the donor is not present in the receiver, it will not be present in the offspring.
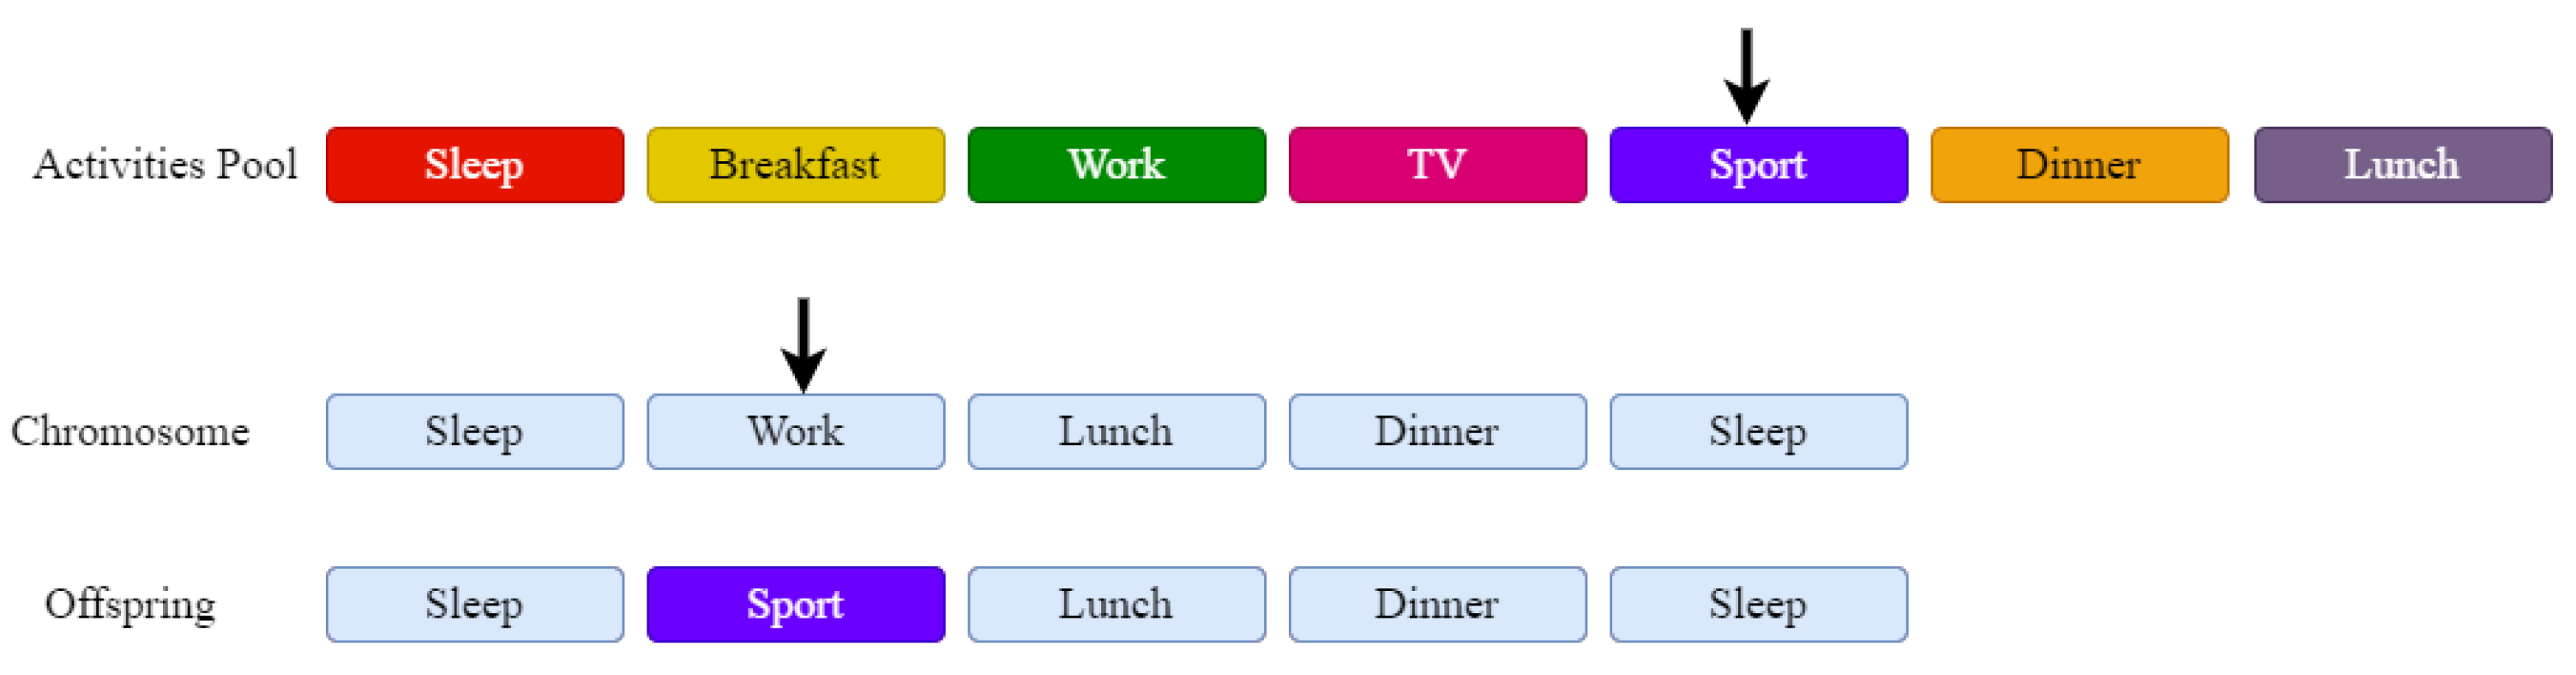
In the case of mutation, we have defined a parameter that specifies for each chromosome if it will be mutated or not. A random number is generated and compared with this parameter to decide. Two types of mutation operators are considered, namely, mutation with random selection and mutation with weighted selection.
In the case of mutation with random selection, we have generated two numbers, one in range
and another one in range
. The first number will correspond to the chromosome gene that will be replaced, and the second number will correspond to the selected activity from the activity pool that will replace the gene.
Figure 6 presents an example of applying a mutation operator with random selection. The two arrows point to the randomly selected activities. As you can see, the gene inside the chromosome will be replaced by a gene from the activity pool.
The mutation with weighted selection is similar, but the selection of the new activity to replace the gene is controlled. Once we have selected a gene to be replaced (see
Figure 7), we will look at the transition probabilities of the gene before it. As we can see in the example in
Figure 5, the activity (i.e., gene) selected to be replaced is “Sleep”, which is preceded by the activity “Work”. To identify the activity that will replace the “Sleep” activity, we will use the values of the transition probabilities of the “Work” activity. We represent the distribution of the “Work” activity transition probabilities in a pie chart where the width of the sectors is proportional to the transition probabilities from “Work” activity to another activity. Based on this pie chart, the selection of the activity that will replace the “Sleep” activity will be performed similarly to the roulette wheel selection method. In our example, the activities that are more likely to follow the “Work” activity (that is, those for which the transition probabilities have higher values) will have a higher chance of replacing the “Sleep” activity. The improvements this method brings over the previous one, is that mutated chromosomes will be more likely to have a higher fitness than the original chromosomes.
The progress rate specific to the application of each mutation operator
is calculated based on the following rules. If the offspring resulted after applying the mutation operator
on an individual dominates the individual, then the progress rate of the mutation operator,
is set to the value 1. When the individual dominates the offspring resulted after applying the mutation operator
on the individual, or the offspring is not valid, then the progress rate value for the mutation operator is set to 0.5. If no dominance relation exists between individual and the offspring resulted after applying the mutation operator,
on the individual, then:
where
is the current generation,
is the maximum number of generations, and
is the velocity of the progress and is set in our experiments to 0.2 value.
The average progress rates of applying each crossover and mutation operator are computed starting from the first generation until the current generation based on the rules described. In the first generation, each operator is assigned the same probability of selection which is 1/n where n represents the number of operators considered in the selection process. The average progress rate of a specific operator is defined as the ratio between the sum of progress starting from the first generation up to the current generation and the number of times the operator has been applied. The result is used to compute the crossover or operator selection probabilities.
Algorithm 1 shows the pseudocode for routine detection using the genetic algorithm with dynamic operators.
| Algorithm 1: GA for Routine Detection Using Dynamic Operators. |
Inputs: dataset—the historical dataset, maxGen—the number of generations
Output: routine—activity sequence representing the routine of a person
Comments:crossovers—the set of crossover operators; mutations—the set of mutation operators; best_routines—the best routines identified during each generation; Opc—crossover operator; Opm—mutation operator
- 1.
Begin - 2.
Generate - 3.
while maxGen is not exceeded - 4.
Select individual1 and individual2, using the tournament selection - 5.
foreach Opc in crossovers do - 6.
offspring = Opc(individual1, individual2) - 7.
Compute the average progress and update the selection probability for Opc - 8.
end for - 9.
Use the roulette wheel selection to choose the most appropriate Opc - 10.
Opc (individual1, individual2) - 11.
Include the resulting offspring in the population - 12.
foreach individual in the population do - 13.
foreach Opm in mutations do - 14.
Opm (individual) - 15.
Compute the average progress and update the selection probability of Opm - 16.
end foreach - 17.
Use the roulette wheel selection to choose the most appropriate Opm - 18.
Opm (individual) - 19.
Include the resulting offspring in the new population - 20.
end foreach - 21.
Keep in the new generation several the best individuals - 22.
Identify and store the current best individual in best_routines - 23.
end while - 24.
return the best routine out of best_routines - 25.
End
|
The algorithm takes as inputs the dataset collected from sensors containing the activities performed by a person on each of the monitored days and the maximum number of generations and returns a person’s daily living routine. The algorithm will test all the crossover and mutation operators on every generation, and we will always advance with the generation of the operator with the highest progress rate.
To incorporate time-related information (e.g., duration of the activity) into the detected patterns of activities, we proposed an approach that measures the dispersion of the time values of the duration of an activity around the average value for each period of the day, namely for morning (between 6:01 a.m. and 12 p.m.), for afternoon (between 12:01 p.m. and 18 p.m.), for evening (between 18:01 p.m. and 0:00 a.m.), and for night (between 0:01 a.m. and 6:00 a.m.). To compute the lower and upper bounds of the interval corresponding to the duration of the activity
is carried out, the standard deviation is determined as:
where:
is the number of days from the dataset in which the activity
ai is performed,
is the duration of the activity
in day
and
is the average value of the durations of the activity
in
days. Based on the standard deviation the lower and upper bounds of the interval of the duration for the activity
are computed as follows:
4. Evaluation Results
In our experiments, we have used the dataset from [
16]. It contains data over three months linked to the ADLs performed by 10 older adults (ids 1 to 10) daily in their own homes. The data were acquired using a monitoring infrastructure based on wearable sensors and Beacons technology. Each ADL features a start and end time and one of the following activity labels: sleeping, eating (i.e., breakfast, lunch, snack, dinner), personal hygiene, reading, spare time/TV, walking, and outside. Not all the activities are registered for each person. Some of them do not perform specific activities such as going outside, or walking is highly dependent on their health state. The monitored older adults who volunteered to participate are aged between 70 and 85 years. All of them suffer from cardiovascular diseases. They live alone but have the support of their family. The ten apartments in which they live have similar plans and devices. They have the same number and types of devices that they use in their homes.
Compared to the classification-based solutions where the number of persons in the dataset may influence the quality of the results obtained, in the case of our genetic solution, this is not the case. For each person, a different search space is created based on the daily activities’ length intervals and probabilities for activities transition. They are rather personal and driven by individual conditions, wishes, and needs. They are encoded into the chromosomes and used in the reproduction phases to guide and balance the exploration and exploitation of the search space. No search information is being translated and used across the different persons’ individual search spaces.
To analyze the characteristics of the dataset used in experiments, we conducted an exploratory analysis using statistical graphs.
Figure 8 shows the distribution of the average durations of each ADL for each person in the dataset, while
Figure 9 illustrates the frequency of appearance of each ADL.
The sleep activity has the longest average duration for all the persons in the dataset and the frequency of occurrence of breakfast, lunch, and dinner activities has a high degree of similarity for all the persons in the dataset. Higher differences in the frequency of occurrence are observed in the case of sleep, personal hygiene, or spare time/TV and reading activities. Moreover, there are persons with missing activities such as snacks, walking, reading, or outside. This is due either to the fact that the sensor did not record that activity, or because the person did not do that activity.
The duration of activities, their frequency of appearance as well as the potential transitions among the activities influence the dimension of the search space:
where
represent the set of activity labels from the dataset,
the combinations of transitions among two activities in the dataset,
is the frequency of appearance of an activity and
all combinations of activities with their duration.
Figure 10 also shows the distribution of sleep activity duration for a person. As can be seen, there is a variety of durations for each activity which makes the search space for daily routines quite big and difficult to be processed in a reasonable time by deterministic algorithms requiring the use of heuristics.
To assess the performance of our genetic algorithm for behavioral patterns and routines discovery, we have computed the accuracy of the generated solutions for all persons monitored in our dataset.
Table 1 illustrates the computed accuracies for each person which vary between 80% and 86% with an average accuracy of 82%.
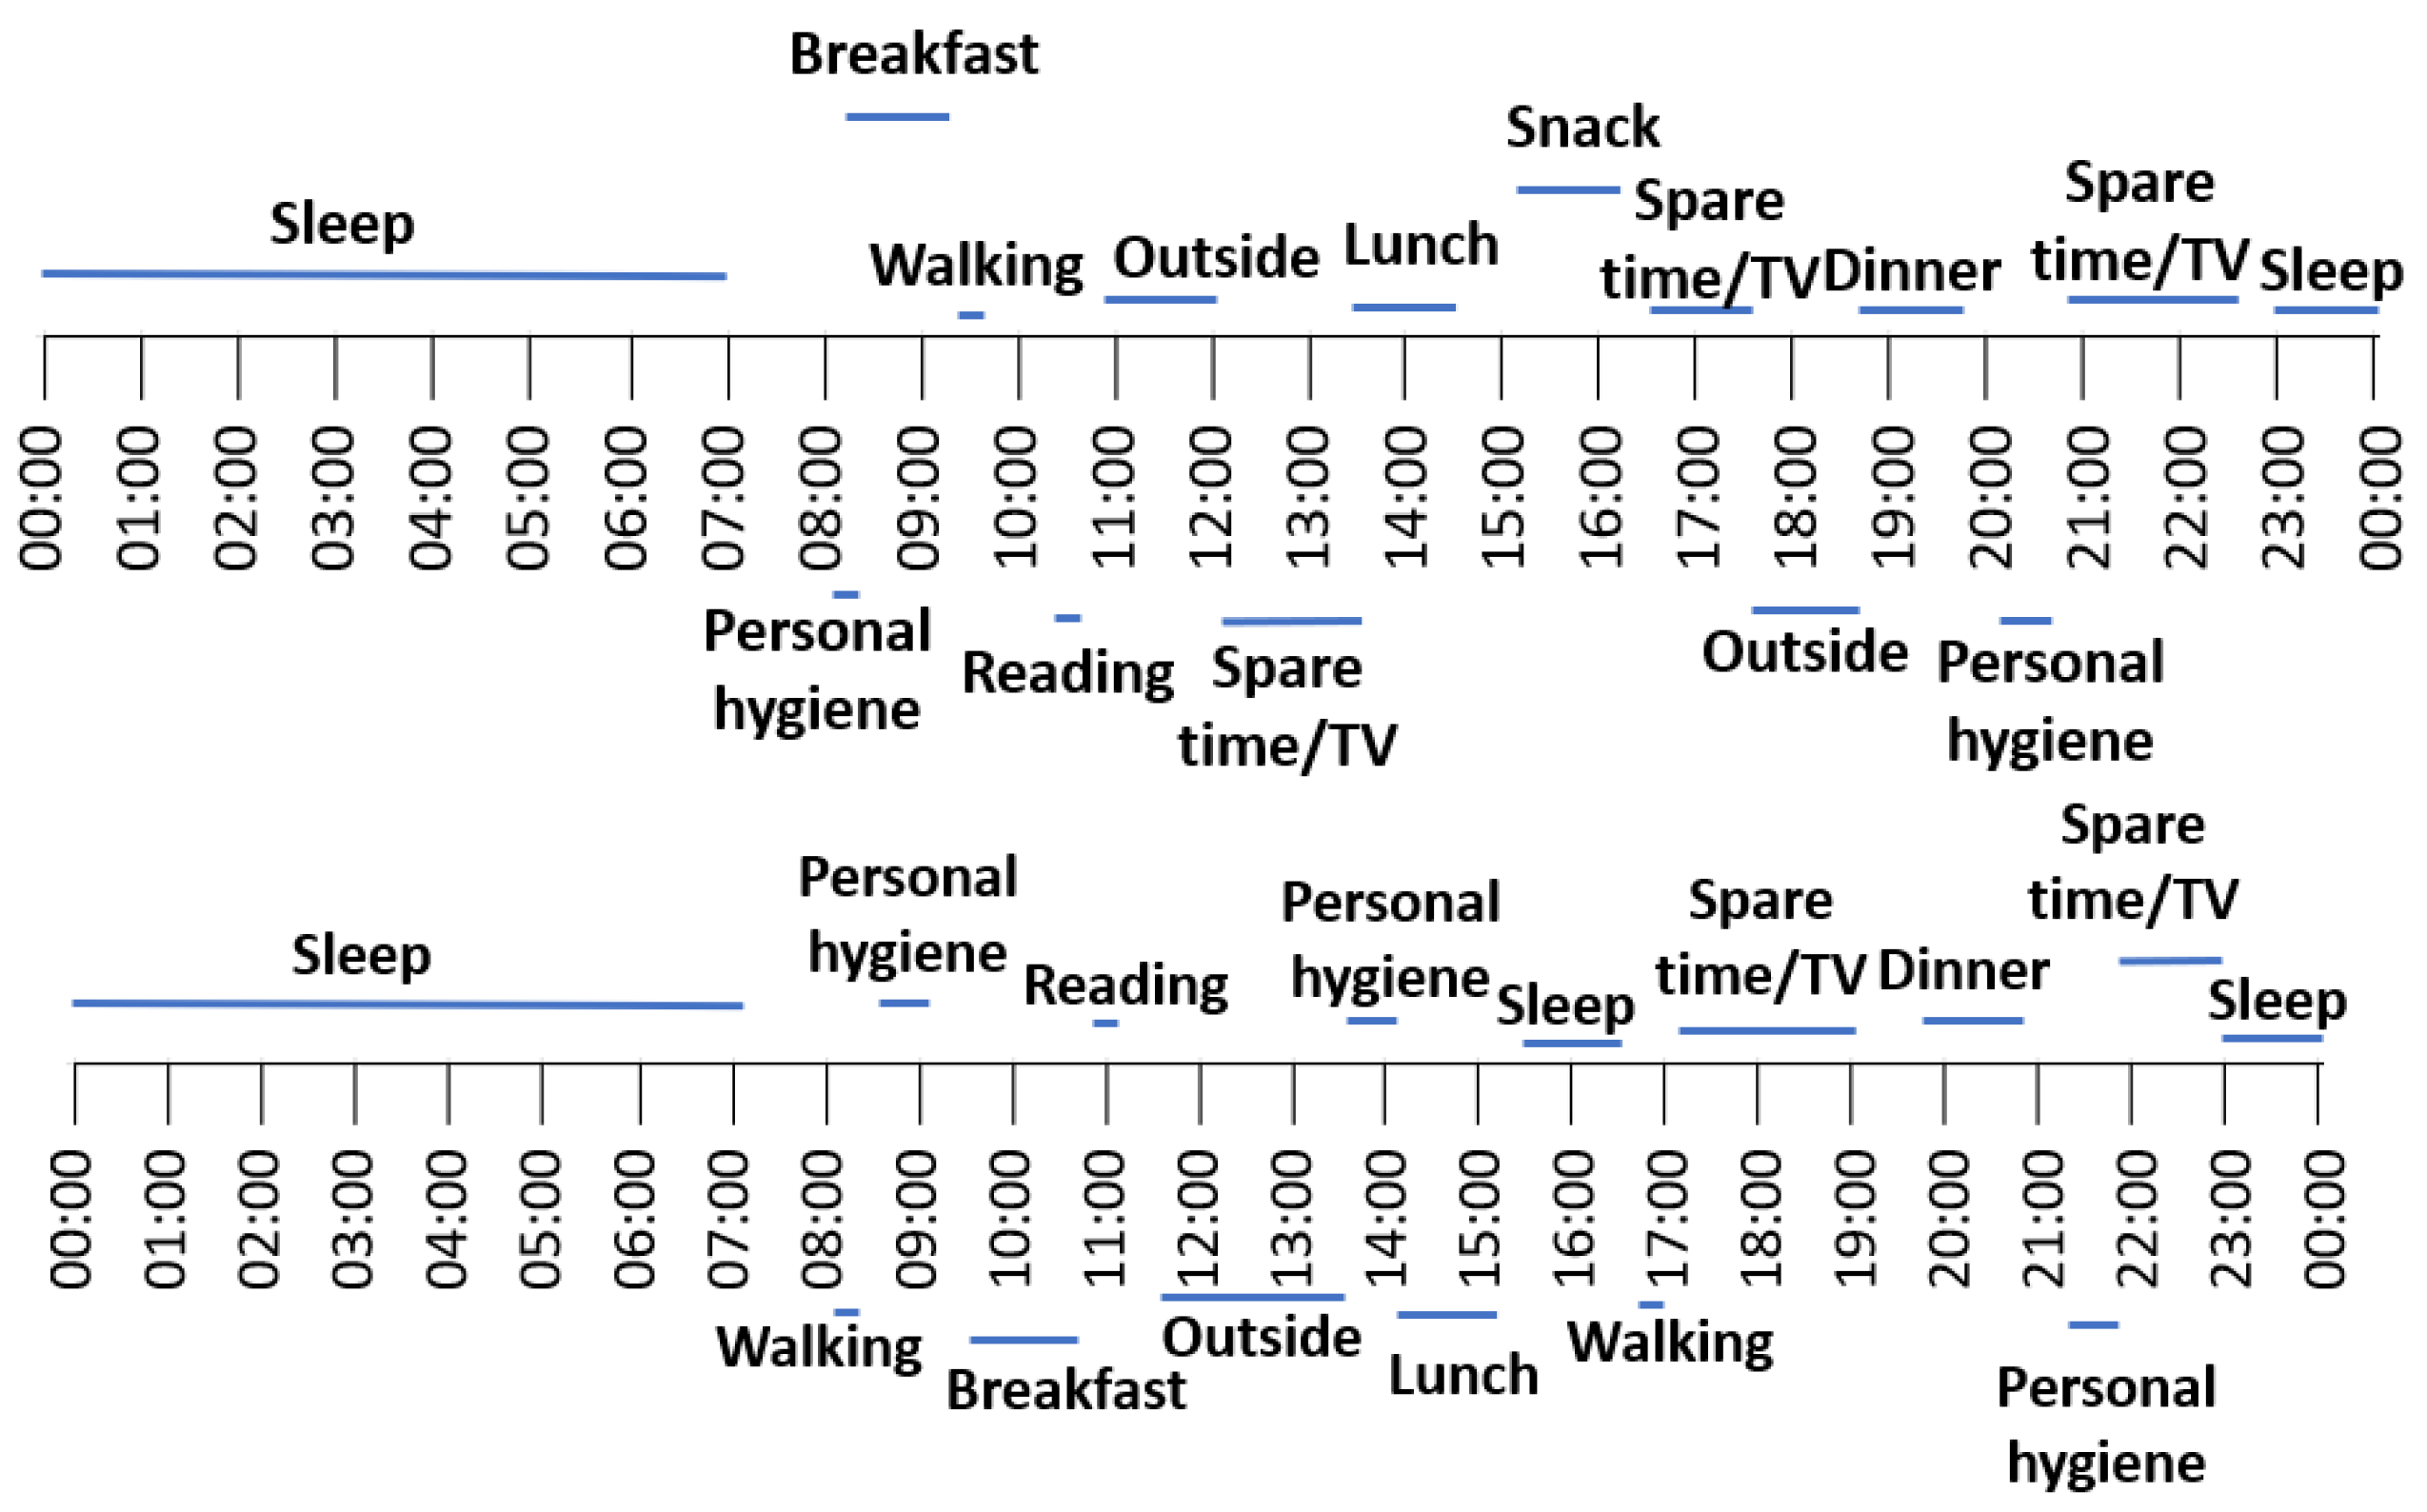
Figure 11 illustrates the best-ranked routines generated by the genetic algorithm for the person with id 6 showing the frequent activities sequences and their duration.
The duration interval corresponding to each activity in each period of the day (i.e., morning, afternoon, evening, and night) for the first routine is presented in
Table 2.
By analyzing the best routine returned by the genetic algorithm we can observe that the patient sleeps between 11 p.m. and 7 a.m. with an average sleep duration of 8 h, has breakfast between 8 and 10 a.m. with an average duration of 26 min, goes outside two times per day, in the morning and in the evening with an average duration of 62 min in the morning and 47 min in a part of the afternoon and evening.
To compare our results with previous solutions from the reviewed literature, we tried to identify similar approaches that address routine detection using only bio-inspired heuristics. The closest we could find was the one proposed by Quaid et al. [
27]; thus, we compared it with their reported results. They proposed a reweighted genetic heuristics and classification algorithm for human behavior recognition from accelerometer signals.
Table 3 presents the accuracy metric value reported by the authors compared with the accuracy of our algorithm, which achieves slightly better results.
5. Discussion
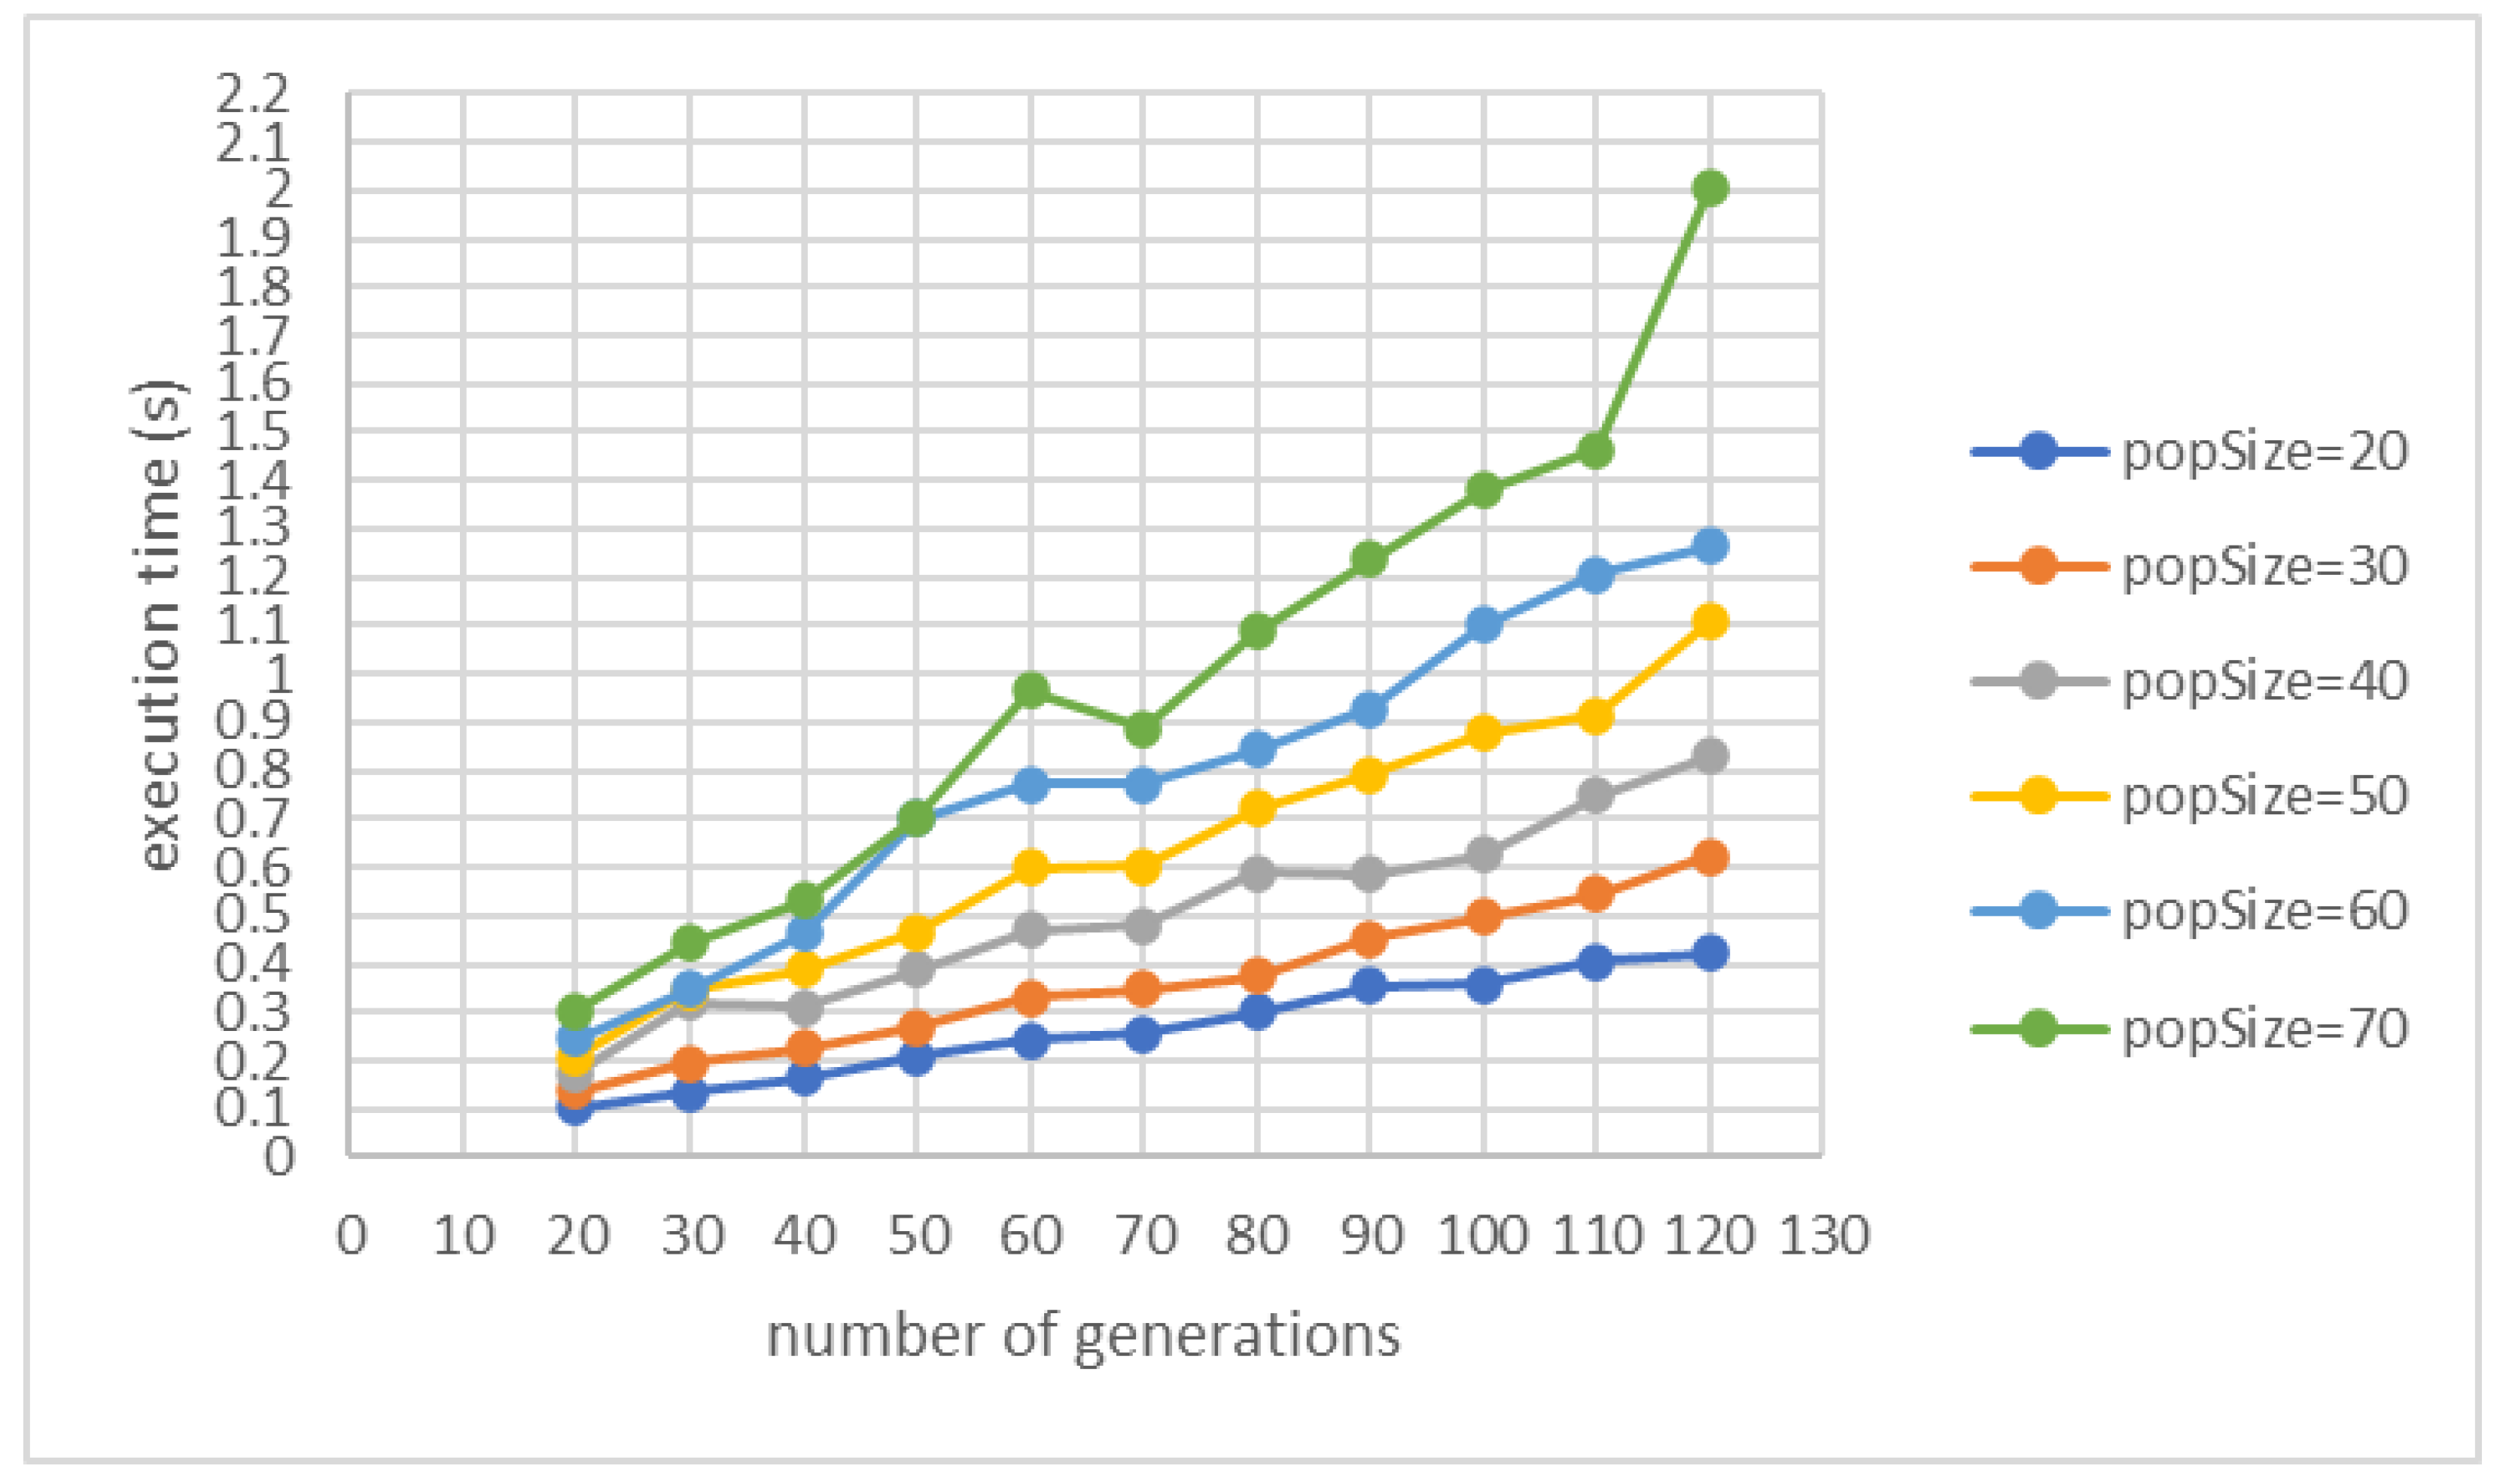
To identify the impact of the control parameters on the performance of the genetic algorithm and to fine-tune their values we have performed sensitivity analysis. We have determined how the target variables reflecting the performance of our proposed solution (i.e., fitness value and execution time) are affected by the changes in input parameters such as population size () and number of generations (). The objective was to finetune them to the best variant so that the genetic algorithm determines the person’s daily routine with the greatest accuracy. The ranges in which the input parameters are varied are [20,120] for number of generations and [20,70] for population size.
Figure 12 and
Figure 13 show the evolution of the fitness value and execution time when the proposed genetic algorithm is used to detect the routine of a person.
First, we maintained the population size at a constant value and varied the number of generations between 20 and 120. Then, we repeated this experiment for a population size varying between 20 and 70. For each considered configuration, 30 runs were made to compute the average values for fitness and execution time. As shown in
Figure 12, with the increase in the population size, an improvement in the fitness value is achieved but also increases the execution time (see
Figure 13). The trend is similar when the size of the population is maintained constant and the number of generations is increased (i.e., the value of the fitness and the execution time increase). In the case of fitness evolution, at some point, the increase in the value of fitness stabilizes and does not change for many generations, while in the case of the execution time, the growth is proportional to the number of generations.
As we aim to identify a routine that reflects as faithfully as possible the frequent patterns of activities that the person performs during the day, thus we focus on solutions with a fitness value as high as possible even if it involves a higher execution time.
Table 4 presents the configurations that have provided the best results in terms of fitness values for routine detection. The best average fitness value is obtained for a population size of 70 and 110 generations with a minimum impact on the execution time which is kept below 1.5 s.
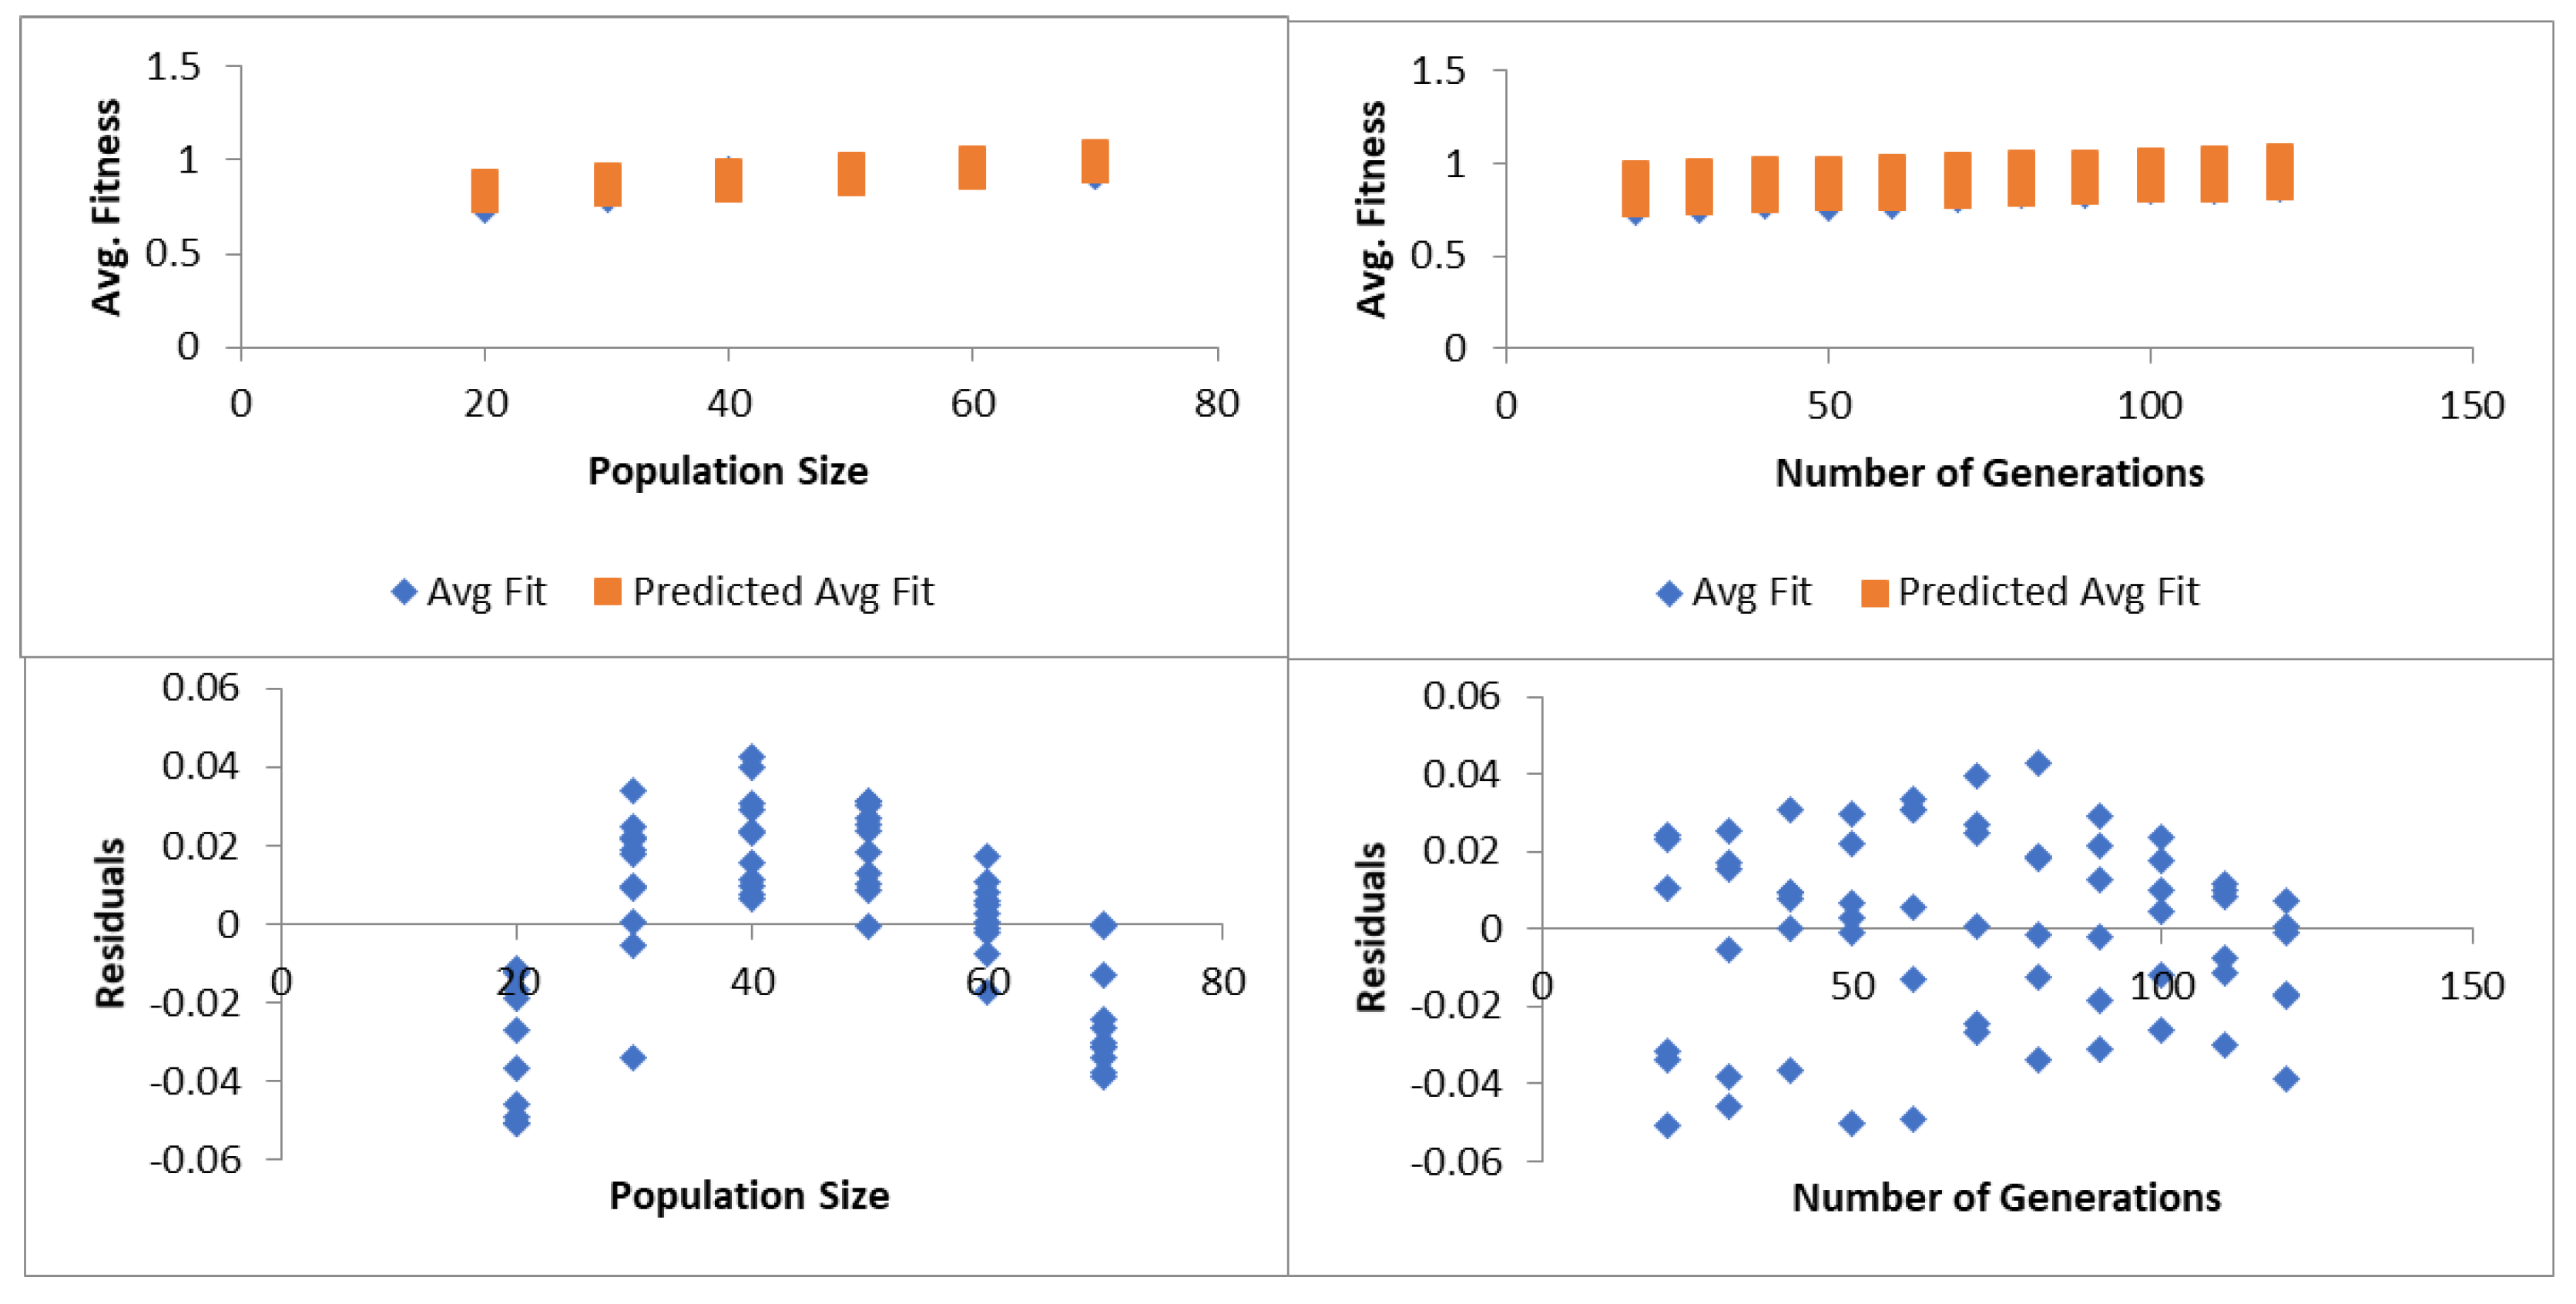
We have performed multiple regression studies to analyze how the size of the population and the number of generations affect the value of the fitness in the GA approach. We investigated various regression coefficients, the ANOVA table, and the regression analysis table. For the correlation coefficient, multiple R takes values in the range [−1, 1] and indicates a linear relation strength between the independent and dependent variables. In the case of our algorithm, the multiple R-value is 0.92 showing a positive relation between the fitness value (dependent variable) and the population size and the number of generations (independent variables. The coefficient of determination, R square measures how much of the variation in the fitness value can be explained by the variation in population size and number of generations. In our case, the R-square value of 0.85 indicates that 85% of the variation in fitness value can be explained by the change in the population size and number of generations. The standard error measures the precision of our analysis model, and the lower the value is, the more precise predictions are provided. In our case, we obtained a standard error of 0.024, thus the regression model produces precise predictions. Finally, the observation represents the number of configurations of the parameters considered which in our case is the combination of the number of generations and the size of the population in our model.
The analysis of variance, ANOVA table, (see
Table 5) provides information about the variability level of our regression model reflected by several components. At the same time,
Figure 14 shows details of the spread and distribution of the results achieved on how the control variables of population size and the number of generations influence the value of the fitness function. The residuals show the difference of the mean sample (i.e., positive when the value is greater and negative when the value is smaller). The degree of freedom, df, is associated with the variance sources, while the sum of squares SS provides information about data dispersion, and how well the data fits into the regression model. As can be seen in our case the value of the residual SS is lower compared to the total SS, indicating that the model fits well the data. The mean squares parameter, MS, provides an estimate of the variance concerning the regression and is calculated as the ratio between the sum of squares and the degree of freedom. It is used to determine the F value which provides information about the fitness model’s importance in relation to the null hypothesis. Significance F shows if our solution with the two independent variables (that is, the population size and the number of generations) can be used to explain the variability of the fitness value. Since in our case, the value of Significance F is lower than 0.05 the model is statistically significant.
The regression analysis from
Table 6 provides more in-depth information on the influence of the size of the population and the number of generations. The coefficients are the least square estimates for the independent variables (i.e., the size of the population and the number of generations), the standard errors for coefficients are the standard errors of the least squares estimates for the independent variables and the
p-value is the value for hypothesis testing.
The coefficients values reflect the mathematical relation between an independent variable either the population size or the number of generations and the dependent variable, while the p-value indicates if the relation between an independent variable and the dependent variable is statistically significant or not (i.e., if there is a correlation between an independent variable and the dependent variable). In the case of our algorithm, the coefficient for the size of population is 0.003, while for the number of generations is 0.0008. These values mean for an increase in one unit in population size, the value of the fitness function will increase on average by 0.003, and for an increase in one unit of the number of generations, the value of the fitness function will increase on average by 0.0008. Since these values are small, we conclude that the size of the population and the number of generations have quite a small influence on the variability of the value of the fitness. However, of these two variables, the size of the population has a greater influence on fitness than the number of generations. Both the number of generations and the population size are statistically significant and influence the fitness variability since the p-values are lower than 0.05.
6. Conclusions
In this paper, we proposed a solution for identifying the frequent behavioral patterns part of the daily routines of a person by considering, as relevant features, the sequence in which the activities are performed as well as the time interval and the duration corresponding to each activity in the sequence. Genetic algorithms are used to identify the sequence of activities that occur on the vast majority of monitored days, and a method based on the standard deviation is used to calculate the time interval and duration corresponding to each activity in the sequence.
To avoid the premature convergence of the genetic algorithm and to maintain a better balance between exploration and exploitation, a strategy based on the dynamic application of crossover and mutation operators has been used. The selection of crossover and mutation operators that were applied in the dynamic selection strategy was made taking into consideration the encoding strategy of an individual that we used as well as the advantages that these operators offer as reported in the specialized literature.
The approach has been tested on a dataset of ten patients with age between 75 and 80 who suffer from cardiovascular diseases. For each person, a different search space was created based on the duration intervals of the daily activities and the transition probabilities of the activities, on which the genetic algorithm was applied to extract the daily routine corresponding to that person. To determine how the performance of the genetic algorithm is influenced by the variations of the control parameters, we have performed a sensitive analysis. We have also compared our approach with other state-of-the-art approaches, to assess its performance in terms of the accuracy of the results.
The obtained results demonstrate that our approach can provide good results even when working with smaller amounts of data, unlike existing classifier-based approaches that require large amounts of annotated data to achieve good results.
In future work, we plan to implement a distributed version that runs several genetic algorithm instances in parallel, aggregates the best solution provided by each instance, and outputs the best solution out of this set. This may improve the accuracy of detecting the routine of the person. Moreover, to better capture the behavior of a person in a certain context, we intend to encode in the individual representation contextual information as well as additional information regarding the location in which the activities are performed or the frequency of the activities. Finally, we will look into newer and promising metaheuristics such as Whale or Harris hawks optimization algorithms that may improve the results of daily routine detection.


 ,
, 


