Article

Combining Knowledge and a Data Driven Method for Identifying the Gas Kick Type in a Fractured Formation

1
Petroleum Engineering School, Southwest Petroleum University, Chengdu 610500, China
2
China CNPC Engineering Technology R & D Co., Ltd., Beijing 102206, China
*
Author to whom correspondence should be addressed.
Appl. Sci. 2022, 12(21), 10912; https://doi.org/10.3390/app122110912
Submission received: 13 June 2022 / Revised: 29 July 2022 / Accepted: 26 October 2022 / Published: 27 October 2022

Abstract

:
The main forms of gas kicks into the wellbore during drilling in fractured carbonate reservoirs are underbalanced pressure and gravity displacement. These two forms of gas kicks have different mechanisms of gas entry into the wellbore and different well control measures, which require the timely identification of the type of gas kick when it occurs. A two-phase flow model with a wellbore-formation coupling was developed, based on the gas kick rate models. The variation characteristics of the bottomhole gas influx rate, the wellbore free gas, the bottomhole pressure, the bottomhole pressure change rate, the pit gain and the outlet flow rate during an underbalanced pressure gas kick and a gravity displacement gas kick, were compared and analyzed. Combining the dynamic time warping (DTW) and the wellbore-formation, coupled with a two-phase flow model, an identification method of the gas kick type, based on the DTW was proposed. Following the detection of the gas kick, the identification is performed by calculating the DTW distance between the surface parameter time series, obtained from the two-phase flow simulation and the surface parameter time series, measured in real time. The field example results show that the method can identify the type of gas kick, based on the real-time surface measurement parameters and provide a basis for taking targeted well control measures.

1. Introduction

As the chemical cementation of the carbonate formation is greater than the mechanical compaction, the genetic mechanism and prediction methods of the abnormal high pressure are different from those of the clastic formation, which makes it difficult to predict the formation pore pressure. When drilling in fractured carbonate gas reservoirs, especially with a narrow safety mud density window, drilling risks, such as a gas kick, are prone to occur, which seriously affects the drilling safety and prolongs the drilling cycle [1]. The formation of a gas kick, in addition to being caused by the negative pressure difference in the underbalanced case, may also be formed by the gravity displacement in the overbalanced case. Due to the different mechanisms of gas kicks, different measures need to be taken, otherwise the operational risk may be increased [2], it often leads to the occurrence of a secondary well kick or blowout, resulting in serious consequences, such as the well destruction, destruction of the oil and gas resources, and pollution of the natural environment. However, a gravity displacement gas kick and an underbalanced pressure gas kick have similar performance characteristics at the surface, both of which show an increase in the pit gain, due to the gas entry into the wellbore, making identification difficult. Researchers have been studying an underbalanced pressure gas kick for a long time and have continuously developed its mechanism and control theory, while the study of a gravity displacement gas kick has only been gradually carried out in recent years.
Some studies performed a sensitivity analysis on the effect of the fracture size, the drilling fluid performance and other parameters on the gas-liquid gravity displacement, based on the gas-liquid gravity displacement observed in the visual experimental devices [3,4,5]. Some scholars have conducted experimental research on the gravity displacement laws between asphaltene heavy oil and drilling fluid, analyzed the effects of the fracture width, density and viscosity on the gravity displacement, and established a mathematical model [6,7,8,9,10]. The above studies analyzed the effects of the fracture size and the drilling fluid performance on the gravity displacement through experimental phenomena and measurement data, and proposed the corresponding preventive measures, but did not investigate how to identify gravity displacement after it occurred. By modeling the gas-liquid two-phase flow under a gas kick, the variation characteristics of a gravity displacement gas kick and an underbalanced pressure gas kick, in terms of the bottomhole pressure, free gas, and pit gain, are obtained [11,12,13]. Based on the application of back pressure at the wellhead, during the managed pressure drilling, researchers judged the gravity displacement gas kick and the underbalanced pressure gas kick, by the change in outlet flow rate. While their method is able to identify the type of gas kick, it takes a longer time and carries the risk of the continuous deterioration of the overflow. In [14], Xia established a flow model of the wellbore-formation coupling, based on the mechanism of the gas kick occurrence, and obtained the gas kick characteristics of the different gas kick types. Meanwhile, they proposed a method to identify the type of gas kick, by observing the pit gain curve and the standpipe pressure curve, which rely on the theoretical and empirical knowledge of the field engineers and technicians.
With the development of artificial intelligence (AI) technology, combining physical models with AI algorithms has become the trend in engineering technology today. For specific engineering problems, the mechanism model and AI model are coupled to drive the way, and the physical model, data and algorithms are used at the same time, which is the third generation of AI technology. Dynamic time warping (DTW) is a classical similarity analysis and pattern recognition algorithm that uses flexible pattern matching techniques. It is able to match patterns in the presence of global or partial extensions, compressions and deformations, thus solving the problem of the similarity metrics and the classification of dynamic patterns [15]. The dynamic time warping algorithm can effectively solve the limitations of the Euclidean distance calculation method in the expansion and bending of the time axis. Based on the idea of dynamic programming, the DTW algorithm finds the shortest path between two pieces of data, that is, the total distance (similarity) between the two pieces of data. With the advantages of a fast computation, a high positive recognition rate and robustness, the DTW algorithm is widely used to solve pattern recognition problems in many fields. For example, good results have been achieved in speech recognition [16], dynamic gesture recognition [17], fault diagnosis [18,19], problem classification [20], gene matching [21] and reservoir identification [22].
This paper analyzes the characteristics of the surface measurement parameters under different gas kick types, on the basis of the flow model, coupled with the wellbore and the formations established by previous authors. AI algorithms are used to analyze the surface measurement parameters during the overflow process and the parameters computed from the physical model, to identify the type of gas kick by means of the combination of the physical model and AI methods. Compared with the existing methods, the method proposed in this paper does not need to wait for a lag time, and there is no need to adjust the wellhead backpressure, and the fine outlet flow measurement is not required, which is not only suitable for managed pressure drilling, but also for conventional drilling.

2. Materials and Methods

2.1. Physical Modeling and Characterization of the Gas Kick in Fractured Reservoirs

The different ways of gas entry into the wellbore under different gas kick types will result in different characteristics of both the gas influx rates and the surface measurement parameters. By coupling the bottomhole gas influx rate model and the two-phase flow model of the wellbore, the regular characteristics of the surface measurement parameters, under different gas intrusion types, can be obtained, which provides an identification basis for the gas kick type.

2.1.1. Physical Model and Basic Assumptions

Figure 1 shows the physical model of a two-phase flow in the wellbore annulus, during overflow. In fluid mechanics, fluid motion is generally described using the Eulerian method, which focuses on the state of a specified location in a fixed and immobile space in the wellbore annulus (the space is called the control body). This method analyzes the instantaneous velocity, pressure, density and other parameters of the fluid mass as it passes through the specified location, by studying the variation of the flow volume at the location with time. In turn, the pressure, gas-liquid distribution, gas-liquid velocity, and gas-liquid density in the entire wellbore annulus are obtained. As shown in Figure 1, a micro-element of length a, cross-sectional area A and well slope angle b, are taken as a control body in the wellbore annulus for the study, and the fluid flows from its cross-sectional section S to its cross-sectional section S’.
For establishing a set of control equations for the two-phase flow in the wellbore annulus, during overflow, the conservation laws of mass, momentum and energy are followed, starting from a continuous medium model and the following assumptions. (1) Ignoring the compressibility of the drilling fluid during the circulation drilling; (2) The fluid in the wellbore is flowing along a one-dimensional axial direction, ignoring the radial flow; (3) Ignoring the effect of the rock cuttings, with a gas-liquid two-phase fluid in the wellbore. (4) The temperature and pressure of each phase in the cross section are the same.

2.1.2. Wellbore Two-Phase Flow Model under Well Surge Conditions

The physical model of the continuity equation is built using the conservation law of mass. It is expressed as the mass of fluid flowing into the control body being equal to the mass of fluid flowing out of the control body, plus the change in the mass of fluid within the control body, per unit of time. The continuity equations for the gas and liquid phases are Equations (1) and (2), respectively. The detailed derivation process is given in [23].
ρ g v g A E g z + ρ g A E g t = q g
ρ l v l A E l z + ρ l A E l t = q l
where ρ g is the gas phase density, kg/m3; ρ l is the liquid phase density, kg/m3; v g is the gas phase velocity, m / s ; v l is the liquid phase velocity,   m / s ; E g is the true gas holdup; E l is the true liquid holdup; A is the annular cross-sectional area, m 2 .
t ρ g v g E g A + ρ l v l E l A + z ρ g v g E g A + ρ l v l E l A + ρ g E g A + ρ l E l A g cos θ + A p z + A f r z = 0
where g is the acceleration of gravity, m / s 2 ; θ is the angle of inclination of the well, rad ; p is the pressure in the annulus, Pa ; f r is the flow friction pressure drop, Pa .
Following the reservoir gas intrusion into the wellbore, the heat transfer process between the formation and the wellbore fluid becomes non-stationary. According to the law of energy conservation, the difference between the heat inflow per unit time within the control body through the bottom interface and the formation, and the heat outflow through the top and the drill string, is equal to the amount of the heat change within the control body, which can be expressed as Equation (4).
t ρ g E g C p g T a A + ρ l E l C p l T a A t m g C p g T a + m l C p l T a = 2 X T f T a 2 Y T a T p
where mg is the gas phase mass flow rate, kg / s ; m l is the liquid phase mass flow rate, kg / s ; C p g is the specific heat capacity of the gas phase, J / kg ° C ; C p l is the specific heat capacity of the liquid phase, J / kg ° C ; T f is the formation temperature, °C; T a is the annular temperature, °C; T p is the fluid temperature inside the drill string, °C; X is the integrated heat transfer coefficient between the formation and the annulus fluid, J / kg ° C ; Y is the heat transfer coefficient by conduction between the annular fluid and the drill string fluid, J / kg ° C .

2.1.3. Gas Kick Model

During the gas reservoir drilling, when the bottomhole pressure is lower than the formation pore pressure, the formation gas will enter the wellbore annulus under their differential pressure. Compared with the extraction of gas wells, the differential pressure between the formation pressure and the bottomhole pressure during the gas kick, is much lower than that during the gas extraction, and its isothermal expansion effect is weak, which can be approximated as a Darcy linear flow of the formation of the gas seepage during the gas kick. In addition, since the bottomhole pressure is underbalanced, the influence of the drilling fluid on the permeability of the near-well zone can be ignored. It is known from the literature [11] that the rate of the gas influx into the wellbore can be expressed as Equation (5).
Q SC = 774.6 K h P e 2 P wf 2 T Z μ l n r e r w
where Q SC is the rate of the gas influx into the wellbore at standard conditions, m 3 / d ; Q g is the gas flow rate at the temperature and the pressure at the bottom of the well, m 3 / d ; K is the permeability of the formation, mD ; h is the thickness of the drilled reservoir, m; P e is the formation of the pore pressure, MPa; P wf is the bottomhole pressure, MPa; r e is the radius of the supply boundary, m; r w is the radius of the wellbore, m; μ is the gas viscosity, mPa s ; Z is the gas compressibility factor; T is the formation temperature, K .
When drilling in the fractured formations under overbalanced or near balanced conditions, a gravity displacement will occur between the drilling fluid in the annulus and the gas in the formation fractures, due to the density difference between them. The drilling fluid flows into the fracture along the lower wall of the fracture, while the gas influxes into the wellbore along the upper wall, and this process is known as the gravity displacement gas kick. The driving force for the gravity displacement gas kick is the density difference between the drilling fluid and gas. The gas influx rate is affected by parameters, such as the formation porosity, the formation permeability and the wellbore size, as shown in Equation (6). During the gas kick, the formation parameters and the wellbore size remain almost constant, and although the bottomhole pressure decreases continuously with the gas kick, the change in the bottomhole gas density is small in the early stage of the gas kick. Therefore, the gas influx rate of the gravity displacement gas kick can be considered as a constant value.
q r = g K , ϕ , r w
where ϕ is the formation porosity.

2.1.4. Model Solution

A formation-wellbore coupled multiphase flow model is used, and Equations (5) and (6) are used as the bottomhole boundary conditions. Simulations of the underbalanced pressure gas kick and the gravity displacement gas kick are conducted separately, in order to obtain the variation law of the surface measurement parameters under different types of gas kicks. Meanwhile, by analyzing the variation law of the surface measurement parameters, the characteristics of the gas kick under different types of gas kicks are obtained. In addition, the establishment and solution of the formation-wellbore coupled two-phase flow model has been studied extensively by previous authors and have formed a fairly mature theory, which will not be repeated in this paper.

2.1.5. Model Initialization

The initial state of the model is as follows.
E g 0 , h = 0 E l 0 , h = 1 E g 0 , h = 1 v s l 0 , h = Q l A p 0 , h = p h
where h is depth, m; v s l is the liquid superficial velocity, m/s; Q l is the drilling fluid displacement, L/s.

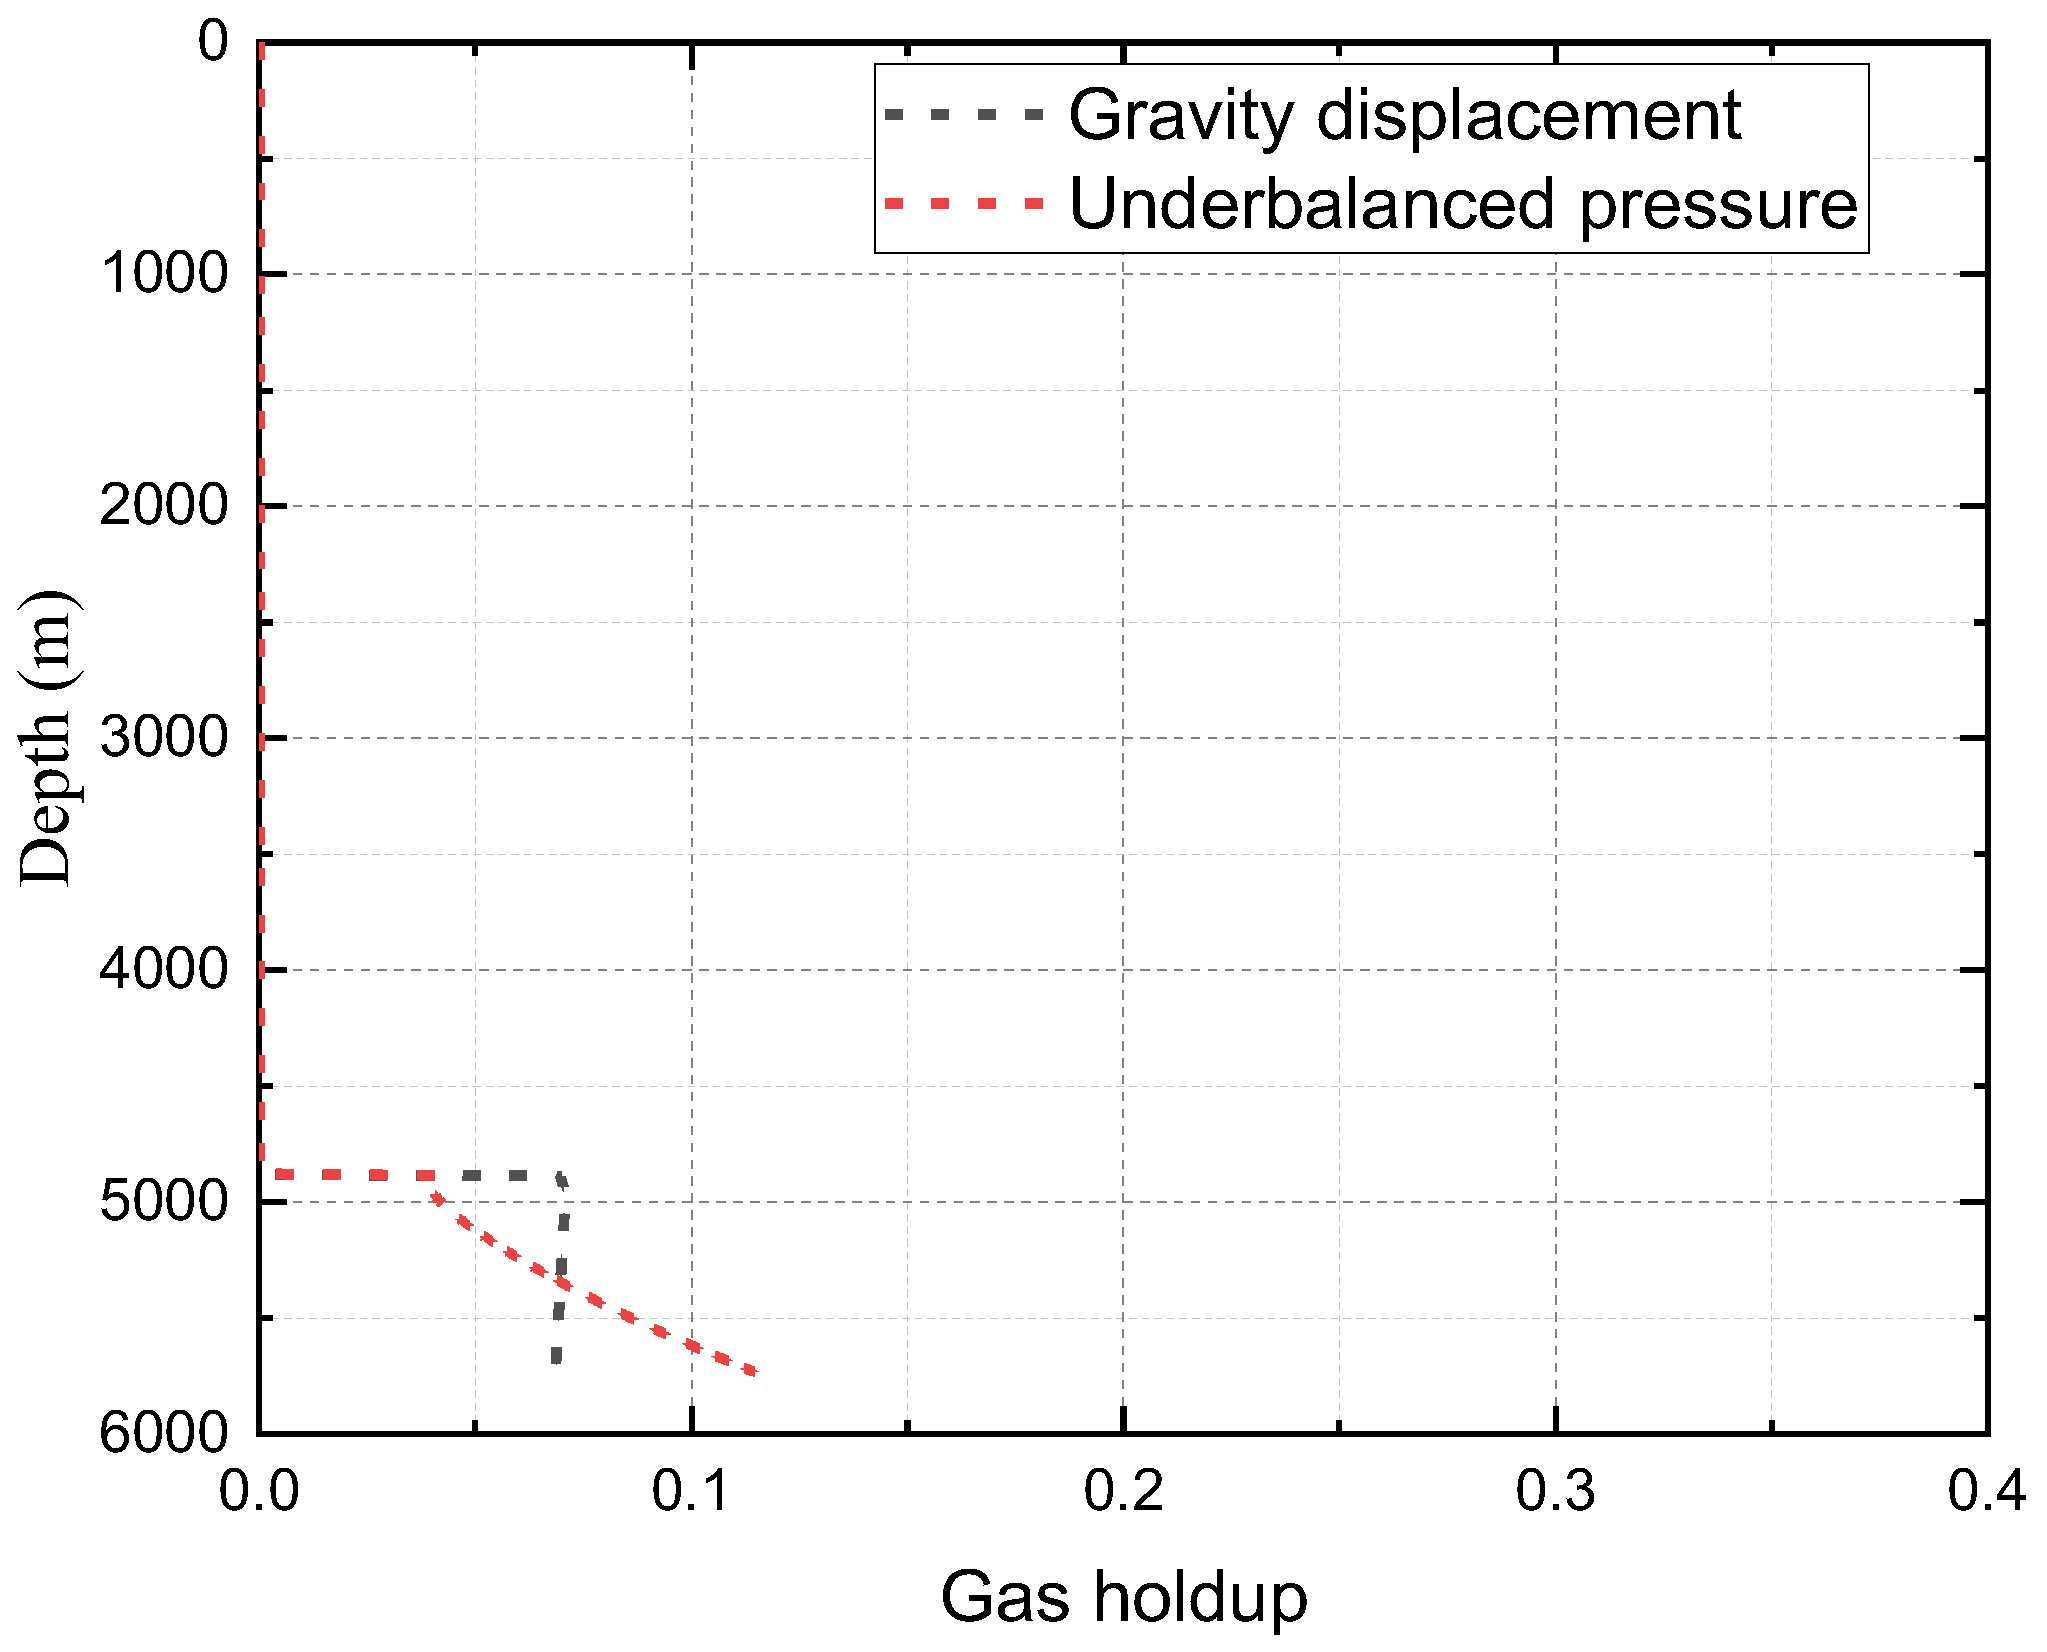
2.1.6. Characteristics Comparison of the Gas Kicks

The casing programs of well M in the Sichuan Basin and its current bottomhole assembly (BHA) for the open hole are shown in Table 1. The drilling fluid performance and the drilling parameters are shown in Table 2. In addition, the formation permeability is approximately 50 mD, the formation supply radius is approximately 167 m, the wellhead temperature is 20 °C, the geothermal gradient is 0.02 °C/m and the reservoir thickness is approximately 2 m.
The underbalanced pressure gas kick simulation is calculated at an initial negative differential pressure of 1.75 MPa (115 MPa for the formation pressure), and a bottomhole gas influx rate of 0.09 m3/min is used as the simulation condition for the gravity displacement gas kick. Then, the simulations were carried out using the above parameters, respectively. Figure 2 shows the distribution of the bottomhole gas influx rate for the duration of the gas kick. It can be observed that the gas influx rate of the underbalanced pressure gas kick increases with time, while it remains nearly constant for the gravity displacement gas kick.
Figure 3 illustrates the distribution of the wellbore annular gas holdup for the gravity displacement gas kick and the underbalanced pressure gas kick, when the total influx reaches 2 m3. At this moment, the top of the gas-liquid mixed-phase section rises to about 900 m from the bottomhole. The gas holdup distribution for the gravity displacement gas kick shows a slight increase in the gas holdup as the well depth decreases, which is due to the constant gas influx rate at the bottomhole, and the volume expansion caused by the decrease in the annulus pressure during the gas kick rises. In contrast, the distribution of the gas holding rate for the underbalanced pressure gas kick is the opposite of the former, showing that the gas holdup in the shallow part of the wellbore is lower than that in its deeper part. It is attributed to the increasing bottomhole gas influx rate for the underbalanced pressure gas kick, and the fact that the volume expansion effect of the gas, as it rises in the annulus, is much smaller than the increase in the bottomhole gas influx rate.
The changes in the bottomhole pressure during the underbalanced pressure gas kick and the gravity displacement gas kick are shown in Figure 4. From the beginning of gas kick to the overflow volume of 2 m3, the bottomhole pressure under both types of gas kicks decreases continuously with time, but the decreasing trend is different. As seen in Figure 5, there is a slightly decreasing trend in the absolute value of the change rate of the bottomhole pressure during the gravity displacement gas kick, while it keeps increasing for the underbalanced pressure gas kick.
Figure 6 illustrates the variation of the pit gain with time, during the underbalanced pressure gas kick and the gravity displacement gas kick, and their overflow volumes both reach 2 m3 at 1300 s. It can be seen that the pit gain under the gravity displacement gas kick is approximately a straight line with time, while it presents a curve with time, during the underbalanced pressure gas kick. The change rate of the pit gain with time is the increment of the wellhead outlet flow rate, as shown in Figure 7. The outlet flow rate under the gravity displacement gas kick increases abruptly at the beginning and increases slowly thereafter, while the outlet flow rate tends to increase continuously during the underbalanced pressure gas kick. Therefore, they can be determined, based on the outlet flow rate.

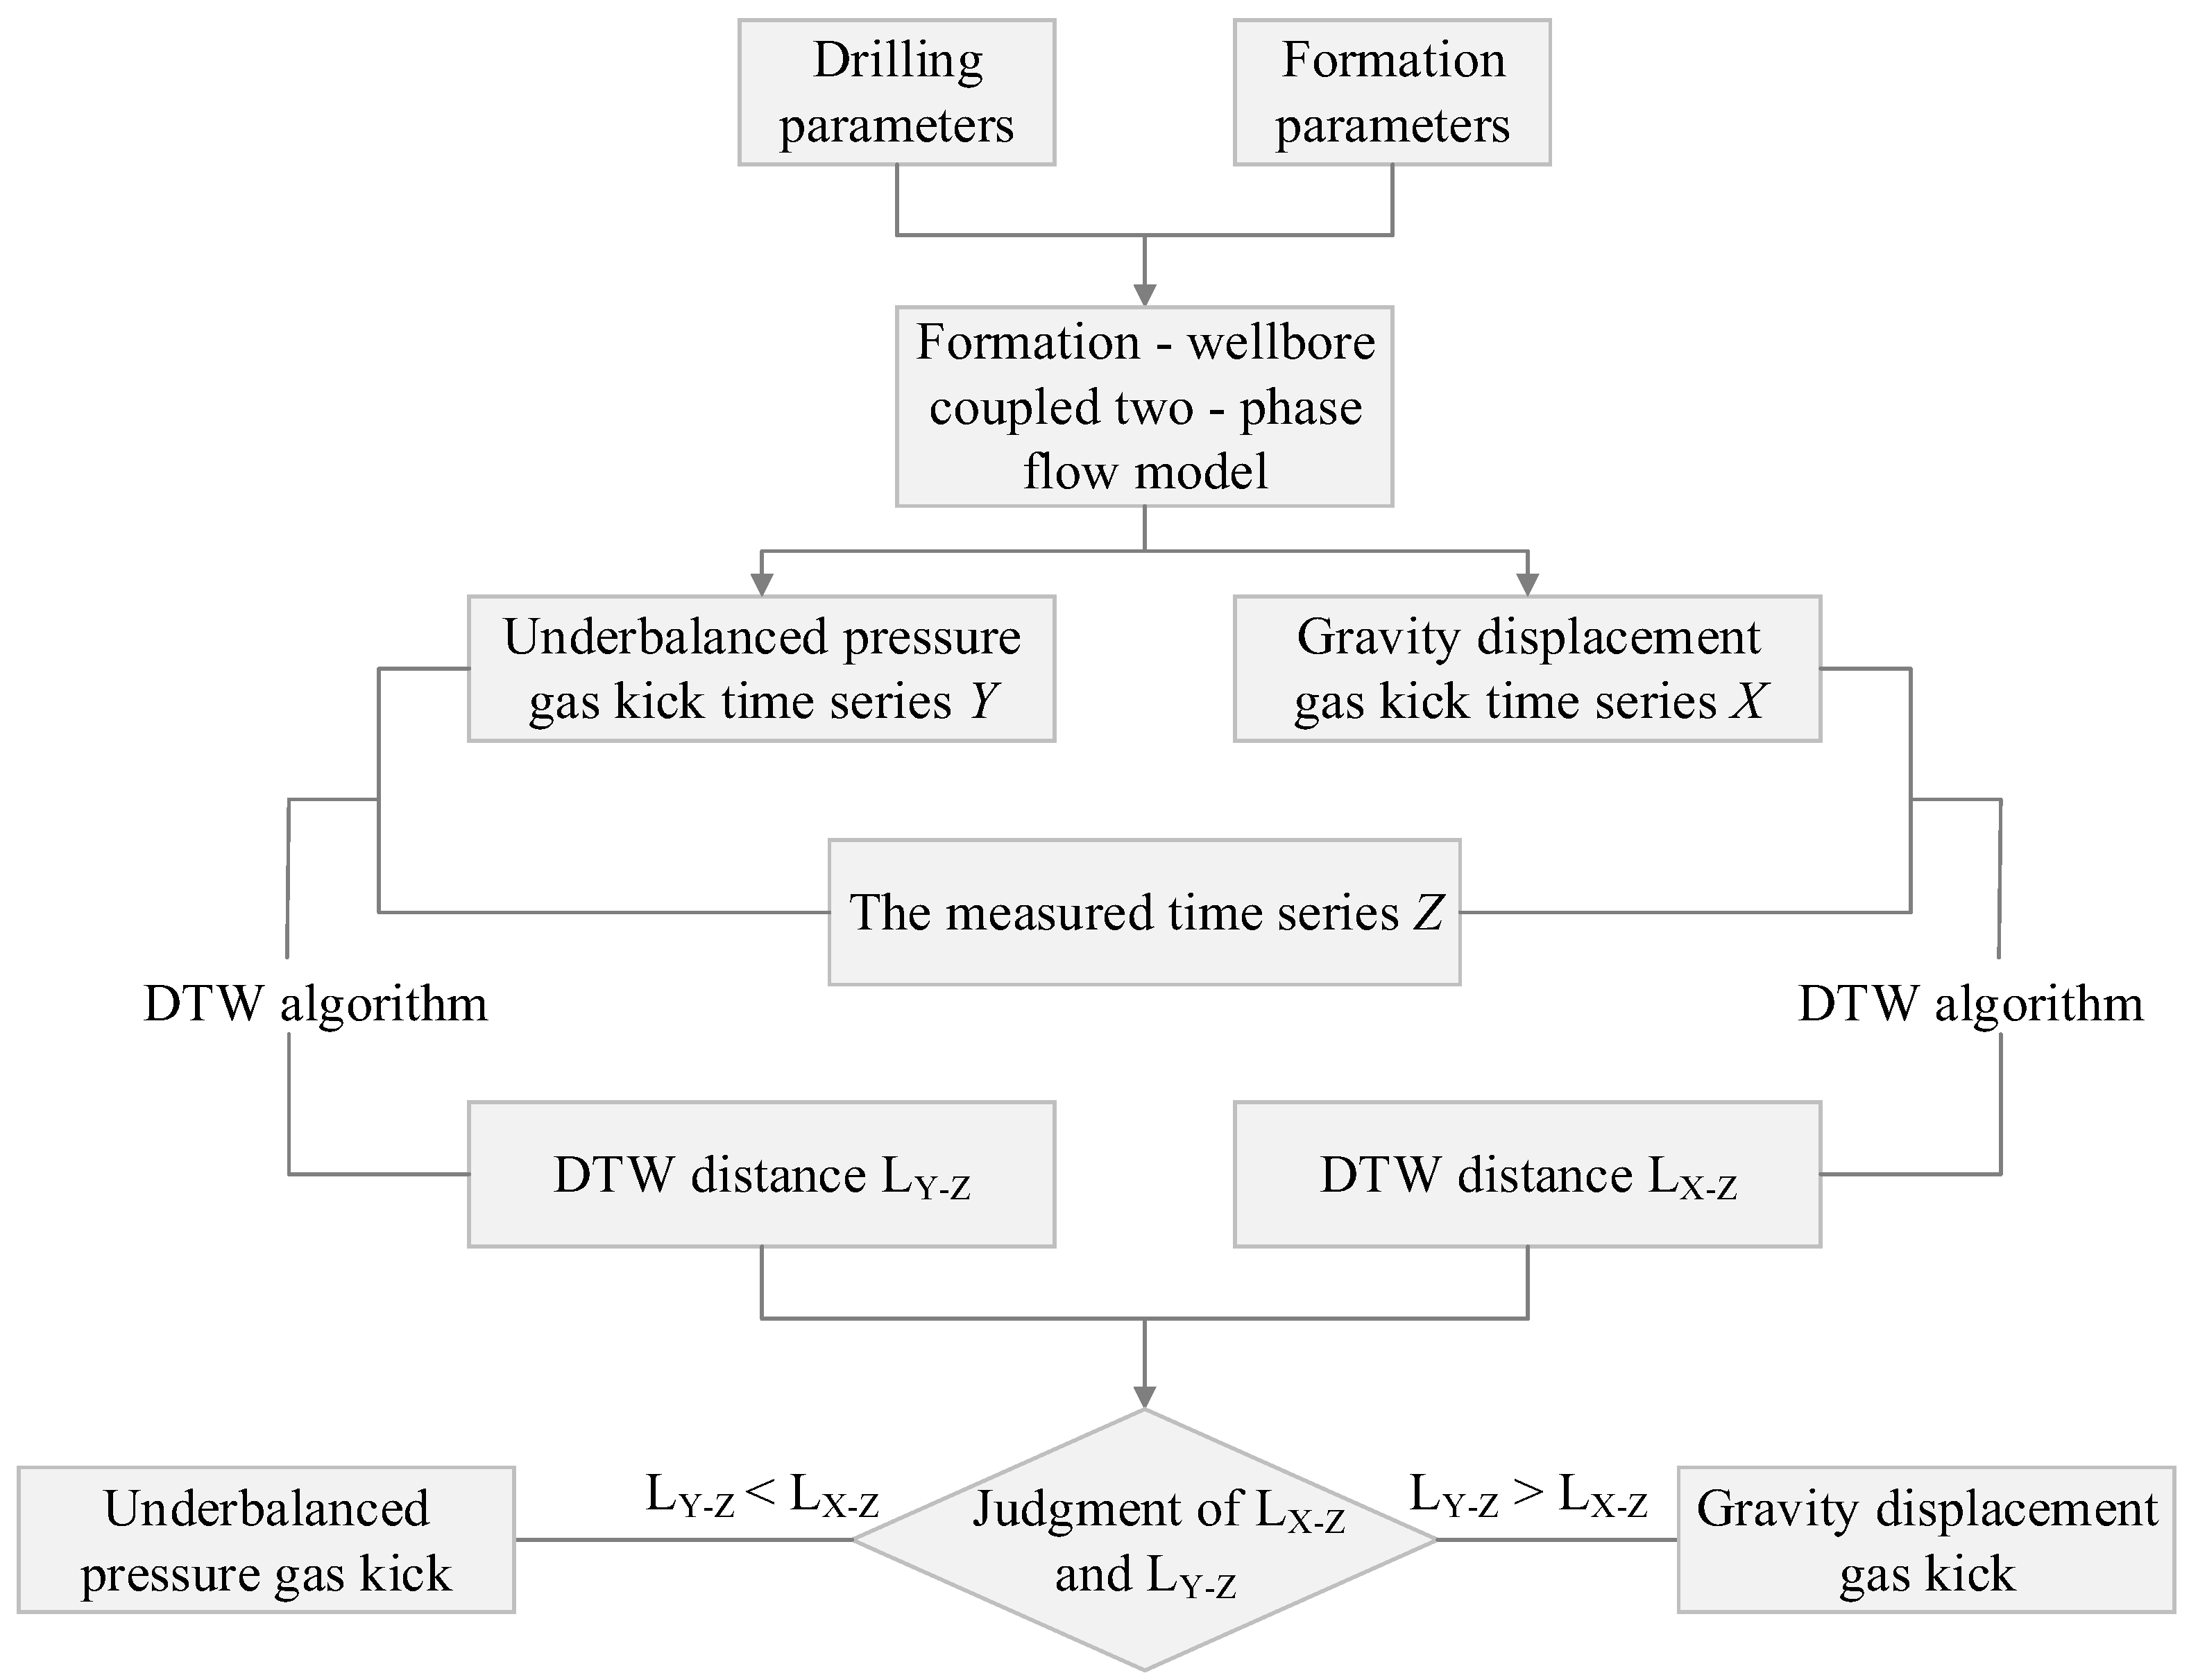
2.2. Data-Driven Modeling of the Gas Kick Type Identification

Dynamic time warping (DTW) is a classical similarity analysis and pattern recognition algorithm, which is widely used to solve pattern recognition problems in many fields. In this paper, a recognition model, based on DTW is established for the identification of the gas kick types.

2.2.1. DTW Algorithm

For the three time series, X = x 1 , x 2 , , x i , x k is the simulated outlet flow rate series of the gravity displacement gas kick, Y = y 1 , y 2 , , y i , y m is the simulated outlet flow rate series of the underbalanced pressure gas kick, Z = z 1 , z 2 , , z i , z n is the actual measured outlet flow rate series during drilling, and k, m and n are the lengths of the time series X, Y, and Z.
The DTW algorithm uses the dynamic programming principle (DPP) to nonlinearly match the similar features of time series X and Z, Y and Z. The shortest distances, LX-Z and LY-Z, between time series X and Z, Y and Z are obtained, and LX-Z and LY-Z are the similarity scales of time series X and Z, Y and Z. If the similarity scale LY-Z is smaller than LX-Z, it indicates that the matching degree of time series Y and Z is higher than the matching degree of X and Z. That is, the outlet flow curve measured and the outlet flow curve obtained from the underbalanced pressure gas kick simulation, are more similar. Therefore, the gas kick type can be identified as an underbalanced pressure gas kick, otherwise it is a gravity displacement gas kick.
The calculation process of the DTW algorithm consists of two parts: (1) calculating the distance between each element in time series X and Z, forming the distance matrix Dm×n (Equations (7) and (8)); (2) using dynamic programming, calculating the cumulative distance matrix Tm×n, based on the distance matrix Dm×n, and finding the optimal dynamic warping path in Tm×n, to obtain the dynamic warping distance between time series X and Z. The specific calculation steps are as follows [24].
D m × n = d x 1 , z 1 d x 1 , z j d x 1 , z n d x i , z 1 d x i , z j d x i , z n d x m , z 1 d x m , z j d x m , z n
d x i , z j = x i x j 2
where Dm×n is the distance matrix, consisting of the square of the Euclidean distance between the elements in time series X and Z.
To find the optimal dynamic warping path, it can be obtained by recursively solving any locally optimal solution in the distance matrix, from the starting point d x 1 , z 1 to the end point d x m , z n . Then, the dynamic programming is used to decompose the problem into similar subproblems and to solve the original problem by solving the subproblems, thereby. Using Equation (10) to calculate the local optimal cumulative distance t x i , z j , the cumulative distance matrix is gradually obtained (Equation (9)).
T m × n = t x 1 , z 1 t x 1 , z j t x 1 , z n t x i , z 1 t x i , z j t x i , z n t x m , z 1 t x m , z j t x m , z n
t x i , z j = d x 1 , z 1 i = 1 , j = 1 d x i , z j + min t x i 1 , z j , t x i 1 , z j 1 , t x i , z j 1 m i > 1 , n j > 1
where t x m , z n is the dynamic warping distance LX-Z of time series X and Z.

2.2.2. DTW Based Identification Process of the Gas Kick Type

For fractured reservoirs prone to overflow, the formation-wellbore coupled two-phase flow model is used to simulate and calculate the underbalanced pressure gas kick and gravity displacement gas kick, respectively. Then, the simulated time series of the outlet flow rate is obtained as the reference for judgment. The outlet flow sensor is used to measure the outlet flow rate in real time during the gas kick, and the measurements are converted into the time series to be judged. The DTW algorithm, described in the previous section, to calculate the DTW distance between the reference time series and the time series to be judged, was used to determine the type of gas kick. Figure 8 illustrates the flow of the gas kick type identification, based on DTW.

3. Results and Discussions
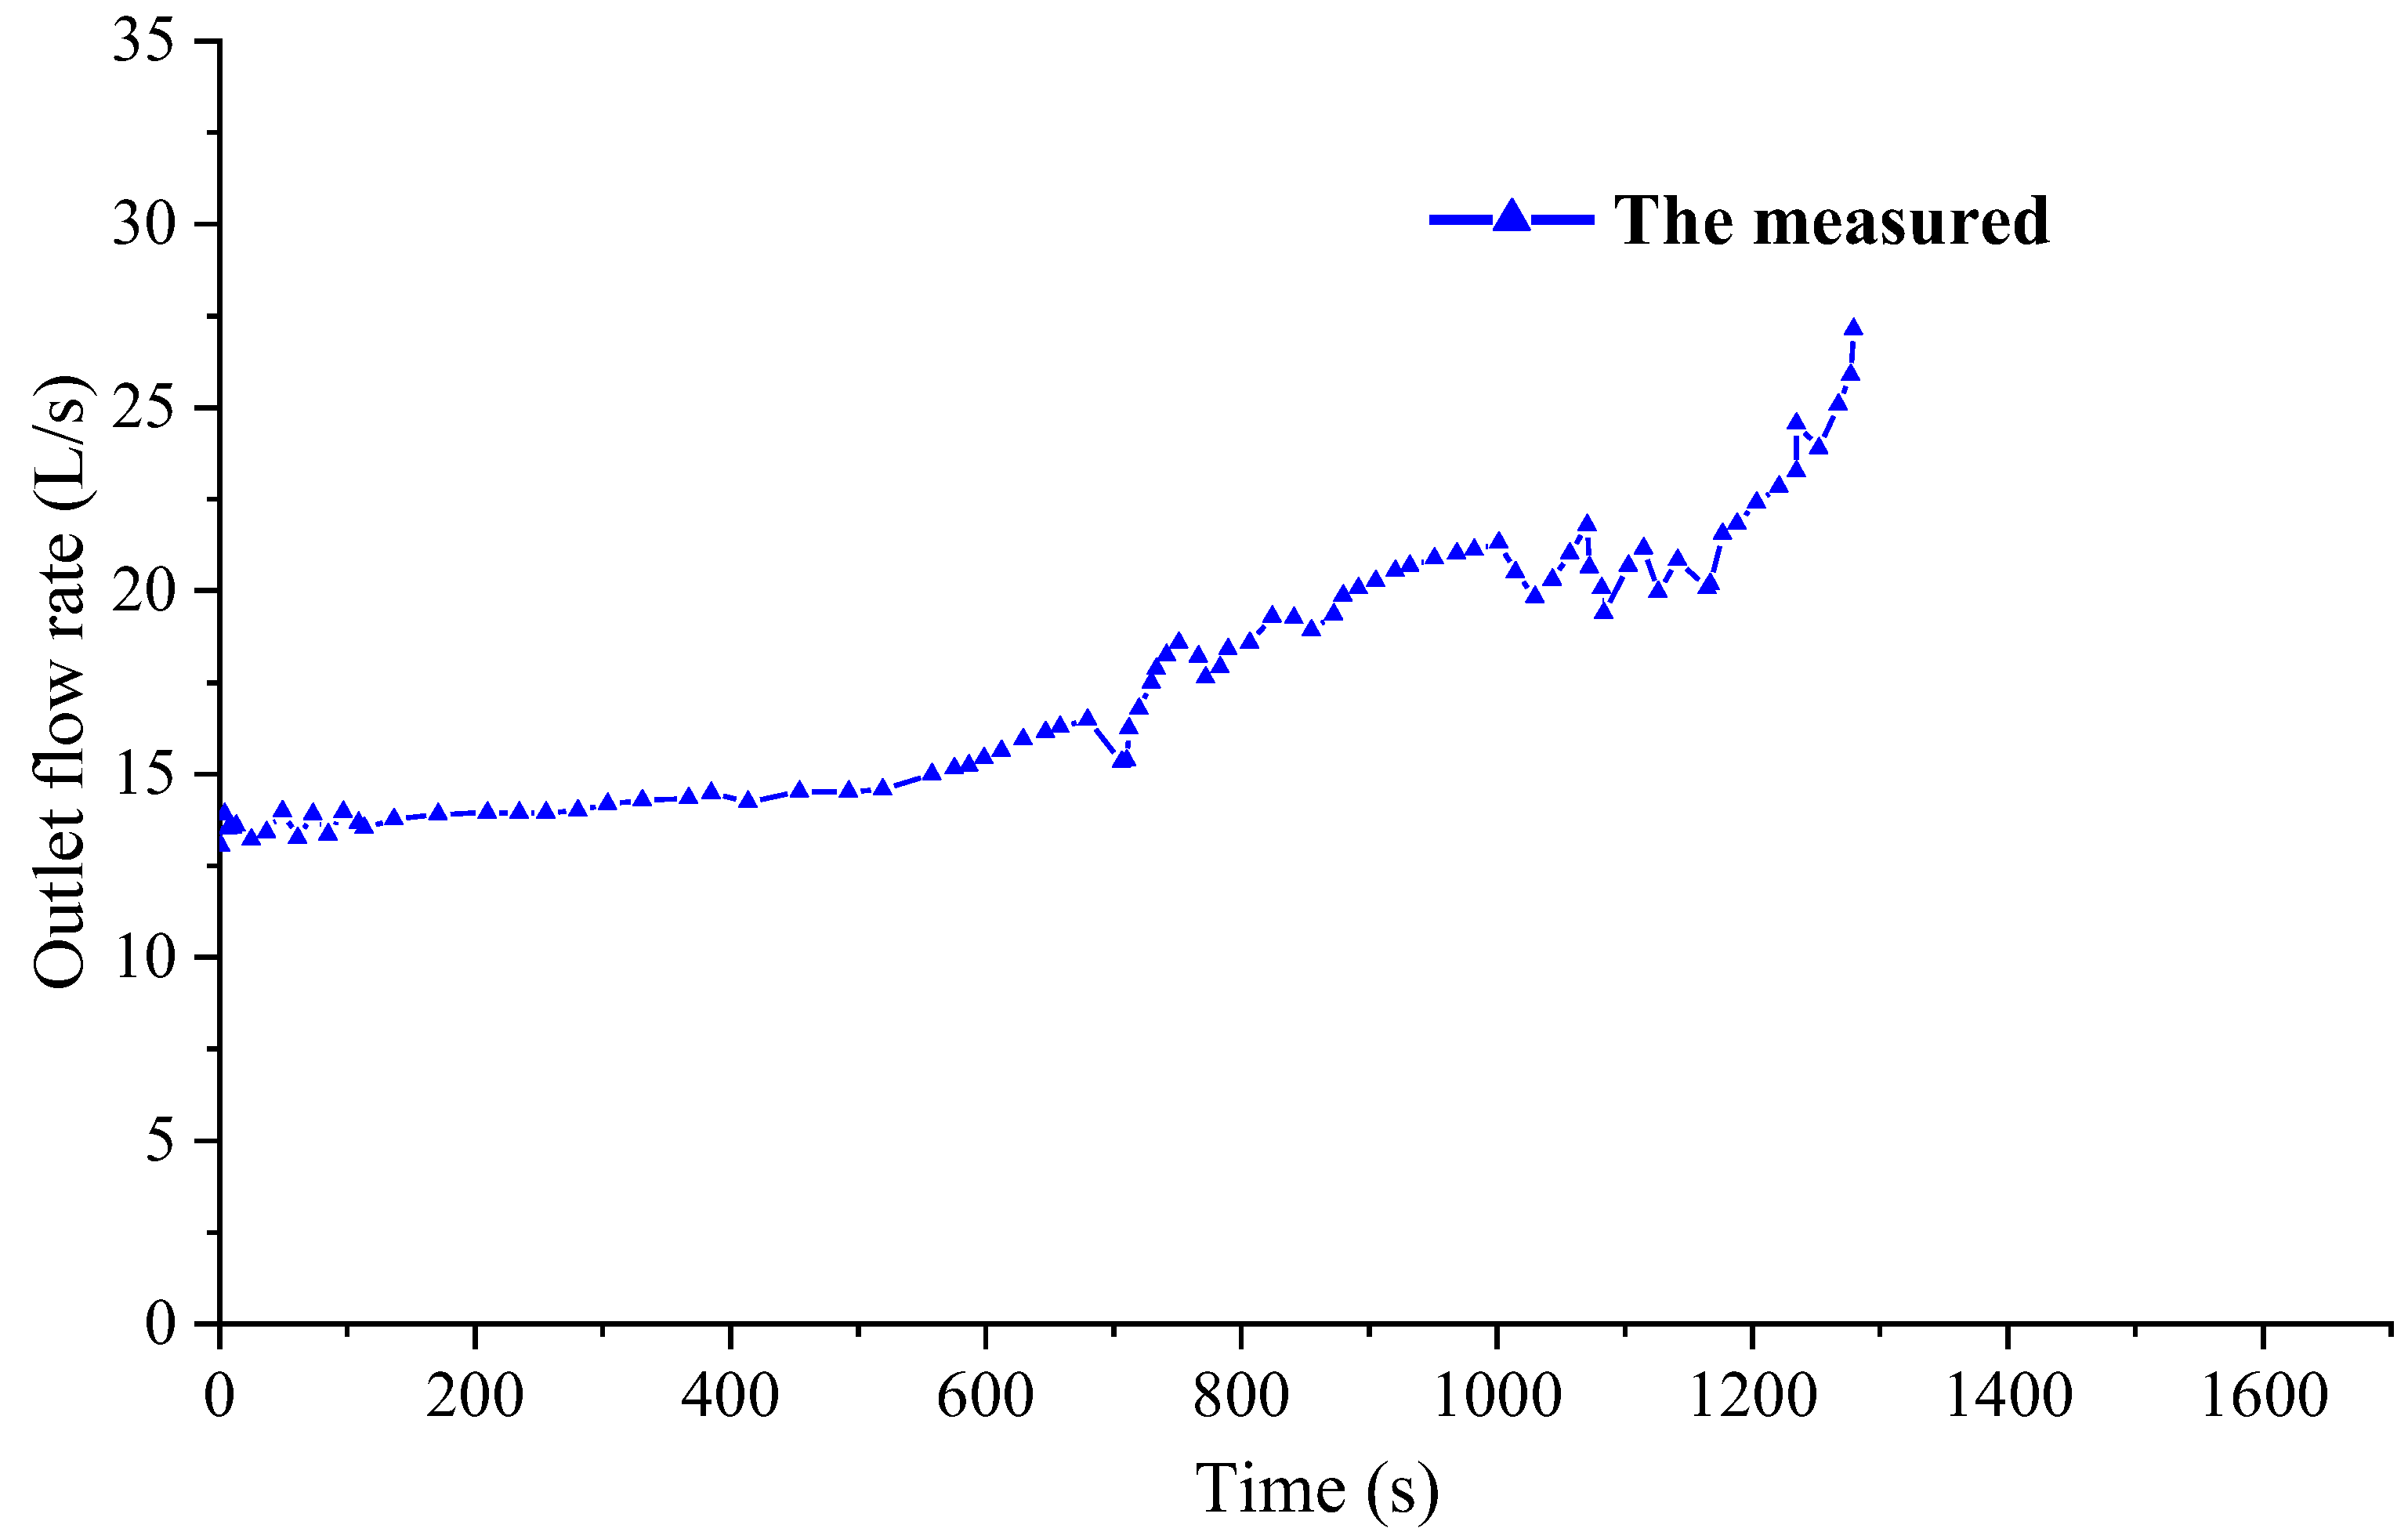
3.1. Results

The casing programs of well L in Tazhong, Xinjiang are shown in Table 3, the drilling fluid performance parameters are given in Table 4. The overflow occurred when drilling to about 6140 m, when the outlet flow rate was 13.5 L/s and the standpipe pressure was 18.7 MPa. Figure 9 shows the outlet flow data, measured in real time during the overflow, and the time series to be judged, composed of the measurements is C = c 1 , c 2 , , c k , , c l .
The parameters of well L were used for the formation-wellbore coupled two-phase flow simulations, to derive the outlet flow data during the underbalanced pressure gas kick and the gravity displacement gas kick, as shown in Figure 10. The data obtained from the simulation are composed into a time series as the judgment reference, where the reference time series of the underbalanced pressure gas kick is A = a 1 , a 2 , , a i , a m and the reference time series of the gravity displacement gas kick is B = b 1 , b 2 , , b j , b n . Figure 11 illustrates the time series of the judgment reference time series A and B and time series C, to be judged.
The DTW algorithm is used to calculate the DTW distance between time series C and time series A and B at different times, respectively.
(1)
The calculation period is 0 to 600 s
Table 5 displays the DTW distances between any two of the above three time series before 600s. As can be seen from Table 5, the DTW distance LA-C between time series A and C is 7.3, and the DTW distance LB-C between time series B and C is 7.53. Although the similarity between sequence C and sequence A is greater than that between sequence B and sequence C, the gap between them is small. In order to ensure accuracy, subsequent data changes need to be calculated.
(2)
The calculation period is 0 to 1000 s
Table 6 displays the DTW distances between any two of the above three time series. As can be seen from Table 5, the DTW distance LA-C between time series A and C is 7.68, and the DTW distance LB-C between time series B and C is 11.62. The similarity between sequence C and sequence A is greater than that between sequence B and sequence C. It can be preliminarily judged that the kick type is an underbalanced pressure gas kick. If the well is not shut in at this time, the corresponding dynamic time warping distance can be calculated later to improve the judgment accuracy.
(3)
The calculation period is 0 to 1300 s
Table 7 displays the DTW distances between any two of the above three time series. As can be seen from Table 7, the DTW distance LA-C between time series A and C is 8.25, and the DTW distance LB-C between time series B and C is 20.66. There is a higher similarity between the measured time series C and the time series of the simulated underbalanced pressure gas kick. Therefore, the type of gas kick is judged to be the underbalanced pressure gas kick, and the results are consistent with the actual drilling conditions.

3.2. Discussions

(1)
Comparison with the current method
At present, the type of gas kick can be judged by changing the wellhead back pressure, during managed pressure drilling. As the underbalanced gas kick is mainly affected by the bottomhole pressure, and the bottomhole pressure has little effect on the gravity displacement gas kick. By increasing the wellhead back pressure, after the bottomhole pressure state changes from underbalanced to overbalanced, the underbalanced gas kick will no longer occur, and the outlet flow will gradually decrease, while the gravity displacement gas kick will maintain the original intrusion rate, the outlet flow will continue to increase. In [12], the wellhead back pressure increased by 3.4MPa at 1300s after the kick was detected on the ground. It was observed that the outlet flow was equal to the inlet flow after a lag time of about 7 h, and judged as an underbalanced gas kick.
Compared with the existing methods, the method proposed in this paper does not need to wait for a lag time, and there is no need to adjust the wellhead backpressure, and the fine outlet flow measurement is not required, which is not only suitable for managed pressure drilling but also for conventional drilling.
(2)
DTW Computational Feature Analysis
From the calculation results in Table 5, Table 6 and Table 7, it can be seen that, according to the increase of time series data, the judgment effect is better. Note that Table 5, Table 6 and Table 7 reveal the characteristics of DTW, where the DTW distance between the same time series is 0, indicating that the same time series is perfectly similar. The maximum DTW distance between time series A and B indicates the least similarity between the outlet flow rate of the underbalanced pressure gas kick and the gravity displacement gas kick. Meanwhile, it indirectly demonstrates that there is a difference in the presentation between an underbalanced pressure gas kick and a gravity displacement gas kick, and they can be identified using DTW algorithms.

4. Conclusions

(1)
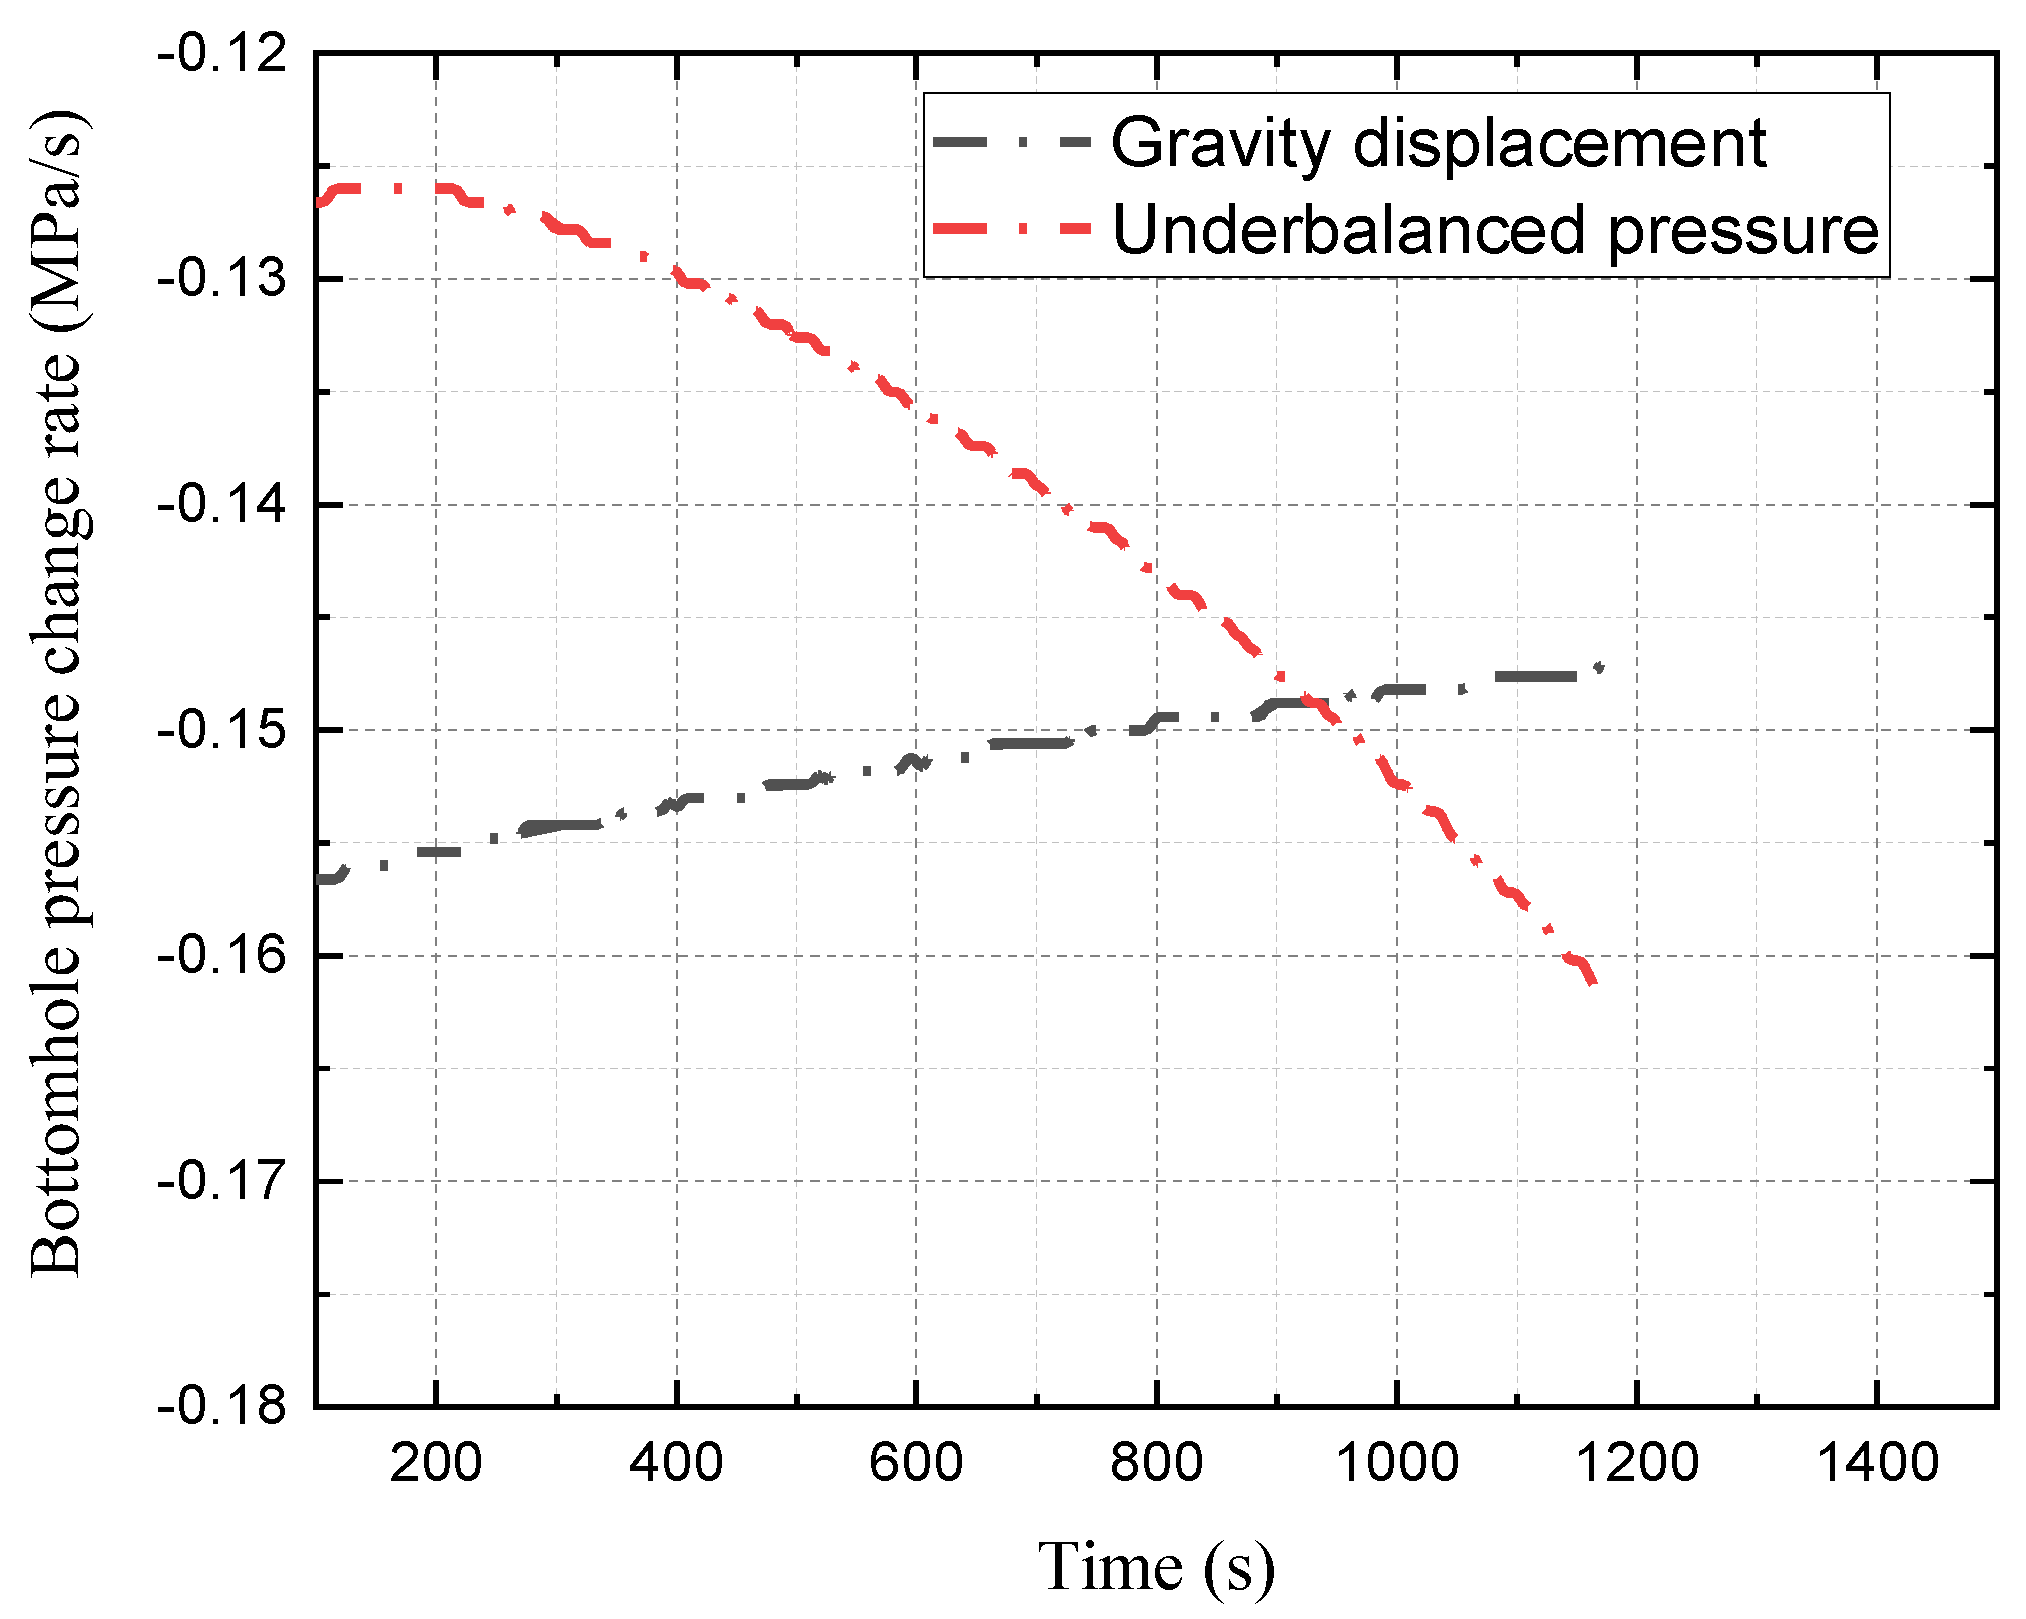
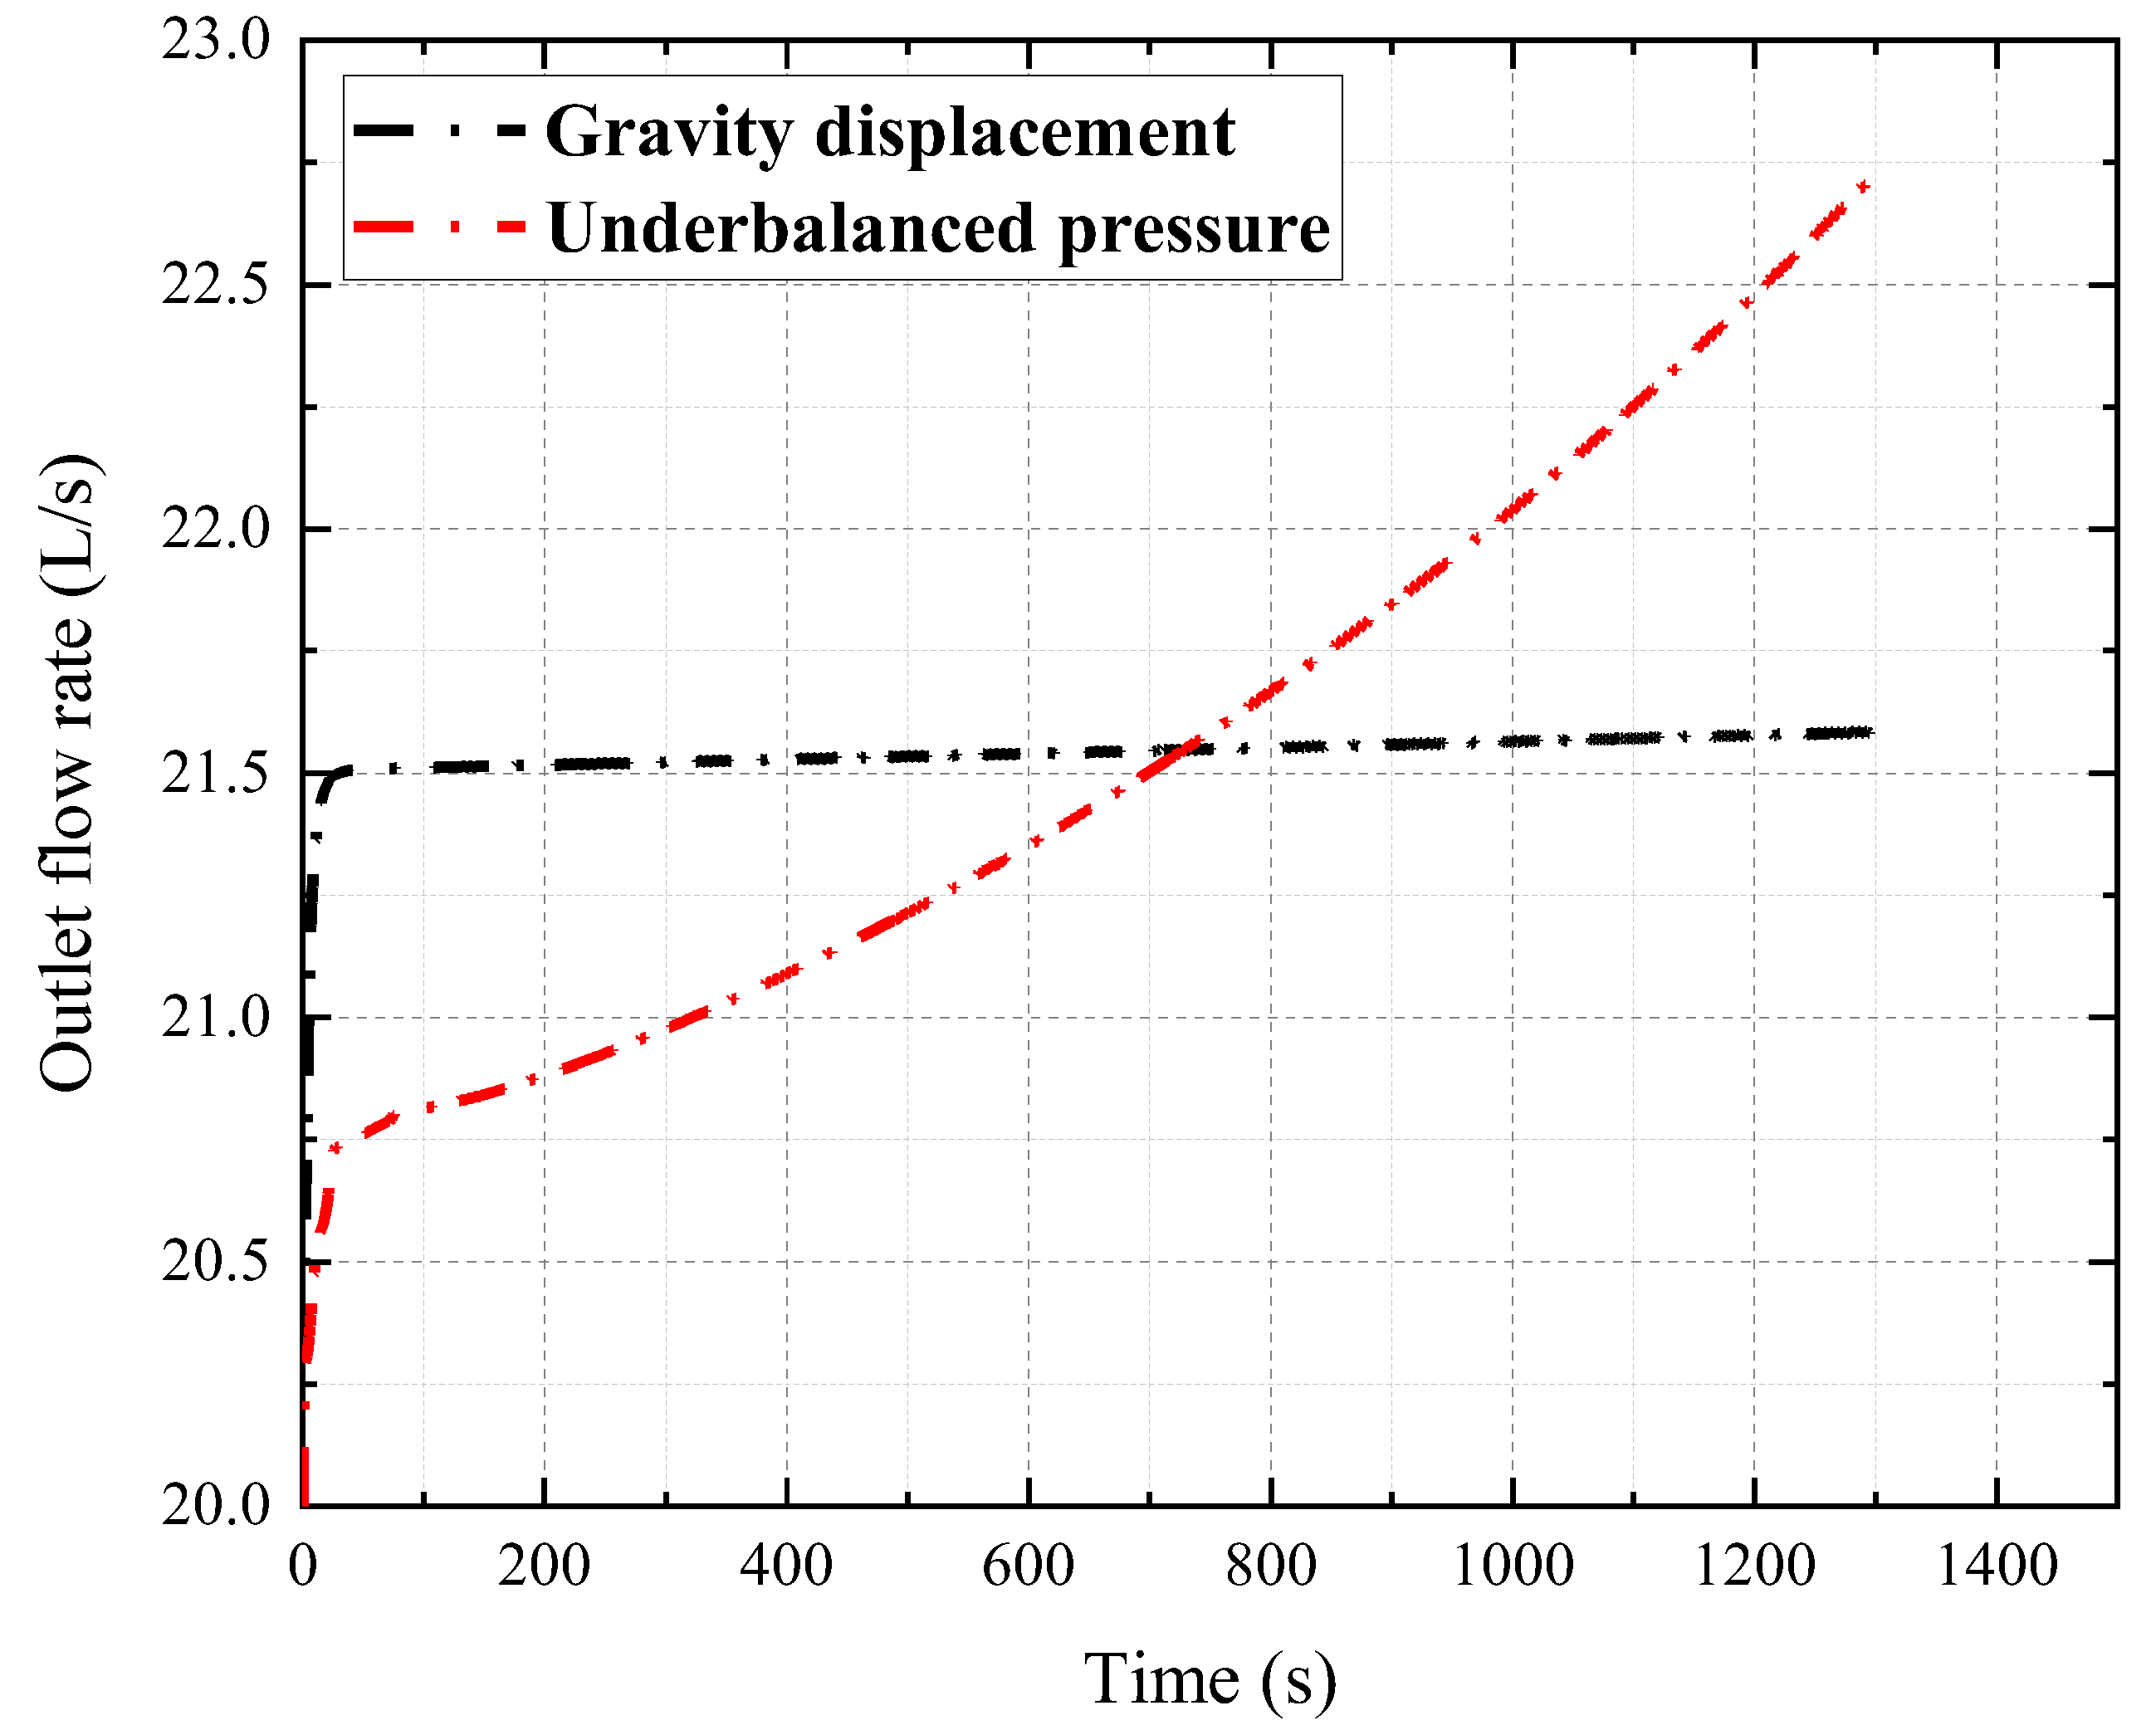
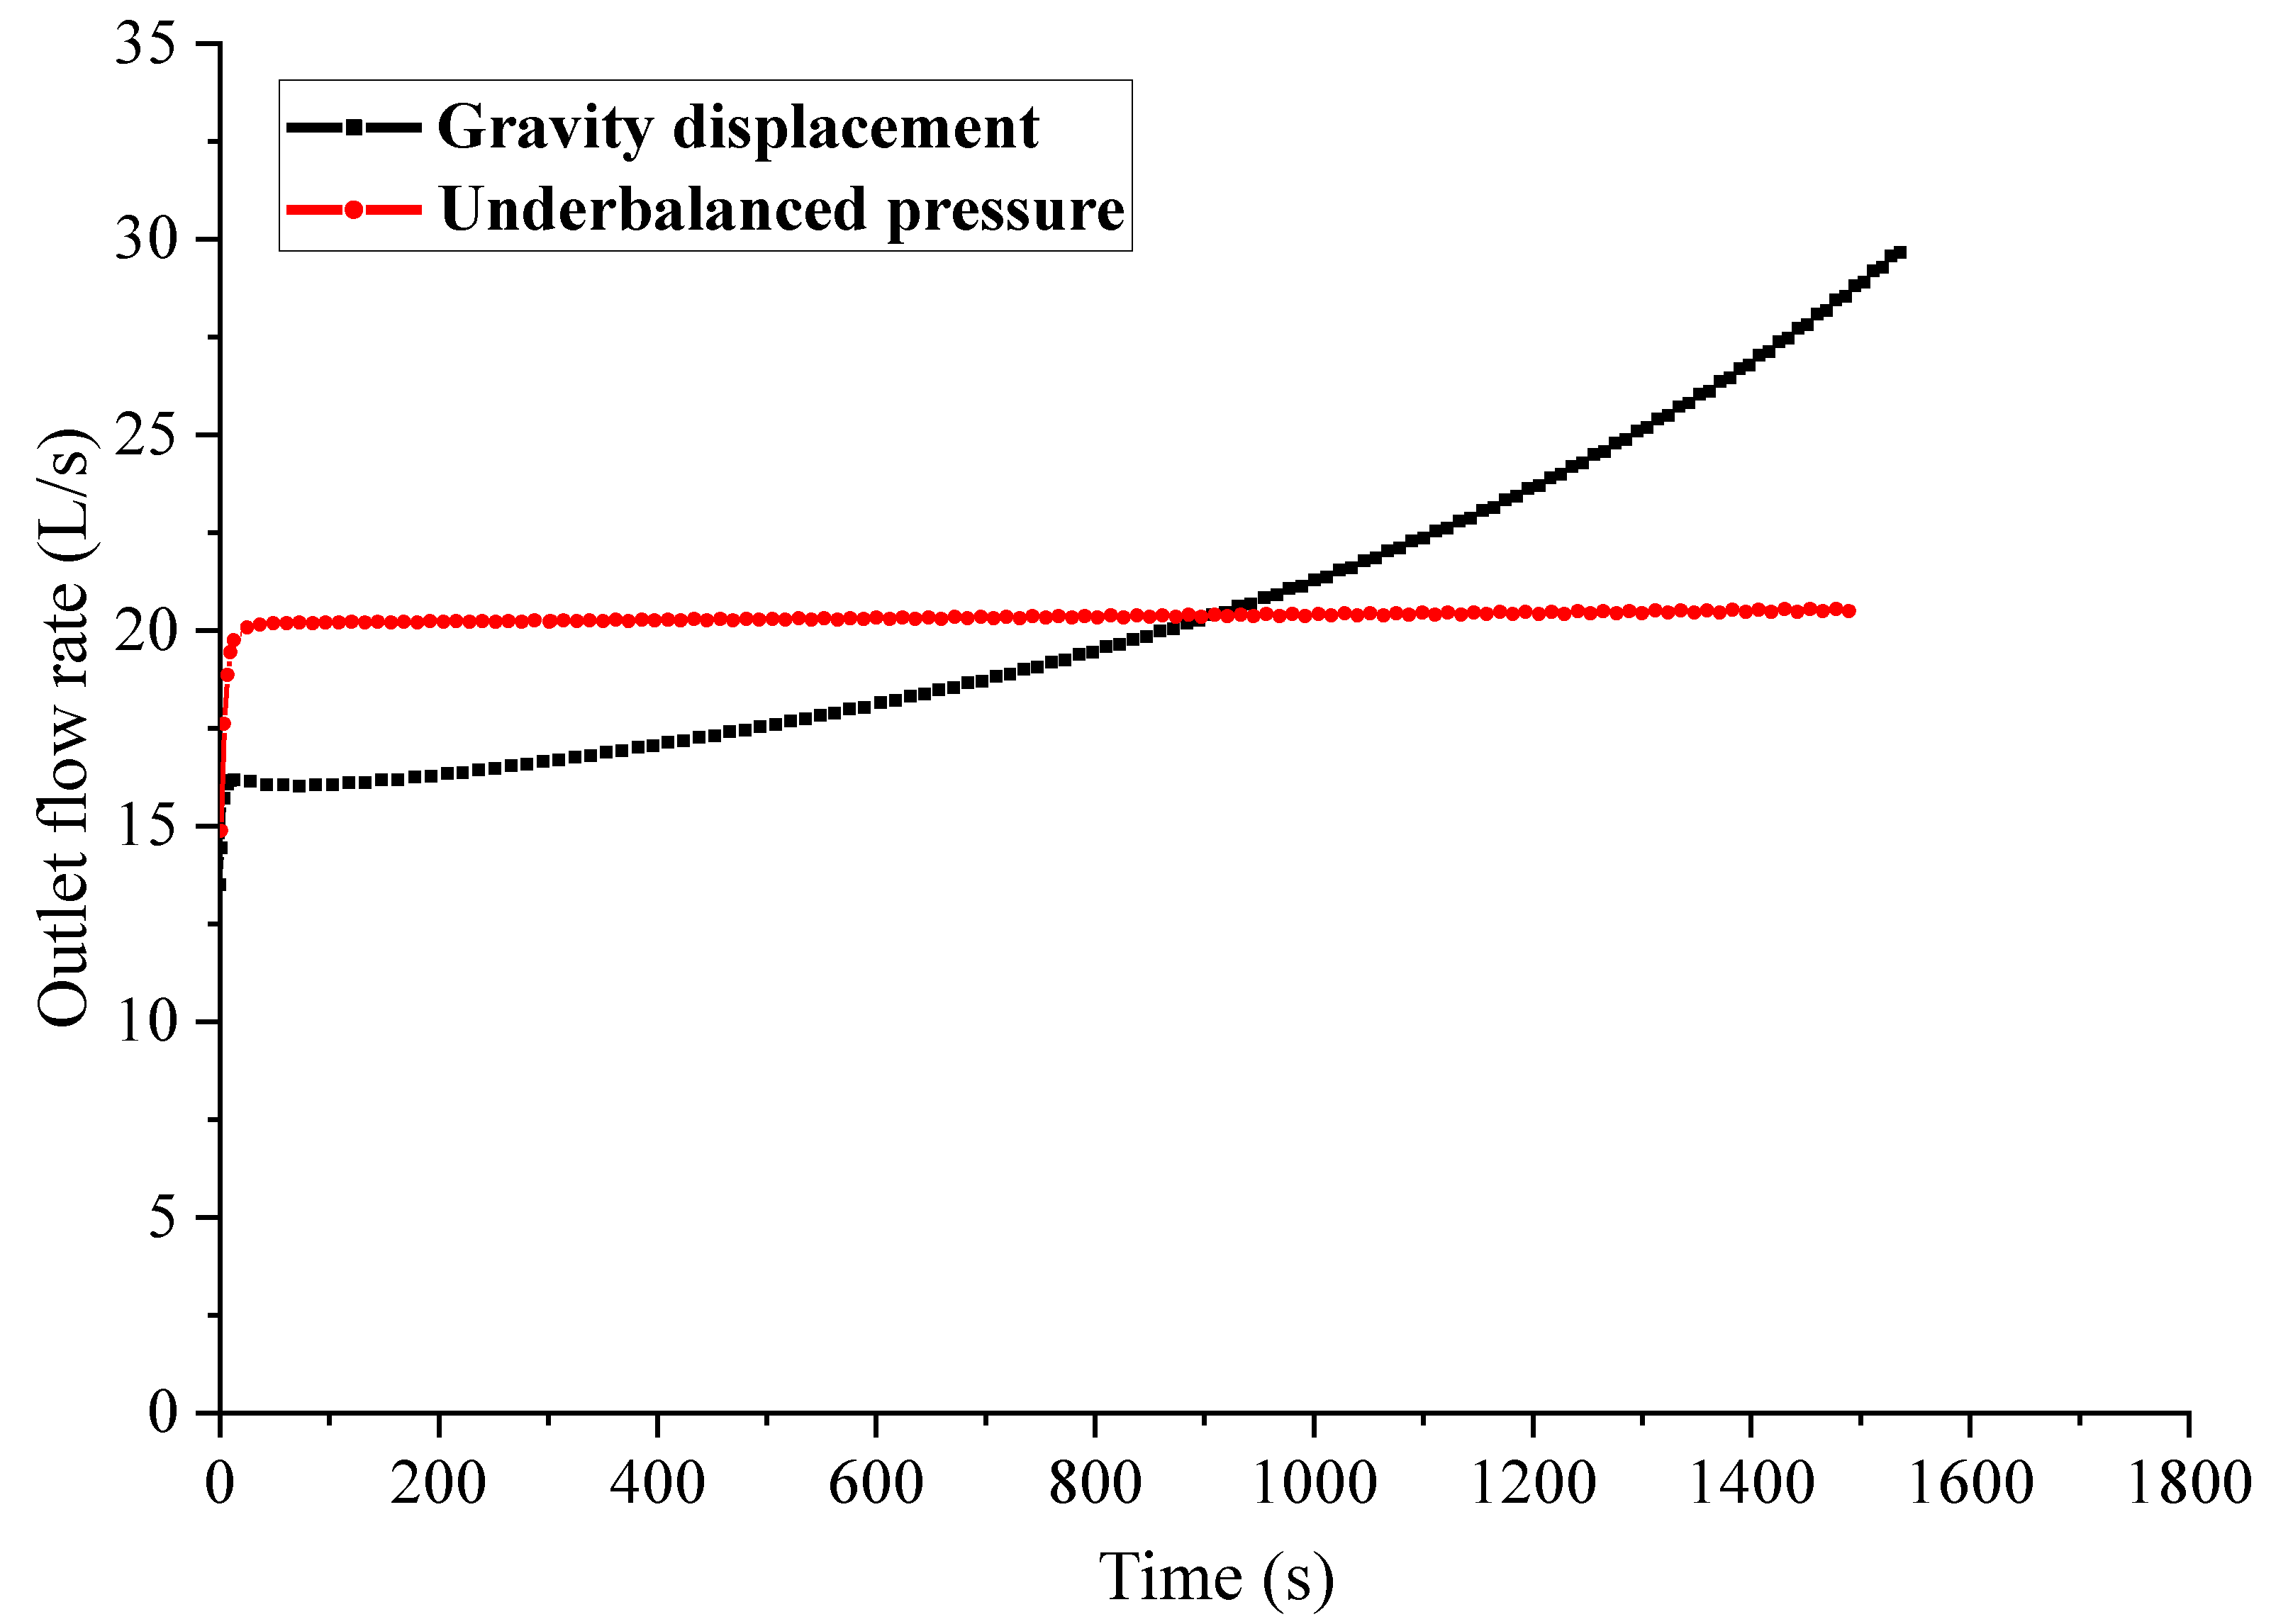
Based on the transient two-phase drift flow model with wellbore-formation coupling, the changes of the bottomhole pressure, gas holdup distribution and wellhead flow parameters during an underbalanced pressure gas kick and gravity displacement gas kick, are simulated and analyzed. Although both exhibit an increase in pit gain and a decrease in bottomhole pressure, there is a difference in the rate of change in the bottomhole pressure and pit gain.
(2)
The DTW algorithm is used to calculate the DTW distance between the measured outlet flow curve and the simulated curve, and the degree of similarity between them can be obtained. Then, the similarity between the curves is used to identify the type of gas kick. By using the feature, is it understood that the underbalanced pressure gas kick and gravity displacement gas kick present different characteristics on the outlet flow curve. With the increase of time series data, the judgment effect is better.
(3)
The method proposed in this paper can greatly reduce the identification time, and the dependence on drilling equipment is not high, which is not only suitable for managed pressure drilling but also for conventional drilling.
(4)
Using the dual drive of knowledge and data, can effectively improve the efficiency of the model identification. Field example simulations show that this method can identify the type of gas kick, based on real-time surface measurement parameters and provide a basis for taking targeted well control measures.

Author Contributions

Conceptualization, H.Y. and Q.L.; methodology, M.S.; software, M.S.; validation, M.S., H.Y. and H.C.; formal analysis, M.S.; investigation, W.L.; resources, W.L.; data curation, H.C.; writing—original draft preparation, H.Y.; writing—review and editing, H.Y.; visualization, M.S.; supervision, Q.L.; project administration, Q.L.; funding acquisition, Q.L. All authors have read and agreed to the published version of the manuscript.

Funding

This work was supported by the China National Key Research and Development Project (2019YFA0708302).

Institutional Review Board Statement

Not applicable.

Informed Consent Statement

Not applicable.

Data Availability Statement

Not applicable.

Conflicts of Interest

The authors declare no conflict of interest.

References

  1. Lin, S.; Yang, X.; Zhou, Y.; Li, H.; Wang, Y. Application of China-made precise managed pressure drilling equipment in the Tarim Basin. Nat. Gas Ind. 2012, 8, 6–10. [Google Scholar]
  2. Zhou, Y.; Liu, W. New progress on PCDS precise pressure management drilling technology. Pet. Drill. Tech. 2019, 47, 68–74. [Google Scholar]
  3. Shu, G.; Meng, Y.; Li, G.; Wei, N.; Zhao, X.; Yang, M. Mechanism of Mud Loss and Well Kick due to Gravity Displacement. Pet. Drill. Tech. 2011, 39, 6–11. [Google Scholar]
  4. Li, J.; Liu, G.; Zhou, L.; Tang, G.; Xu, Z.; Wang, T.; Kong, W. Gas-liquid gravity displacement experiment of fractured carbonate formation. Acta Pet. Sin. 2018, 39, 1186–1192. [Google Scholar]
  5. Dai, C.; Li, G.; Xiao, D.; Li, Y.; Lin, T.; Li, Z. Experiment and simulation of gravity displacement flow in fracture. Chin. J. Appl. Mech. 2020, 37, 195–199. [Google Scholar]
  6. Yang, S. Development and Application of Lab Simulation Devices for Visualized Gravity Displacement. China Pet. Mach. 2015, 43, 96–99. [Google Scholar]
  7. Tang, W.; Wang, C.; Jin, J.; Yang, F.; Xue, Y.; Chen, X.; Li, T.; Song, Z. Experimental Research on Dynamic Replacement of Asphalt and Drilling Fluid in Drilling Engineering. Sci. Technol. Eng. 2016, 16, 20–25. [Google Scholar]
  8. Zhao, X.; Meng, Y.; Hou, X.; Yang, S.; Bao, H.; Li, G. Pattern and control of gravity displacement between asphaltic heavy oil and drilling fluid. Oil Drill. Prod. Technol. 2016, 38, 622–627. [Google Scholar]
  9. Lu, B.; Zhao, X.; Xiao, D. Experimental study on gravity displacement mechanism of asphalt-drilling fluid on dimensional analysis. Drill. Prod. Technol. 2019, 42, 90–93. [Google Scholar]
  10. Xiao, D.; Meng, Y.; Zhao, X.; Li, G.; Xu, J. Liquid–liquid gravity displacement in a vertical fracture during drilling: Experimental study and mathematical model. Energy Explor. Exploit. 2020, 38, 533–554. [Google Scholar] [CrossRef]
  11. Zhang, X.; Zhou, Y.; Liu, W.; Guo, Q.; Cui, T. Characters of gravity replacement gas kick in carbonate formation. Acta Pet. Sin. 2014, 35, 958–962. [Google Scholar]
  12. Zhang, X.; Zhou, Y.; Liu, W. A method for characterization and identification of gas kicks caused by underbalanced pressure and gravity displacement. J. China Univ. Pet. 2015, 39, 95–102. [Google Scholar]
  13. Kong, X.; Lin, Y.; Qiu, Y. Research of mechanism for the gas invasion and gravity replacement in drilling operations. Chin. J. Appl. Mech. 2015, 32, 317–322. [Google Scholar]
  14. Xia, A.; Sun, B. Determination of the Type of Kick and Formation Information Based on Gas Kick Response Parameters. In Proceedings of the 2019 International Petroleum and Petrochemical Technology Conference, Beijing, China, 27–29 March 2019. [Google Scholar]
  15. Sakoe, H.; Chiba, S. Dynamic programming algorithm optimization for spoken word recognition. IEEE Trans. Acoust. Speech Signal Processing 1978, 26, 43–49. [Google Scholar] [CrossRef] [Green Version]
  16. Juang, B.H. On the hidden Markov model and dynamic time warping for speech recognition—A unified view. Bell Labs Tech. J. 1984, 63, 1213–1243. [Google Scholar] [CrossRef]
  17. Reyes, M.; Domínguez, G.; Escalera, S. Featureweighting in dynamic timewarping for gesture recognition in depth data. In Proceedings of the IEEE International Conference on Computer Vision, Barcelona, Spain, 6–13 November 2011. [Google Scholar]
  18. Han, T.; Liu, X.; Tan, A. Fault diagnosis of rolling element bearings based on Multiscale Dynamic Time Warping. Measurement 2017, 95, 355–366. [Google Scholar] [CrossRef]
  19. Jun, B.H. Fault detection using dynamic time warping (DTW) algorithm and discriminant analysis for swine wastewater treatment. J. Hazard. Mater. 2011, 185, 262–268. [Google Scholar] [CrossRef]
  20. Forestier, G.; Lalys, F.; Riffaud, L.; Trelhu, B.; Jannin, P. Classification of surgical processes using dynamic time warping. J. Biomed. Inform. 2012, 45, 255–264. [Google Scholar] [CrossRef]
  21. Aach, J.; Church, G.M. Aligning gene expression time series with time warping algorithms. Bioinformatics 2001, 17, 495–508. [Google Scholar] [CrossRef] [Green Version]
  22. Wu, X.; Li, Q.; Yin, H.; Li, Z.; Jiang, J.; Si, M.; Zhang, Y. Real-Time Intelligent Recognition Method for Horizontal Well Marker Bed. Math. Probl. Eng. 2020, 1, 8583943. [Google Scholar] [CrossRef]
  23. Sun, B. Multiphase Flow in Oil and Gas Well Drilling; John Wiley & Sons: New York, NY, USA, 2016; pp. 75–90. [Google Scholar]
  24. Ding, S.; Zhang, Q.; Zhang, L.; Sun, L. Study on Classification of Ground Vehicles Based on Dynamic Time Warping. Fire Control. Command. Control. 2016, 41, 15–20. [Google Scholar]
Figure 1. Schematic diagram of the wellbore multiphase flow and control body section.
Applsci 12 10912 g001
Figure 2. Comparison of the gas influx rate for well M.
Applsci 12 10912 g002
Figure 3. Distribution of the wellbore annular gas holdup for well M.
Applsci 12 10912 g003
Figure 4. Comparison of the changes in the bottomhole pressure for well M.
Applsci 12 10912 g004
Figure 5. The change rate of the bottomhole pressure for well M.
Applsci 12 10912 g005
Figure 6. Comparison of the variation of the pit gain for well M.
Applsci 12 10912 g006
Figure 7. Comparison of the outlet flow rate for well M.
Applsci 12 10912 g007
Figure 8. Flow of the gas kick type identification, based on DTW.
Applsci 12 10912 g008
Figure 9. Outlet flow rate measured in real time during the overflow for well L.
Applsci 12 10912 g009
Figure 10. The simulated outlet flow time series for well L.
Applsci 12 10912 g010
Figure 11. Identification of the gas kick type for well L.
Applsci 12 10912 g011
Table 1. Casing programs and the bottomhole assembly for well M.
SectionDepth (m)Bit Size (mm)Casing Size (mm)
The 1st section350660.4508
The 2nd section2200444.5365.13
The 3rd section4616333.38273.05
The 4th section
(open hole)
5740241.3
BHA: 127 mm Drill pipe + 165.1 mm Drill collar + Non-magnetic Drill collar + Stabilizer + 203.2 mm Drill Collar + 241.3 mm PDC bit
Table 2. Drilling fluid performance and drilling parameters for well M.
Mud Weight (g/cm3)φ3φ100φ300φ600Flow Rate (L/s)
1.953276110120
Table 3. Casing programs of well L.
SectionDepth (m)Bit Size (mm)Casing Size (mm)
The 1st section1500406.4273.05
The 2nd section4953241.3200.3
The 3rd section (open hole)6139.86168.3
Table 4. Drilling fluid performance for well L.
Mud Weight (g/cm3)ϕ300ϕ600Viscosity (mPa∙s)
1.1243811
Table 5. Dynamic time warping distance calculation results (calculation period [0, 600]).
Time SeriesThe Measured CThe Simulated AThe Simulated B
The measured C07.37.53
The simulated A7.3010.32
The simulated B7.5310.320
Table 6. Dynamic time warping distance calculation results (calculation period [0, 1000]).
Time SeriesThe Measured CThe Simulated AThe Simulated B
The measured C07.6811.62
The simulated A7.68042.5
The simulated B11.6242.50
Table 7. Dynamic time warping distance calculation results (calculation period [0, 1300]).
Time SeriesThe Measured CThe Simulated AThe Simulated B
The measured C08.2520.66
The simulated A8.25088.1
The simulated B20.6688.10
Publisher’s Note: MDPI stays neutral with regard to jurisdictional claims in published maps and institutional affiliations.

