Abstract
The aim of this study was to analyse the effect of an individual training programme based on the tensiomyography results in the contractile properties of the knee flexor muscle with football players. Thirty-four subjects were recruited and assigned to an experimental (EG) or control group (CG). The contraction time and the muscle displacement measured by tensiomyography were assessed on two occasions: pre-time (middle of the competitive season, January) and post-time 8 weeks later. The training programme aimed to improve muscle tone and explosiveness according to the individual needs of each player. There was a significant interaction between time (assessment points) × group (EG vs. CG) × muscle in multivariate analysis. The findings confirmed that mechanical and neuromuscular characteristics changed over time and varied with the individual training programme (EG vs. CG) and the muscle being analysed. The 90° change of direction worsens the execution time in the control group and is maintained in the experimental group. The individual training programme, based on the tensiomyography results, showed improvements in the contractile properties in the muscles. Football coaches could use the programme to improve neuromuscular characteristics that improve performance and reduce the risk of muscle injury.
1. Introduction
Football is a multifaceted team sport that requires well-developed speed, agility, balance and power to be played at an elite level [1]. In addition to possessing high levels of physical fitness, knowledge about the game and a good decision-making process are the key abilities [2]. The analyses show that football players cover 9 to 12 km during a match; of this, 8% to 12% is high-intensity running or sprinting [3]. The modern game is characterised by dynamic movements, such as short and long sprints, impulsive reactions, and quick changes of direction (COD) [4]. COD ability is a multifactorial skill, which, in its performance, depends on neuromuscular coordination, leg muscle strength and power [4] and straight sprinting speed [5]. During the COD, it is necessary to execute eccentric force rapidly to decelerate and develop the concentric strength to accelerate in the new direction [4]. The study of Jones et al. [6] found that COD correlates with eccentric knee-flexor strength and maximal eccentric lower-body strength.
Football players must satisfy a given neuromuscular demand at different intensities; this is the reason neuromuscular performance can be considered as the ability of the system to functionally control movements through proper coordination of muscular force and endurance via muscle recruitment pattern, proprioceptive feedback and reflex activity [7]. Impairments in neuromuscular performance can potentially increase injury risk [8]. Neuromuscular injury prevention training has been shown to reduce the risk of lower extremity injury [8]. Neuromuscular performance parameters, such as thigh, hip and trunk muscle strength, as well as postural control, are the main modifiable risk factors for lower extremity injuries in different populations [9].
Additionally, there is enough evidence to consider that muscle strength and balance are fundamental aspects in the prevention of lower body injuries in football players. In this regard, in the study by Lehance et al. [10], it was observed that out of 57 players, 36 had suffered a previous injury of some relevance to the lower limb, and of these 36 players, 23 still showed significant muscle imbalances: bilateral concentric asymmetry, eccentric asymmetry and asymmetry in the flexor/quadriceps ratio in both eccentric and concentric contractions. Focusing on avoiding these imbalances and strengthening the musculature can help prevent injuries. A high number of intense high-speed actions require the hamstrings to perform in a position of extreme stretch. The predominant hamstring injury mechanism in football occurs during high-speed running, deceleration or acceleration efforts [11]. The myotendinous junction of the long head of the biceps femoris (BF) is most commonly injured [12]. This means that significant muscle strength imbalances may increase muscular discomfort and result in high injury risk [13].
The neuromuscular system of football players is one of the most important factors in their competitive performance [14], and its characteristics can be assessed by means of tensiomyography (TMG). TMG is a non-invasive technique that by means of a portable device, can measure the properties of individual superficial muscles by recording the isometric muscle contraction induced externally by electrostimulation [15]. TMG can provide information about the muscle fibre-type composition, muscle tone, muscle fatigue and muscle imbalance and asymmetries [16]. This is relevant because it is necessary to conduct regular physiological monitoring of players to assess the effectiveness of training. However, monitoring of this kind requires knowledge of a player’s initial status, since these reference values of physical and physiological condition are known to change as the season progresses [17].
We have found no studies in which strength training based on TMG data has been compared to traditional training in football players. The aim of this study was to analyse the effect of the intervention programme, based on the TMG results, on improving the contractile properties of the knee flexor muscles (biceps femoris and semitendinosus), in the time of the COD 90° test in football players and on hamstring injuries.
2. Materials and Methods
2.1. Subjects
The sample comprised 34 male football players, divided into two groups. All players have more than 10 years of football training experience. The experimental and control groups were teams in the Spanish second division “B”. The teams were trained around 8 to 10 h per week in season, depending on the competition calendar (one or two games per week). After being informed of the benefits and risks of the purpose and testing procedures, subjects signed a written informed consent form before participation. The present study was approved by the local research ethics committee, in accordance with the Declaration of Helsinki.
2.2. Design and Procedure
A comparative experimental study was conducted to assess in-season changes in the mechanical and neuromuscular characteristics of knee flexor muscles (biceps femoris—BF and semitendinosus—ST) and the time in the 90° COD test. For the two clubs, the first assessment was conducted in their club’s medical facilities in the second week of January. The second assessment was 8 weeks later under the same conditions. The two assessments were performed before the training session, and there were 20 h between the TMG test and the last training session.
The results of this first TMG assessment were used to develop individual training programmes for each player only in the experimental group. The objectives of the training were to improve the muscle tone and explosiveness of the muscles that were deficient. Muscle displacement values indicate muscle tone, and contraction time indicates explosiveness. These parameters vary according to muscle group, sport, age and the athlete’s own repeated data. Although muscle displacement (Dm) values between 4 and 7 mm are often accepted [18], it also depends on the muscle measured. Above these data indicates lack of muscle tone or fatigue and below stiffness or overload [18,19]. As for the contraction time (Tc), some studies have referred to adequate Tc data between 20 and 30 ms [20]; above these data may also indicate fatigue [21].
The individual training programme plan (Figure 1) was performed at the beginning of each training session after the warm-up and was carried out for 8 weeks. The players performed four to five exercises, and the load was increased every week, with a volume of 2–4 sets of ten repetitions. In cases where there was a deficit of explosiveness, the speed of execution of the exercises was maximal. The recovery time between sets was 1 min and 1.5 min if they required maximum execution speed. There are some of the individualized exercises that were carried out: focusing on the semitendinosus: Nordic curl, Single-leg bridge, prone leg curl; and focusing on the biceps femoris: glute-Ham rise, single-leg bridge with straight leg in suspension, single-leg bridge with straight leg [22]. After the individualised program, which lasted between 15 and 20 min, the experimental group continued with their usual physical and tactical training.
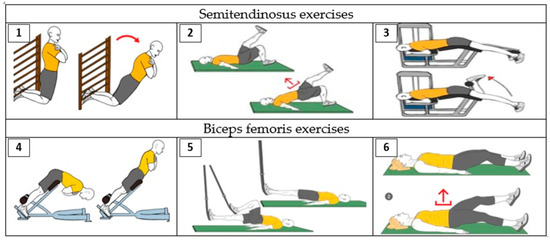
Figure 1.
Individual programme 1. Nordic curl, 2. Single-leg bridge, 3. Prone leg curl, 4. Glute-Ham rise, 5. Single-leg bridge with straight leg in suspension, 6. Single-leg bridge with straight leg.
The control group did not perform any specific training based on tensiomyography assessments. During the 8 weeks that the experiment lasted, they only did their usual training.
2.3. Tensiomyography Assessment
TMG was used to measure the radial muscle belly displacement (mm) and the time contraction (Tc) in milliseconds of the long head of the BF and the semitendinosus (ST), knee flexor muscles. Measurements were taken under static and relaxed conditions. The knee flexor muscles were measured with the subject in the prone position and the knee joint fixed at an angle of 150° by means of a specially designed wedge cushion [23]. All measurements were taken by two researchers with expertise in the use of TMG, with more than 7 years of experience: one in charge of controlling the intensity and frequency of the electrical stimulus, and the other in charge of directing the placement of the sensor and the participant’s status in a static and relaxed position. The TMG assessments were performed once the subject had been in a relaxed supine position for 5–8 min [23]. Electrical stimulation was applied with a pulse duration of 1 millisecond (ms) and an initial current amplitude of 30 milliamps (mA), which was progressively increased in 5 mA steps until reaching 110 mA (maximal stimulator output) or until the muscular response did not change despite increasing the intensity of the stimulus [24]. Consecutive stimuli were separated by a rest period of 10 s. Measures of radial muscle belly displacement were acquired by means of a digital displacement transducer (GK 30, Panoptik d.o.o., Ljubljana, Slovenia) set perpendicular to the thickest part of the muscle belly. The thickest part of the muscle belly was determined visually and through palpation during a voluntary contraction. The self-adhesive electrodes (5 × 5 cm, Cefar-Compex Medical AB Co., Ltd., Malmö, Sweden) were placed symmetrically at a distance of 5 cm from the sensor [25]. The positive electrode was positioned above the measurement point and proximally, while the negative electrode was placed below this point and distally. The electrical stimulus was produced by a TMG-S2 (EMF-FURLAN & Co. d.o.o., Ljubljana, Slovenia) stimulator. Each measurement involved recording the following parameters of involuntary isometric contraction produced by the electrical stimulus: maximum radial muscle belly displacement (Dm) in millimetres; time contraction (Tc) as the time in milliseconds from 10% to 90% of the muscle displacement (Dm).
2.4. Change of Direction Assessment
The COD sprint of 90° test (COD 90°) was carried out on a synthetic plain and indoor floor (Taraflex, Madrid, Spain). The time spent in the sprints was measured with photoelectric cells connected to a telemetry power system using a stopwatch with a precision up to the millisecond (Racetime2, Microgate, Bolzano, Italy).
The COD 90° tests(Figure 2) were assessed using a 10-metre sprint: five metres straight ahead, a turn of 90° and then five metres to the finish line, one sprint to the left side and a second one to the right side, with a 2 min rest interval between attempts. The front foot was placed 0.5 metres before the first timing gate, and subjects started voluntarily, so the reaction time was eliminated. We recorded the total time of completing the COD sprintway, and the best result of the two attempts of each sprinting side was selected for the statistical analysis [26].
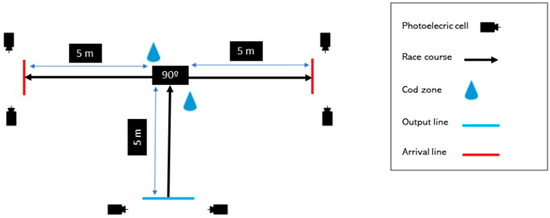
Figure 2.
90° COD Test.
2.5. Statistical Analysis
In order to verify the normal distribution of the data, a Shapiro–Wilk test was conducted. The variables which had missed any value, were replaced by linear interpolation method [27]. Due to their distribution, variables that did not have a normal distribution were transformed using a logarithmic transformation. A Shapiro-Wilk test was reconducted to verify the normal distribution of the variables. Mean and standard deviation were calculated for descriptive analysis. A two-way MANOVA was performed. Three factors were defined: time factor (pre- and post- training), muscle factor (BF and ST) and group factor (EG and CG). When a significant F-value was achieved, a Bonferroni post hoc procedure was performed [28]. Small (<0.06), medium (0.06–0.13) and large (>0.14) effect sizes were calculated using eta partial squared (). All statistical analyses were performed using SPSS 24.0 (IBM Corporation, Armonk, NY), and the level of statistical significance was set at p < 0.05.
3. Results
Table 1 shows baseline characteristics of the sample. The are no differences between both groups in age, height and weight variables.

Table 1.
Baseline characteristics.
3.1. TMG Parameters
Table 2 shows the descriptive analysis in muscular response in both legs, muscles and groups.
Table 2.
Descriptive values of TMG in muscular response for both legs, muscles and groups.
The Tc only increases in the right BF of the experimental group; in the rest of the muscles and in both groups it decreases. The Dm decreases in both groups and in both muscles.
3.1.1. Right Leg
Table 3 shows the multivariate analysis of the right leg. All factors except muscle × group and time × muscle × group have a significant difference with a large effect size.
Table 3.
Multivariate analysis values of right leg.
3.1.2. Left Leg
Table 4 shows the multivariate analysis of the left leg. No interaction with the group factor has a significant difference.
Table 4.
Multivariate analysis values of left leg.
Table 5 shows the factors and interaction analysis of both legs. There is a significant difference in interaction time × muscle × group in Tc value in the right leg.
Table 5.
Factors and interaction analysis in both legs.
3.2. Change of Direction Test
Figure 3 shows how CG increases its time in COD 90° after the training programme in both sides while EG remains similar.
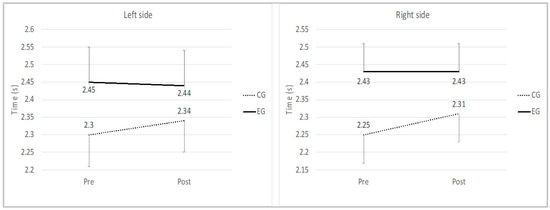
Figure 3.
Changes in COD 90° values to the left side and the right side. Note: Pre, first assessment moment; Post, second assessment moment; CG, control group; EG, experimental group.
3.2.1. Right Side
There are significant differences in the time factor (F (1,32) = 9.184, p = 0.005, = 0.223, 1 − β = 0.836). That is, there are significant changes between pre- and post-test regardless of group. Furthermore, there are differences in the time x group interaction (F (1,32) = 13.216, p = 0.001, = 0.292, 1 − β = 0.94). There are differences in the pre between both groups (p < 0.001) and in the post (p = 0.038). In addition, there are differences between pre and post depending on the group. The control group has significant differences between pre and post (p < 0.001), while the experimental group does not (p = 0.652).
3.2.2. Left Side
There are significant differences in the time factor (F (1,32) = 15.933, p < 0.001, = 0.332, 1 − β = 0.972). That is, there are significant changes between pre and post regardless of group. Furthermore, there are differences in the time × group interaction (F (1,32) = 16.242, p < 0.001, = 0.337, 1 − β = 0.974). That is, there are differences between pre (p < 0.01) and post (p = 0.008) depending on the group. There are differences between the two groups in both pre and post. In addition, the control group has significant differences between pre and post (p < 0.001), while the experimental group does not (p = 0.977).
4. Discussion
The main findings of this study are that: (a) the effect of the individual training improves muscle tone in the EG more than in the CG in both muscles (BF and ST). (b) The tone improvement is more relevant in the semitendinosus than in the biceps femoris in the right leg. (c) The 90°degree COD worsens the execution time in the control group and is maintained in the experimental group. Also, during the research, the experimental group did not have any hamstring injuries from the beginning of the research until the end of the season, but there were hamstring injuries in the control group in four football players.
The time of contraction in milliseconds, measured with TMG, reflects the explosiveness of the muscle. A muscle with a short time of contraction indicates high explosiveness, and a muscle with a long time of contraction shows a slow muscle [29]. The Tc also depends on the percentage of rapid or slow fibres in the evaluated muscle. When the percentage of rapid fibres increases, the Tc decreases [19].
Muscular displacement, measured by TMG, is a parameter that reflects muscle tone and stiffness [19]. If the stimulated muscle has great displacement, it indicates a lack of muscular tone; when the muscle has little displacement, it shows stiffness in the muscle. On the contrary, if the muscle’s displacement is adequate, it demonstrates good muscle tone.
In our study, there are significant differences in the Tc on the right leg in the time-muscle-group interaction. In addition, these differences occur in ST and BF between pre- and post-test, and these changes are different in both groups (Table 3, Table 4 and Table 5). The changes in BF are greater in the EG than in the CG. In the control group, contraction time decreases, and in the EG, the contraction time increases (right leg CG: pre-test 26.02 ± 8.54 ms, post-test 25.57 ± 18.47 ms and in the EG pre-test 29.9 ± 7.68 ms, post-test 37.5 ± 14.89 ms), which means that they are slower. This could be an indicator of fatigue because the muscle takes longer to contract, maybe due to the increased competitive density in EG (two match per week) and the intervention programme. It can be further explained by factors related to the central nervous system, such as changes at the spinal level [30] or by peripheral factors associated with the muscle, such as failure of transmission at the neuromuscular junction [31]. In addition, the biceps femoris is a muscle that is more fatigued than the ST [32]. Specifically, it has been observed that the acute effects of training generate a decrease in Tc [33,34] and that the chronic effects, more sustained over time, generate an increase in Tc. Our results disagreed with Loturco et al. [35], in which after an 8-week training programme, the BF reduced the contraction time (pre-test 24.5 ± 10.6 ms, post-test 19.6 ± 9.3 ms). The athletes completed, on average, eight training sessions per week, which consisted of ≈ 6 technical and tactical (game-based training) and ≈ 2 strength-power (e.g., unloaded vertical and horizontal jumps, and squat jump) training sessions. The period was implemented in the transition between two championships, so no official matches had been played. Moreover, they did not individualise the specific training programme and had no control group. However, the increment of time contraction in BF in our study also appears in the study of García-García et al. [36], (pre: 28.8 ± 5.9 ms, post: 29.8 ± 4.6 ms). This study also carried out individualised training on a group of football players and compared with participants who were physically active, non-football playing males who had not undergone any systematic training process, after a 7-week preseason with a high load and a 10-week gap between tests. This could imply that in periods of higher load, the contraction time of the BF increases; this is a fatigue indicator. However, further studies are needed to confirm these findings.
In relation to Dm in our study, in BF, this decreased more in the EG than in the CG, which hardly changed (CG pre: 4.23 ± 2.29 mm, post: 4.15 ± 1.68 mm, and the EG pre: 5.35 ± 1.79 mm, post: 4.79 ± 1.91 mm). This can be interpreted as meaning that the individualised programme based on the TMG values improved the muscle tone of the bicep femoris, which is similar to the findings of the Loturco et al. [35] study with Brazilian football players (pre-test: 4.48 ± 1.9 mm, post-test: 3.04 ± 2.18 mm), in which the BF muscle tone also improved.
Regarding ST, both groups, EG and CG, showed improved Dm, and therefore improved their muscle tone. However, the EG has a much greater improvement (CG pre: 7.80 ± 2.11 mm, post: 5.88 ± 2.28 mm, and the EG pre: 9.30 ± 2.81 mm, 6.24 ± 2.96 mm). Many of the exercises prescribed to the EG were aimed at this muscle, as the ST was the muscle with the worst values in the initial measurement. We have not found any studies that analyse pre and post by measuring the ST. In fact, there are few studies that measure the ST either in experimental or descriptive research, nor is this muscle usually measured in practice, which is very striking given its importance and its relationship with the BF. To date, there are two studies in which this muscle is measured at two different times of the season [37]. In a previous study by Fernández-Baeza et al. (2022), the Dm of the ST worsened during the season, increasing in both the right and left leg (right leg 8.72 ± 2.21 mm vs. 8.91 ± 2.08 mm; left leg 8.41 ± 2.21 mm vs. 10.09 ± 2.95 mm), which means that as the season progressed, the muscle tone of the ST worsened [38]. The same outcome was observed in the study by Piqueras-Sanchiz et al. [37]. Although this was performed in futsal, the Dm of the ST also worsened during the season (9.7 ± 2.0 mm vs. 10.6 ± 2.0 mm). It seems that the ST is less activated than the BF during sprinting [32,39], with especially less eccentric activation [40]. This seems to be the explanation for why, as the season progresses and the sprinting frequency increases, the ST data worsen, and the BF improves. Therefore, our study, which implements specific work to improve ST, is an interesting solution to prevent the worsening of ST per se during competition.
With regard to the ST contraction time, this decreases in both groups and therefore improves explosiveness. However, the CG is the one that improved this variable more (CG pre: 48.27 ± 6.65 ms, post: 30.42 ± 10.39 ms, EG pre: 47.42 ± 9.05 ms, post: 44.43 ± 11.36 ms). This may be due to the age of the players, who are younger in the CG, as explosiveness is lost as we get older [41]. Age is strongly associated with a decline of physical capacities, and poorer sprint mechanical output values were observed among male players over 28 years old than for the other male age categories [42]. According to Korhonen et al. [43], age-related sprint performance decline is mainly explained by the reduction in the size of fast fibres, and a lower maximum shortening velocity of type I myosin heavy-chain fibres. While mean peak performance in elite sprint specialists is achieved at 25–26 years of age [44], previous cross-sectional studies indicate that sprint capacities in football players peaks several years earlier [3,45].
Regarding the 90° COD test, although there were no statistically significant differences, it was observed that the CG worsened its COD test values on both sides, and the EG maintained its results for the left side 90° COD test and improved the right side 90° COD test (left 90° COD CG pre: 2.25 ± 0.08 s, post: 2.31 ± 0.10 s, EG pre: 2.43 ± 0.08 s, post: 2.43 ± 0.08 s; right 90° COD CG pre: 2.30 ± 0.11 s, post: 2.34 ± 0.09 s, EG pre: 2.45 ± 0.09 s, post 2.44 ± 0.09 s). There are significant differences in the time factor (p = 0.009 right side and p = 0.02 left side) and in the time × group interaction (p = 0.001 right side and p = 0.018 left side). The CG has significant differences between pre and post (p = 0.001 right side and p = 0.007 left side), while the EG does not (p = 0.334 right side and p = 0.966 left side). This is likely due to the improvement obtained by the EG in the muscle tone of the ST of the right leg, because it is a muscle that participates in the eccentric action in deceleration and concentric action in acceleration [46]. In any case, it is important to note that the tests were carried out at the end of the season, so it is important not to worsen the COD test times in that phase where fatigue usually appears.
Likewise, the individualised training plan had eccentric exercises that have been shown to be a good tool to improve in COD and TMG variables [47]. The study of Loturco et al. [35] performed a COD test consisting of four 5-metre sections marked with cones set at 100° angles, measured at two different times of the season. Although the COD angle was different from our study, and therefore the times as well, an improvement was observed in the times (pre: 3.66 ± 0.12 s, post: 3.58 ± 0.11 s), which coincides with our study in the right-side COD test.
5. Conclusions
This research demonstrates the importance of evaluating our athletes at different times of the season, in order to be able to individualise training according to the values obtained in the TMG. Likewise, football coaches should implement a strength training programme with analytical exercises focused on the semitendinosus, to balance the intermuscular coordination produced by training and competition between the BF and the ST.
Eight weeks of an individual training programme based on tensiomyography in the knee flexor muscles (BF and ST) improved the muscle contractile properties in the contraction time and muscle displacement, and maintain, without worsening, the execution times in the 90° COD test in football players. Further studies are required along the lines of the same methodology in the use of TMG in different professional football teams, in order to implement individualised training programmes based on the TMG data to improve muscle tone and explosiveness in football players. Finally, the limitations of the study were that the study was carried out with professional football players in the competitive period and could be influenced by training fatigue, competition and opponents in different ways in both groups.
Author Contributions
Conceptualisation, D.F.-B. and C.G.-M.; methodology, C.G.-M. and G.D.-U.; formal analysis, G.D.-U.; investigation, D.F.-B. and C.G.-M.; resources, D.F.-B. and C.G.-M.; writing—original draft preparation, D.F.-B., C.G.-M. and G.D.-U.; writing—review and editing, D.F.-B., C.G.-M. and G.D.-U. All authors have read and agreed to the published version of the manuscript.
Funding
This research received no external funding.
Institutional Review Board Statement
The study was conducted in accordance with the Declaration of Helsinki, and approved by the Institutional Review Board (or Ethics Committee) of Universidad Francisco de Vitoria (protocol code 77/2019 and date of approval 14 October 2019).
Informed Consent Statement
Informed consent was obtained from all subjects involved in the study. Written informed consent has been obtained from the patient(s) to publish this paper.
Data Availability Statement
Not applicable.
Conflicts of Interest
The authors declare no conflict of interest.
References
- Dellal, A.; Chamari, K.; Wong, D.P.; Ahmaidi, S.; Keller, D.; Barros, R.; Bisciotti, G.N.; Carling, C. Comparison of physical and technical performance in European soccer match-play: Fa Premier League and La Liga. Eur. J. Sport Sci. 2011, 11, 51–59. [Google Scholar] [CrossRef]
- Carling, C. Analysis of physical activity profiles when running with the ball in a professional soccer team. J. Sports Sci. 2010, 28, 319–326. [Google Scholar] [CrossRef] [PubMed]
- Haugen, T.; Espen, T.; Hisdal, J.; Seiler, S. The role and development of sprinting speed in soccer. Int J. Sports Physiol. Perform. 2013, 9, 432–441. [Google Scholar] [CrossRef] [PubMed]
- Dos’santos, T.; Thomas, C.; McBurnie, A.; Comfort, P.; Jones, P.A. Change of direction speed and technique modification training improves 180° turning performance, kinetics, and kinematics. Sports 2021, 9, 73. [Google Scholar] [CrossRef]
- Little, T.; Williams, A.G. Specificity of acceleration, maximum speed, and agility in professional soccer players. J. Strength Cond. Res. 2005, 19, 76–78. [Google Scholar]
- Jones, P.; Bampouras, T.M.; Marrin, K. An investigation into the physical determinants of change of direction speed. J. Sports Med. Phys. Fit. 2009, 49, 97–104. [Google Scholar]
- Faude, O.; Rössler, R.; Petushek, E.J.; Roth, R.; Zahner, L.; Donath, L. Neuromuscular adaptations to multimodal injury prevention programs in youth sports: A systematic review with meta-analysis of randomized controlled trials. Front Physiol. 2017, 8, 1–15. [Google Scholar] [CrossRef]
- Lehr, M.E.; Kime, D.; Onks, C.; Silvis, M.; Streisel, M. Development of a preliminary evidence-based neuromusculoskeletal exercise guideline to reduce injury risk in the lower limb. Phys. Ther. Sport 2017, 25, 76–83. [Google Scholar] [CrossRef]
- Read, P.; Oliver, J.L.; De Ste Croix, M.B.A.; Myer, G.D.; Lloyd, R.S. Assessment of injury risk factors in male youth soccer players. Strength Cond. J. 2016, 38, 12–21. [Google Scholar] [CrossRef]
- Lehance, C.; Binet, J.; Bury, T.; Croisier, J.L. Muscular strength, functional performances and injury risk in professional and junior elite soccer players. Scand. J. Med. Sci. Sport 2009, 19, 243–251. [Google Scholar] [CrossRef]
- Schuermans, J.; Van Tiggelen, D.; Danneels, L.; Witvrouw, E. Susceptibility to hamstring injuries in soccer: A prospective study using muscle functional magnetic resonance imaging. Am. J. Sports Med. 2016, 44, 1276–1285. [Google Scholar] [CrossRef] [PubMed]
- Ekstrand, J.; Waldén, M.; Hägglund, M. Hamstring injuries have increased by 4% annually in men’s professional football, since 2001: A 13-year longitudinal analysis of the UEFA Elite Club injury study. Br. J. Sports Med. 2016, 50, 731–737. [Google Scholar] [CrossRef] [PubMed]
- Junge, N.; Morin, J.B.; Nybo, L. Leg extension force-velocity imbalance has negative impact on sprint performance in ballgame players. Sport Biomech. 2020, 1–14. [Google Scholar] [CrossRef] [PubMed]
- Read, P.J.; Oliver, J.L.; Ste Croix MDe Myer, G.D.; Lloyd, R.S. A review of field-based assessments of neuromuscular control and their utility in male youth soccer players. J. Strength Cond. Res. 2019, 33, 283–299. [Google Scholar] [CrossRef] [PubMed]
- Valencic, V.; Djodjevic, S. Influence of acute physical exercise on twitch response elicited by stimulation of skeletal muscles in man. Biomech. Eng. 2001, 2, 1–4. [Google Scholar]
- Macgregor, L.J.; Hunter, A.M.; Orizio, C.; Fairweather, M.M.; Ditroilo, M. Assessment of Skeletal Muscle Contractile Properties by Radial Displacement: The Case for Tensiomyography. Sport Med. 2018, 48, 1607–1620. [Google Scholar] [CrossRef]
- Turner, A.N.; Stewart, P.F. Strength and conditioning for soccer players. Strength Cond. J. 2014, 36, 1–13. [Google Scholar] [CrossRef]
- Križaj, D.; Šimunič, B.; Žagar, T. Short-term repeatability of parameters extracted from radial displacement of muscle belly. J. Electromyogr. Kinesiol. 2008, 18, 645–651. [Google Scholar] [CrossRef]
- García-Manso, J.M.; Rodríguez-Ruiz, D.; Rodríguez-Matoso, D.; de Yves, S.; Sarmiento, S.; Quiroga, M. Assessment of muscle fatigue after an ultra-endurance triathlon using tensiomyography (TMG). J. Sports Sci. 2011, 29, 619–625. [Google Scholar] [CrossRef]
- Paravlic, A.H.; Milanović, Z.; Abazović, E.; Vučković, G.; Spudić, D.; Rošker, Z.M.; Pajek, M.; Vodičar, J. The muscle contractile properties in female soccer players: Inter-limb comparison using tensiomyography. J. Musculoskelet. Neuronal Interact. 2022, 22, 179–192. [Google Scholar]
- Šimunič, B.; Rozman, S.; Pišot, R. Detecting the Velocity of the Muscle Contraction. 2007. Available online: http://www.tensiomyograph.de/download/Det-E.pdf (accessed on 26 July 2022).
- Bourne, M.N.; Williams, M.D.; Opar, D.A.; Al Najjar, A.; Kerr, G.K.; Shield, A.J. Impact of exercise selection on hamstring muscle activation. Br. J. Sports Med. 2017, 51, 1021–1028. [Google Scholar] [CrossRef]
- García-García, O.; Cuba-Dorado, A.; Álvarez-Yates, T.; Carballo-López, J.; Iglesias-Caamaño, M. Clinical utility of tensiomyography for muscle function analysis in athletes. Open Access J. Sport Med. 2019, 10, 49–69. [Google Scholar] [CrossRef] [PubMed]
- Knez, N.; Valenčič, V. Influence of impulse duration on skeletal muscle belly response. In Proceedings of the IX Electrochenical and Computer Science Conference, Portoroz, Eslovenia; 2000; pp. 301–304. [Google Scholar]
- Perotto, A.O.; Thomas, C.C.; Underwood, F.B. Anatomical guide for the electromyographer: The Limbs and Trunk. Phys. Ther. 2006, 86, 345. [Google Scholar]
- Castillo-Rodríguez, A.; Fernández-García, J.C.; Chinchilla-Minguet, J.L.; Carnero, E.Á. Relationship between muscular strength and sprints with changes of direction. J. Strength Cond. Res. 2012, 26, 725–732. [Google Scholar] [CrossRef] [PubMed]
- Noor, M.N.; Yahaya, A.S.; Ramli, N.A.; Al Bakri, A.M.M. Filling Missing Data Using Interpolation Methods: Study on the Effect of Fitting Distribution; Trans Tech Publications Ltd.: Bäch, Switzerland, 2013; pp. 889–895. [Google Scholar]
- Shaffer, J.P. Multiple hypothesis testing. Annu. Rev. Psychol. 1995, 46, 561–584. [Google Scholar] [CrossRef]
- Rodríguez-Matoso, D.; García Manso, J.M.; Sarmiento Montesdeoca, S.; De Saa, Y.; Vaamonde, D.; Rodríguez-Ruiz, D.; Da Silva-Grigoletto, M.E. Assessment of muscle response as a control tool in the area of physical activity, health, and sports. Rev. Andal. Med. Deport. 2012, 5, 28–40. [Google Scholar] [CrossRef]
- Wan, J.J.; Qin, Z.; Wang, P.Y.; Sun, Y.; Liu, X. Muscle fatigue: General understanding and treatment. Exp. Mol. Med. 2017, 49, e384. [Google Scholar] [CrossRef]
- Kent-Braun, J.A.; Fitts, R.H.; Christie, A. Skeletal muscle fatigue. Compr. Physiol. 2012, 2, 997–1044. [Google Scholar]
- Wilmes, E.; De Ruiter, C.J.; Bastiaansen, B.J.; Goedhart, E.A.; Brink, M.S.; Van der Helm, F.C.; Savelsbergh, G.J. Associations between hamstring fatigue and sprint kinematics during a simulated football (Soccer) match. Med. Sci. Sport Exerc. 2021, 53, 2586–2595. [Google Scholar] [CrossRef]
- García-Sillero, M.; Benítez-Porres, J.; García-Romero, J.; Bonilla, D.A.; Petro, J.L.; Vargas-Molina, S. Comparison of interventional strategies to improve recovery after eccentric exercise-induced muscle fatigue. Int. J. Environ. Res. Public Health 2021, 18, 647. [Google Scholar] [CrossRef]
- Muñoz-López, A.; De Hoyo, M.; Nuñez, F.J.; Sañudo, B. Using tensiomyography to assess changes in knee muscle contraction properties after concentric and eccentric fatiguing muscle actions. J. Strength Cond. Res. 2022, 36, 935–940. [Google Scholar] [CrossRef] [PubMed]
- Loturco, I.; Pereira, L.A.; Kobal, R.; Kitamura, K.; Ramírez-Campillo, R.; Zanetti, V.; Abad, C.C.; Nakamura, F.Y. Muscle contraction velocity: A suitable approach to analyze the functional adaptations in elite soccer players. J. Sport Sci. Med. 2016, 15, 483–491. [Google Scholar]
- García-García, Ó.; Serrano-Gómez, V.; Hernadez-Mendo, A.; Tapia-Flores, A. Assessment of the in-season changes in mechanical and neuromuscular characteristics in professional soccer players. J. Sports Med. Phys. Fit. 2016, 47, 381–390. [Google Scholar]
- Piqueras-Sanchiz, F.; Martínez-Aranda, L.M.; Pareja-Blanco, F.; Rodríguez-Ruiz, D.; García-García, Ó. Evolution of contractile properties of the lower limb muscles throughout a season in elite futsal players. J. Sports Med. Phys. Fit. 2020, 60, 965–973. [Google Scholar] [CrossRef] [PubMed]
- Fernández-Baeza, D.; Diaz-Ureña, G.; González-Millán, C. Differences in the Contractile Properties of the Biceps Femoris and Semitendinosus Muscles Throughout a Season in Professional Soccer Players. J. Hum. Kinet. 2022, 84, 74–81. [Google Scholar]
- Higashihara, A.; Nagano, Y.; Ono, T.; Fukubayashi, T. Differences in hamstring activation characteristics between the acceleration and maximum-speed phases of sprinting. J. Sports Sci. 2018, 36, 1313–1318. [Google Scholar] [CrossRef]
- Bourne, M.; Opar, D.; Shield, A. Hamstring muscle activation during high-speed overground running: Impact of previous strain injury. Br. J. Sports Med. 2014, 48, 571–572. [Google Scholar] [CrossRef]
- Muehlbauer, T.; Gollhofer, A.; Granacher, U. Associations between measures of balance and lower-extremity muscle strength/power in healthy individuals across the lifespan: A systematic review and meta-analysis. Sport Med. 2015, 45, 1671–1692. [Google Scholar] [CrossRef]
- Haugen, T.A.; Breitschädel, F.; Seiler, S. Sprint mechanical properties in soccer players according to playing standard, position, age and sex. J. Sports Sci. 2020, 38, 1070–1076. [Google Scholar] [CrossRef] [PubMed]
- Degens, H.; Korhonen, M.T. Factors contributing to the variability in muscle ageing. Maturitas 2012, 73, 197–201. [Google Scholar] [CrossRef]
- Haugen, T.A.; Solberg, P.A.; Foster, C.; Moran-Navarro, R.; Breitschadel, F.; Hopkins, W.G. Peak age and performance progression in world class track and field athletes. Int. J. Sports Physiol. Perform. 2018, 14, 156–162. [Google Scholar] [CrossRef] [PubMed]
- Vescovi, J.D.; Rupf, R.; Brown, T.D.; Marques, M.C. Physical performance characteristics of high-level female soccer players 12-21 years of age. Scand. J. Med. Sci. Sport 2011, 21, 670–678. [Google Scholar] [CrossRef] [PubMed]
- Falch, H.; Rædergård, H.; Tillaar, R. Activity between a 180° change of direction task and different countermovement jumps. Sports 2020, 8, 47. [Google Scholar] [CrossRef]
- Beato, M.; Madruga-Parera, M.; Piqueras-Sanchiz, F.; Moreno-Pérez, V.; Romero-Rodriguez, D. Acute effect of eccentric overload exercises on change of direction performance and lower-limb muscle contractile function. J. Strength Cond. Res. 2021, 35, 3327–3333. [Google Scholar] [CrossRef] [PubMed]


Publisher’s Note: MDPI stays neutral with regard to jurisdictional claims in published maps and institutional affiliations. |
© 2022 by the authors. Licensee MDPI, Basel, Switzerland. This article is an open access article distributed under the terms and conditions of the Creative Commons Attribution (CC BY) license (https://creativecommons.org/licenses/by/4.0/).