Article

The Impact of Levee Openings on Storm Surge: A Numerical Analysis in Coastal Louisiana

1
Department of River-Coastal Science and Engineering, School of Science and Engineering, Tulane University, New Orleans, LA 70118, USA
2
Environmental Defense Fund, St. Petersburg, FL 33701, USA
3
Environmental Defense Fund, Washington, DC 20009, USA
4
Gulf Program, The National Wildlife Federation, New Orleans, LA 70119, USA
*
Author to whom correspondence should be addressed.
Appl. Sci. 2022, 12(21), 10884; https://doi.org/10.3390/app122110884
Submission received: 30 September 2022 / Revised: 19 October 2022 / Accepted: 24 October 2022 / Published: 27 October 2022

Abstract

:
The existence of the Mississippi River (MR) and Tributaries’ levees in coastal Louisiana could block storm surge and cause surge setup in adjacent basins. In order to reduce storm surge amplification caused by these barriers, one possible solution is to build “floodways” through the mainstem MR levees to allow surge during tropical events to cross. The primary purpose of this study is to examine if these floodways/openings can help reduce storm surge in adjacent basins. Using Hurricane Isaac (2012) as an example, a pre-validated Delft3D-based hydrodynamic model was applied to study the effect of levee openings on storm surge. Model results and flux analysis show that these levee openings were not effective in reducing storm surge in Barataria Basin and Breton Sound due to the complex interaction between the cross flow from the surge and the MR flow. During Isaac, the MR water could be diverted to Barataria and/or Breton, which resulted in an increase in storm surge, essentially defeating the primary objective of the levee openings. Overall, the impact of levee openings at the selected locations on storm surge reduction in adjacent basins of coastal Louisiana was minor and very limited.

1. Introduction

Mississippi River and Tributaries’ (MR&T) levees currently protect more than 4 million citizens, 1.5 million homes, 33,000 farms, and countless vital transportation routes from destructive riverine floods [1]. The levees are designed to protect the alluvial valley against a hypothetical project flood by confining flow to the leveed channel. For coastal areas, in addition to riverine flood, another threat that could result in flooding is storm surge defined as an offshore rise of water level caused by tropical cyclones. It is a severe devastation to human lives and properties throughout the world, from southeast Asia, the south and east coasts of China to the Caribbean islands, northern Gulf of Mexico and the U.S. east coast. Two recent storm surge events were Typhoon Meihua and Hurricane Ian in September 2022. They struck Hangzhou Bay and Yangtze Estuary in the east coast of China and the states of Florida and South Carolina along the southeast U.S. coast, respectively.
The lower Mississippi River (MR) delta area and Louisiana coast (see Figure 1) are susceptible to hurricane impacts frequently as well. Historical hurricane events that devastatingly affected coastal Louisiana include Katrina (2005), Gustav (2008), Isaac (2012) and Ida (2021). The existence of the MR&T levees in the MR delta area (see Figure 1) could block and amplify storm surge in adjacent basins. For example, both measurements and numerical results [2] show that Isaac (2012) induced more than 4 m of storm surge against the MR&T levees, east of the river, in Breton Sound, Louisiana, due to the semi-enclosed geometry of the estuary (see Figure 1) and the slow-moving pace of the hurricane.
In order to reduce storm surge amplification caused by these barriers, one possible solution that has been proposed is to build “floodways” through the mainstem MR levees. The idea is to allow storm surge during tropical events to cross the lower river peninsula through these openings/floodways from east to west or vice versa depending upon the path of a storm [3]. Previous analysis has indicated that the cost of providing adequate storm risk reduction by conventional means—contiguous linear levees parallel on the basin side to the river levees—is exorbitant and cannot be justified on a cost–benefit basis [4]. Additionally, the maintenance of the contiguous linear levee system on either side of the river can amplify surge in the local and adjacent communities, as well as on the coast of the State of Mississippi. Further, those same levees might starve adjacent disappearing wetlands of the benefits of the annual spring overflow of the MR.
To achieve the benefits described above, one fundamental and important question is: will this solution effectively reduce storm surge in adjacent basins (i.e., Breton Sound and Barataria Basin)? The numerical analysis presented here examines the hypothesis concerning building “floodways” through the mainstem MR levees in the lower MR delta. Two levee removal/opening locations (i.e., the upper-crossing location and the lower-crossing location, see Figure 1) were considered and their effects on storm surge were analyzed through a pre-validated storm surge model.

2. Storm Surge Model

2.1. Delft3D-FLOW

The open-source process-based numerical model suite Delft3D by Deltares (https://oss.deltares.nl/web/delft3d/about/, accessed on 23 October 2022), which has been used widely for storm surge studies [2,5,6,7,8,9,10,11], was selected to develop a hydrodynamic model for the study of the effect of levee removals on storm surge in both Breton Sound and Barataria Basin. The Delft3D suite, consisting of multiple modules, can carry out simulations of flows, sediment transports, waves, water quality, morphological developments and ecology. Delft3D-FLOW is a multi-dimensional hydrodynamic (and transport) module which calculates non-steady flow and transport phenomena that result from tidal and meteorological phenomena forcing on a rectilinear or a curvilinear, boundary fitted grid. The features of Delft3D-FLOW for storm surge applications include boundary-fitted grid generation for complex coastlines and estuary geometries, nesting tools for local boundary conditions, embedded vegetation module for the impact of different marsh types and “sub-grid” treatments for hydraulic and coastal structures.
Delft3D-FLOW solves the Navier–Stokes equations for an incompressible fluid, under the shallow water and the Boussinesq assumptions. The two-dimensional (2D) depth-averaged continuity equation is given by:
H t + U H x + V H y = Q
  • where
    H = ζ + h = total water depth, h = bathymetric depth, ζ   = water level
    U, V = depth-averaged velocities in x-, y- directions
    Q = contributions per unit area due to the discharge or withdrawal of water, precipitation and evaporation
The 2D momentum equations in x- and y-directions are given by:
U t + U U x + V U y f V = g ζ x 1 ρ 0 P x + τ s x H ρ 0 τ b x H ρ 0 D x H + S x
V t + U V x + V V y + f U = g ζ y 1 ρ 0 P y + τ s y H ρ 0 τ b y H ρ 0 D y H + S y
  • where
    f = Coriolis parameter
    g = acceleration due to gravity
    ρ 0 = reference density of water
    P = atmospheric pressure at the sea surface
    τ s x ,   τ s x   = surface wind stresses in x-, y- directions
    τ b x ,   τ b x   = bottom friction stresses in x-, y- directions
    D x ,   D y   = momentum dispersions in x-, y- directions
    S x ,   S y   = contributions due to external sources or sinks of momentum (e.g., external forces by hydraulic structures, discharge or withdrawal of water) in x-, y- directions
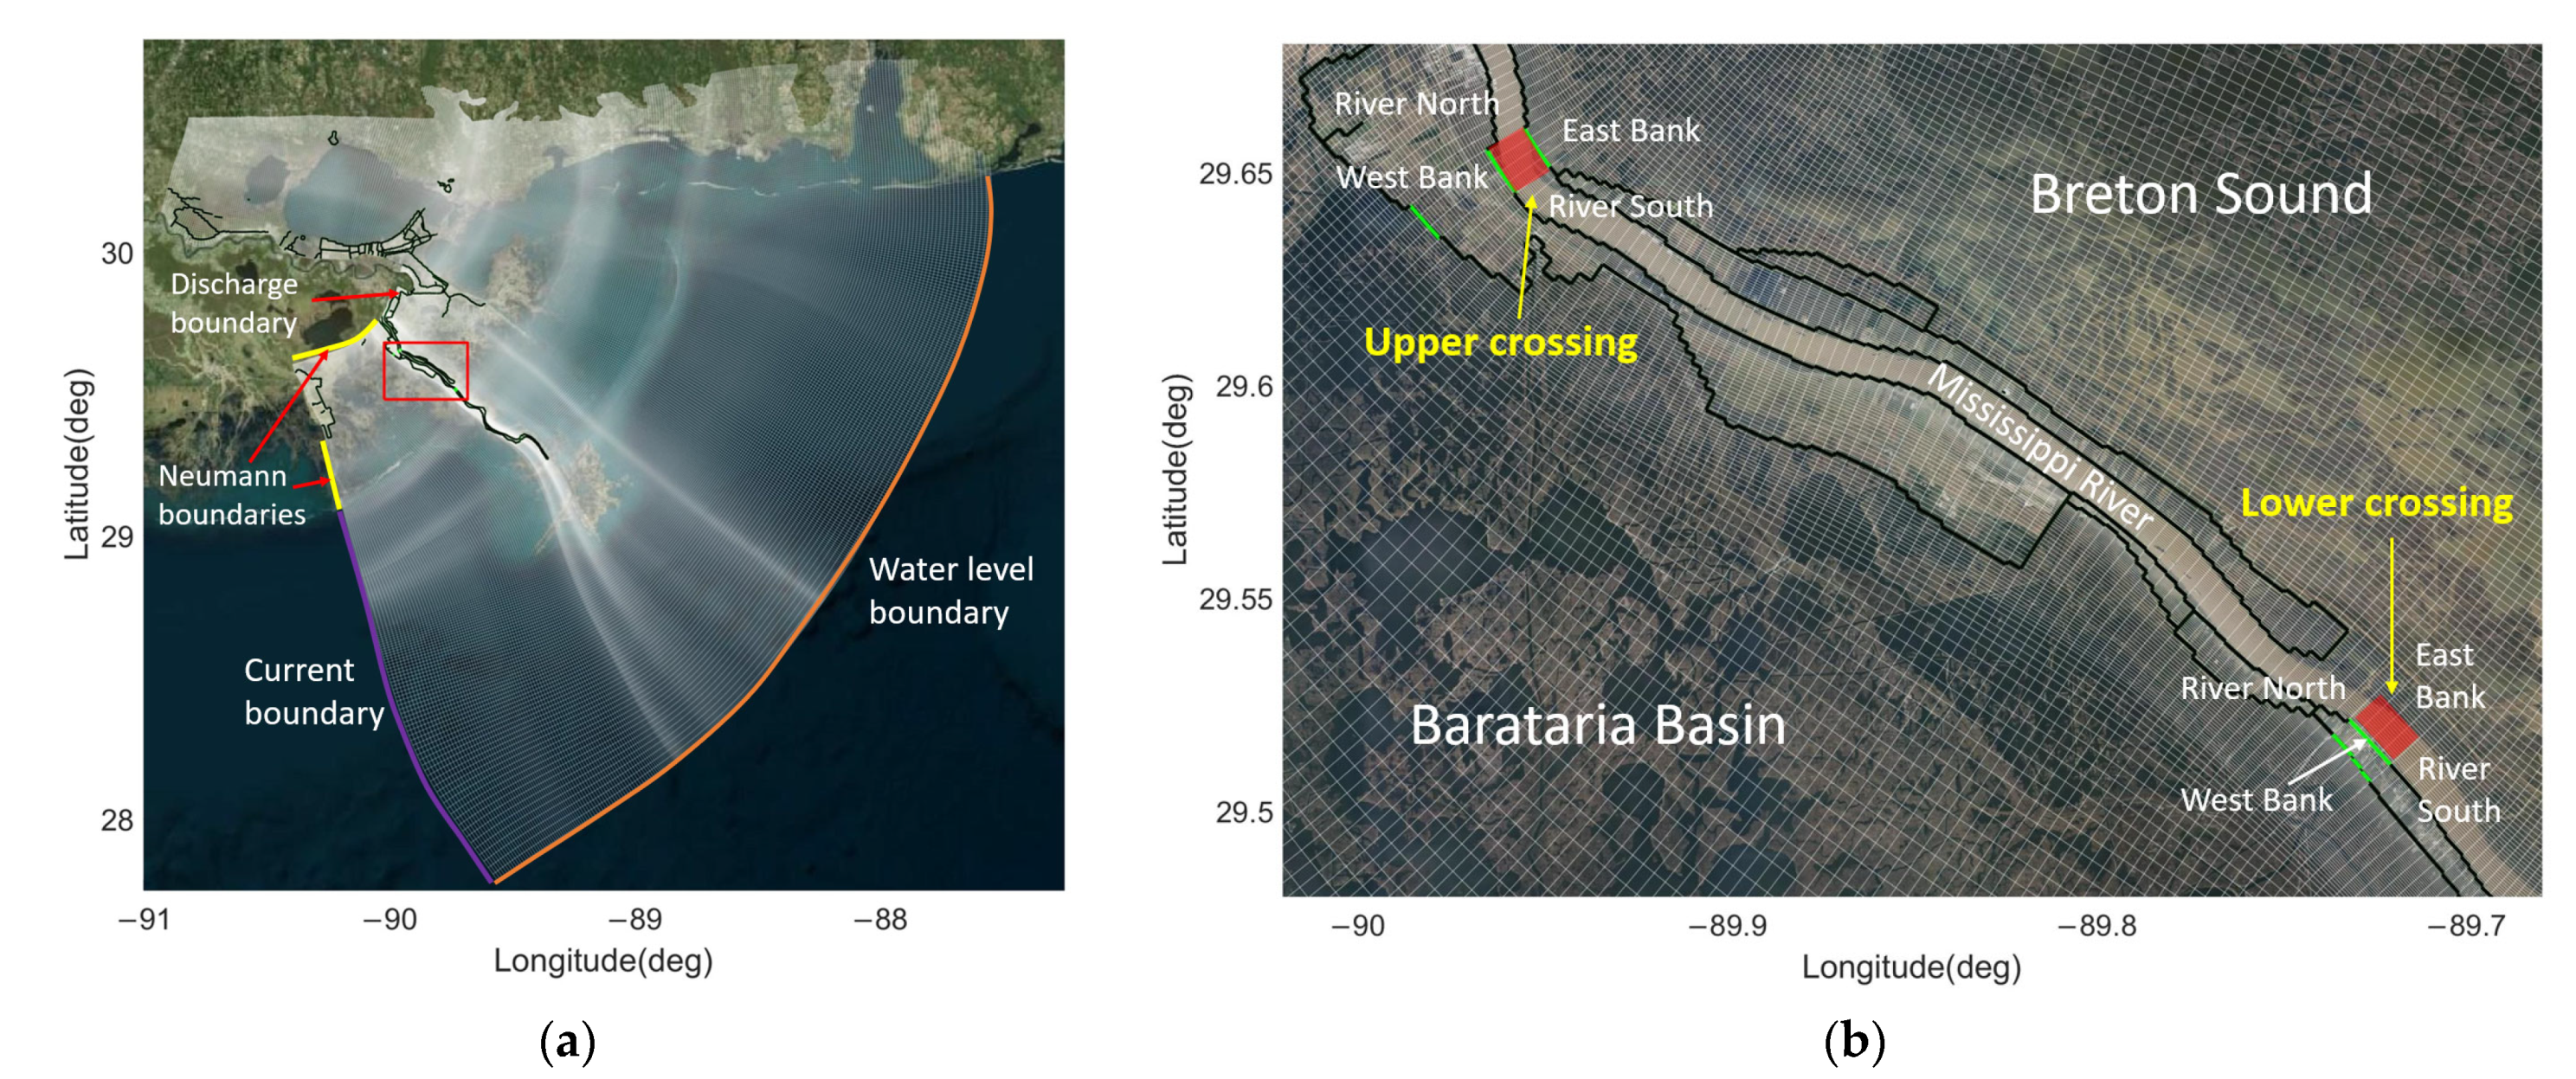
Refer to the Delf3D-FLOW User Manual [12] for details.

2.2. Model Setup

As shown in Figure 2, the model domain focuses on the Louisiana coast covering Barataria Basin, the lower MR delta, Breton Sound and Lake Pontchartrain. The grid size is 521 × 526. The domain has a spatial resolution ranging from 2 km offshore to 56 m in the MR. The offshore water level and current boundaries were provided by a Gulf-Atlantic model (see model details in [2]). The MR discharge was added at Belle Chasse using the U.S. Geological Survey (USGS) observed data. In Barataria Basin, two Neumann boundaries were set at the north and west sides to allow water to freely flow out of the model domain. The USGS 5 m resolution Coastal National Elevation Database (https://www.usgs.gov/special-topics/coastal-national-elevation-database-applications-project, accessed on 23 October 2022) was used for the interpolation of topography and bathymetry. The crest width of levees is normally only a few meters, which cannot be resolved by the current model grids. The sub-grid structure of local weirs in Delft3D was activated to represent the MR&T levee system. It treated levees as “thin walls” with limited heights along grid lines following the actual levee positions. When surface elevation at either side of the structure is larger than the levee height, two grids previously blocked by the structure will be connected and the flux between them can be calculated by an empirical formula. The removal of levees can be achieved by setting the top of local weirs to zero (NAVD88). It should be noted that this removal operation does not alter grid cell bed levels at both sides of the structure. The levee base and nearby topography resolved by model grids remain unchanged in the model. Two levee removal locations (see Figure 1 and Figure 2b) were considered in this study, that is, the upper-crossing location and the lower-crossing location. As shown in Figure 2b, green lines denote the removal parts of levees. At the upper-crossing location, two parts at each bank of the MR were removed. In addition, another part in Barataria was removed as well to allow water to flow into the basin. At the lower location, one part along the west bank of the MR was removed since there are no levees along the east bank, and one part in Barataria was removed as well. The width of each opening was set to 1 mile (1.6 km).

3. Model Results and Flux Analysis

The storm surge model has been validated for Hurricane Isaac [2]. Surface wind fields were provided by an asymmetric parametric hurricane wind model [13]. In this study, three scenarios were carried out: (1) the base case reflecting the existing conditions, (2) the both-crossing case with the removal of levees at both the upper and the lower locations and (3) the no-levee case with the removal of all MR&T levees (see black lines in Figure 2) in the model. Four water level stations near both crossing locations (see Figure 1) from the Louisiana Coastwide Reference Monitoring System (CRMS, http://lacoast.gov/crms2/, accessed on 23 October 2022) were selected to further validate the model performance and to compare water level results in different scenarios. In addition, at each crossing location, a “control box” (see filled red rectangles in Figure 2b) was set up to analyze fluxes through its four sides (i.e., west bank, river north, east bank and river south).

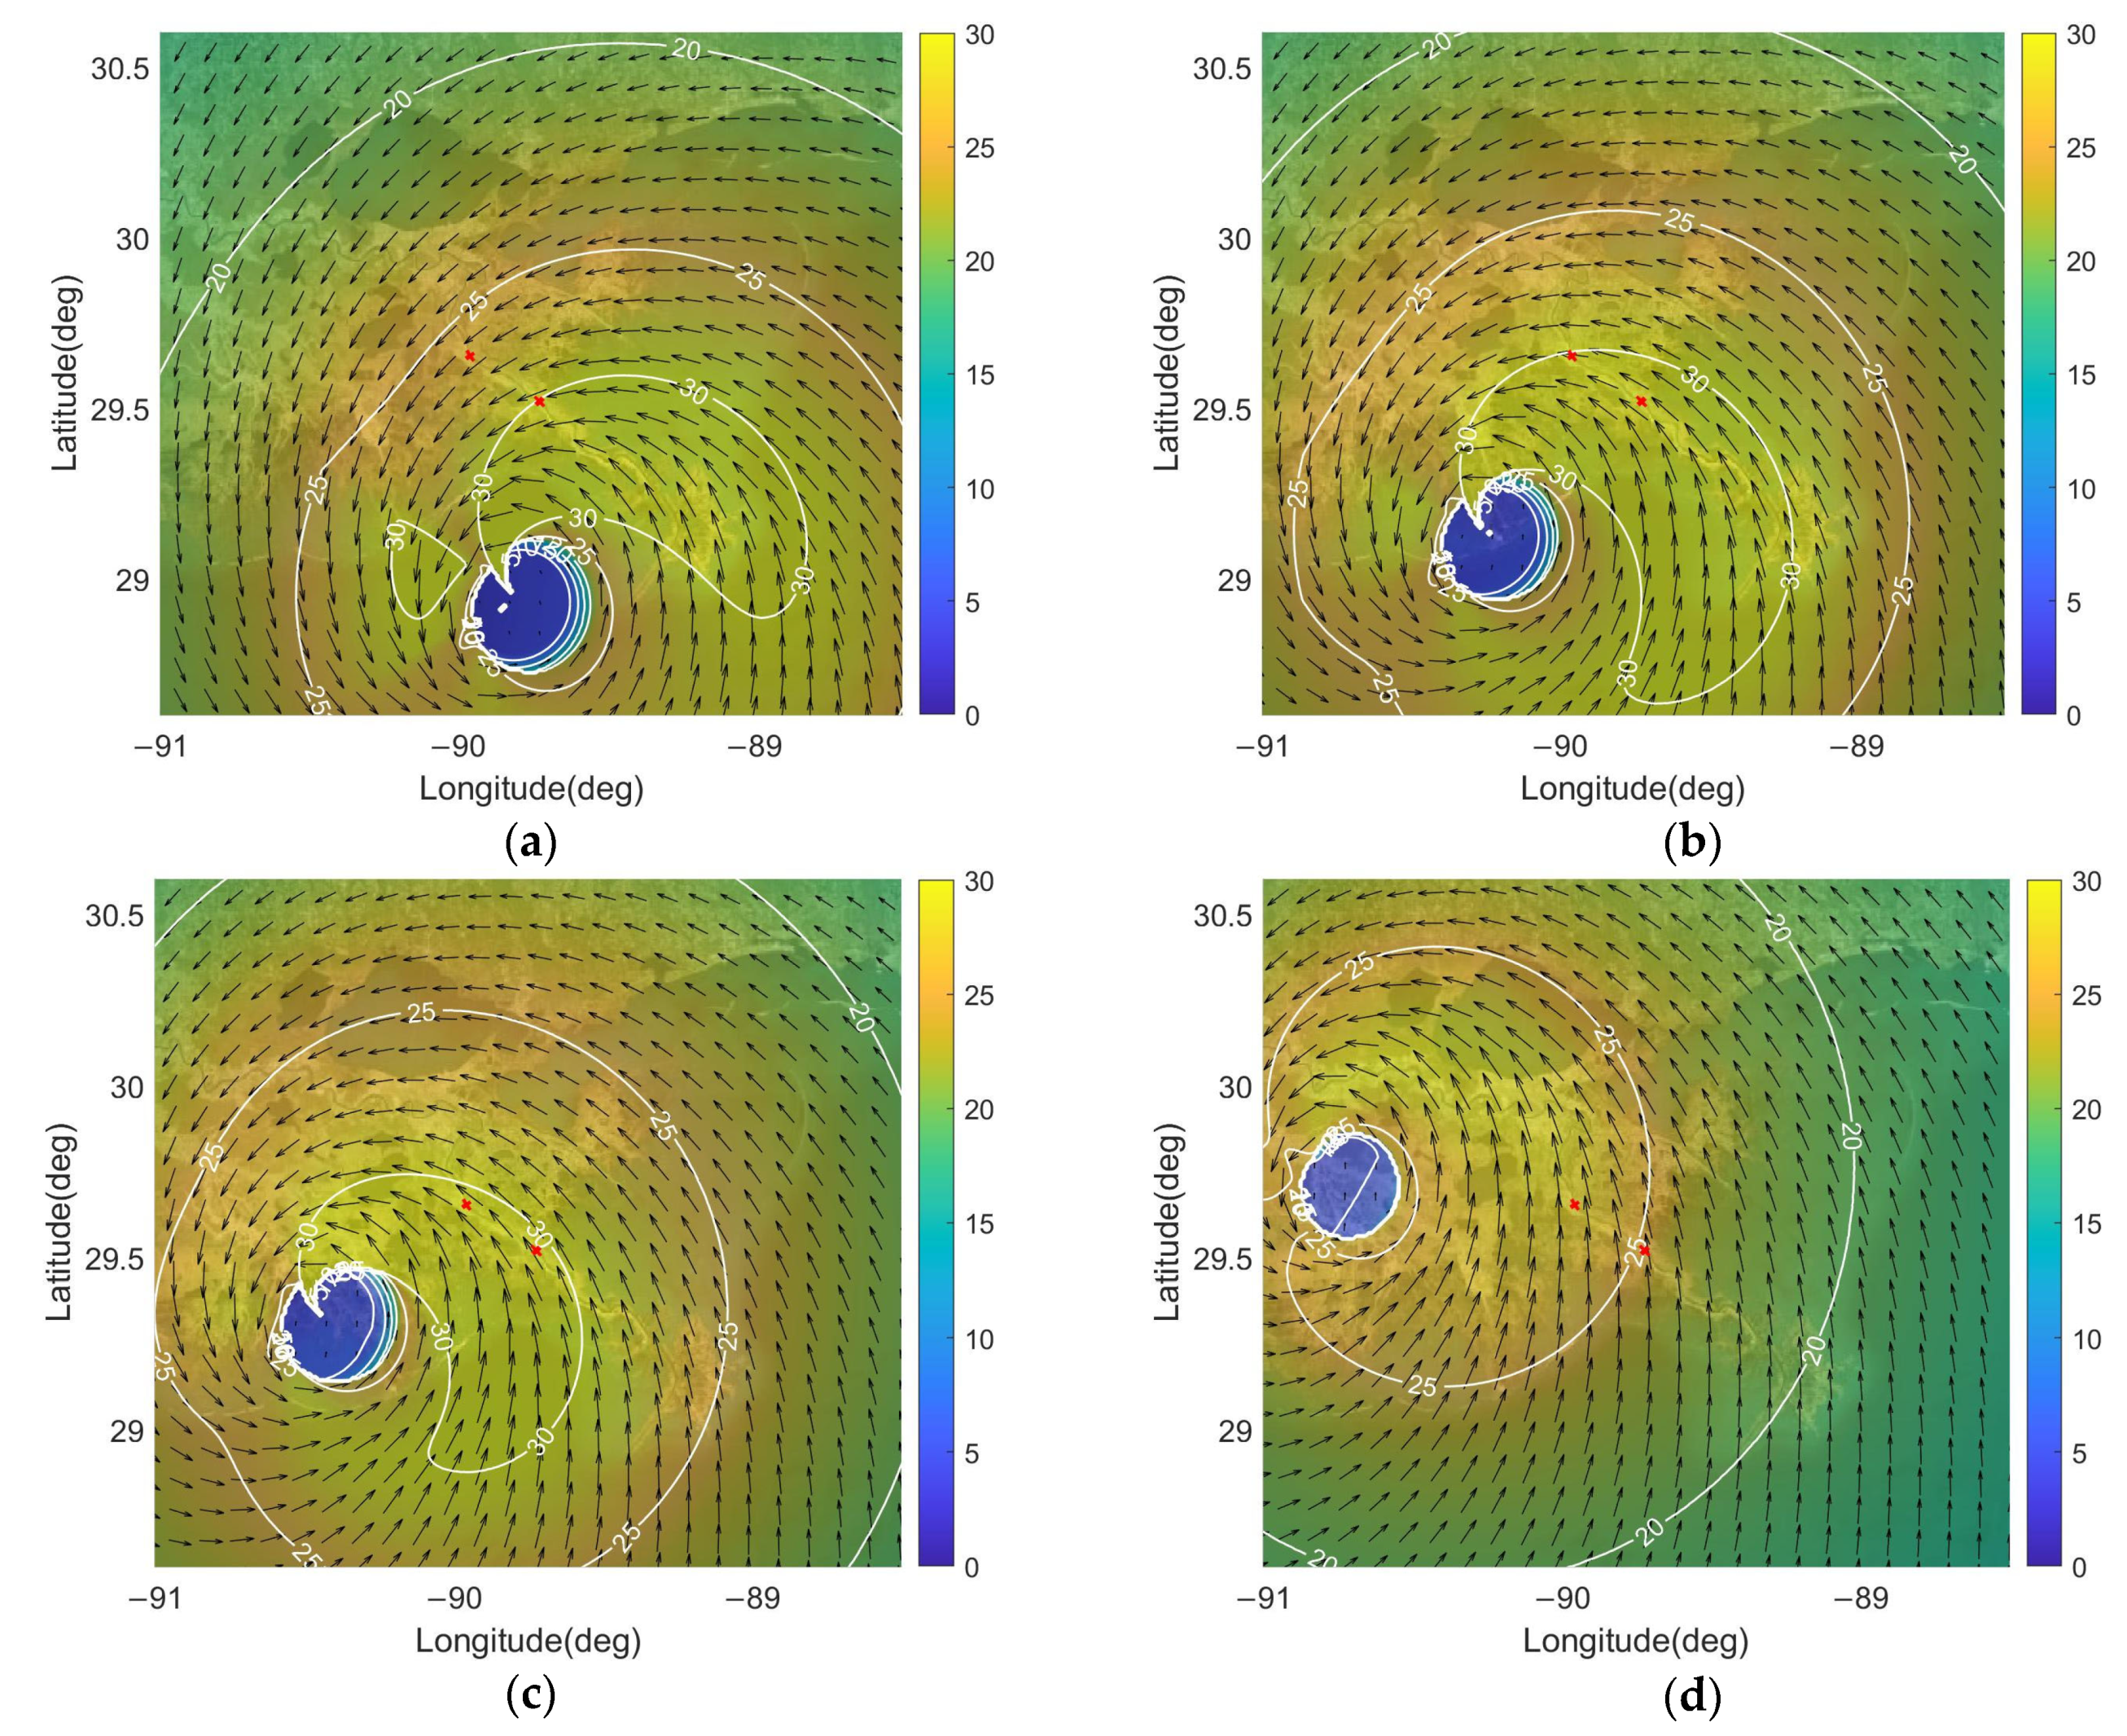
3.1. Hurricane Isaac (2012)

As shown in the subfigure of Figure 1, Isaac originated from a tropical wave that moved off the coast of Africa on 16 August 2012 and entered the southeastern Gulf of Mexico early on 27 August. It gradually strengthened while moving across the Gulf of Mexico and became a Category 1 hurricane when located 140 km southeast of the mouth of the MR around 12:00 UTC 28 August. It slowed down considerably while it approached the coast of Louisiana, which prolonged the strong winds, dangerous storm surge and heavy rains along the northern Gulf coast. Isaac made two landfalls along the coast of Louisiana, the first one at Southwest Pass on the mouth of the MR around 00:00 UTC 29 August and the second one at just west of Port Fourchon around 08:00 UTC 29 August. Isaac then gradually weakened and dissipated inland. Refer to [14] for more information. Figure 3 shows the calculated distributions of hurricane winds when Isaac was passing through to the west of Barataria Basin on 29 August. Hurricane winds reached over 30 m/s for hours in coastal Louisiana. The prevailing wind direction over Breton Sound changed from east and southeast to south with the approaching of Isaac. In Barataria, the wind direction changed dramatically due to its short distance to the hurricane’s center.

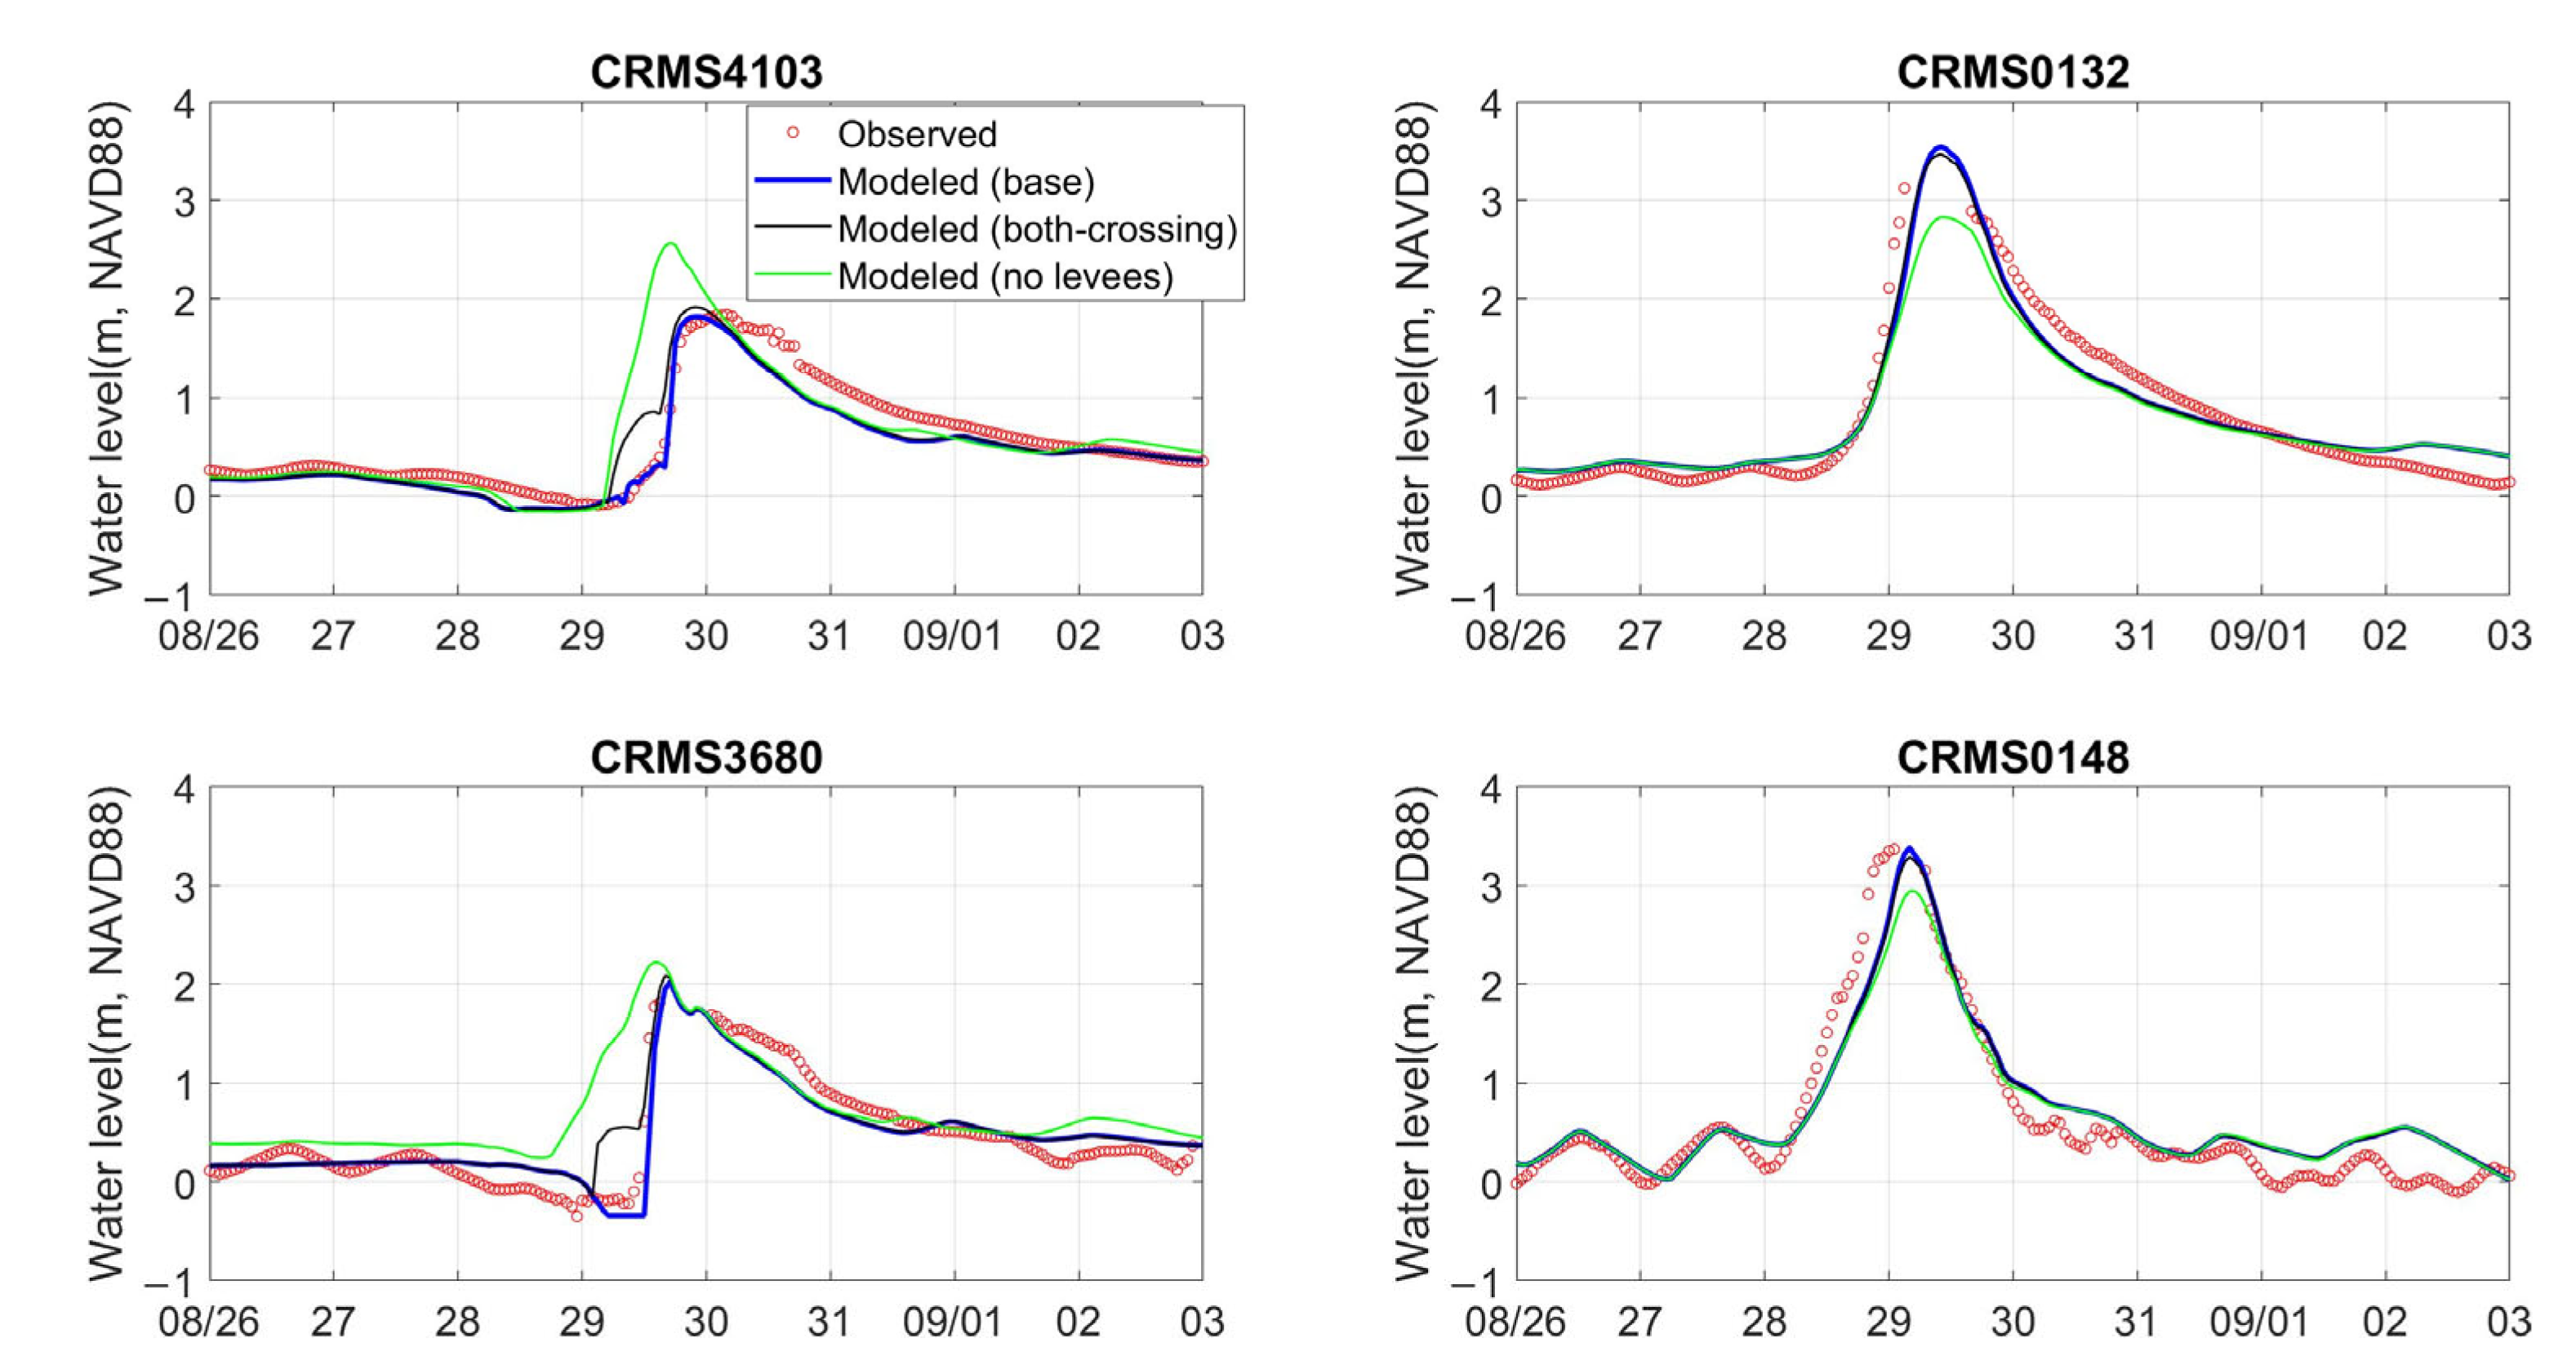
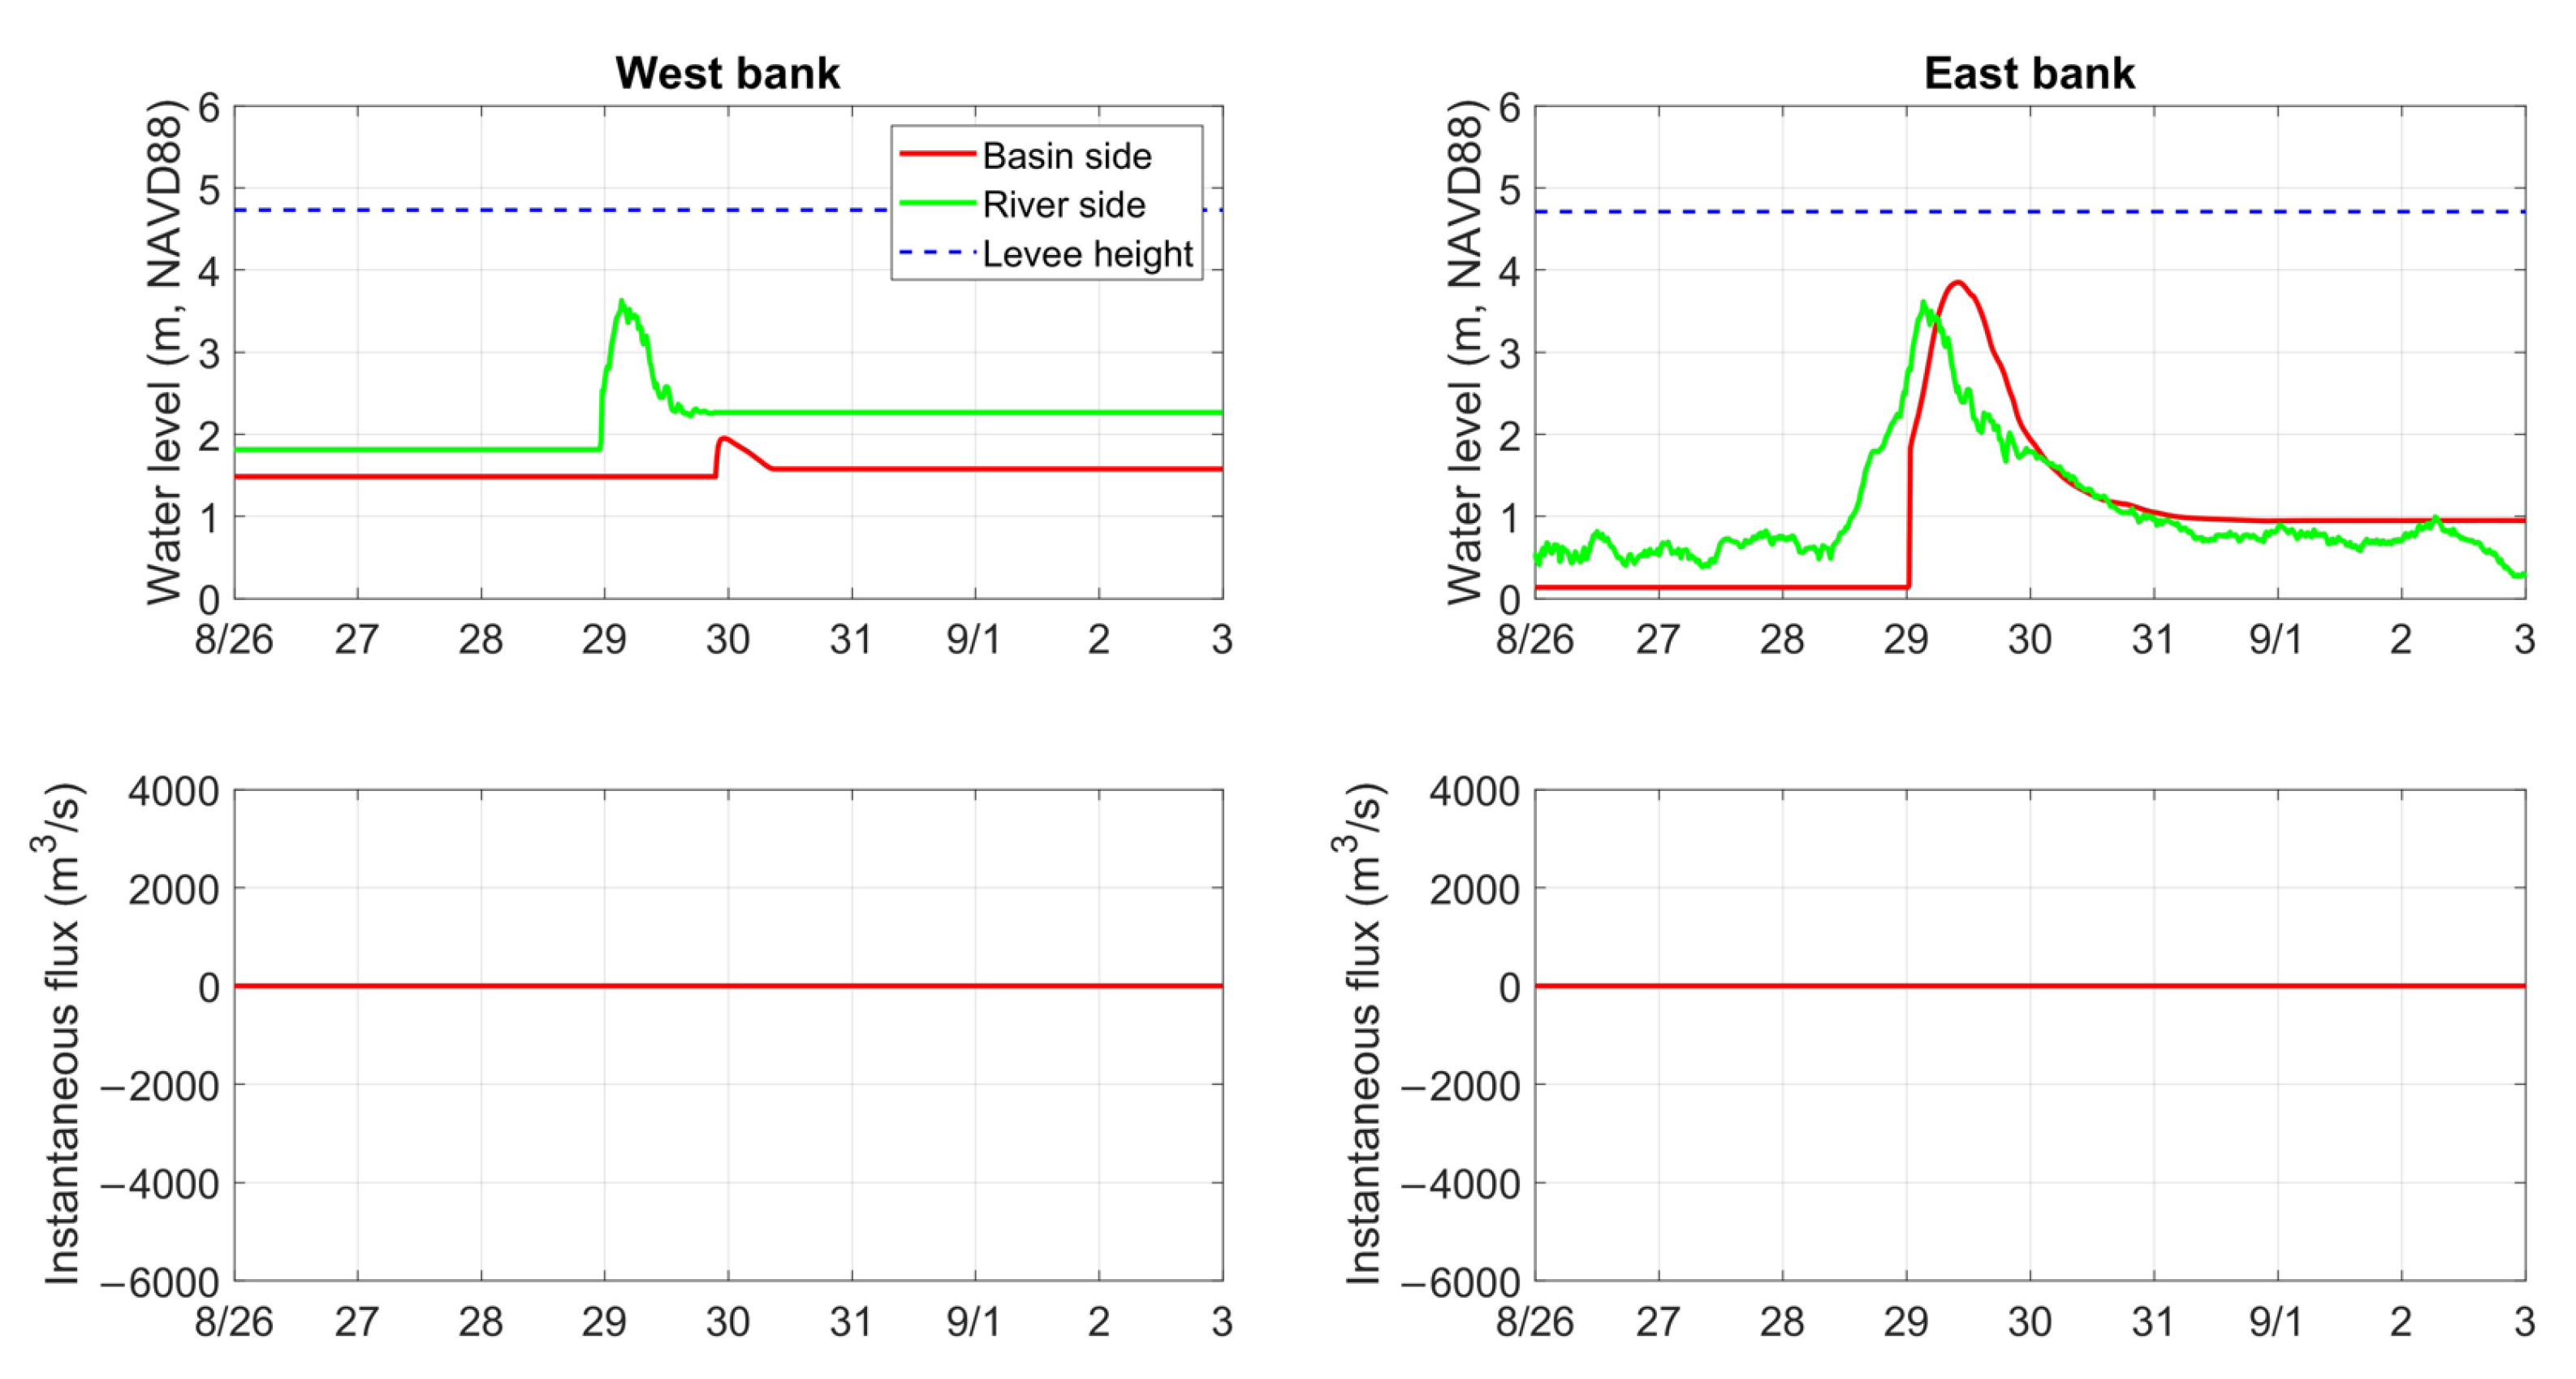
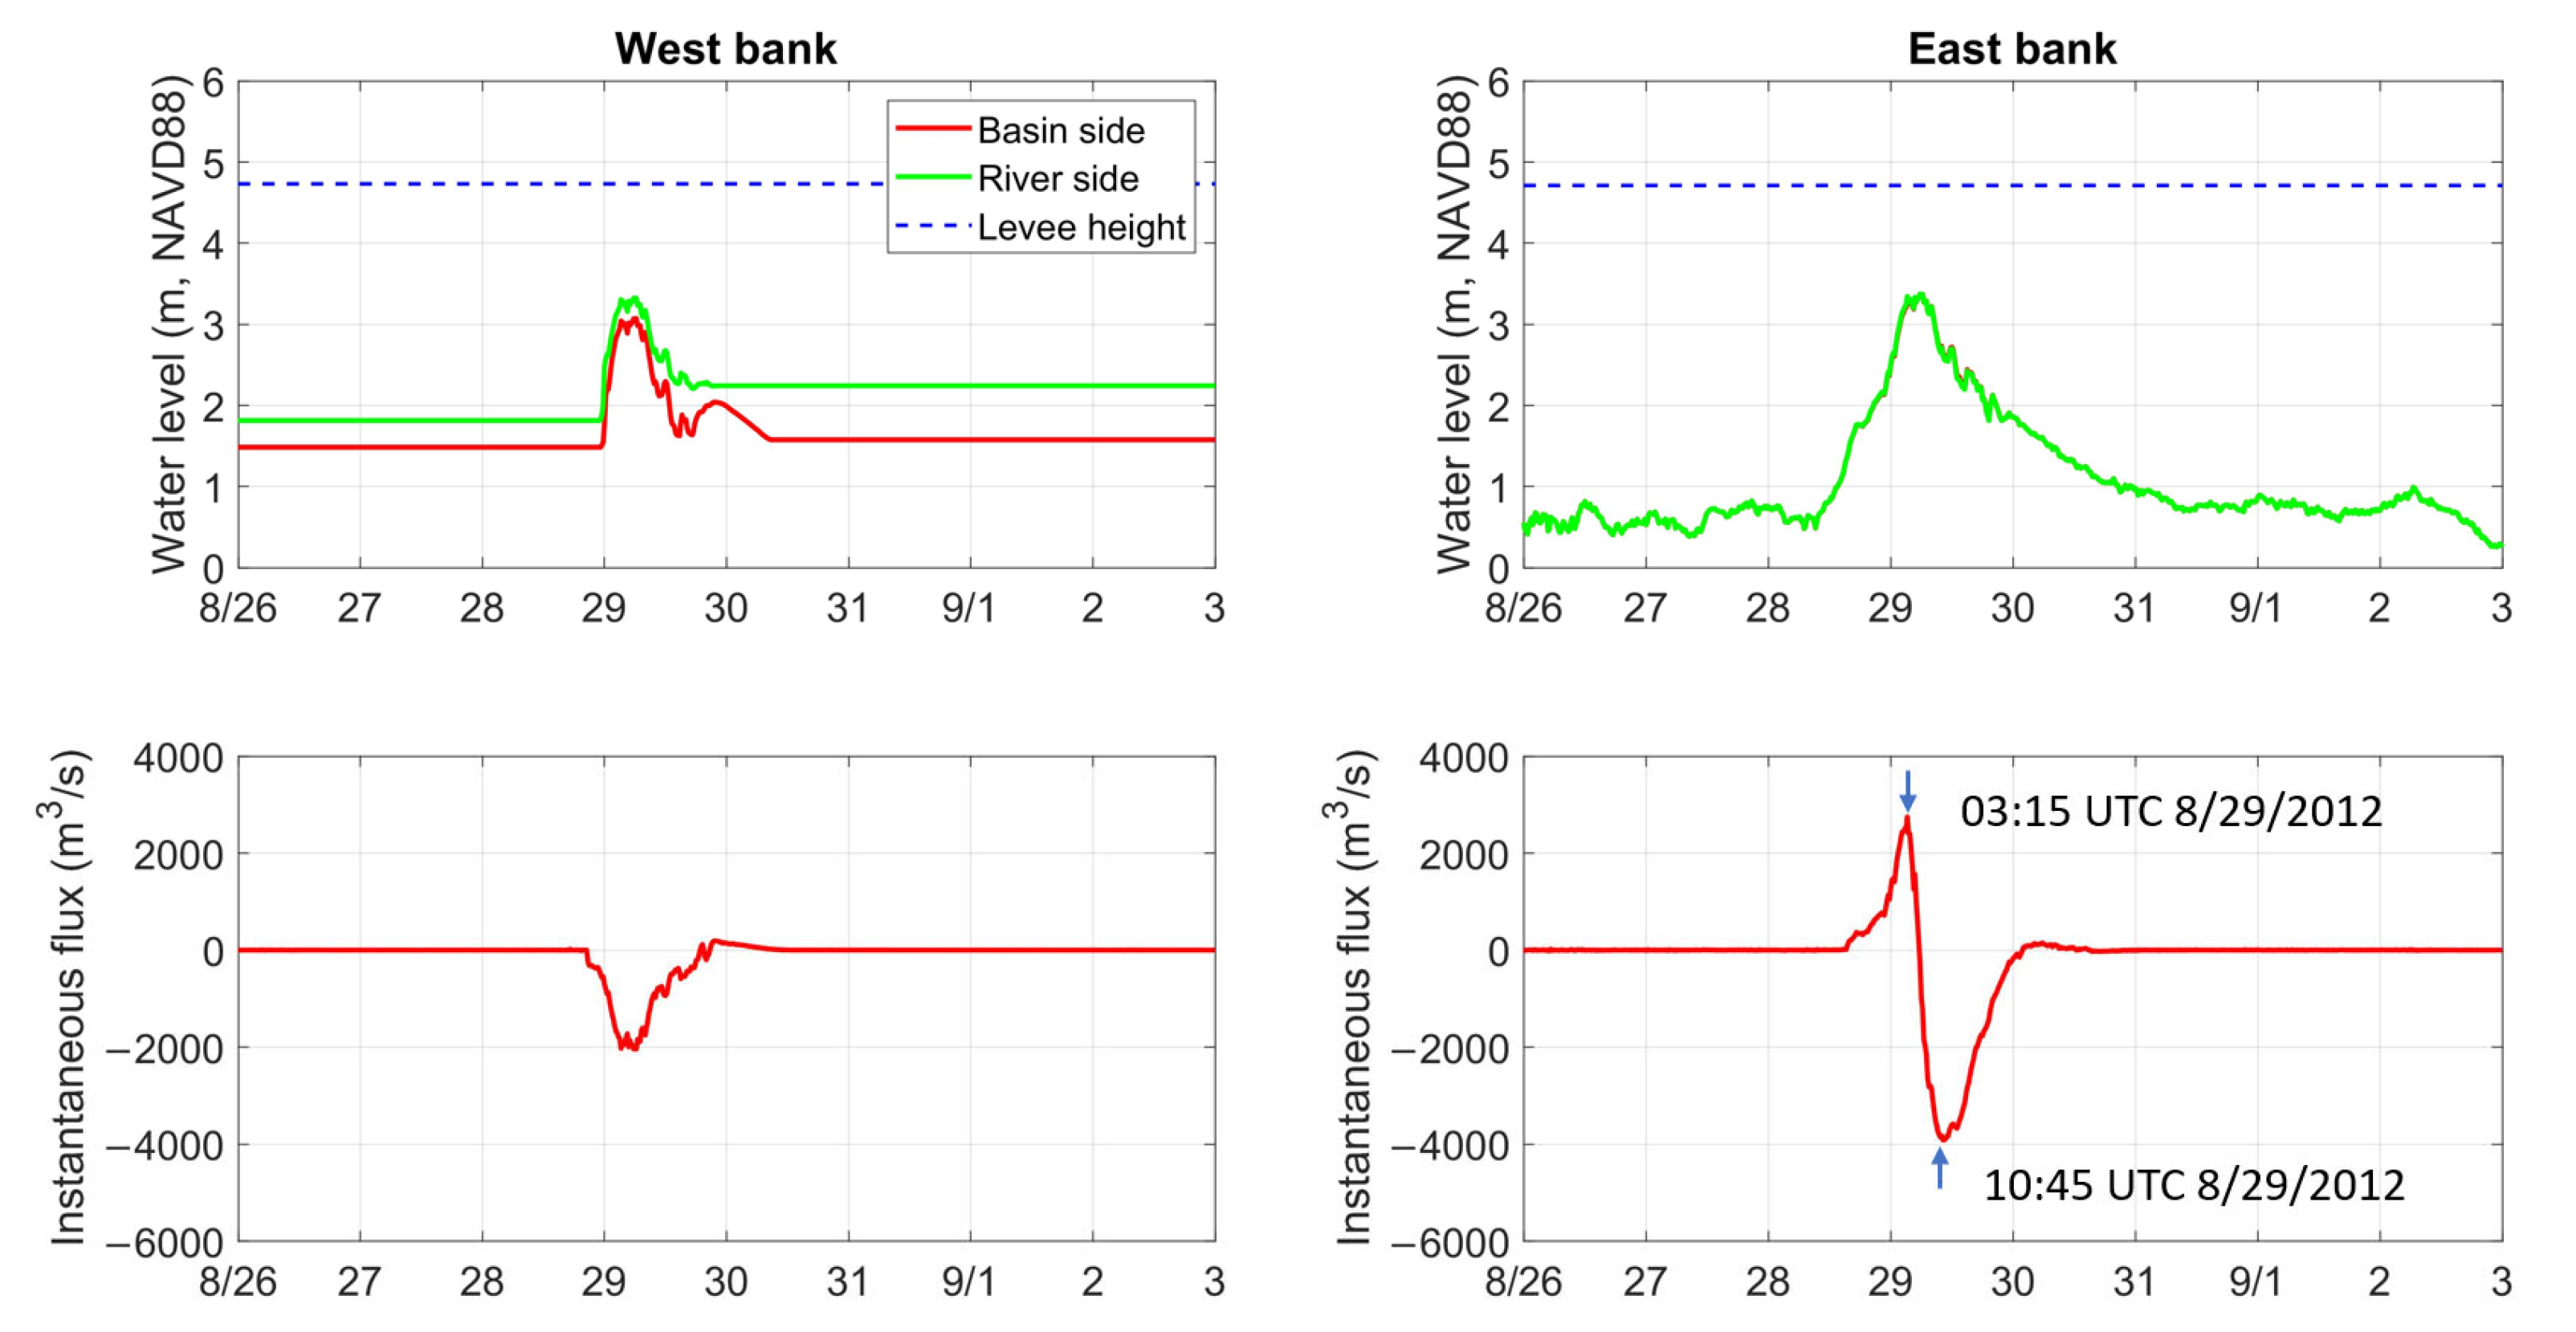
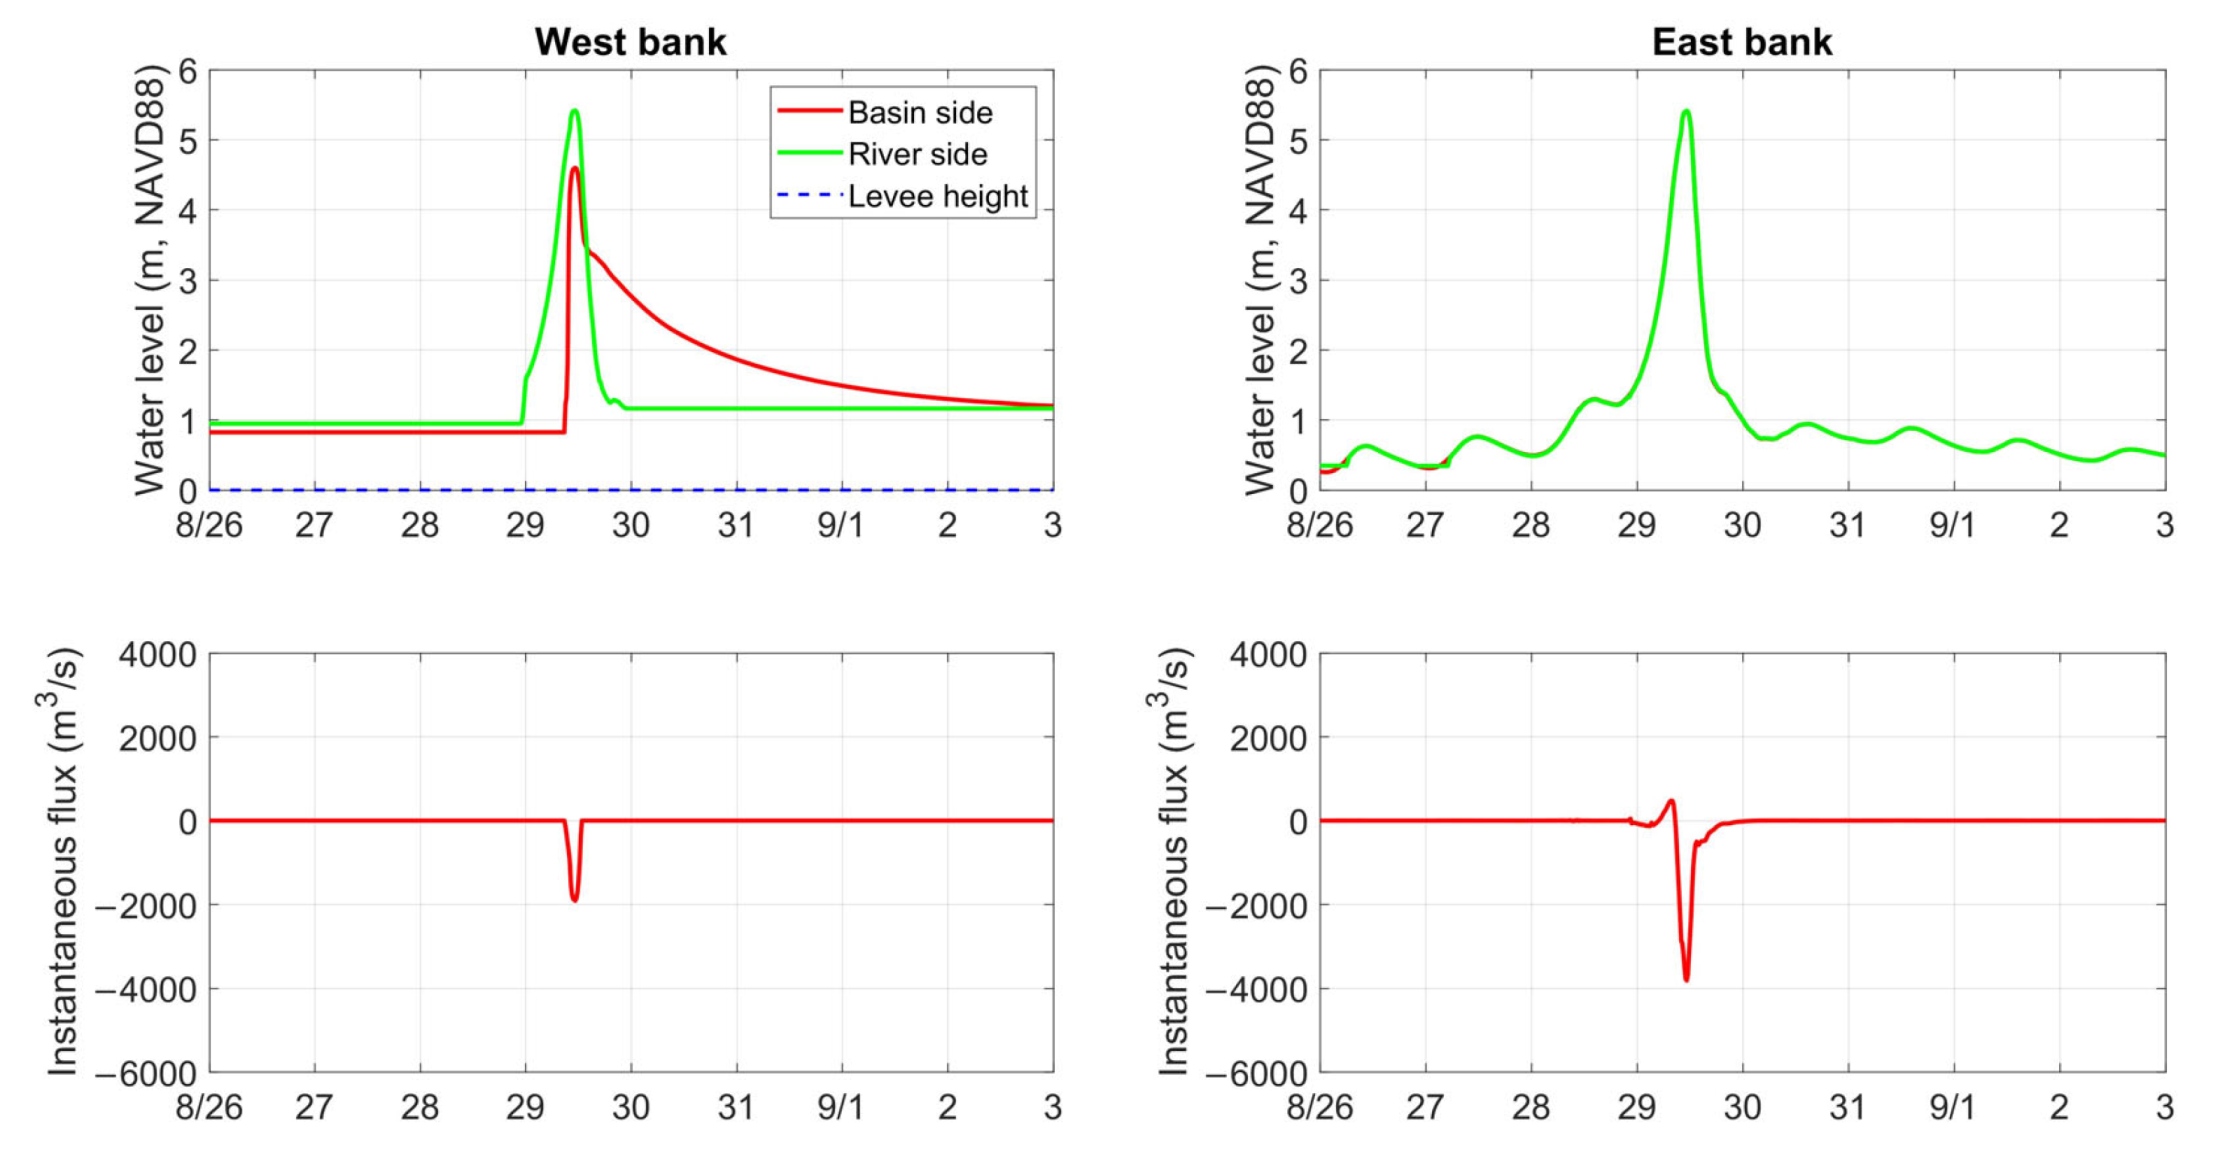
3.2. Storm Surge Results
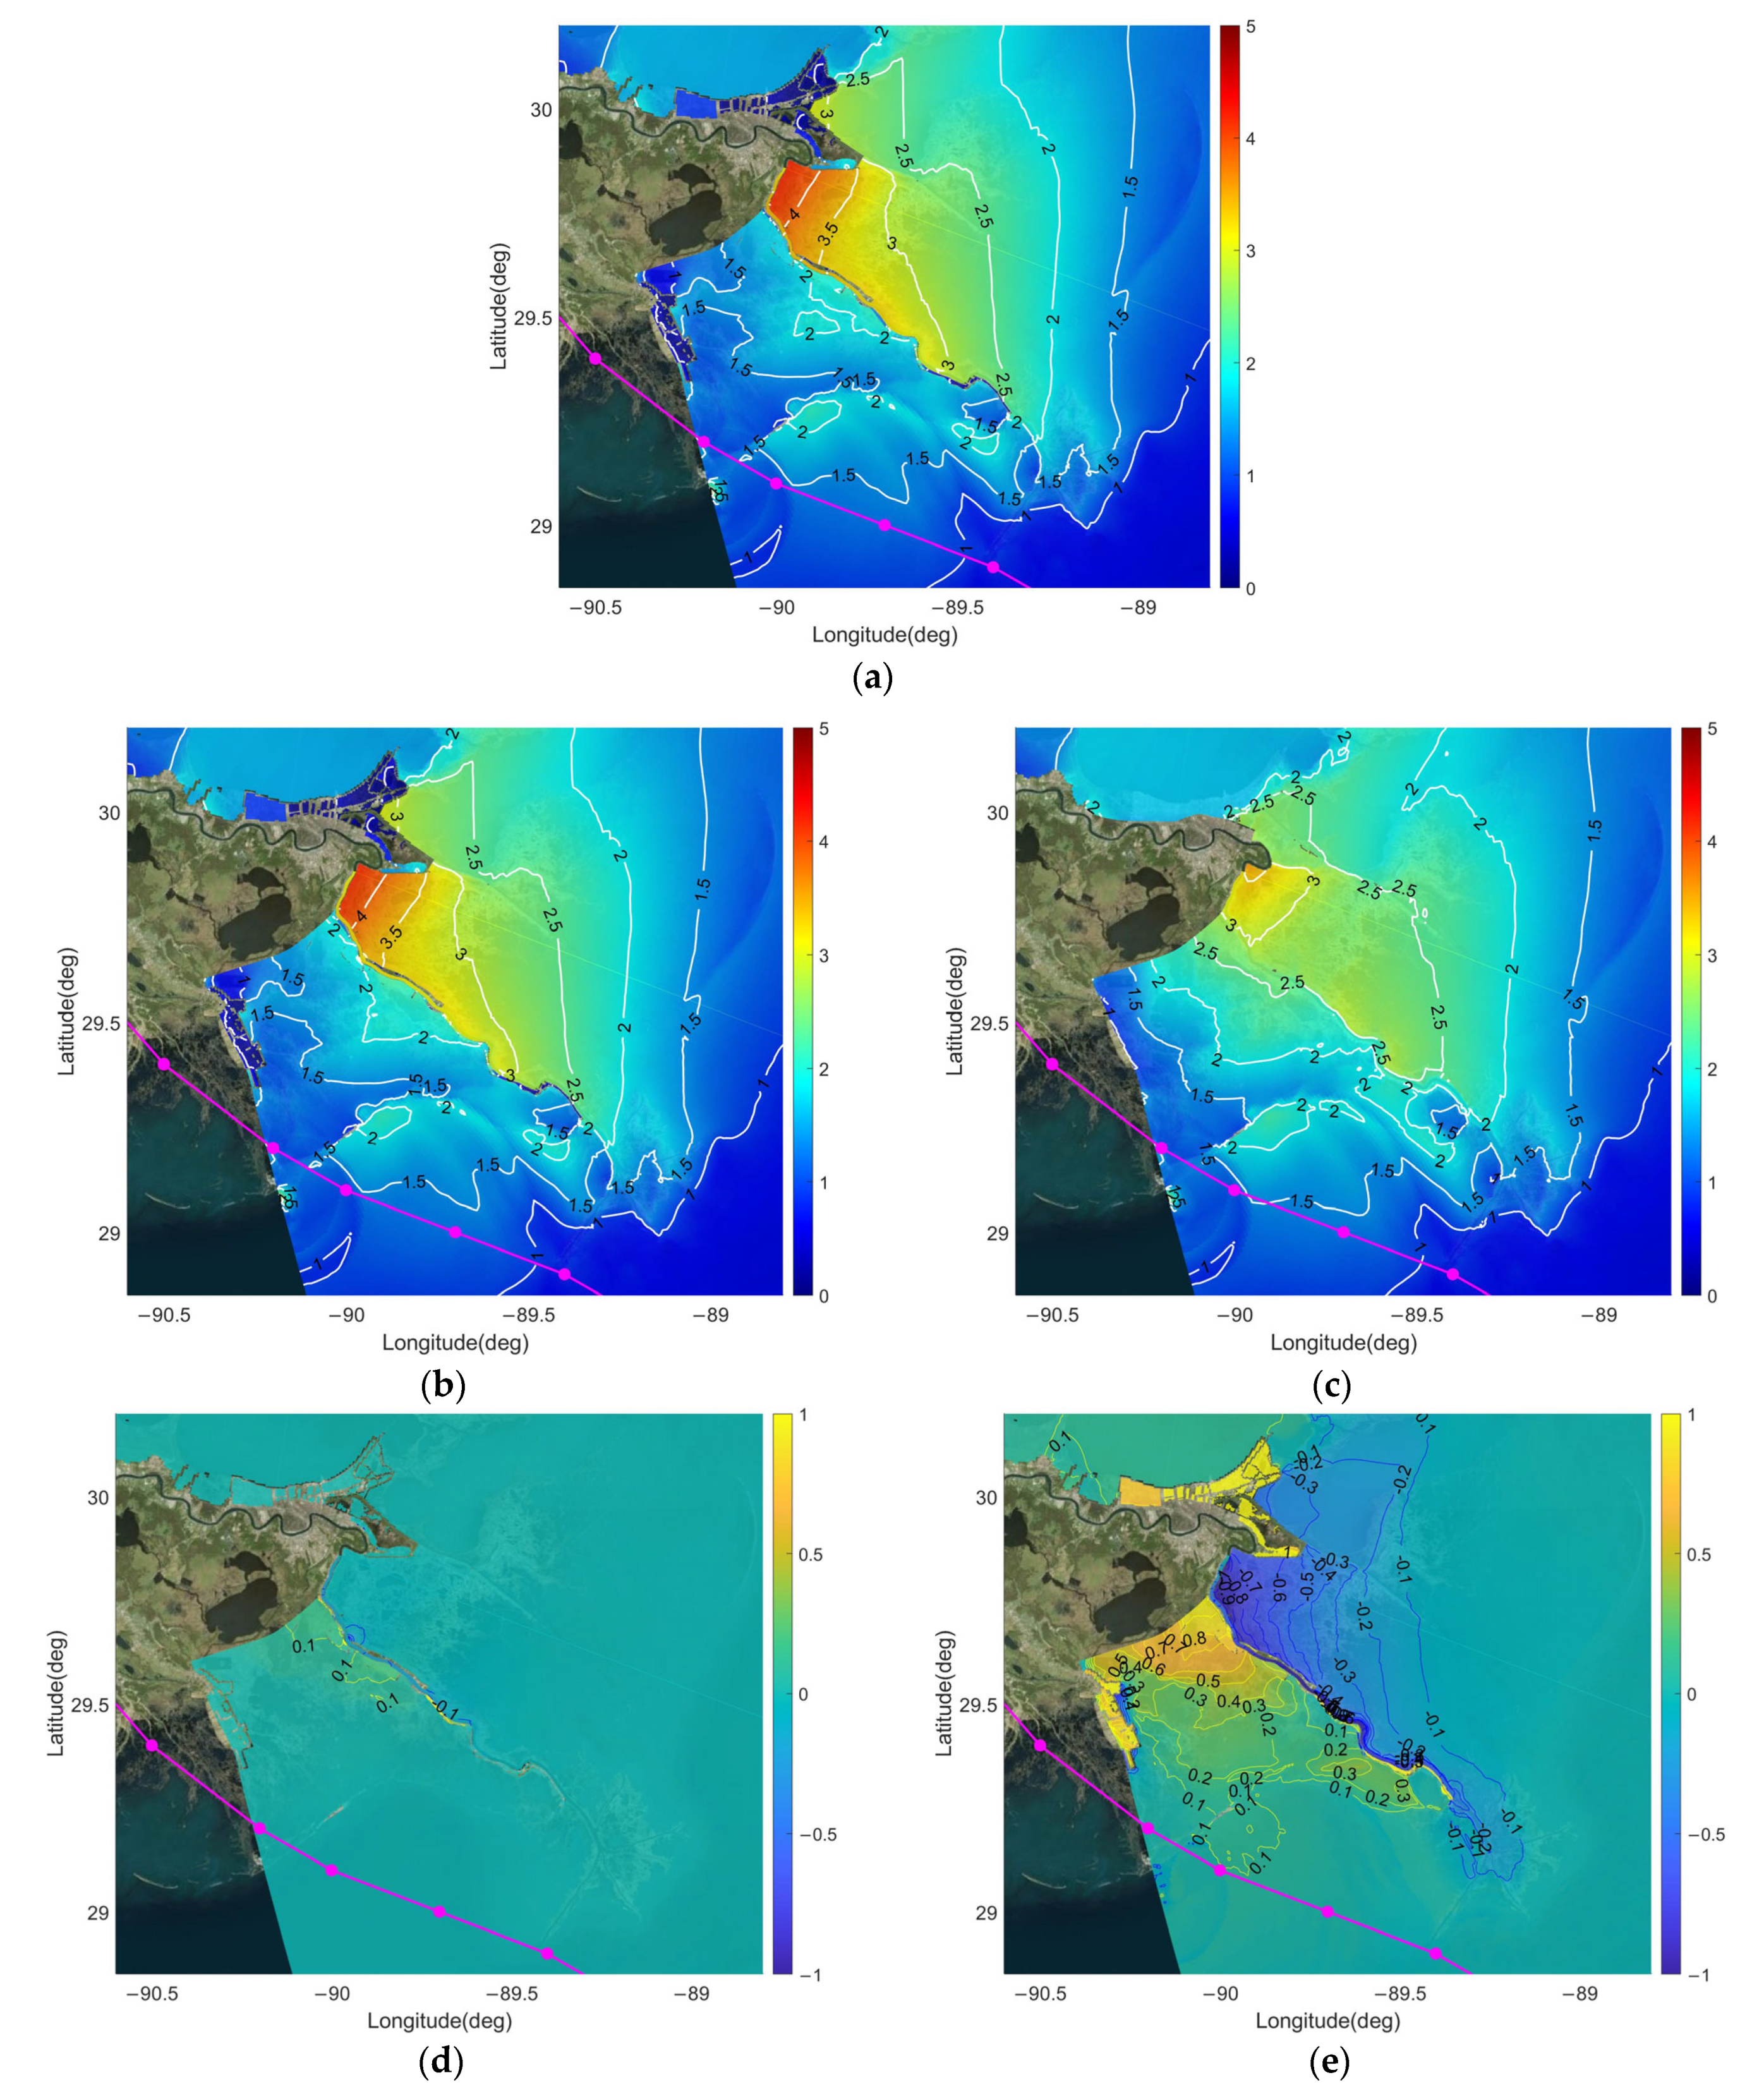
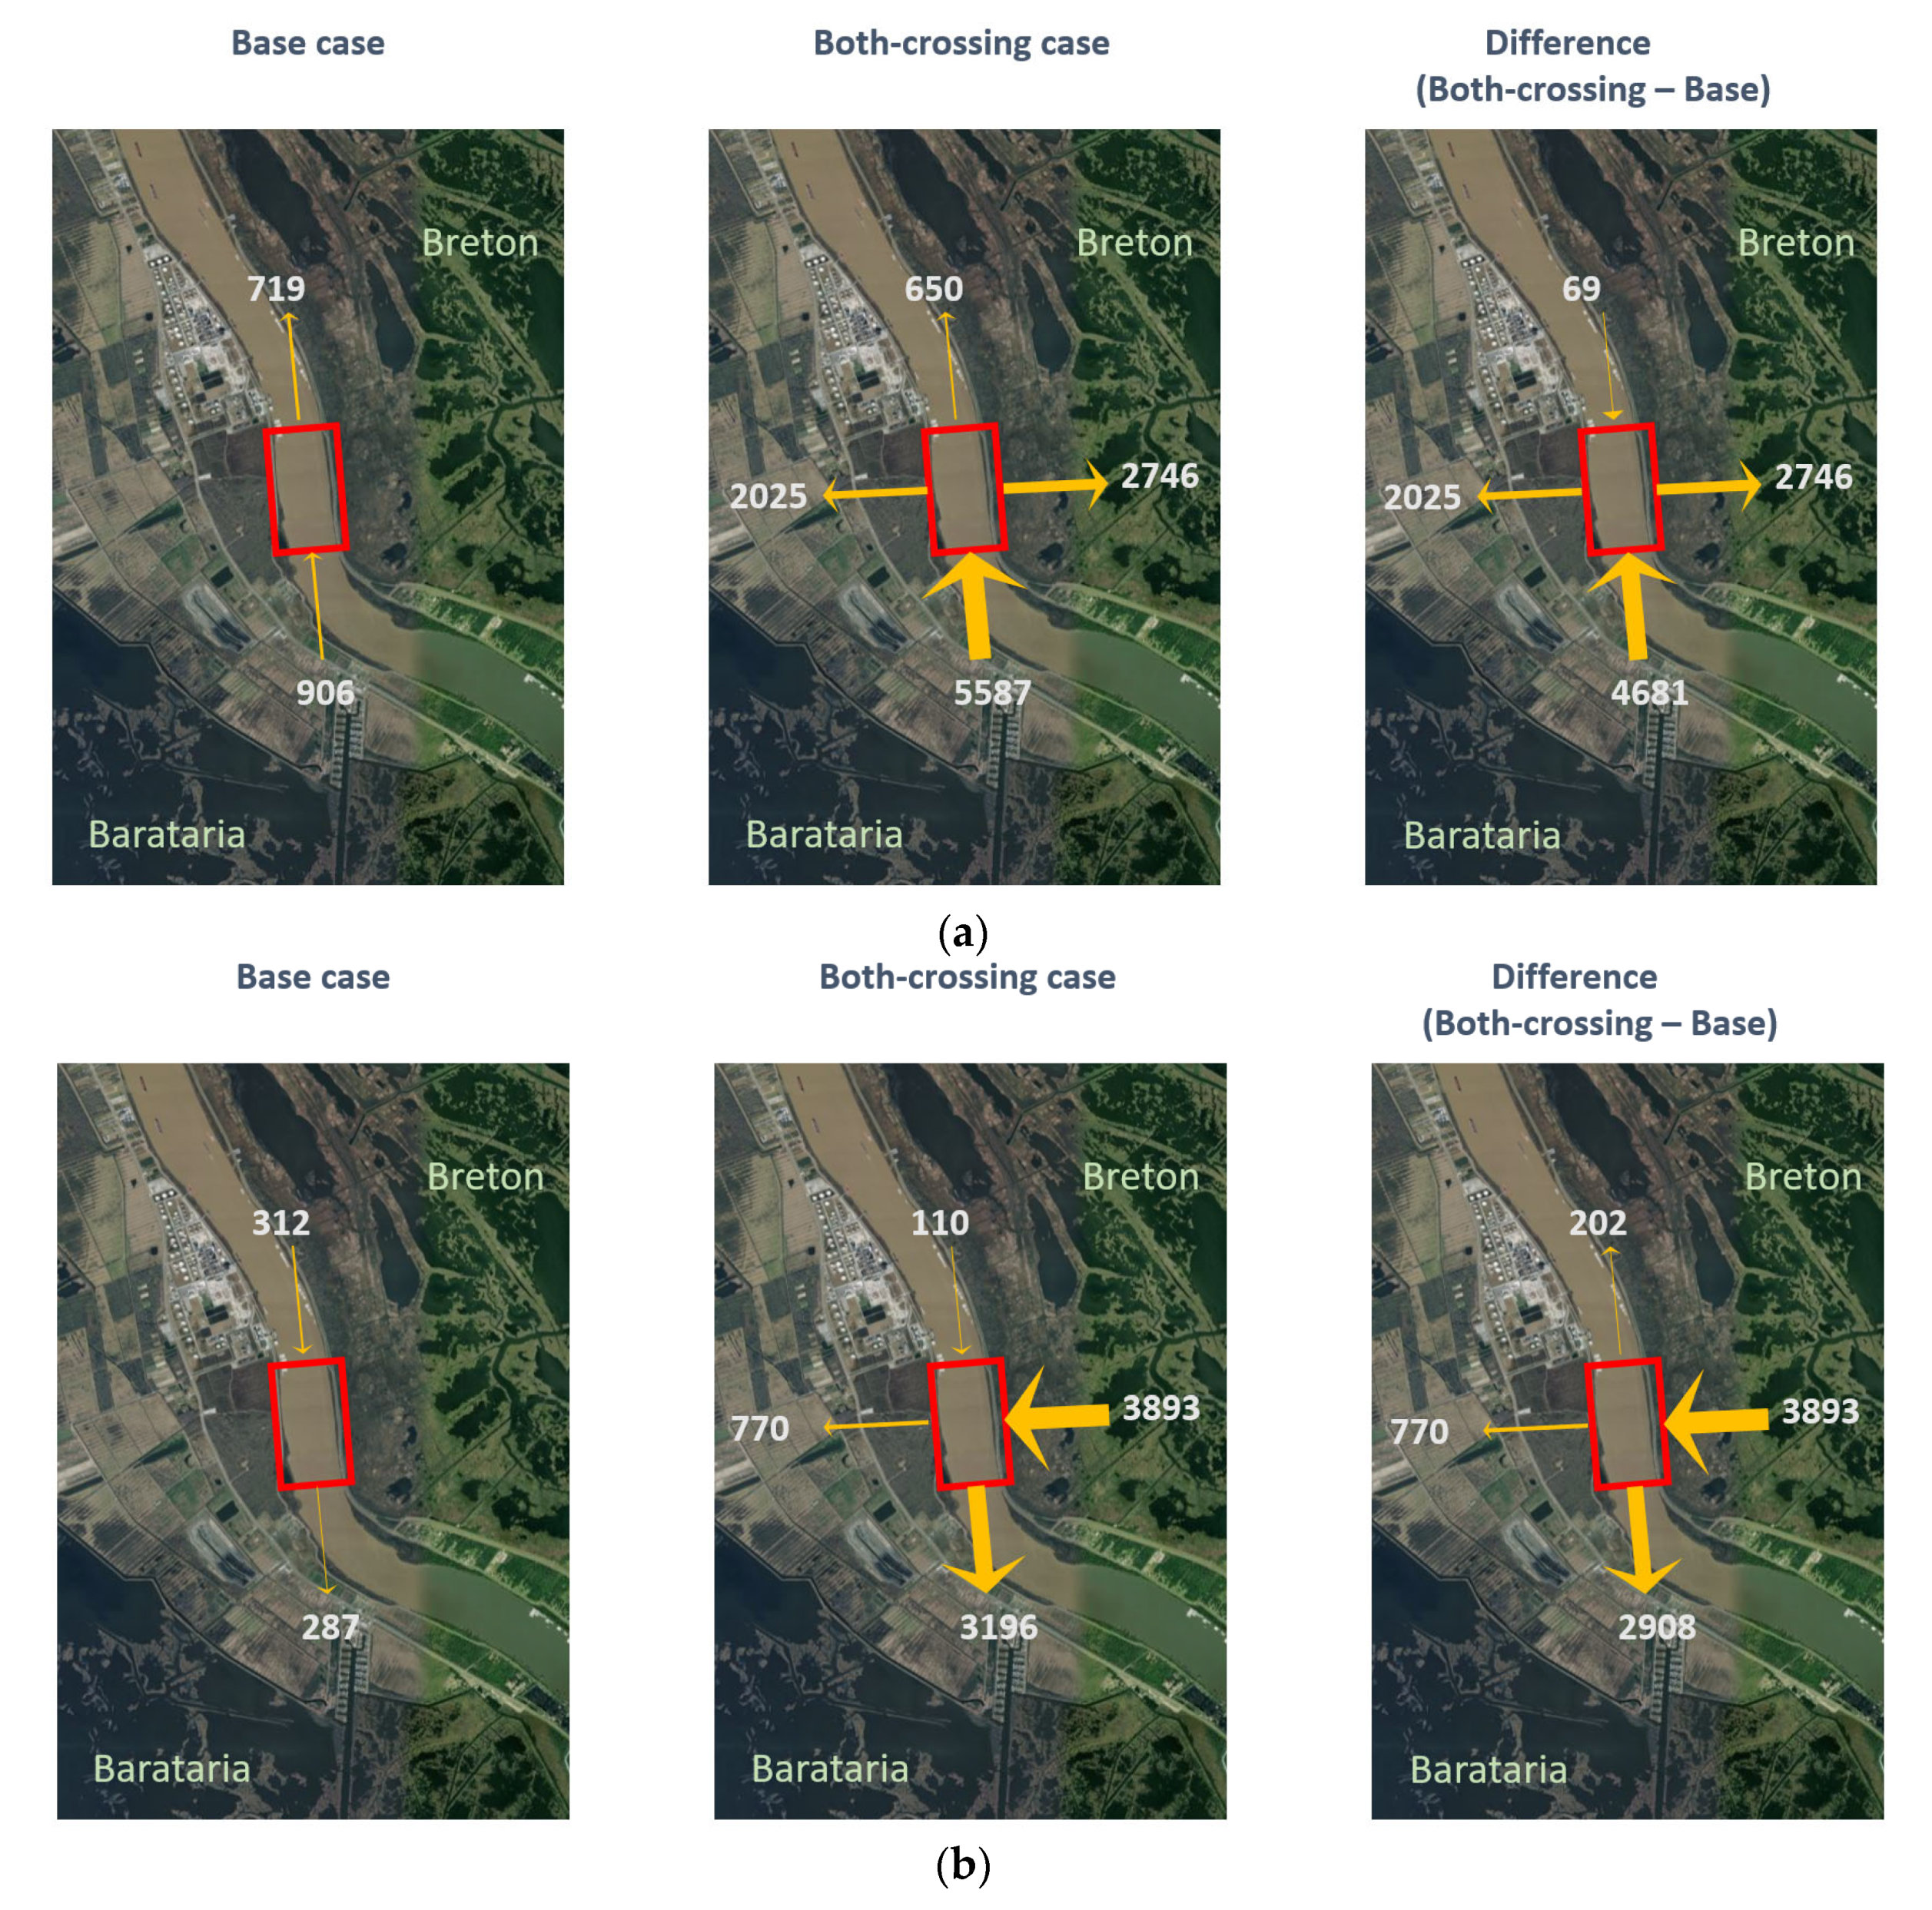
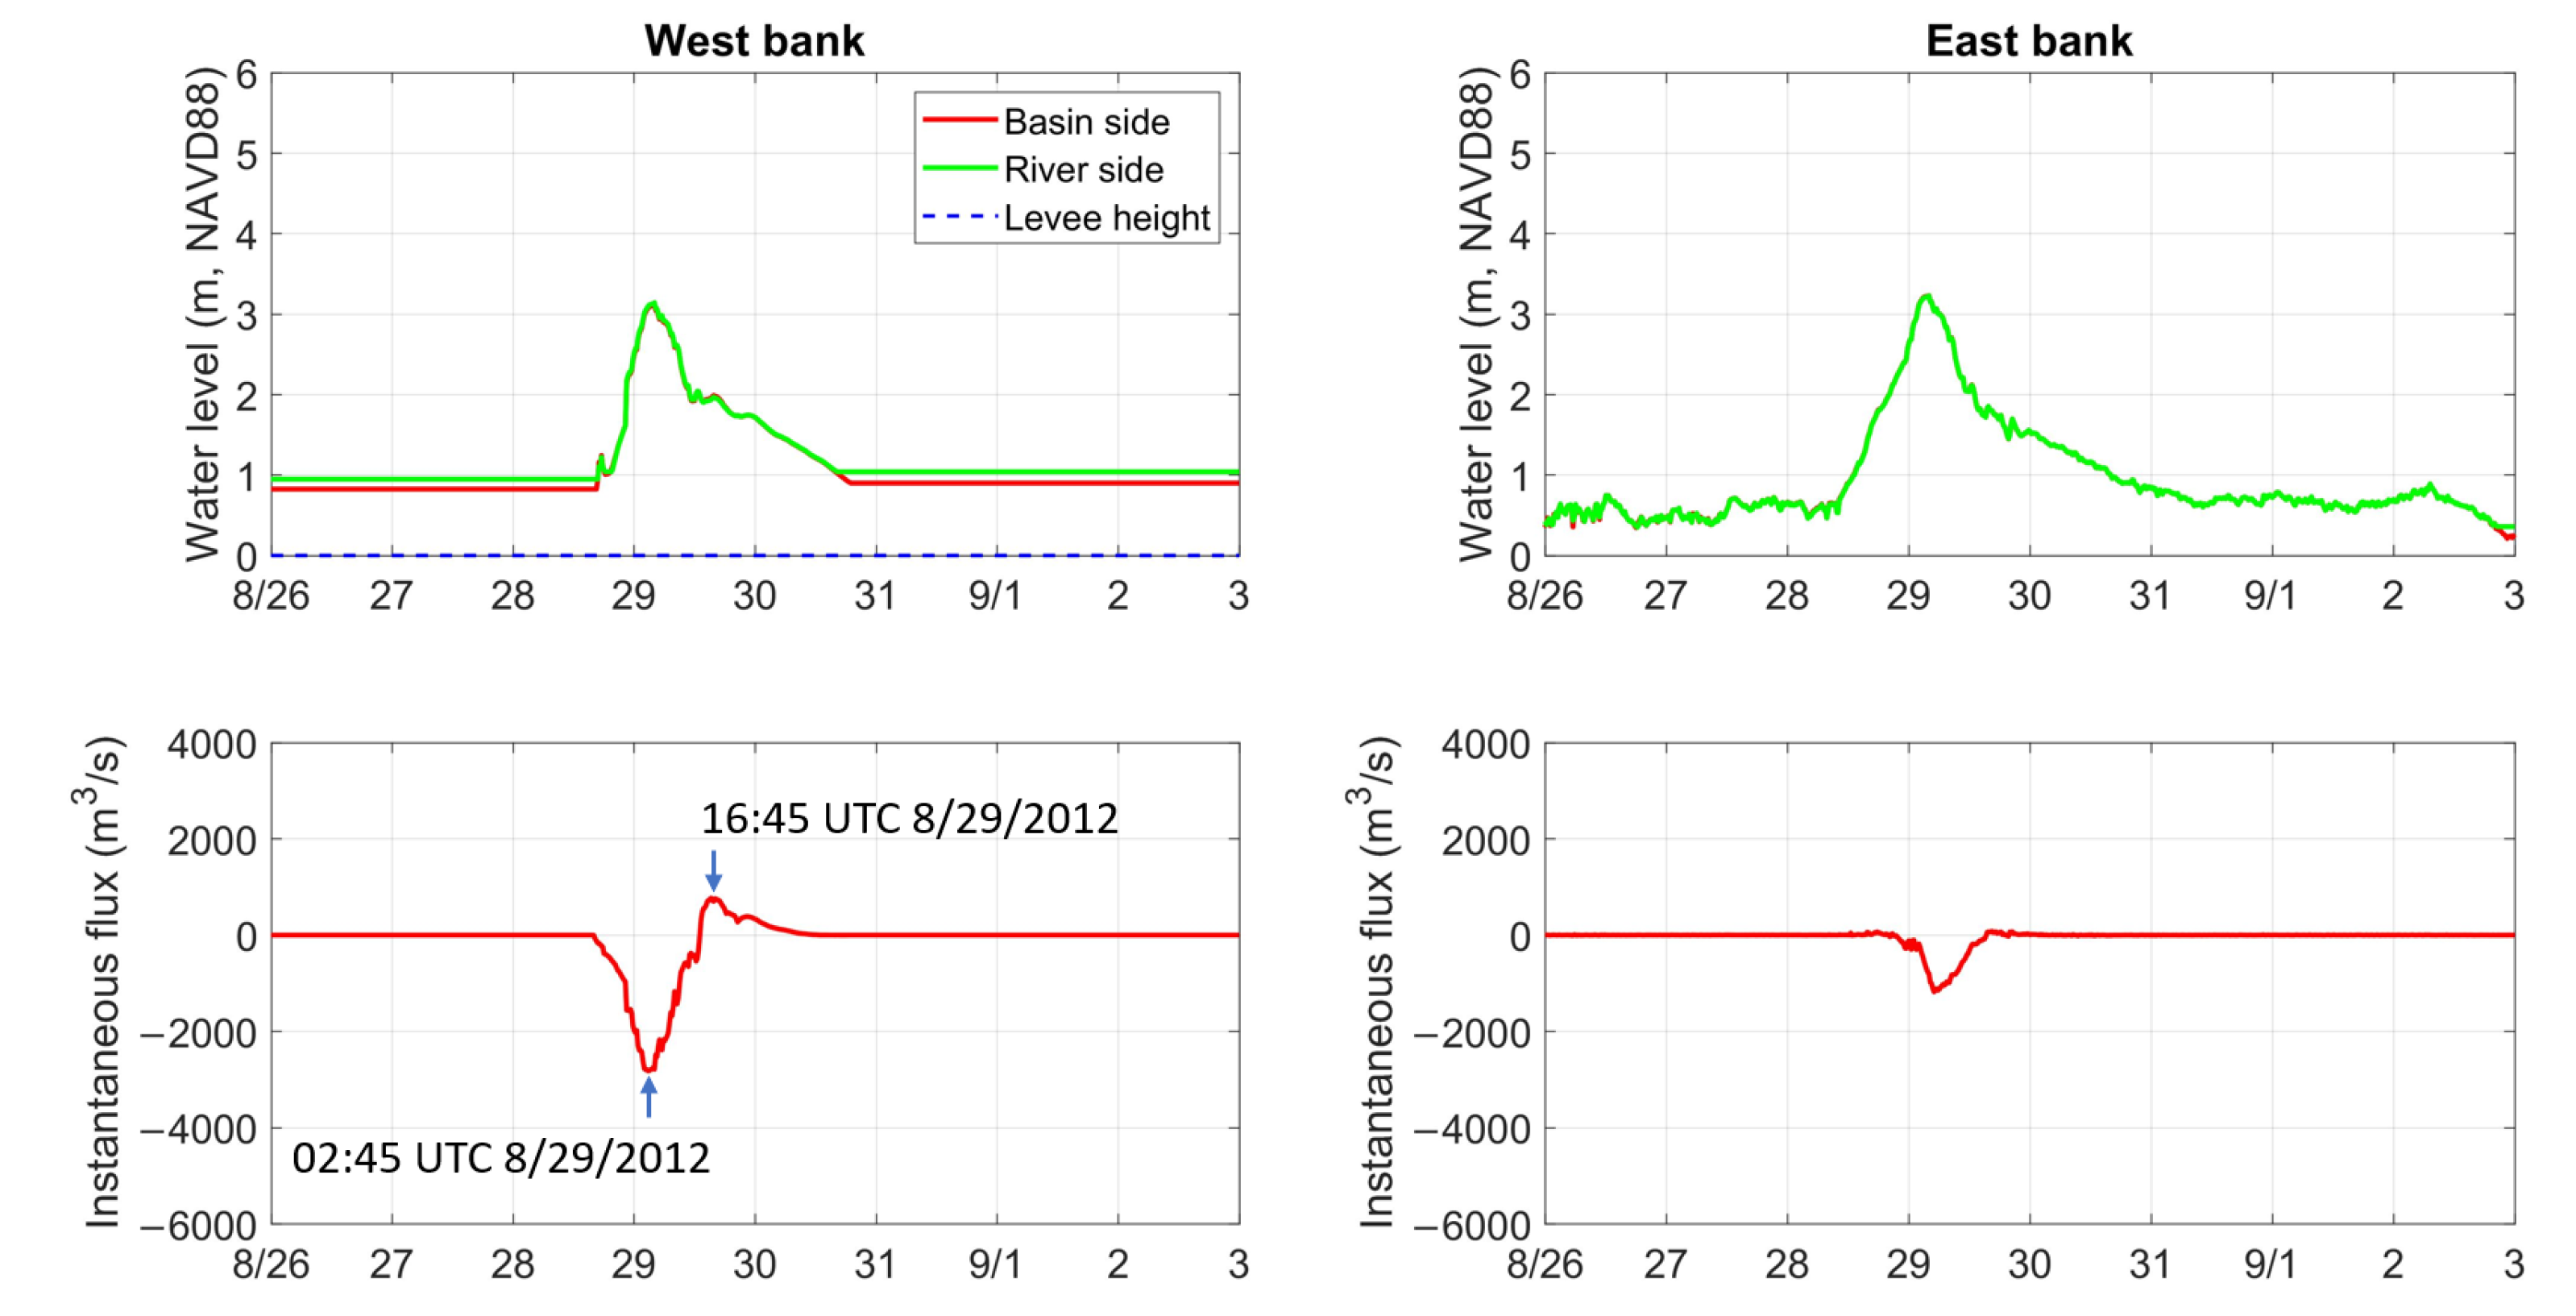
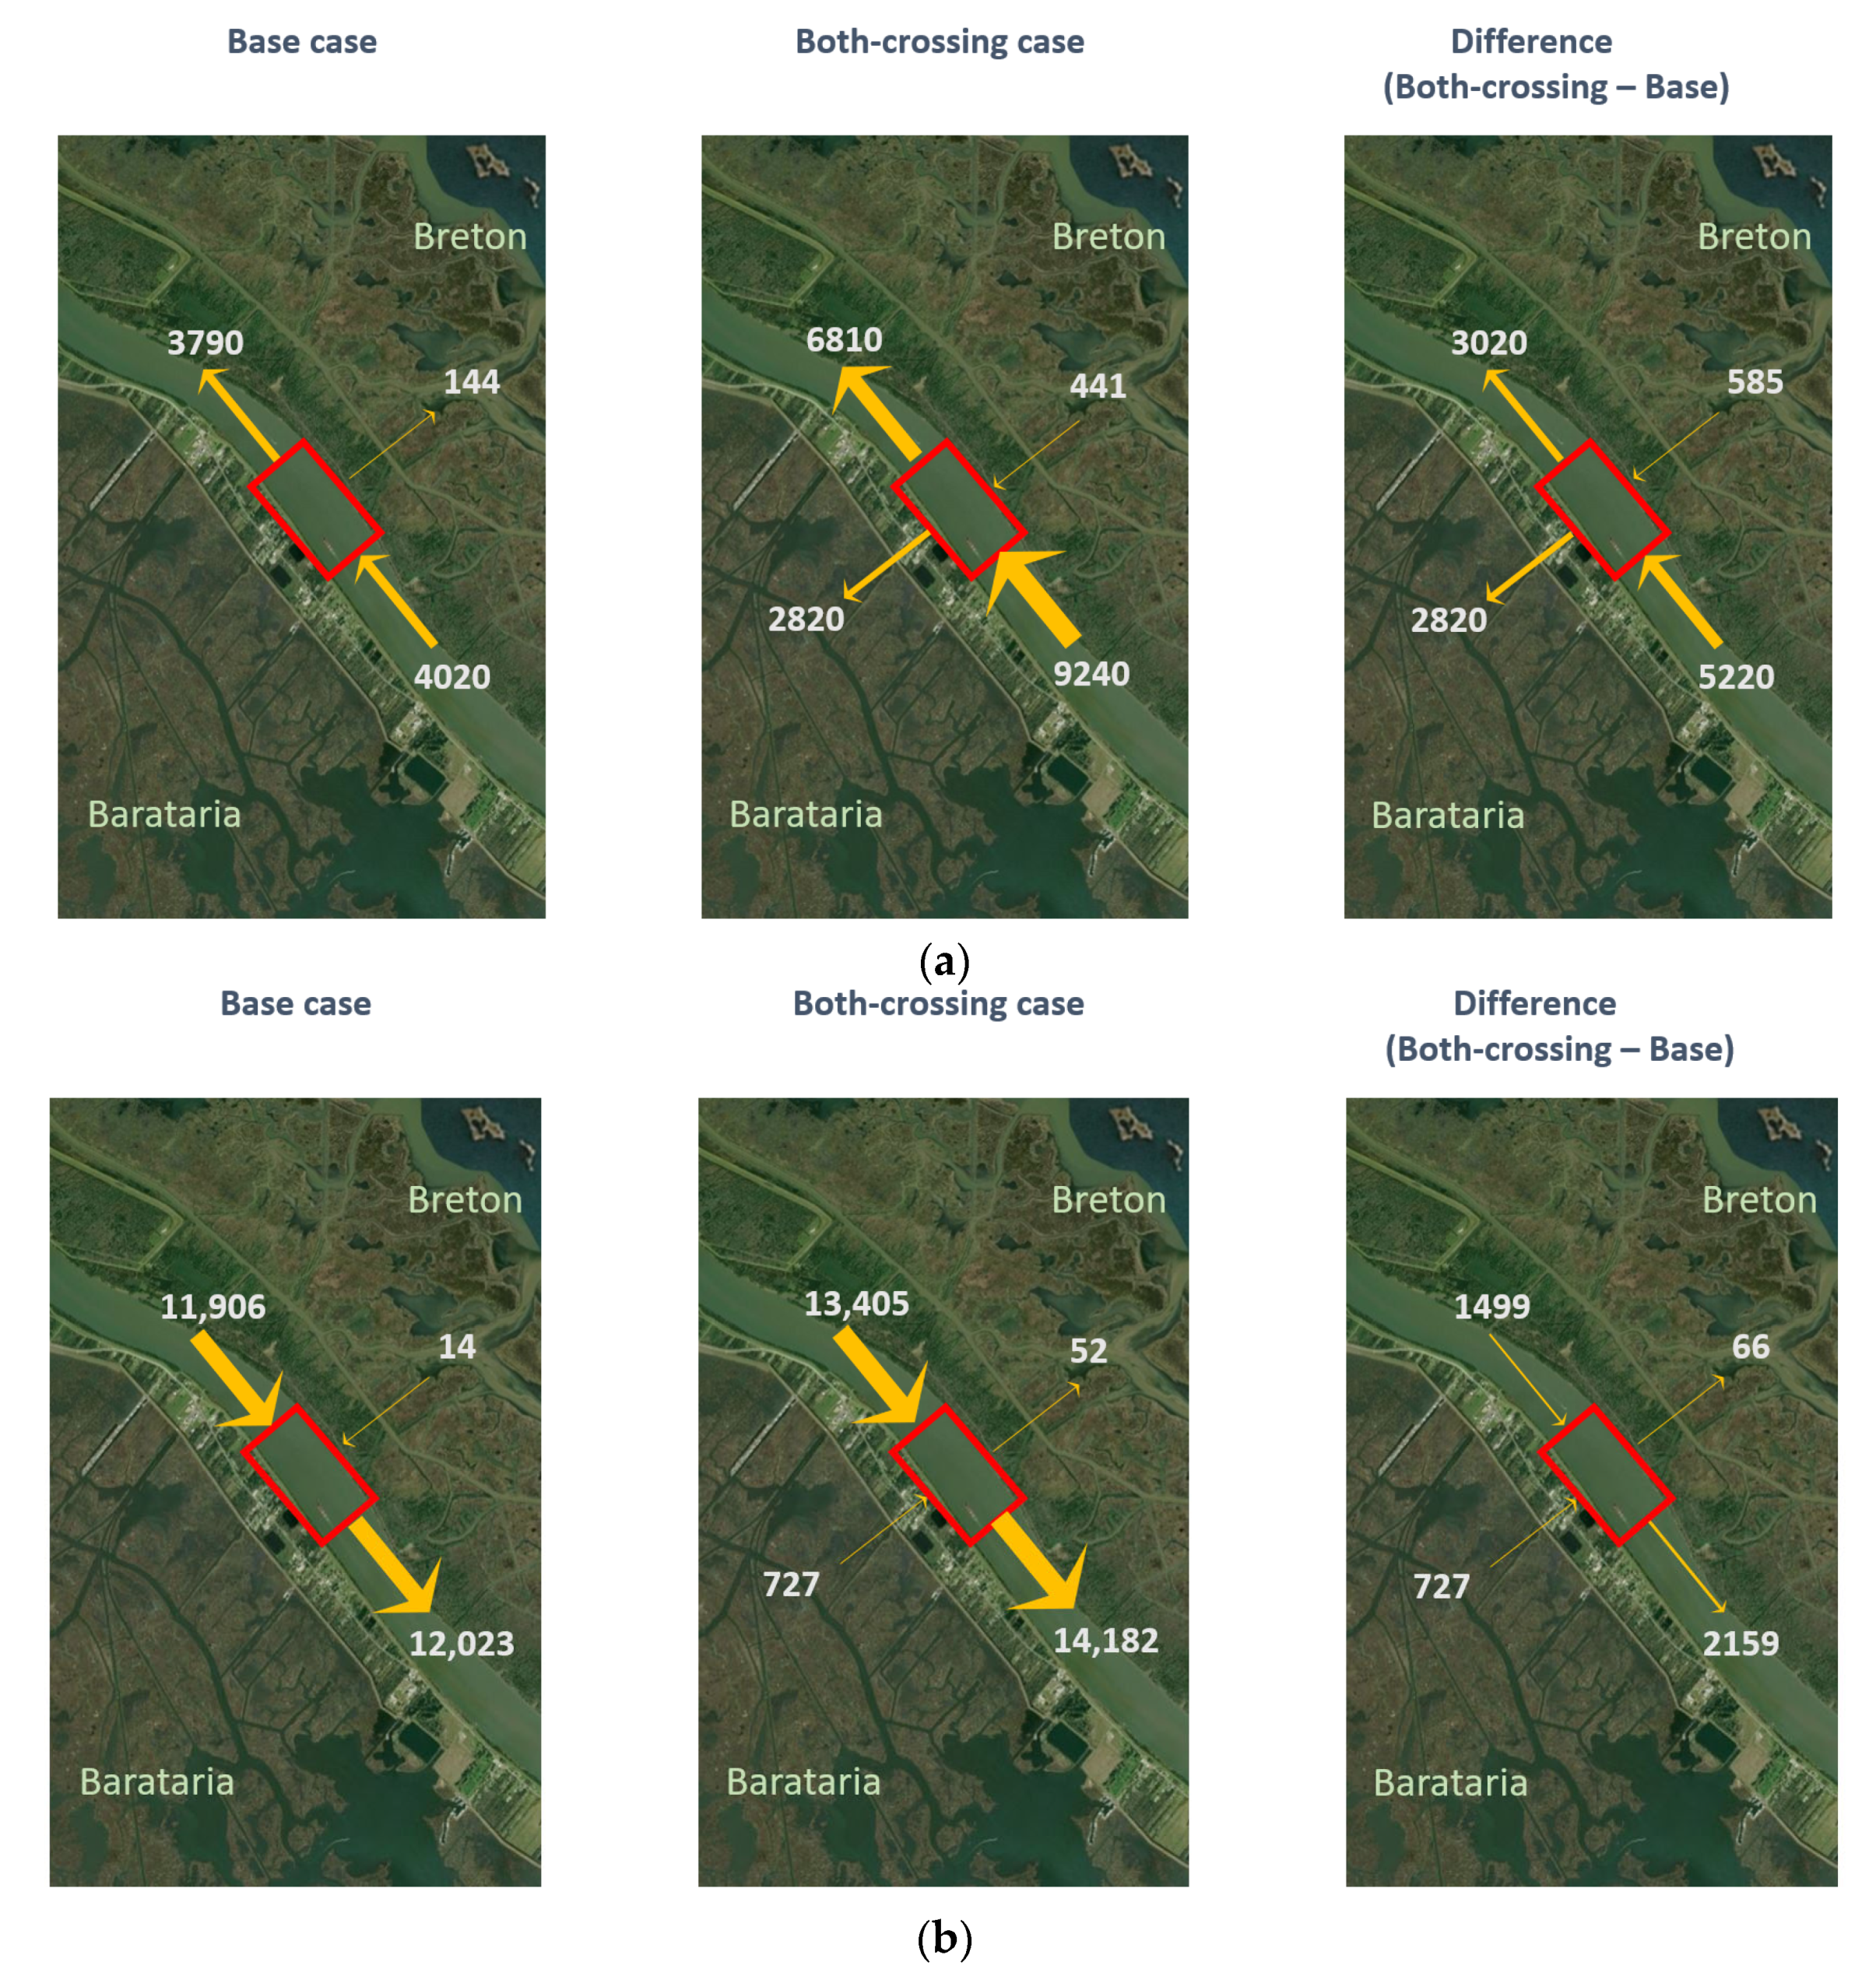
Figure 4 shows storm surge results at four CRMS stations. The top two and the bottom two are near the upper-crossing and the lower-crossing locations, respectively. The left two and the right two are located at Barataria Basin and Breton Basin, respectively. It can be seen that the model results in the base case with existing conditions agreed well with the measurements, which further validated the model performance. Due to the blockage of the levees and the slow movement of the storm, the maximum surge at two Breton stations reached 3.5 m, which was about 1.5 m higher than that at two Barataria stations. After the removal of levees at both crossing stations, it seems that the impact at two Breton stations was minor, while at two Barataria locations with the approaching of Isaac, the levee removal caused more than 0.5 m of higher surge comparing to the base case in the beginning. After 12:00 UTC 29 August, the difference was diminished. In terms of the maximum surge, the impact was little at all four stations. When all MR&T levees were removed in the model, this impact was significant, especially for the two stations near the upper-crossing location. Breton Sound and Barataria Basin were connected via the MR when surge height was higher than local topographies along both sides of riverbanks, which caused more than 0.5 m of surge reduction at CRMS0132 in Breton and more than 0.5 m of surge increase at CRMS4103 in Barataria.
Figure 5a shows the calculated distribution of maximum surge by Isaac in the base case under existing conditions. Although Isaac was only a Category 1 hurricane, it induced more than 4 m of surge in the upper Breton Sound due to its low forward speed, as well as the blockage of MR&T levees on the northwest and southwest sides of the basin. Storm surge in Barataria Basin was about 2 m. After the removal of levees at the both-crossing locations (see Figure 5b,d), the maximum surge changed little. When comparing Figure 5b to Figure 5a, visually the only difference is that the 2 m contour line enclosed area in Barataria Basin was merged in the both-crossing case. As shown in Figure 5d, the surge reduction area (e.g., up to 0.1 m of surge decrease) in Breton Sound was very limited and closely confined to the two levee-opening locations, while there were more surge increase areas (e.g., up to 0.1 m of surge increase) near the west bank of MR in Barataria Basin. When removing all MR&T levees in the model (see Figure 5c,e), the impact on storm surge was significant in both Breton Sound and Barataria Basin as expected. The maximum surge was decreased (e.g., by 0.9 m at the northwest corner) in Breton, while it was increased (e.g., by 0.9 m at the northeast corner) in Barataria. This situation is actually the optimized result to be achieved for coastal Louisiana in terms of storm hazard mitigation, but it is not practical to remove all MR&T levees. It seems that it was not very effective to reduce storm surge in one basin by removing local levels and connecting the basin with another one via the MR.

3.3. Flux Analysis

Figure 6 shows time series of water level at different sides of the west/east banks and flux through riverbanks at the upper-crossing location in the base case. Figure 7 shows the results in the both-crossing case. In the base case (see Figure 6), the flux across both riverbanks remained at zero because the surge height during Isaac never exceeded the levee height (4.7 m, NAVD88). The levee system blocked the exchange between river water and basin water. In the both-crossing case (see Figure 7), both riverbanks kept open during most of the period of Isaac. For the west bank, the water always flowed from the MR to Barataria. For the east bank, the water first flowed from the MR to Breton (positive flux), then quickly changed its direction and flowed from Breton to the MR (negative flux).
Figure 8 compares flux patterns at two instances (see Figure 7 bottom-right) when the flux through the east bank attained its maximum value at the two opposite directions. Wind fields around these two instances can be found in Figure 3a,c, respectively. At 03:15 UTC 29 August, both riverbanks were never overtopped in the base case. The south and southeast winds (see Figure 5a) along the MR river caused the reversed river flow from south to north. In the both-crossing case, the flux across the river south was significantly increased, and a large amount of river water was diverted into both basins. It is to be noted that the easterly winds over Breton can retard the flux from the MR to Breton, but they were not strong enough to reverse the flux direction from Breton to the MR. The difference flux pattern map (Figure 8 top-right) indicates that the effect of levee removal caused the redistribution of river water from the south and the north to both basins. This effect is not good for surge reduction in Breton and Barataria. At 10:45 UTC 29 August, the river flow was changed from north to south with a very small amount (~300 m3/s) in the base case. The storm surge in the upper Breton Sound kept rising due to the continuous east and south winds. After the levee removal, a large amount of water from Breton flowed into the MR and Barataria. The difference flux pattern map (Figure 8 bottom-right) shows that 75% of the water from Breton entered the downstream of the river, 20% flowed via the MR into Barataria and the rest (5%) flowed upstream. This pattern was beneficial in terms of reducing storm surge in Breton.
Figure 9 shows time series of water level at different sides of the west/east banks and flux through riverbanks at the lower-crossing location in the base case. Figure 10 shows the results in the both-crossing case. In the base case (see Figure 9), the west bank was never overtopped during Isaac, while for the east bank with no river or basin levee structures, the flux across it was mainly from Breton to the MR during Isaac. In the both-crossing case (see Figure 10), after the removal of levees at the west bank, the west bank kept open for most of the time during Isaac. The water flowed from the MR to Barataria first, then changed its direction from Barataria to the MR due to the direction change from the east winds (see Figure 3a) to the south winds (see Figure 3d) when Isaac was moving north. As for the east bank, the flow direction was always from the MR to Breton during the event.
Figure 11 compares flux patterns at two instances (see Figure 10 bottom-left) when the flux through the west bank attained its maximum value at the two opposite directions. Wind fields around these two instances can be found in Figure 3a,d, respectively. At 02:45 UTC 29 August, the river flow was reversed with a small lateral leakage into Breton in the base case. In the both-crossing case, due to the removal of levees at the west bank, the reversed river flow was further enhanced along with a large amount of water entering Barataria and a small amount of water input from Breton. The east winds speeded up the flux from the MR to Barataria. The difference flux pattern map (Figure 11 top-right) suggests that about a half of the increased water from the river south along with the input from Breton entered Barataria and the remaining half flowed upstream, which means the removal of levees did not reduce storm surge in both the MR and Barataria but may reduce the surge in Breton a little bit. At 16:45 UTC 29 August, the river flow became normal from north to south along with some tiny lateral input from Breton, and the west bank was not overtopped in the base case. In the both-crossing case, the river flow increased by about 13% comparing to the base case. The south winds (see Figure 3d) assisted the flux from Barataria to the MR to reach 727 m3/s, only about 5% of the river discharge. The difference flux pattern map (Figure 11 bottom-right) shows that the water entering the MR from Barataria flowed mostly to the downstream of the river, which is good for surge reduction in Barataria, but the effect was very limited due to the small amount of water crossing the west bank.

4. Conclusions

Using Hurricane Isaac (2012) as an example, a pre-validated Delft3D-based hydrodynamic model was applied to study the effect of levee removals on storm surge in Barataria Basin and Breton Sound of coastal Louisiana. Two removal locations (i.e., the upper crossing and the lower crossing) were selected in this study. Three scenarios were carried out, that is, the base case with existing conditions, the both-crossing case with two level removal locations and the no-levee case with the removal of all MR&T levees in the model domain, to demonstrate the effects of constructing these crossings/floodways through the mainstem MR levees.
The model performance was further validated by four CRMS stations near the two levee-opening locations in Barataria Basin and Breton Sound. Isaac induced much higher storm surge (>4 m) in Breton Sound than in Barataria (~2 m). In the extreme and impractical no-levee case, the surge difference between two basins reduced to ~1 m, i.e., 3.5 m in Breton vs. 2.5 m in Barataria. In the more practical both-crossing case, however, the impact on storm surge in Breton was minor, only about 0.1 m of reduction closely confined to the two levee opening locations. The primary purpose of this study is to test if the levee removals can help reduce storm surge in adjacent basins. The reason the levee openings were not effective in reducing storm surge heights is the complex interaction between the cross flow from the surge and the MR flow. In essence, the MR water was diverted to Barataria and/or Breton, which resulted in an increase in water height, essentially defeating the primary objective of the levee openings.
Based on flux analysis, Isaac pushed water from the MR to Barataria through the west bank of crossings. As for the east bank of the upper crossing, Isaac could cause water exchange in both directions due to the variation of hurricane wind direction. The impact of levee openings can be demonstrated by the difference flux pattern maps. In this study, four maps were analyzed for the two crossing locations during Isaac. The results of these maps can be grouped into two patterns:
  • Pattern 1: The reversed MR water from the south edge crosses riverbanks to Barataria and/or Breton (see Figure 8 top and Figure 11 top). This pattern results in an increase in water level in the basins.
  • Pattern 2: The basin water from Barataria and/or Breton enters the MR (see Figure 8 bottom and Figure 11 bottom). This pattern is beneficial to storm surge reduction in Barataria and/or Breton.
It should be noted that only one hurricane was considered in this study. The impact of levee openings might depend on individual hurricane parameters (e.g., storm track, forward speed and wind intensity). On the other hand, among the four devastating hurricanes that affected coastal Louisiana recently, except Ida (2021), three of them, i.e., Katrina (2005), Gustav (2008) as well as Isaac (2012) in this study, induced much higher storm surge in Breton Sound than in Barataria Basin, which implies that Isaac could be a representative extreme storm event for coastal Louisiana. Overall, based on model results and flux analysis during Isaac, the effect of levee openings at the selected locations on storm surge reduction in adjacent basins of coastal Louisiana was minor and very limited.

Author Contributions

Conceptualization, K.H., E.M. and A.R.; methodology, K.H.; software, K.H.; validation, K.H; formal analysis, K.H.; investigation, K.H. and E.M.; resources, E.M.; data curation, K.H.; writing—original draft preparation, K.H.; writing—review and editing, E.M., R.R., N.S. and A.R.; visualization, K.H.; supervision, E.M. and N.S.; project administration, R.R.; funding acquisition, E.M. and N.S. All authors have read and agreed to the published version of the manuscript.

Funding

This research was funded by the Environmental Defense Fund and the Greater New Orleans Foundation.

Institutional Review Board Statement

Not applicable.

Informed Consent Statement

Not applicable.

Data Availability Statement

Not applicable.

Acknowledgments

This research was supported, in part, by using high-performance computing (HPC) resources and services provided by both the Louisiana Optical Network Infrastructure (LONI) and Technology Services at Tulane University. The authors would like to thank three anonymous reviewers for their constructive comments and suggestions.

Conflicts of Interest

The authors declare no conflict of interest.

References

  1. U.S. Army Corps of Engineers (USACE). Mississippi River and Tributaries Project; Mississippi Valley Division: Vicksburg, MS, USA, 2019.
  2. Hu, K.; Chen, Q.; Wang, H. A numerical study of vegetation impact on reducing storm surge by wetlands in a semi-enclosed estuary. Coast. Eng. 2015, 95, 66–76. [Google Scholar] [CrossRef]
  3. U.S. Army Corps of Engineers (USACE). Louisiana Coastal Protection and Restoration (LACPR). Final Technical Report; New Orleans District, Mississippi Valley Division: Vicksburg, MS, USA, 2009.
  4. Coastal Protection and Restoration Authority of Louisiana (CPRA). Louisiana’s Comprehensive Master Plan for a Sustainable Coast; CPRA: Baton Rouge, LA, USA, 2012.
  5. Hu, K.; Ding, P.; Wang, Z.; Yang, S. A 2D/3D hydrodynamic and sediment transport model for the Yangtze Estuary, China. J. Mar. Syst. 2009, 77, 114–136. [Google Scholar] [CrossRef]
  6. Vousdoukas, M.I.; Voukouvalas, E.; Annunziato, A.; Giardino, A.; Feyen, L. Projections of extreme storm surge levels along Europe. Clim. Dyn. 2016, 47, 3171–3190. [Google Scholar] [CrossRef] [Green Version]
  7. Veeramony, J.; Condon, A.; van Ormondt, A. Forecasting storm surge and inundation: Model validation. Weather. Forecast. 2017, 32, 2045–2063. [Google Scholar] [CrossRef]
  8. Hu, K.; Chen, Q.; Wang, H.; Hartig, E.K.; Orton, P.M. Numerical modeling of salt marsh morphological change induced by Hurricane Sandy. Coast. Eng. 2018, 132, 63–81. [Google Scholar] [CrossRef]
  9. Silveira, F.; Lopes, C.L.; Pinheiro, J.P.; Pereira, H.; Dias, J.M. Coastal floods induced by mean sea level rise—Ecological and socioeconomic impacts on a mesotidal lagoon. J. Mar. Sci. Eng. 2021, 9, 1430. [Google Scholar] [CrossRef]
  10. Zhu, Q.; Wiberg, P.L. The importance of storm surge for sediment delivery to microtidal marshes. J. Geophys. Res. Earth. Surf. 2022, 127, e2022JF006612. [Google Scholar] [CrossRef]
  11. Chow, A.C.H.; Sun, J. Combining Sea level rise inundation impacts, tidal flooding and extreme wind events along the Abu Dhabi coastline. Hydrology 2022, 9, 143. [Google Scholar] [CrossRef]
  12. Deltares. Delft3D-FLOW User Manual (Version 4.05). 2022. Available online: https://content.oss.deltares.nl/delft3d4/manuals/Delft3D-FLOW_User_Manual.pdf (accessed on 23 October 2022).
  13. Hu, K.; Chen, Q.; Kimball, K.S. Consistency in hurricane surface wind forecasting: An improved parametric model. Nat. Hazards 2012, 61, 1029–1050. [Google Scholar] [CrossRef]
  14. Berg, R. Hurricane Isaac (AL092012) 21 August–1 September 2012. Tropical Cycle Report; NOAA National Hurricane Center: Miami, FL, USA, 2013. Available online: http://www.nhc.noaa.gov/data/tcr/AL092012_Isaac.pdf (accessed on 23 October 2022).
Figure 1. The lower MR river delta area. Yellow lines denote the MR&T levees. Two double headed red arrows denote the levee removal locations. Blue squares denote water level gauges. Orange circle denotes the discharge boundary location of the MR river in the model. Magenta line with dots denotes the track of Isaac (2012). The full track is shown in the top-right subfigure (revised from https://en.wikipedia.org/wiki/Hurricane_Isaac_(2012)#/media/File:Isaac_2012_track.png, accessed on 23 October 2022).
Applsci 12 10884 g001
Figure 2. The model domain with computational grids (white line), boundaries (orange for water level, purple for current and yellow for Neumann) and the MR&T levee system (black line). Green lines denote the levee removal parts; filled red rectangles denote “control box” for flux analysis. (a) Entire model domain. (b) Local enlarged model domain.
Applsci 12 10884 g002
Figure 3. Distributions of hurricane winds (m/s) during Isaac (2012). White lines denote contour lines every 5 m/s. Black arrows denote wind direction. Two red symbols denote two levee-opening locations. (a) 03:00 UTC 29 August. (b) 08:00 UTC 29 August. (c) 11:00 UTC 29 August. (d) 17:00 UTC 29 August.
Applsci 12 10884 g003
Figure 4. Comparisons of water level (m, NAVD88) time series between the observed (red circle) and the modeled phenomena in three scenarios (blue line for the base case, black line for the both-crossing case and green line for the no-levee case) at four CRMS stations during Hurricane Isaac (2012).
Applsci 12 10884 g004
Figure 5. Maximum surge (m, NAVD88) and surge difference (m) distributions by Isaac (2012). (a) Base case (existing conditions); (b) Both-crossing case; (c) No-levee case; (d) Both-crossing case—Base case; (e) No-levee case—Base case. White lines denote contour lines every 1 m. Blue lines denote contour lines with negative values every 0.1 m. Yellow lines denote contour lines with positive values every 0.1 m. Magenta line with dots denotes the track of Isaac (2012).
Applsci 12 10884 g005
Figure 6. Time series of water level (m, NAVD88, top) and instantaneous flux (m3/s, bottom) for the west (left) and east (right) banks at the upper-crossing location in the base case during Isaac (2012). The direction of positive flux is from west to east.
Applsci 12 10884 g006
Figure 7. Time series of water level (m, NAVD88, top) and instantaneous flux (m3/s, bottom) for west (left two) and east (right) banks at the upper-crossing location in the both-crossing case during Isaac (2012). The direction of positive flux is from west to east.
Applsci 12 10884 g007
Figure 8. Flux (m3/s) analysis at the upper-crossing location for 03:15 UTC 29 August 2012 (top) and 10:45 UTC 29 August 2012 (bottom) during Isaac (2012). The thickness of flux arrow is proportional to the amount. (a) 03:15 UTC 29 August 2012. (b) 10:45 UTC 29 August 2012.
Applsci 12 10884 g008
Figure 9. Time series of water level (m, NAVD88, top) and instantaneous flux (m3/s, bottom) for the west (left) and east (right) banks at the lower-crossing location in the base case during Isaac (2012). The direction of positive flux is from west to east.
Applsci 12 10884 g009
Figure 10. Time series of water level (m, NAVD88, top) and instantaneous flux (m3/s, bottom) for the west (left) and east (right) banks at the lower-crossing location in the both-crossing case during Isaac (2012). The direction of positive flux is from west to east.
Applsci 12 10884 g010
Figure 11. Flux (m3/s) analysis at the lower-crossing location for 02:45 UTC 8/29/2012 (top) and 16:45 UTC 8/29/2012 (bottom) during Isaac (2012). The thickness of flux arrow is proportional to the amount. (a) 02:45 UTC 29 August 2012. (b) 16:45 UTC 29 August 2012.
Applsci 12 10884 g011
Publisher’s Note: MDPI stays neutral with regard to jurisdictional claims in published maps and institutional affiliations.

