Article

Development of an Artificial 3D Liver Phantom for Analysis of Radiotherapeutic Effects In Vitro

1
Medical Physics in Radiation Oncology, German Cancer Research Center (DKFZ), Im Neuenheimer Feld 280, 69120 Heidelberg, Germany
2
Institute for Pharmacy and Molecular Biotechnology, Im Neuenheimer Feld 364, 69120 Heidelberg, Germany
3
Faculty of Medicine, University of Heidelberg, Im Neuenheimer Feld 672, 69120 Heidelberg, Germany
4
The Wistar Institute, 3601 Spruce Street Philadelphia, Philadelphia, PA 19104, USA
*
Author to whom correspondence should be addressed.
Appl. Sci. 2022, 12(21), 10867; https://doi.org/10.3390/app122110867
Submission received: 15 September 2022 / Revised: 21 October 2022 / Accepted: 23 October 2022 / Published: 26 October 2022

Abstract

:
Over recent decades, stereotactic body radiotherapy has garnered increasing popularity. Unfortunately, conventional preclinical 2D in vitro models are often insufficient for studying radiotherapy effects. Therefore, in this study, we developed a novel anthropomorphic in vitro liver phantom, which simulates the relevant hepatocellular carcinoma (HCC) tumor microenvironment and spatial organization. The liver phantom was 3D printed, filled with tissue-mimicking agarose mixture, and designed to fit ten microfluidic chips (MCs), in which HepG2 cells were seeded. Airtight MCs induced hypoxic conditions, as verified by Hif1α staining. Irradiation was conducted with 20 Gy in one fraction using a CyberKnife, in either a 2D setup, or by irradiating MCs arranged in the 3D-printed liver model using an individually calculated treatment plan. Post-irradiation cellular damage was determined via γH2AX staining. Here, we demonstrate a new physiologically relevant approach to model HCC pathology following radiotherapy. Comparing γH2AX staining in normoxic conditions to cells grown in MCs (hypoxic conditions) revealed a reduction in cellular damage of 30.24% (p = 0.0001) in the hypoxic environment. Moreover, we compared the scattering effect of radiation on a conventional 2D in vitro model to our new 3D anthropomorphic liver phantom and observed a significant γH2AX intensity reduction of 9.6% (p = 0.0294) in HepG2 cells irradiated in the phantom. Our approach of utilizing a liver phantom takes into account the hypoxic tumor microenvironment and 3D scattering effects of tissue irradiation, thereby modeling both physical and biological parameters of HCC tumors. The use of tissue phantoms lays the groundwork for future examination of other hypoxic tumors and offers a more comprehensive approach for screening and analysis of novel cancer therapeutics.

1. Introduction

Hepatocellular carcinoma (HCC) is the third leading cause of cancer-related deaths worldwide and is the most common type of cancer observed in the digestive system. Hypoxia is one of the main characteristics of HCC caused by uncontrolled proliferation, which leads to inadequate vascularization and, therefore, insufficient oxygen supply [1]. This phenomenon promotes tumor aggression and aggravates tumor response [2].
The primary therapy for HCC is surgical resection. However, radiotherapy has been increasingly applied in clinical practice in recent years [3,4,5]. Specifically, stereotactic body radiotherapy (SBRT), which is based on the principle of delivering a high dose of radiation per fraction with precise targeting, has recently been successfully exploited for HCC treatment, demonstrating local tumor control of 80–90% in 3 years [6].
At present, in vitro 2D cell cultures are utilized preclinically to investigate new irradiation methods and analyze the effects of irradiation on tumors [7]. Although these methods provide important information on basic irradiation schemes and biological cell responses, they often fail to recapitulate complex scenarios present in vivo [8]. For example, one major limitation of 2D HCC tumor cell cultures is that cancer cells are grown in the presence of oxygen (i.e., a normoxic environment), while a hypoxic environment is characteristic for HCC in vivo. Moreover, oxygen deprivation in the microenvironment of a tumor leads to increased radioresistance and, therefore, a phenomenon which cannot be properly addressed in current 2D models [9]. Finally, human organs are 3D structures which do not resemble the 2D flat monolayer cell culture. Therefore, 2D cell cultures are solely irradiated at a 90° angle, without the calculation of an individualized 3D irradiation plan which is necessary for patients. In other words, 3D structures are normally irradiated from different angles utilizing a specific irradiation plan, which is not possible to simulate in 2D cultures [10].
To overcome these obstacles, in this study, we designed an anthropomorphic liver phantom to simulate hypoxic and positioning effects of cells during high-dose radiotherapy. HepG2 cells were introduced into microfluidic chips (MCs) and completely sealed to reach hypoxic conditions. Furthermore, these chips were placed in the liver model to resemble the different positions of cells in the human liver. The aim was to show that the outcome of irradiation effects significantly changes if cells are irradiated in a 2D cell culture rather than in a 3D-printed phantom under hypoxic conditions.

2. Materials and Methods

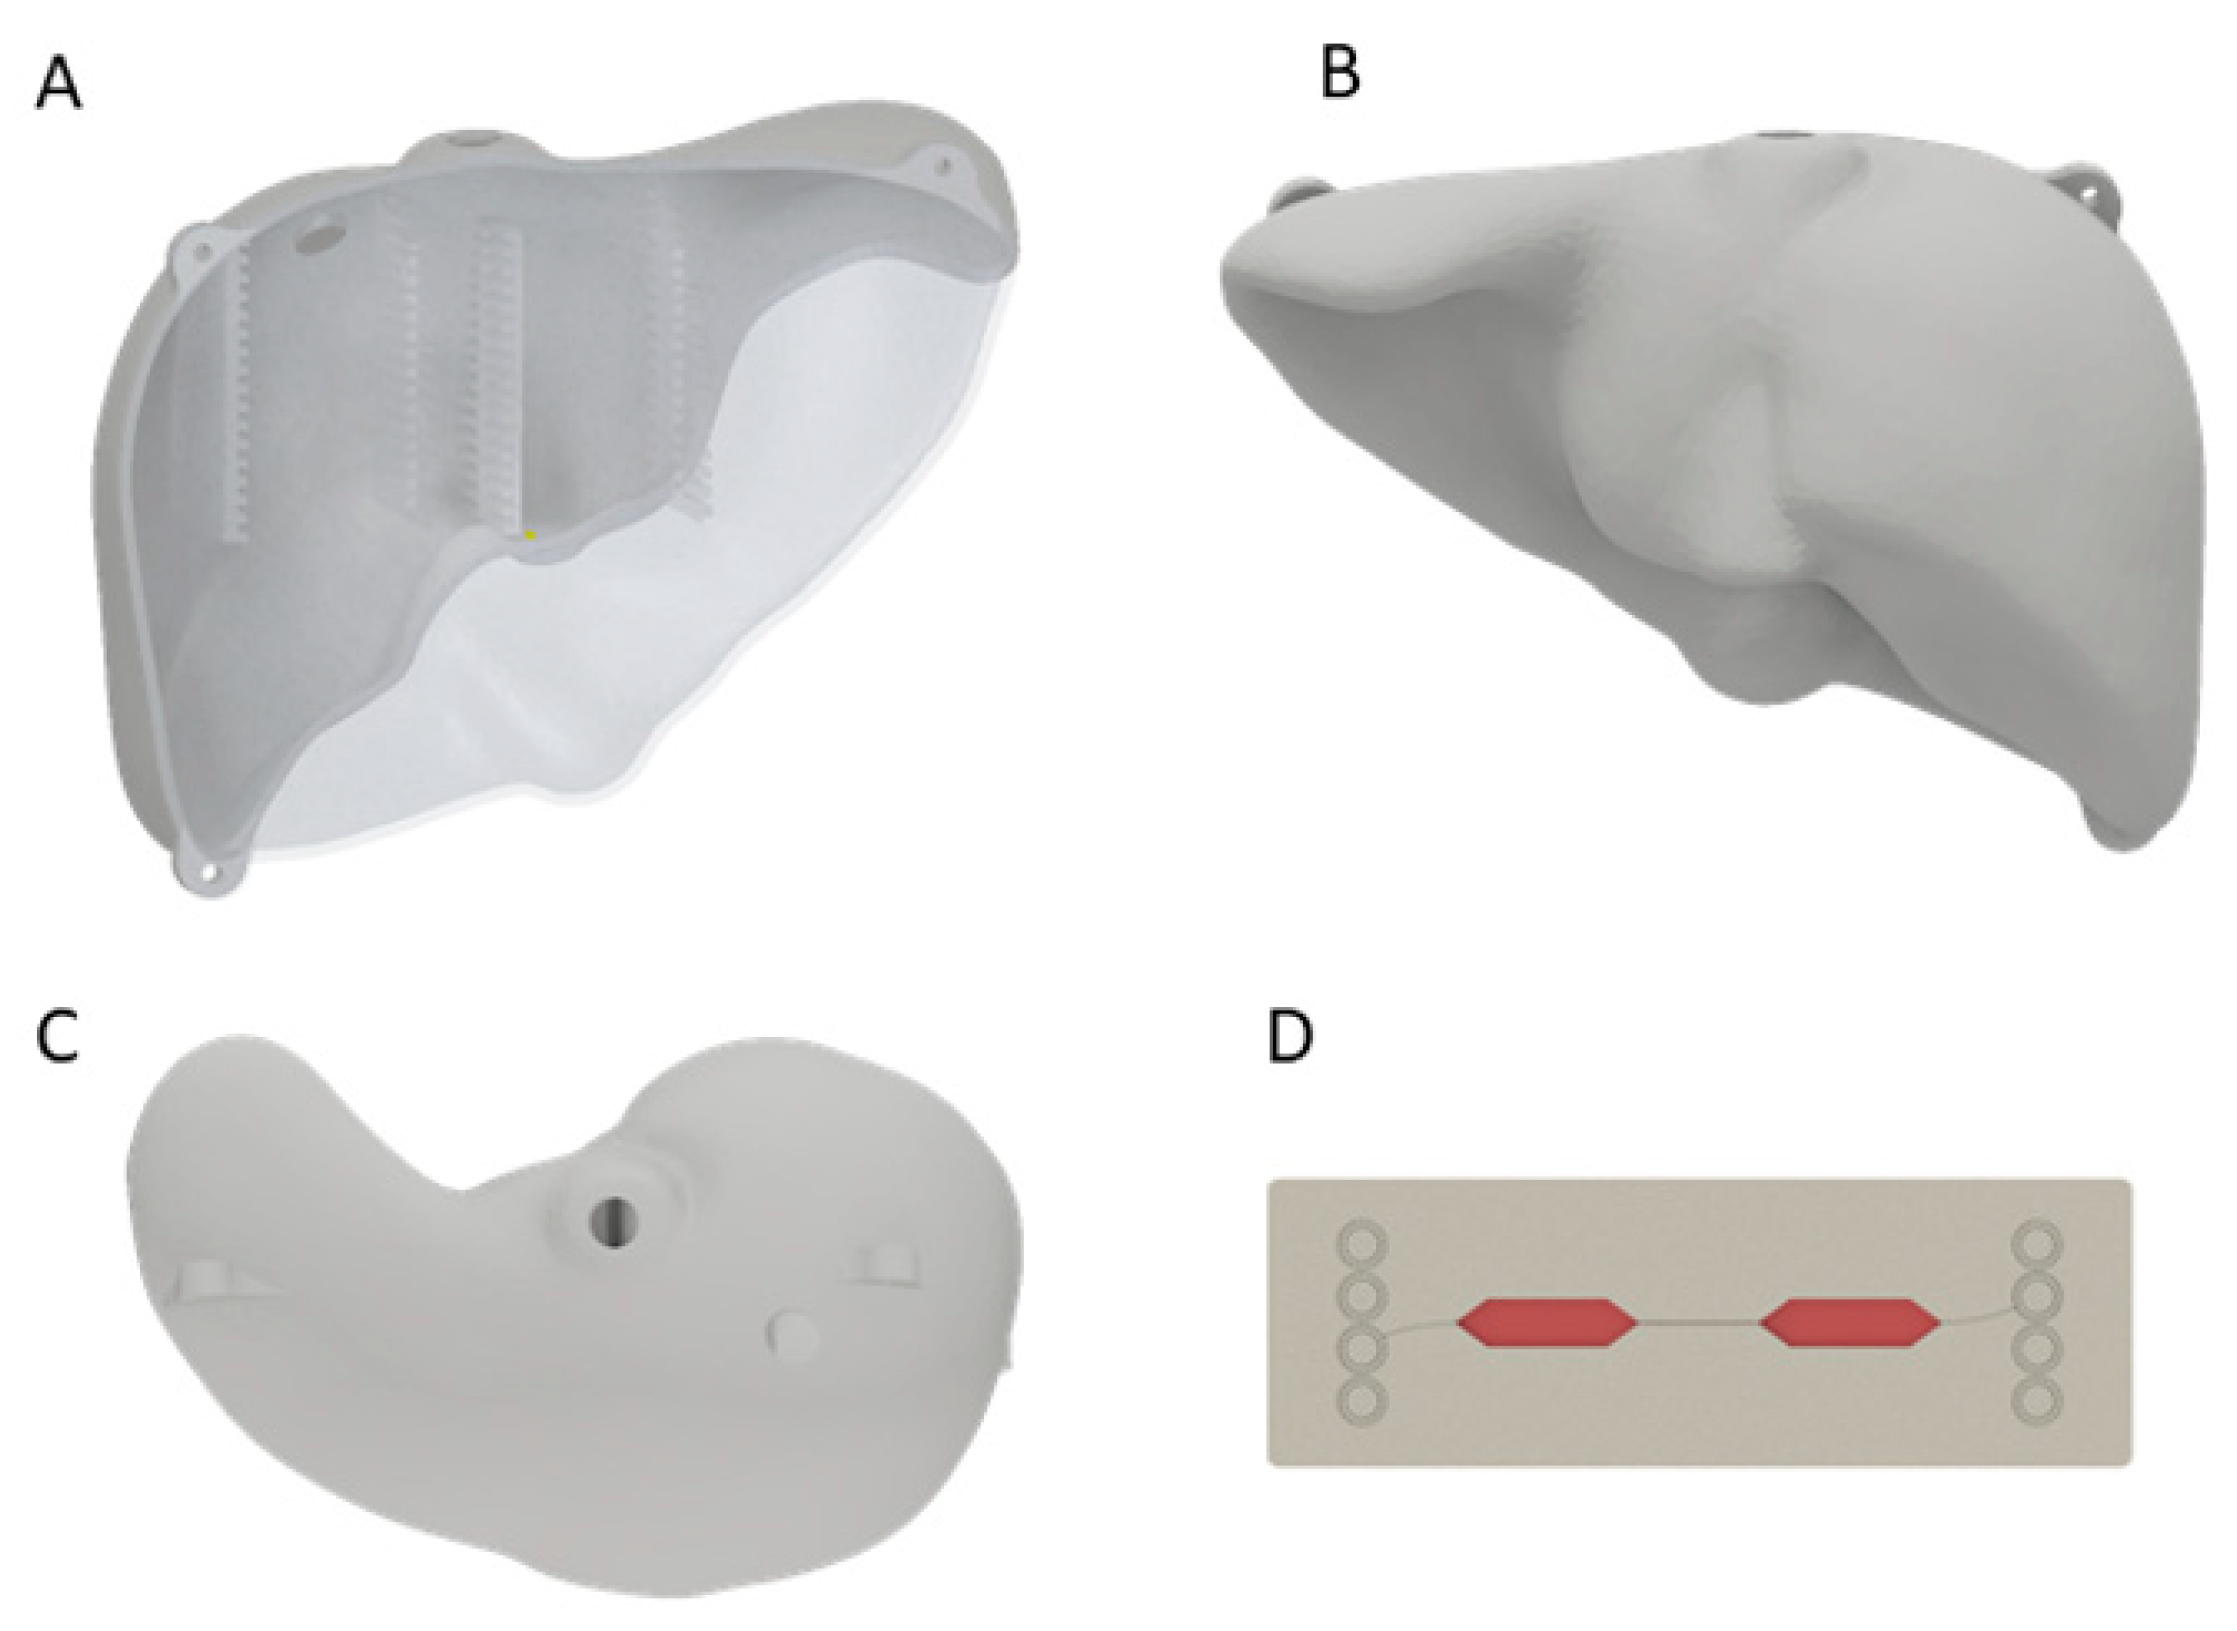
2.1. Three-Dimensional-Printed Liver Model

A 3D scan of a liver model was created using the Artec Eva 3D scanner (Artec3D, Luxembourg) and the acquired 3D data were postprocessed with Artec Studio 9. As the resulting model was solid and showed no uniform surface, it was shaped in Meshmixer (Version 3.0, Autodesk, San Rafael, CA, USA), where it was hollowed to an outer thickness of 3 mm. To fit the ten MCs (Fluidic 688 interaction chips, Microfluidic ChipShop GmbH, Jena, Germany) [11], holders were constructed using Inventor Professional (Version 2018, Autodesk, San Rafael, CA, USA) with a size of 76.3 mm × 3 mm × 26 mm each and positioned in the anterior and posterior part of the liver. In this way, MCs were distributed equally within the liver phantom. Additionally, the liver was halved in the anterior–posterior direction, and three straps for fastening the two halves with M6 screws were designed. The designed model was 3D printed with the Objet500 (Stratasys Ltd., Eden Prairie, MN, USA) using VeroClear® (Stratasys Ltd., Eden Prairie, MN, USA) (Figure 1, Supplementary Figure S1A,B). Two holes for filling of agarose were positioned in the cranial part of the liver.

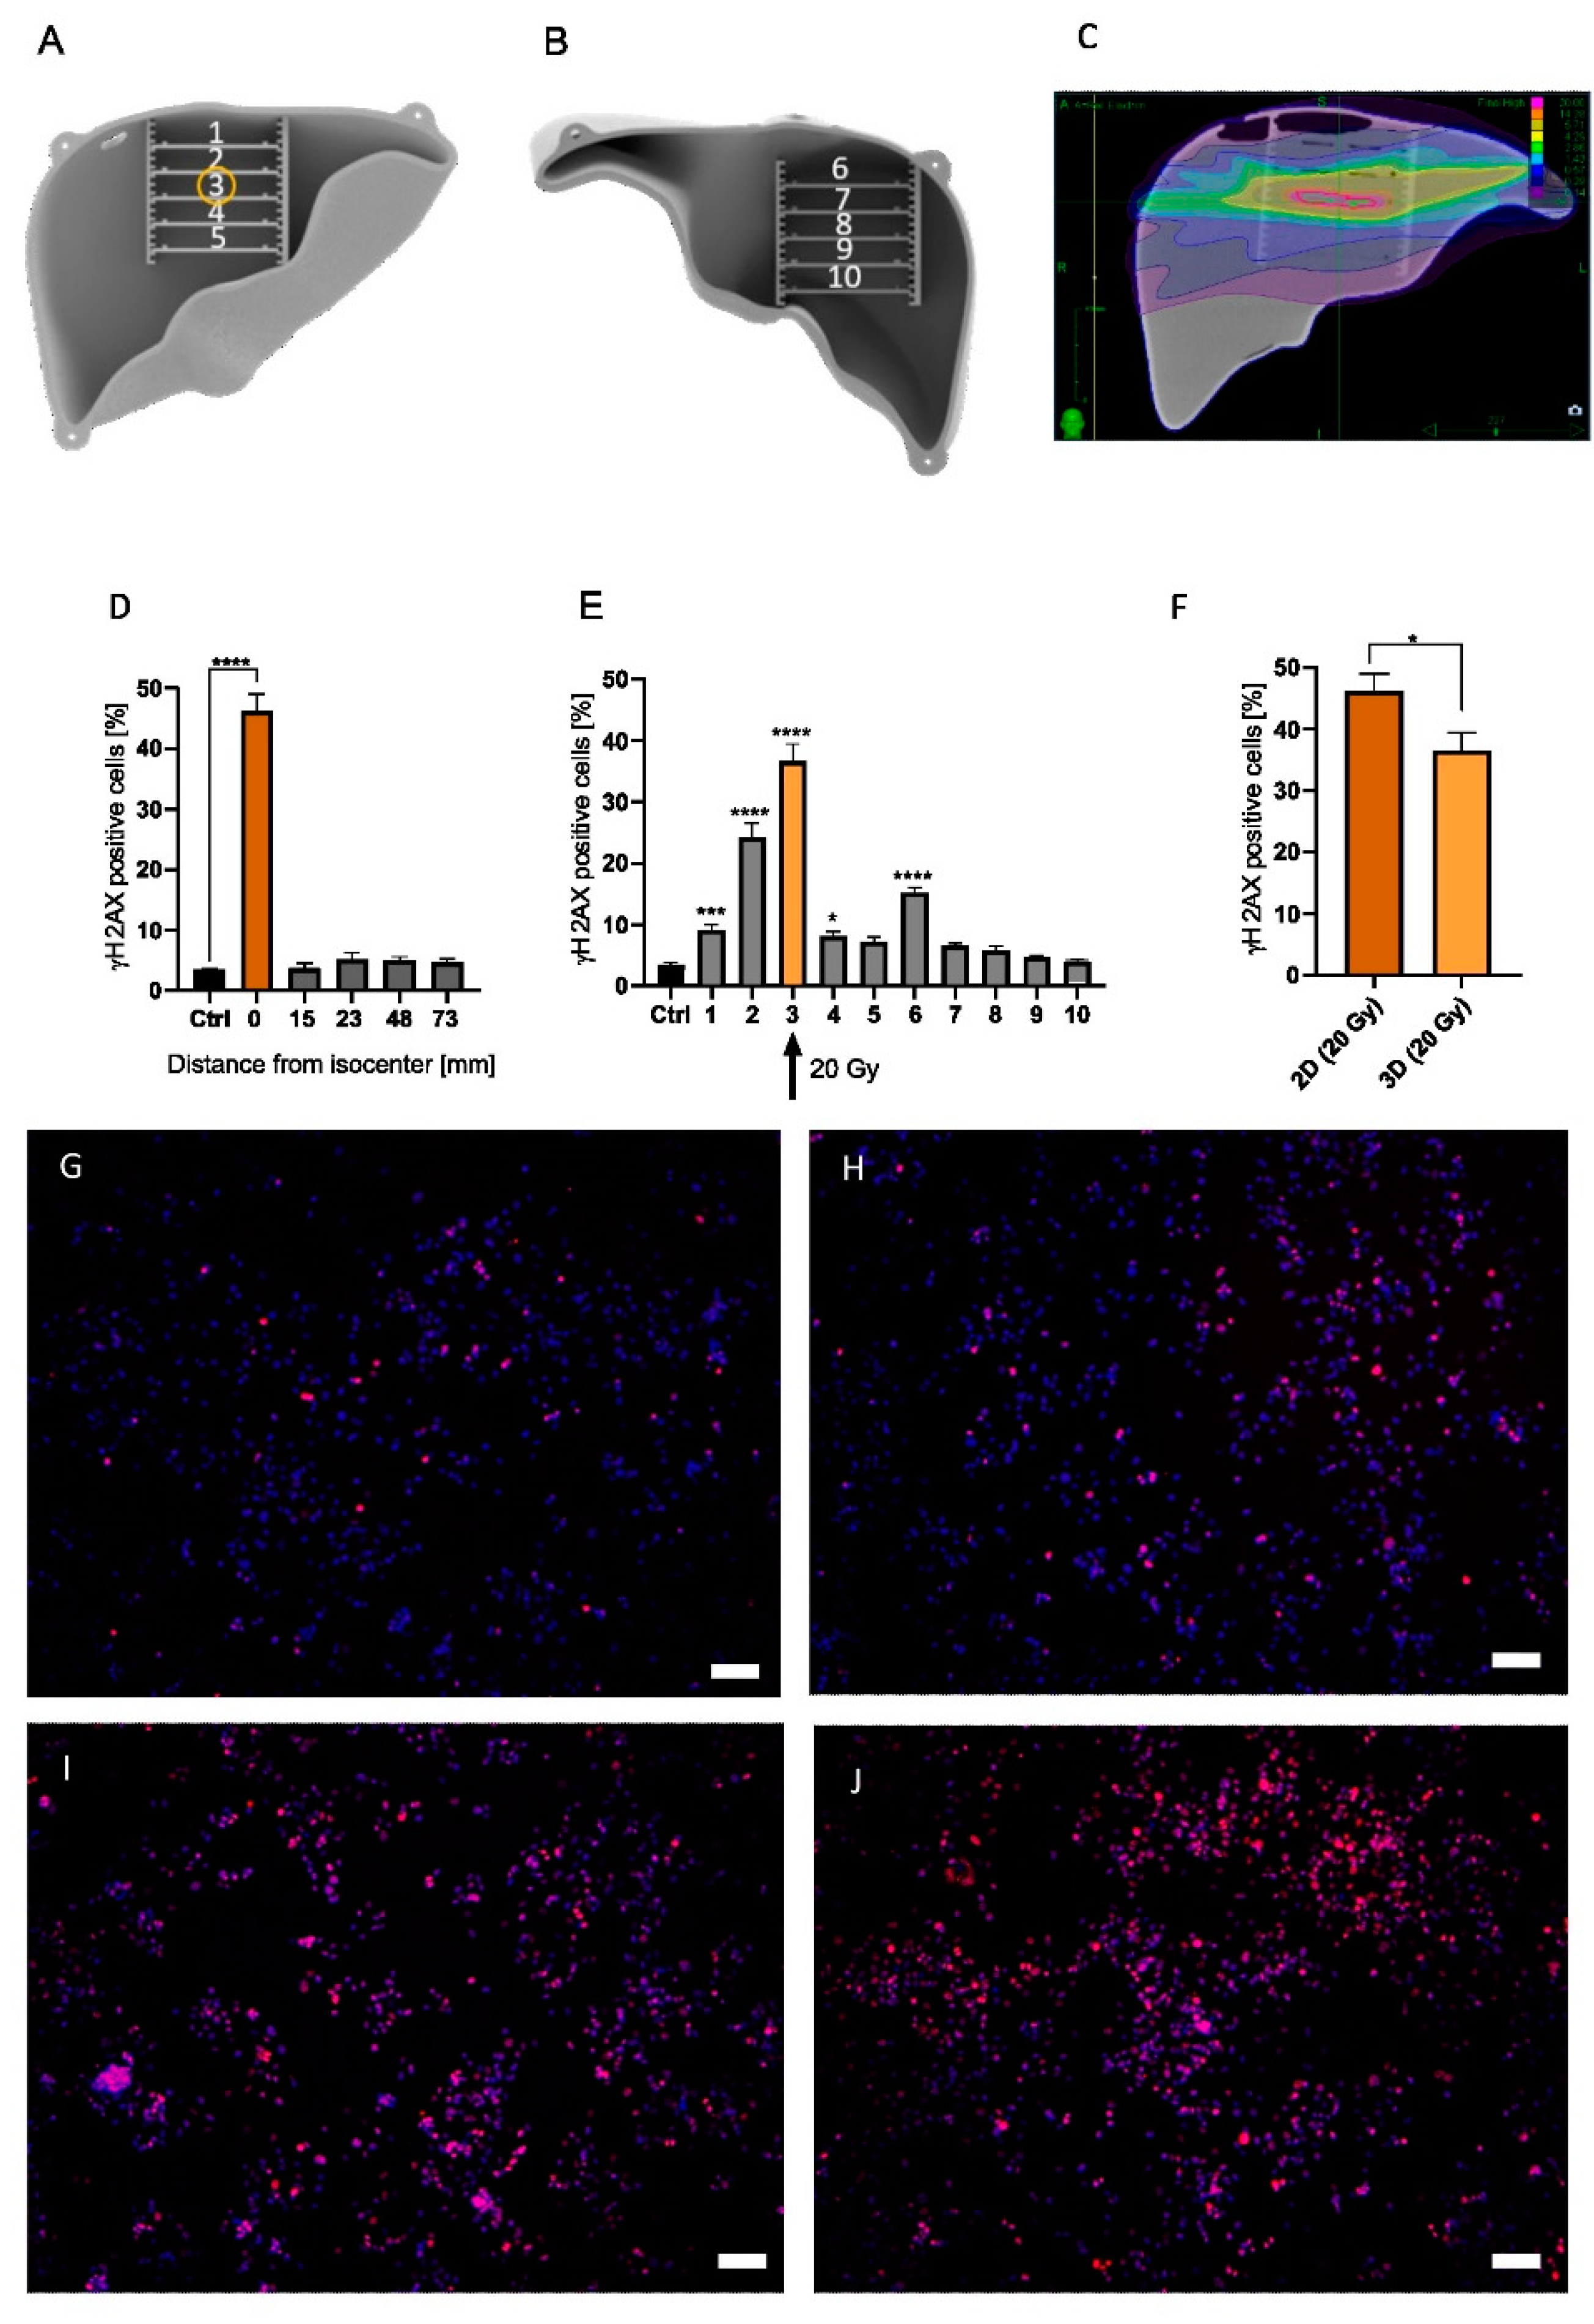
2.2. Treatment Planning for Liver Model

X-ray experiments were performed at the Heidelberg University Hospital Radiation Oncology department using the CyberKnife® Robotic Radiosurgery System M6 (Accuray, Sunnyvale, CA, USA). This device has a LINAC mounted on a robotic arm with six degrees of freedom and a 6 MV photon beam. Additionally, the system is linked to two X-ray sources for imaging to increase targeting accuracy.
To ensure realistic radiotherapy treatment of the liver model by the CyberKnife, the complete liver model was CT scanned with six X-Spot 101 skin markers (BeekleyMedical, Bristol, CT, USA) with a diameter of 1.5 mm attached to the 3D-printed liver surface. A treatment plan was calculated, which achieved 20 Gy at 70% of the isocenter. We estimated the maximal dose using a Monte Carlo simulation at 28.57 Gy. The complete irradiation took 20 min. Positioning of the liver phantom was achieved by matching the CT scan to the CyberKnife imaging system. During treatment, the liver was immobilized with a 3D-printed holder, which guaranteed the reproducibility of positioning.

2.3. HepG2 Cell Cultivation

HepG2 cells (passages 4 to 7) were seeded in DMEM media (10% FBS and 1% PenStrep) in either MCs or 48-well plates at a density of 100,000 cells/MC and 25,000 cells/well, respectively. Afterward, cells were incubated at 37 °C with 5% CO2 for 24 h and allowed to adhere to the chips.

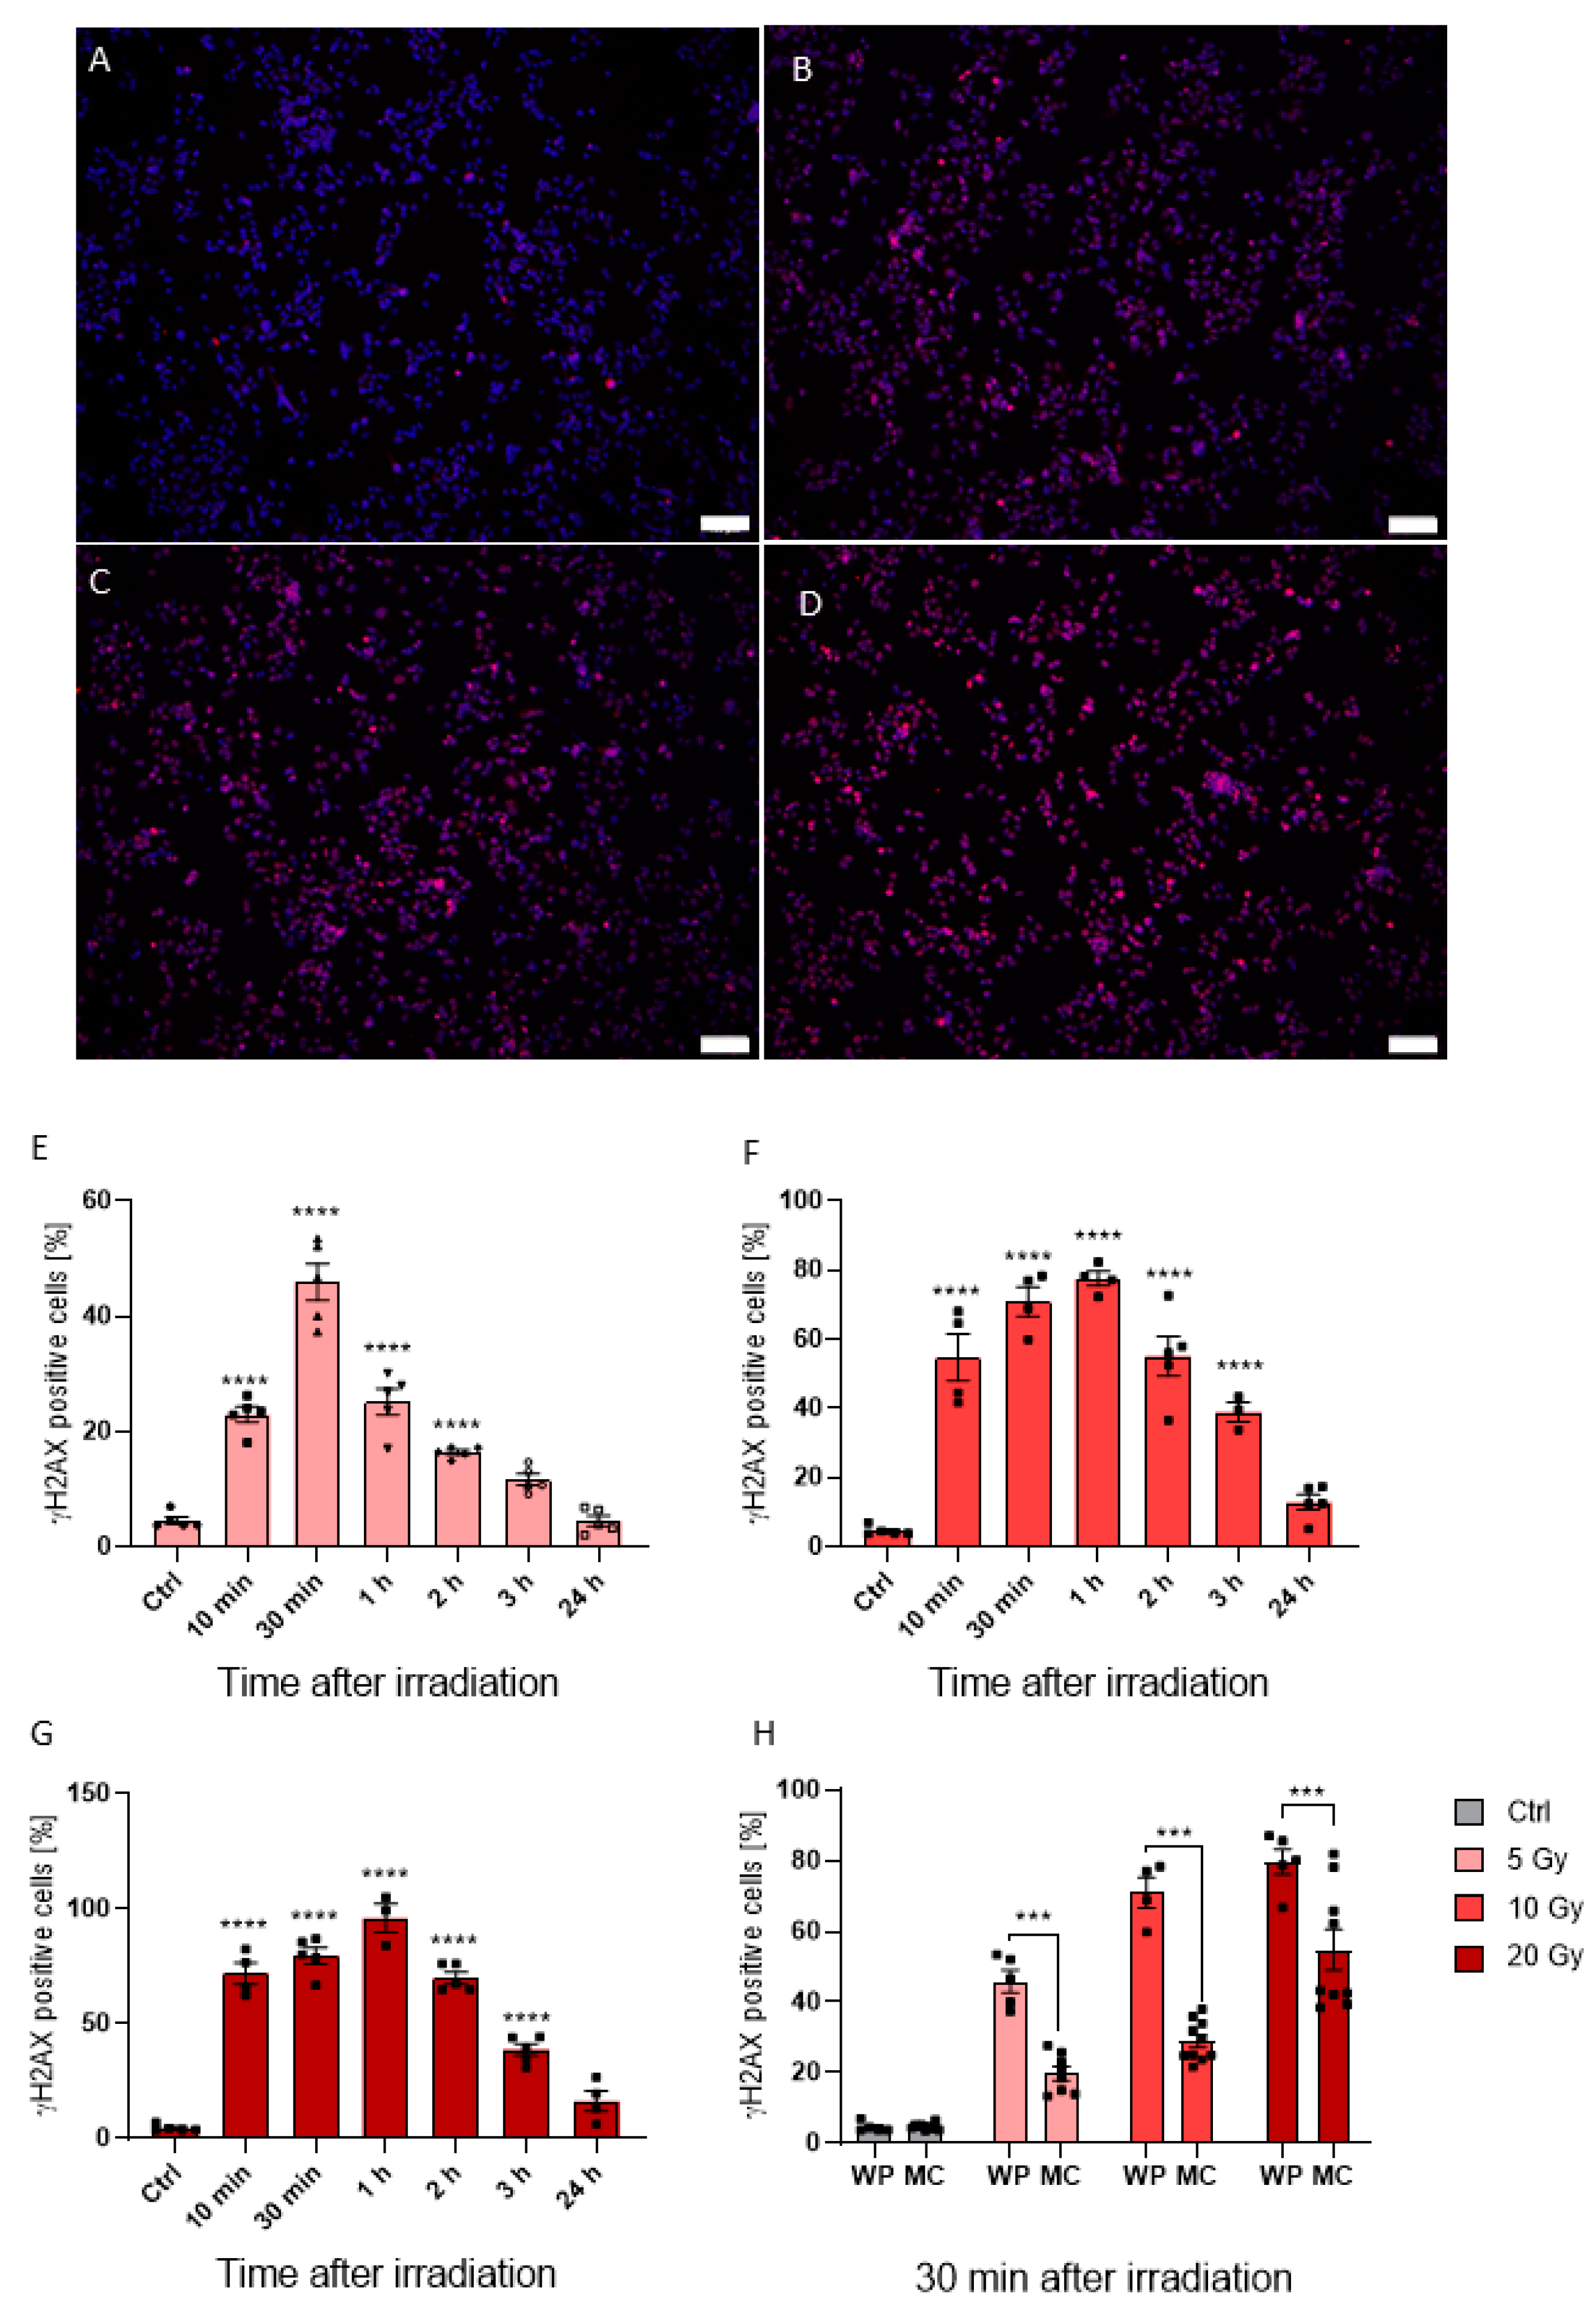
2.4. Dose-Dependent Irradiation of HepG2 Cells

The media were changed 4 h before irradiation, and the MCs’ outer connectors were completely blocked with mini male Luer plugs under sterile conditions. Blocking the inlets and outlets of MCs protected cells from contamination during irradiation and induced hypoxic conditions. Cells were then exposed to 5, 10, or 20 Gy of photon irradiation using a 10 cm × 12 cm multi-leaf collimator (MLC) measuring 490, 980, or 1961 Monitor Units (MU), respectively. An appropriate build-up effect was established by positioning water-equivalent RW3 plates (PTW, Breisgau, Germany) above and below the cells, such that the source-to-skin distance was 90 cm. Subsequently, 30 min post-irradiation, cells were fixed with 4% paraformaldehyde (PFA) (Sigma-Aldrich, St. Louis, MO, USA) for 20 min at room temperature.

2.5. 2D and 3D In Vitro Irradiation

To measure DNA damage in the 2D and 3D in vitro models, cells were seeded in MCs 24 h prior to the experiment (as described above). For the 2D model, four MCs were positioned next to each other and perpendicular to the beam. Irradiation with the CyberKnife was applied with a 2 cm circular MLC with 2105 MU for 20 Gy on the upper right MC window. In the 3D liver phantom model, ten MCs were positioned throughout the phantom so that MCs #1–5 were located in the anterior half of the liver and MCs #6–10 were positioned in the posterior half of the liver. The remaining space in the liver phantom was then filled with 3 L of 1% agarose gel (Roth Industries GmbH & Co. KG, Dautphetal, Germany). Agarose powder was dissolved in water and heated to 80 °C under continuous stirring conditions to create the gel. The gel was allowed to cool to 37 °C prior to being added to the phantom. MC #3 was selected as the target for the 20 Gy beam during the treatment plan application. After irradiation, MCs were cultured at 37 °C with 5% CO2 for up to 30 min before fixation with 4% PFA for 20 min at room temperature.

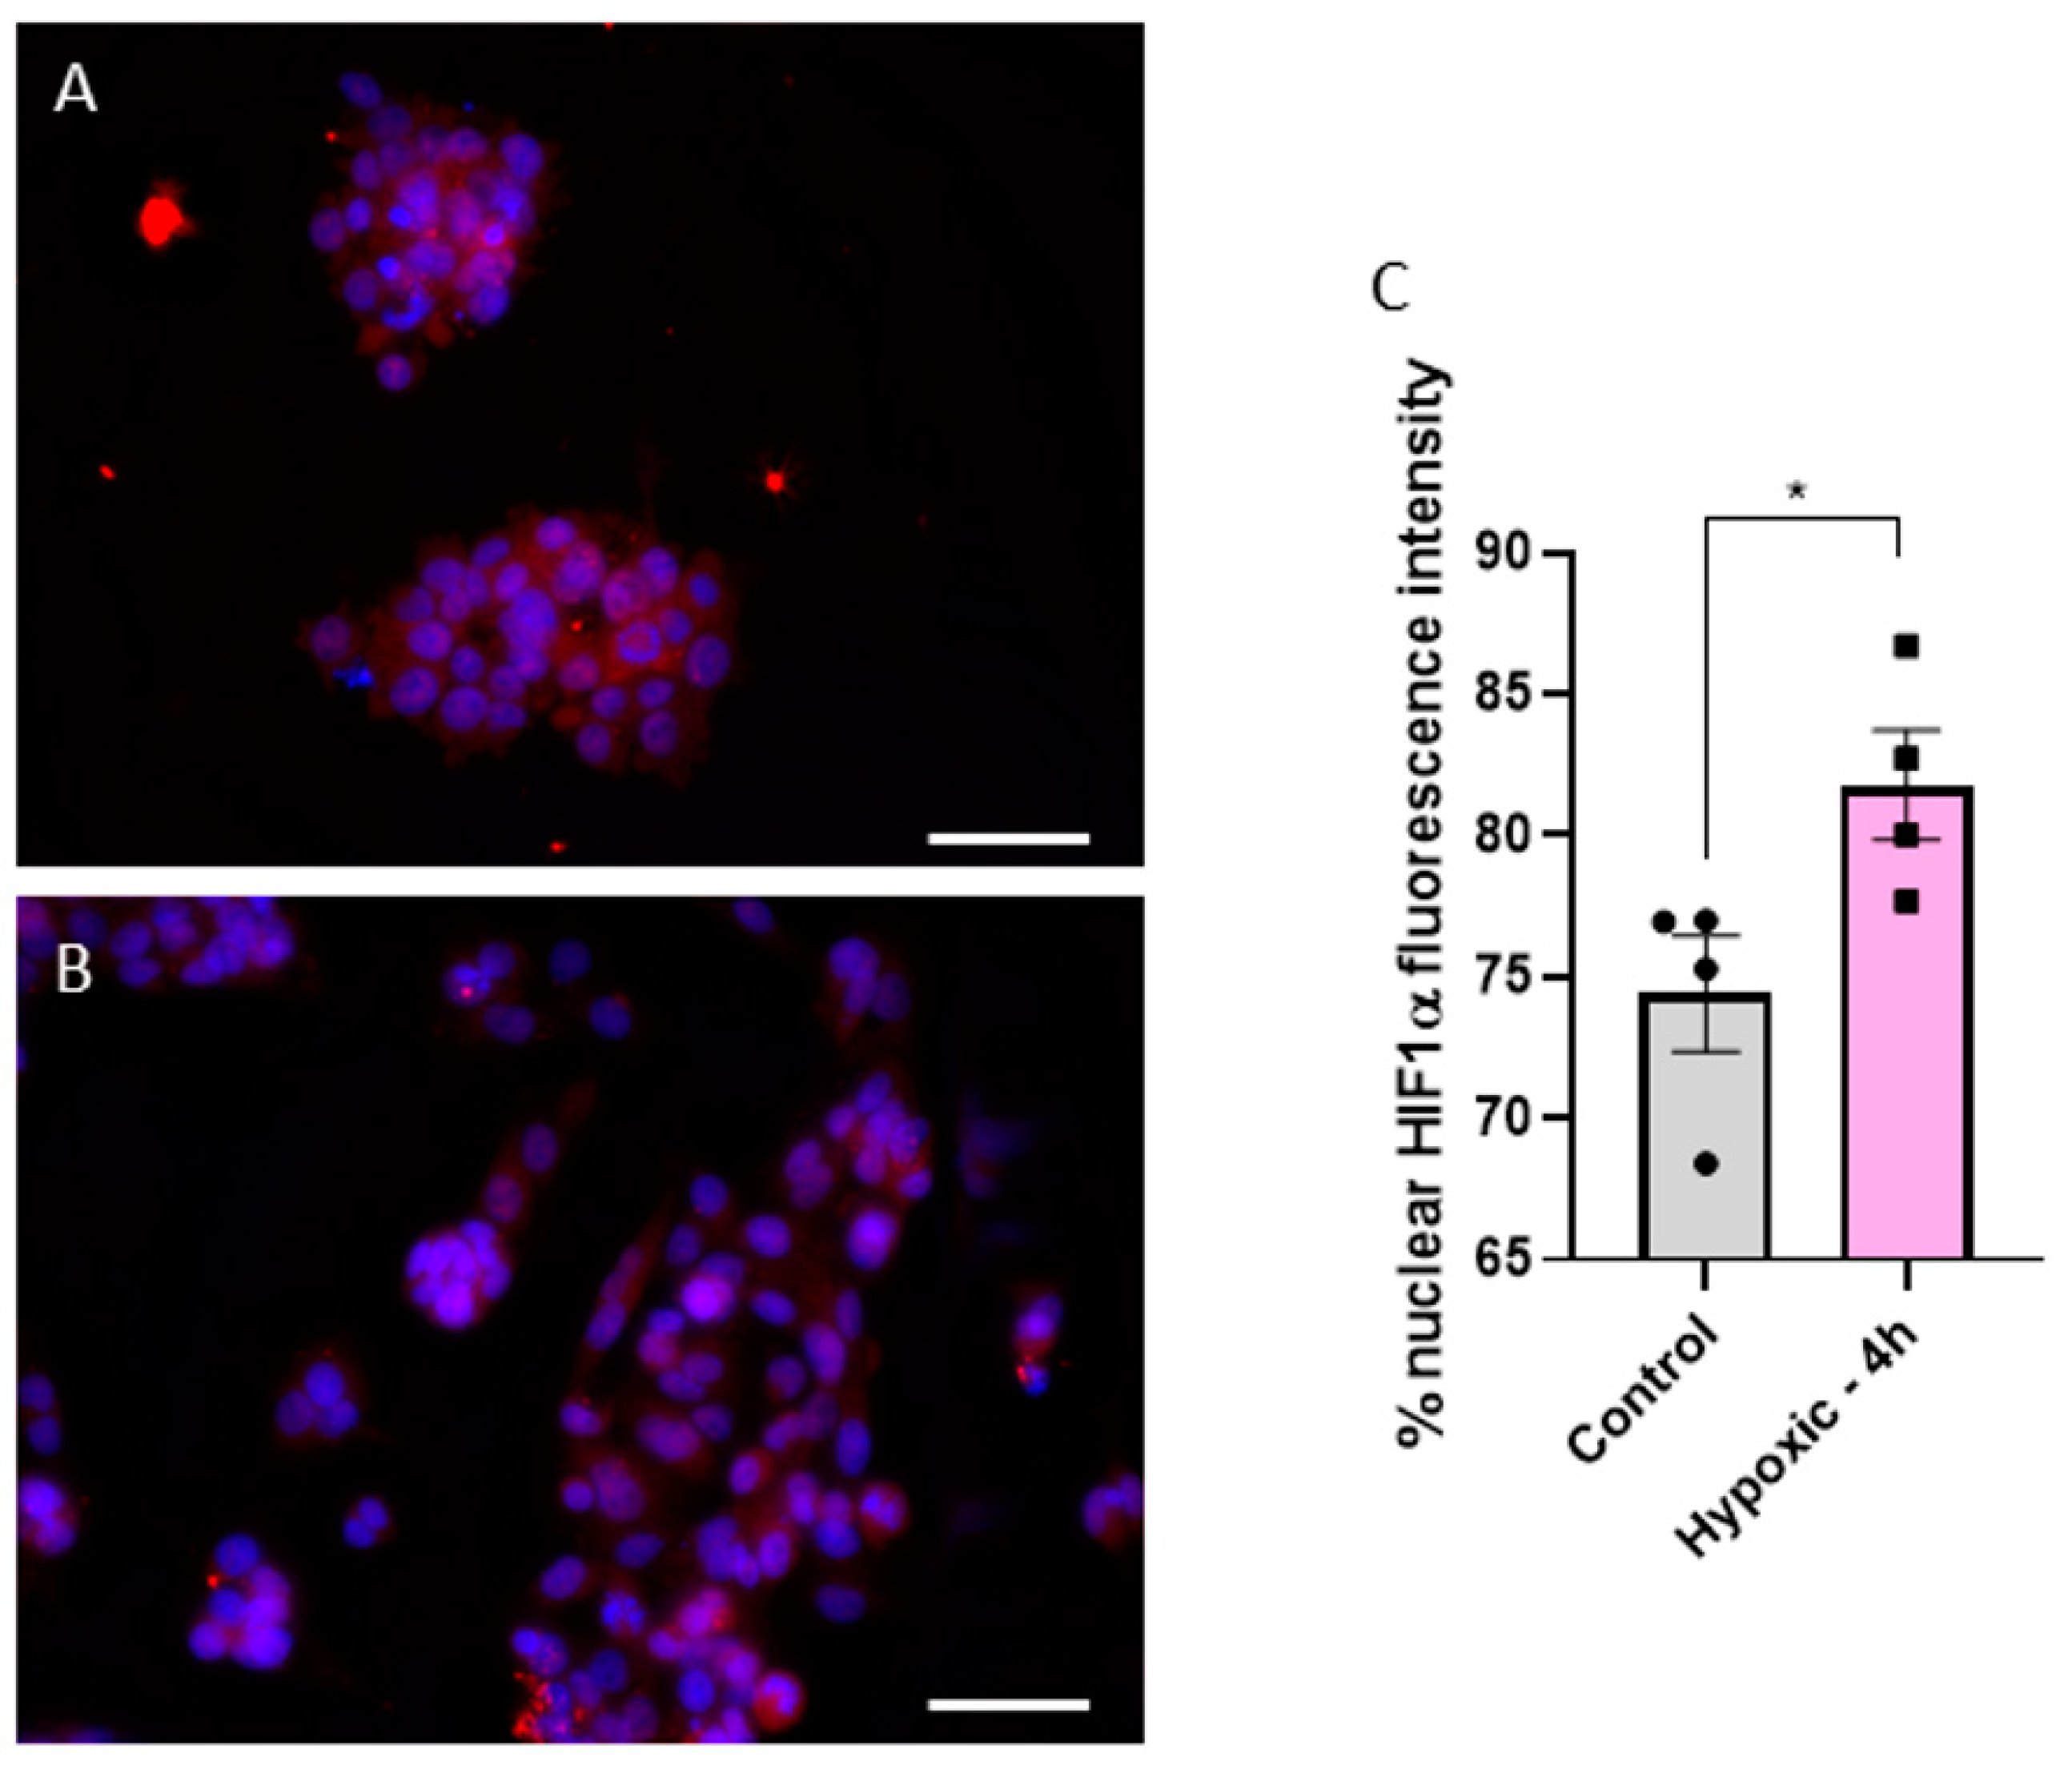
2.6. Validation of Hypoxic Condition

To validate hypoxic conditions in MCs before irradiation, cells were either seeded in MCs (“hypoxic conditions”) or 48-well plates (“normoxic conditions”). To simulate the same conditions as irradiated samples, MC medium was also changed 4 h before fixation. Cells were fixed using 4% PFA for 20 min at room temperature and stained against Hif1α following the immunofluorescence protocol described below.

2.7. Immunofluorescence Staining

Fixed cells were washed twice with 500 µL Dulbecco’s Phosphate Buffered Saline (DPBS) for 10 min. Cells were then treated with 300 µL blocking buffer (3% goat serum, 3% bovine serum albumin (BSA) and 0.8% Triton X-100 in DPBS) for 1 h. Subsequently, irradiated samples and controls were incubated overnight at 4 °C with 250 µL γH2AX rabbit pAb #ab2893 (1:1000, Abcam, Cambridge, UK) in antibody-binding buffer (1% goat serum, 1.5% BSA and 0.5% Triton X-100 in DPBS). Hypoxia validation was confirmed by incubating cells in 500 µL Hif1α rabbit pAb #HPA001275 (1:250, Sigma-Aldrich, St. Louis, MO, USA) in antibody-binding buffer overnight at 4 °C. The next day, cells were washed three times with DPBS and incubated in 250 µL antirabbit IgG secondary antibody CF594 #SAB4600107 (1:400, Sigma-Aldrich, St. Louis, MO, USA) in DPBS for 90 min at room temperature in the dark. Cells were then washed twice with DPBS and DAPI staining was applied (1:1000) for 5 min. Images were taken using a Fluorescence BZ9000 microscope (Keyence, Osaka, Japan) with 10×/0.45 and 40×/0.95 objective. Images for γH2AX and DAPI were taken with an exposure time of 0.1 s and 0.07 s, respectively, and Hif1α was taken at an exposure time of 1.3 s.

2.8. Image and Statistical Analysis

Images were analyzed using Fiji by ImageJ. For γH2AX analysis, positively stained cells were selected using a threshold range of 28 and 255 in the 8-bit, background-corrected images. Next, a watershed algorithm was applied to separate cell clumps and, finally, particles were counted to determine the γH2AX-positive cell count. For Hif1α, 8-bit DAPI images were used to mask 8-bit background-corrected images of Hif1α of the same cells. In this way, only Hif1α was analyzed in DAPI-positive cells, and Hif1α fluorescence intensity was measured in each nucleus. Next, cell intensity was normalized to Hif1α fluorescence intensity in the complete cell to achieve a percentage of Hif1α in the nucleus.
Data are presented as mean ± standard error of mean (SEM), and significance between the two groups was tested using a two-tailed Student’s t-test. Statistical analysis of multiple groups was performed with a one-way analysis of variance (ANOVA) test using either a Dunnett’s or Bonferroni post hoc test. A p-value of less than 0.05 was considered significant.

3. Results

3.1. Microfluidic Chips Successfully Simulate the Hypoxic Condition of a Solid Tumor

As previously mentioned, one key characteristic of HCC is the hypoxic environment generated within the solid tumor due to rapid cellular proliferation. To confirm hypoxic conditions of HepG2 cells in MCs, we measured Hif1α expression in the nucleus, a common hypoxia marker [12], and compared it to cells cultured in standard 48-well plates. A translocation of Hif1α from the cytoplasm to the nucleus is visible in Figure 2A,B. We found a significant increase in Hif1α fluorescence intensity from 74.4% ± 2.0% in well- plate-cultured cells to 81.8% ± 1.9% in MC-cultured cells (p = 0.0395) (Figure 2C). This confirms that cells grown in MCs experience hypoxia and better simulate the realistic hypoxic conditions in the HCC tumor environment.

3.2. In Vitro Response to Photon Irradiation in Normoxic and Hypoxic Conditions

Conventionally, most irradiation studies utilize monolayer “normoxic” in vitro approaches. Therefore, we wanted to observe how cancer cells grown in both hypoxic and normoxic conditions respond to irradiation treatment. As shown in Figure 3, HepG2 cells grown under normoxic conditions demonstrated a dose-dependent increase in DNA damage upon radiation with 5, 10, and 20 Gy, as indicated by γH2AX-positive staining (Figure 3A–D). Indeed, the γH2AX-positive cell fraction 30 min post 5 Gy treatment increased to 45.93% ± 7.15% (p < 0.0001) when compared to non-irradiated controls, with higher radiation doses further increasing γH2AX expression in samples irradiated with 10 Gy and 20 Gy up to 70.99% ± 8.50% (p < 0.0001) and 79.64% ± 7.97% (p < 0.0001), respectively (Figure 3E–G). Although γH2AX response was prolonged up to one hour after irradiation with 77.54% ± 4.13% (p < 0.0001) and 96.11% ± 10.82% (p < 0.0001) γH2AX-positive cells in 10 Gy and 20 Gy samples, respectively (Figure 3F,G), 5 Gy irradiated cells grown in well plates had a maximum response at 30 min post irradiation (Figure 3E). Therefore, fixation at 30 min post irradiation was set for MCs. Within these, a dose-dependent effect was also observed. For 5, 10, and 20 Gy, the γH2AX-positive cell rate reached 19.75% ± 5.47% (p = 0.01), 28.98% ± 5.73% (p < 0.0001) and 55.55% ± 16.47% (p < 0.0001), respectively (Figure 3H). However, γH2AX response was significantly reduced in the hypoxic MC environment by 57.00% (p < 0.0001), 59.18% (p < 0.0001), and 30.24% (p = 0.0001) for 5, 10, and 20 Gy, respectively, compared to normoxic conditions (Figure 3H). Our findings here fit well with other literature reports that hypoxia can result in radiotherapy resistance. Therefore, taken together, our data offer an alternative and more appropriate in vitro approach for the study of HCC, and a potential model to study radiotherapy resistance—a significant hurdle in the clinic.

3.3. Analysis of 2D and 3D Radiotherapy on HepG2 Cells

Two- and three-dimensional irradiation strategies were previously described above. Briefly, in the 2D model, four MCs were positioned next to each other and irradiated at a 90° angle, whereas in the 3D model, 10 MCs were strategically arranged in the anthropomorphic liver phantom (Figure 4A,B). An irradiation treatment plan of the 3D liver phantom which targets MC #3 was developed and can be visualized in Figure 4C and Supplementary Figure S1C.
Homogenous irradiation of the 2D in vitro model indicated DNA damage, as visualized by γH2AX staining, of 46.21% ± 8.38% (p < 0.0001) at the isocenter (Figure 4D). However, γH2AX staining in MCs >15 mm from the isocenter was no longer significantly increased (Figure 4D). On the other hand, irradiation of the 3D liver phantom significantly increased the γH2AX-positive cell rate in multiple MCs when compared to non-irradiated controls (Figure 4E). Indeed, the γH2AX response in MC #3 increased 36.61% ± 8.66% (p < 0.0001) (Figure 4E,J) compared to non-irradiated cells (Figure 4G). Additionally, a significant increase in the γH2AX-positive cell fraction was found cranial from the isocenter, with 24.38% ± 7.20% (p < 0.0001) (MC #2, Figure 4E,I) and 15.25% ± 2.57% (p < 0.0001) (MC #6). Additionally, in MC #1, 20 mm apart from the isocenter, a significant increase in γH2AX-positive cells was found (p = 0.0009, Figure 4E,H). However, cells caudal from the isocenter did not show an increased γH2AX expression (Figure 4E, MCs #7–#10). Comparing the irradiation effect in target MC #3 (36.61% ± 8.66%) with the cell response in the 2D model (46.21% ± 8.38%), DNA damage in MC #3 showed a significantly reduced γH2AX positive cell count of 9.6% (p = 0.0294) (Figure 4F). Therefore, we show that while the absolute estimated dose in the target region was significantly decreased in our 3D model, the dose area in the 2D model was greatly increased. Taken together, this model illustrates significant discrepancies between 2D and 3D model systems, which is an important step towards a better understanding of HCC response to radiotherapy treatment.

4. Discussion

The liver phantom proposed in this study enables 3D analysis and evaluation of the in vitro response to irradiation in an environment that closely resembles the relevant spatial organization and tissue environment in the human organ, as well as a relevant hypoxic tumor microenvironment. This was achieved by using a 1% agarose mixture, which adopts the attenuation coefficient of liver tissue. Additionally, agarose has been used before in phantoms for radiotherapy to simulate soft tissue equivalent absorption and scattering properties [13,14,15,16]. Furthermore, growing cells in MCs resulted in hypoxic conditions, and thus provided a close simulation of the biological conditions of an anthropomorphic tumor environment comparable with the real HCC microenvironment.
Of course, there are some limitations in this study that could be addressed in future research. First, in this study, only one cell line from hepatoblastoma was used. We selected HepG2 cells, which have been widely used as a model for HCC and hepatocyte-specific metabolic properties. Gene expression and proteomics studies show HCC-like expression patterns [17,18] and hepatocyte-like metabolism when grown in MCs [11]. Furthermore, other studies used this hepatic cell line in hypoxia studies, demonstrating comparable hypoxic effects, as in other HCC cell lines [19,20]. Depletion of oxygen concentration was measured in the MCs by showing Hif1α nuclear translocation. In future studies, advanced MCs could be used that enable oxygen measurement within the chip to provide more detailed information on the growth conditions in the MCs.
Nevertheless, our experiments clearly showed the toxic effect of radiation on HepG2 cells, as previously published [21]. Indeed, as expected, irradiation of the liver phantom increased γH2AX, a marker of DNA damage, in HepG2 cells (MC #3). Additionally, cells in the MCs above the target zone (MCs #2 and #6) had significantly increased γH2AX expression rates. Interestingly, the MCs directly below the irradiated MC #3 (MCs #4 and #5) were less affected by the irradiation (Figure 4E). These results can be explained by the setup of the CyberKnife. The robotic arm with the irradiation source of the device can apply radiation from every angle. As the target was located further to the cranial side of the liver, radiation from the caudal side was reduced to spare tissue below the target. This also explains why γH2AX expression in MC #1, which is two MCs away from the target, was also significantly increased. Furthermore, it elucidates the high level of detected irradiation on MC #6, which is positioned at the cranial site in the posterior half of the liver (Figure 4E). When comparing these results with the 2D in vitro model, not only was DNA damage at the isocenter of the beam significantly reduced in the 3D model but also the radiation dose around the isocenter was significantly increased (Figure 4E).
These findings emphasize the need for appropriate 3D anthropomorphic models for radiation intervention research and dose validation in preclinical models. This is especially necessary because single-shot radiotherapy will set a new standard of treatment that requires robust and reproducible verification.
Furthermore, this study is of interest for in vitro research in the field of radiotherapy in order to not solely depend on Monte Carlo simulation, but actually introduce biological, living material in an anthropomorphic organ phantom. Although simple radiation understanding can be still achieved by using 2D cell culture, this method could ensure that the planned dose reaches the desired clinical outcome and spare healthy parts of the organ. Consequently, the next step would be to individualize this method by 3Dprinting organs according to the patient’s CT, and to introduce biopsy-derived samples of the patient in the phantom to analyze the individual, patient-specific outcome after irradiation. Finally, microfluidic technology in combination with 3D phantom models may offer the possibility of drug screening in tiny volumes. In the future, our proposed liver phantom may allow for the analysis of cytotoxic and antiproliferation effects of combined radiotherapy and chemotherapy in an anthropomorphic microenvironment [21].

5. Conclusions

In this study, a 3D anthropomorphic liver phantom for in vitro dose-verification measurements within HCC simulation was developed. Therefore, HepG2 cells were introduced in a hypoxic microenvironment and irradiated with the Cyberknife. To the best of our knowledge, this is the first anthropomorphic phantom that incorporates cells for irradiation. We successfully showed that cells are significantly affected according to their positioning, beam scattering, and heterogeneous oxygen condition in this anthropomorphic liver phantom. Therefore, the development of 3D anthropomorphic-shaped models is necessary for newly emerging one-shot radiotherapy, as it enables a representation of the human interior.

Supplementary Materials

The following supporting information can be downloaded at: https://www.mdpi.com/article/10.3390/app122110867/s1, Figure S1: Picture of the liver phantom from inside with beekleys on the surface and inserts for MCs (A, B). Monte Carlo simulation of liver treatment plan from caudal with purple = 0.14 Gy, green = 2.86 Gy and pink = 20.00 Gy (C).

Author Contributions

Conceptualization: C.S., S.G., A.W. and S.W.; Data curation: C.S., S.G., A.W. and B.M.; Data analysis: C.S., S.G. and A.W. Data interpretation: C.S., S.G. and A.W., B.M. and S.W.; Funding acquisition, S.W.; Experiments: C.S. and S.G.; Methodology: C.S., S.G. and S.W.; Resources: S.W.; Supervision: S.W.; Validation: C.S. and S.G.; Visualization, C.S.; Writing—original draft: C.S.; Writing—review and editing, C.S., B.M. and S.W. All authors have read and agreed to the published version of the manuscript.

Funding

This research was funded by the German Ministry for Education and Research, grant number BMBF FKZ: 01EK1612C.

Institutional Review Board Statement

Not applicable.

Informed Consent Statement

Not applicable.

Data Availability Statement

Not applicable.

Acknowledgments

We thank Nina Niebuhr and Sinem Erdem for their great assistance and support with the cell irradiation using the Cyberknife. Furthermore, we would also like to show our gratitude to Lucy Zhao for her comments, which greatly improved the manuscript.

Conflicts of Interest

The authors declare no conflict of interest.

References

  1. Guo, Y.; Xiao, Z.; Yang, L.; Gao, Y.; Zhu, Q.; Hu, L.; Huang, D.; Xu, Q. Hypoxia-inducible factors in hepatocellular carcinoma (Review). Oncol. Rep. 2020, 43, 3–15. [Google Scholar] [CrossRef] [PubMed] [Green Version]
  2. Lin, C.-A.; Chang, L.-L.; Zhu, H.; He, Q.-J.; Yang, B. Hypoxic microenvironment and hepatocellular carcinoma treatment. Hepatoma Res. 2018, 4, 26. [Google Scholar] [CrossRef]
  3. Galle, P.R.; Forner, A.; Llovet, J.M.; Mazzaferro, V.; Piscaglia, F.; Raoul, J.-L.; Schirmacher, P.; Vilgrain, V. EASL Clinical Practice Guidelines: Management of hepatocellular carcinoma. J. Hepatol. 2018, 69, 182–236. [Google Scholar] [CrossRef] [PubMed] [Green Version]
  4. Benson, A.B.; D’Angelica, M.I.; Abbott, D.E.; Abrams, T.A.; Alberts, S.R.; Saenz, D.A.; Are, C.; Brown, D.B.; Chang, D.T.; Covey, A.M.; et al. NCCN Guidelines Insights: Hepatobiliary Cancers, Version 1.2017. J. Natl. Compr. Canc. Netw. 2017, 15, 563–573. [Google Scholar] [CrossRef] [PubMed]
  5. Park, S.; Yoon, W.S.; Rim, C.H. Indications of external radiotherapy for hepatocellular carcinoma from updated clinical guidelines: Diverse global viewpoints. World J. Gastroenterol. 2020, 26, 393–403. [Google Scholar] [CrossRef] [PubMed]
  6. Shanker, M.D.; Liu, H.Y.; Lee, Y.Y.; Stuart, K.A.; Powell, E.E.; Wigg, A.; Pryor, D.I. Stereotactic radiotherapy for hepatocellular carcinoma: Expanding the multidisciplinary armamentarium. J. Gastroenterol. Hepatol. 2020, 36, 873–884. [Google Scholar] [CrossRef] [PubMed]
  7. Kuwahara, Y.; Li, L.; Baba, T.; Nakagawa, H.; Shimura, T.; Yamamoto, Y.; Ohkubo, Y.; Fukumoto, M. Clinically relevant radioresistant cells efficiently repair DNA double-strand breaks induced by X-rays. Cancer Sci. 2009, 100, 747–752. [Google Scholar] [CrossRef]
  8. Tesei, A.; Sarnelli, A.; Arienti, C.; Menghi, E.; Medri, L.; Gabucci, E.; Pignatta, S.; Falconi, M.; Silvestrini, R.; Zoli, W.; et al. In vitro irradiation system for radiobiological experiments. Radiat. Oncol. 2013, 8, 257. [Google Scholar] [CrossRef] [Green Version]
  9. Brüningk, S.C.; Rivens, I.; Box, C.; Oelfke, U.; Haar, G. ter. 3D tumour spheroids for the prediction of the effects of radiation and hyperthermia treatments. Sci. Rep. 2020, 10, 1653. [Google Scholar] [CrossRef] [PubMed] [Green Version]
  10. Ding, C.; Saw, C.B.; Timmerman, R.D. Cyberknife stereotactic radiosurgery and radiation therapy treatment planning system. Med. Dosim. 2018, 43, 129–140. [Google Scholar] [CrossRef] [PubMed]
  11. Theobald, J.; Ghanem, A.; Wallisch, P.; Banaeiyan, A.A.; Andrade-Navarro, M.A.; Taškova, K.; Haltmeier, M.; Kurtz, A.; Becker, H.; Reuter, S.; et al. Liver-Kidney-on-Chip To Study Toxicity of Drug Metabolites. ACS Biomater. Sci. Eng. 2018, 4, 78–89. [Google Scholar] [CrossRef] [PubMed]
  12. Chilov, D.; Camenisch, G.; Kvietikova, I.; Ziegler, U.; Gassmann, M.; Wenger, R.H. Induction and Nuclear Translocation of Hypoxia-Inducible Factor-1 (HIF-1): Heterodimerization with ARNT Is Not Necessary for Nuclear Accumulation of HIF-1alpha. Available online: https://www.zora.uzh.ch/id/eprint/66/ (accessed on 24 November 2021).
  13. Niebuhr, N.I.; Johnen, W.; Echner, G.; Runz, A.; Bach, M.; Stoll, M.; Giske, K.; Greilich, S.; Pfaffenberger, A. The ADAM-pelvis phantom-an anthropomorphic, deformable and multimodal phantom for MRgRT. Phys. Med. Biol. 2019, 64, 04NT05. [Google Scholar] [CrossRef] [PubMed]
  14. Aranda-Lara, L.; Torres-García, E.; Oros-Pantoja, R. Biological Tissue Modeling with Agar Gel Phantom for Radiation Dosimetry of 99mTc. Open J. Radiol. 2014, 04, 44–52. [Google Scholar] [CrossRef] [Green Version]
  15. Singhrao, K.; Fu, J.; Wu, H.H.; Hu, P.; Kishan, A.U.; Chin, R.K.; Lewis, J.H. A novel anthropomorphic multimodality phantom for MRI-based radiotherapy quality assurance testing. Med. Phys. 2020, 47, 1443–1451. [Google Scholar] [CrossRef] [PubMed]
  16. Gillmann, C.; Homolka, N.; Johnen, W.; Runz, A.; Echner, G.; Pfaffenberger, A.; Mann, P.; Schneider, V.; Hoffmann, A.L.; Troost, E.G.C.; et al. Technical Note: ADAM PETer—An anthropomorphic, deformable and multimodality pelvis phantom with positron emission tomography extension for radiotherapy. Med. Phys. 2021, 48, 1624–1632. [Google Scholar] [CrossRef] [PubMed]
  17. Arzumanian, V.A.; Kiseleva, O.I.; Poverennaya, E.V. The Curious Case of the HepG2 Cell Line: 40 Years of Expertise. Int. J. Mol. Sci. 2021, 22, 13135. [Google Scholar] [CrossRef] [PubMed]
  18. Nwosu, Z.C.; Battello, N.; Rothley, M.; Piorońska, W.; Sitek, B.; Ebert, M.P.; Hofmann, U.; Sleeman, J.; Wölfl, S.; Meyer, C.; et al. Liver cancer cell lines distinctly mimic the metabolic gene expression pattern of the corresponding human tumours. J. Exp. Clin. Cancer Res. 2018, 37, 211. [Google Scholar] [CrossRef] [PubMed]
  19. Zhang, J.; Zhang, Y.; Mo, F.; Patel, G.; Butterworth, K.; Shao, C.; Prise, K.M. The Roles of HIF-1α in Radiosensitivity and Radiation-Induced Bystander Effects Under Hypoxia. Front. Cell Dev. Biol. 2021, 9, 637454. [Google Scholar] [CrossRef] [PubMed]
  20. Chaston, T.B.; Matak, P.; Pourvali, K.; Srai, S.K.; McKie, A.T.; Sharp, P.A. Hypoxia inhibits hepcidin expression in HuH7 hepatoma cells via decreased SMAD4 signaling. Am. J. Physiol. Cell Physiol. 2011, 300, C888–C895. [Google Scholar] [CrossRef] [PubMed]
  21. Zhao, W.; Cong, L.; Guerrero-Sánchez, Y. Radiation effects of nuclear physics rays on hepatoma cells. Open Phys. 2019, 17, 167–176. [Google Scholar] [CrossRef]
Figure 1. A 3D-printed liver model from the anterior (A), posterior (B) and cranial (C) side. In (A) the inserts for the MCs in the liver phantom are visible. The two holes at the cranial side were used for agarose filling. Schematic figure of MC (D) made of polystyrene with media (red) in the cavity for cells.
Applsci 12 10867 g001
Figure 2. Fluorescence images of Hif1α (red) and DAPI (blue) stained cells in either normoxic (A) or hypoxic (B) conditions. Statistical comparison of fluorescence intensity of Hif1α in the nucleus between normoxic (control) and hypoxic conditions (4 h in a MC) (C). Fluorescence images were acquired with a 40× objective; the white scale bar corresponds to 20 µm. Statistics were performed with a two-tailed t-test using Bonferroni for post hoc test. n = 4, * p < 0.05.
Applsci 12 10867 g002
Figure 3. Fluorescence images of cells seeded in MCs, DAPI visualized in blue and γH2AX in red (AD). γH2AX positive cells in control cells (A) and cells irradiated with 5 Gy (B), 10 Gy (C), and 20 Gy (D) merged with DAPI staining. Time lapse from 10 min to 24 h after irradiation of γH2AX intensity in cells irradiated with 5 Gy (E), 10 Gy (F), and 20 Gy (G). Comparison of γH2AX positive cell count seeded in MCs and 48-well plates after irradiation with 5, 10, and 20 Gy (H). Fluorescence images were acquired with a 10× objective; the white scale bar corresponds to 100 µm. Statistics were performed with one-way ANOVA (EG) and two-way ANOVA (H) using Bonferroni for post-hoc test. n = 5, *** p < 0.001, **** p < 0.0001.
Applsci 12 10867 g003
Figure 4. A 3D phantom with MCs #1 to #5 positioned in the anterior half of the liver (A), and MCs #6 to #10 located in the posterior half of the liver (B). Yellow circle indicates target position of the treatment plan (MC #3) (A). Irradiation plan from Monte Carlo simulation from the coronal plane with purple = 0.14 Gy, green = 2.86 Gy, and pink = 20 Gy (C). Measured γH2AX percentage of cells irradiated with 20 Gy in a 2D irradiation setup for 5 MCs with 4 MCs located at varying distances from the isocenter (0/orange bar) (D). Measured γH2AX percentage of cells for MCs #1–#10 in the 3D model irradiated at MC #3 (yellow bar/arrow) with 20 Gy (E). HepG2 cells irradiated in the 2D setup (20 Gy) were compared with cells irradiated in MC #3 in the phantom (20 Gy) (F). Representative images of non-irradiated control (G), MC #1 (H), #2 (I), and #3 (J) are presented with 10× magnification. White scale bar corresponds to 100 µm. Significance was tested with a two-way ANOVA and Bonferroni post hoc test (H,I) and an unpaired t-test (G). To enhance readability, only significance compared to control is shown. n = 5, * p < 0.05, *** p < 0.001, **** p < 0.0001.
Applsci 12 10867 g004
Publisher’s Note: MDPI stays neutral with regard to jurisdictional claims in published maps and institutional affiliations.

