
Natural Language Processing Application on Commit Messages: A Case Study on HEP Software


Abstract
1. Introduction
- RQ1:
- What has been the impact of NLP techniques on the data preparation step?
- RQ2:
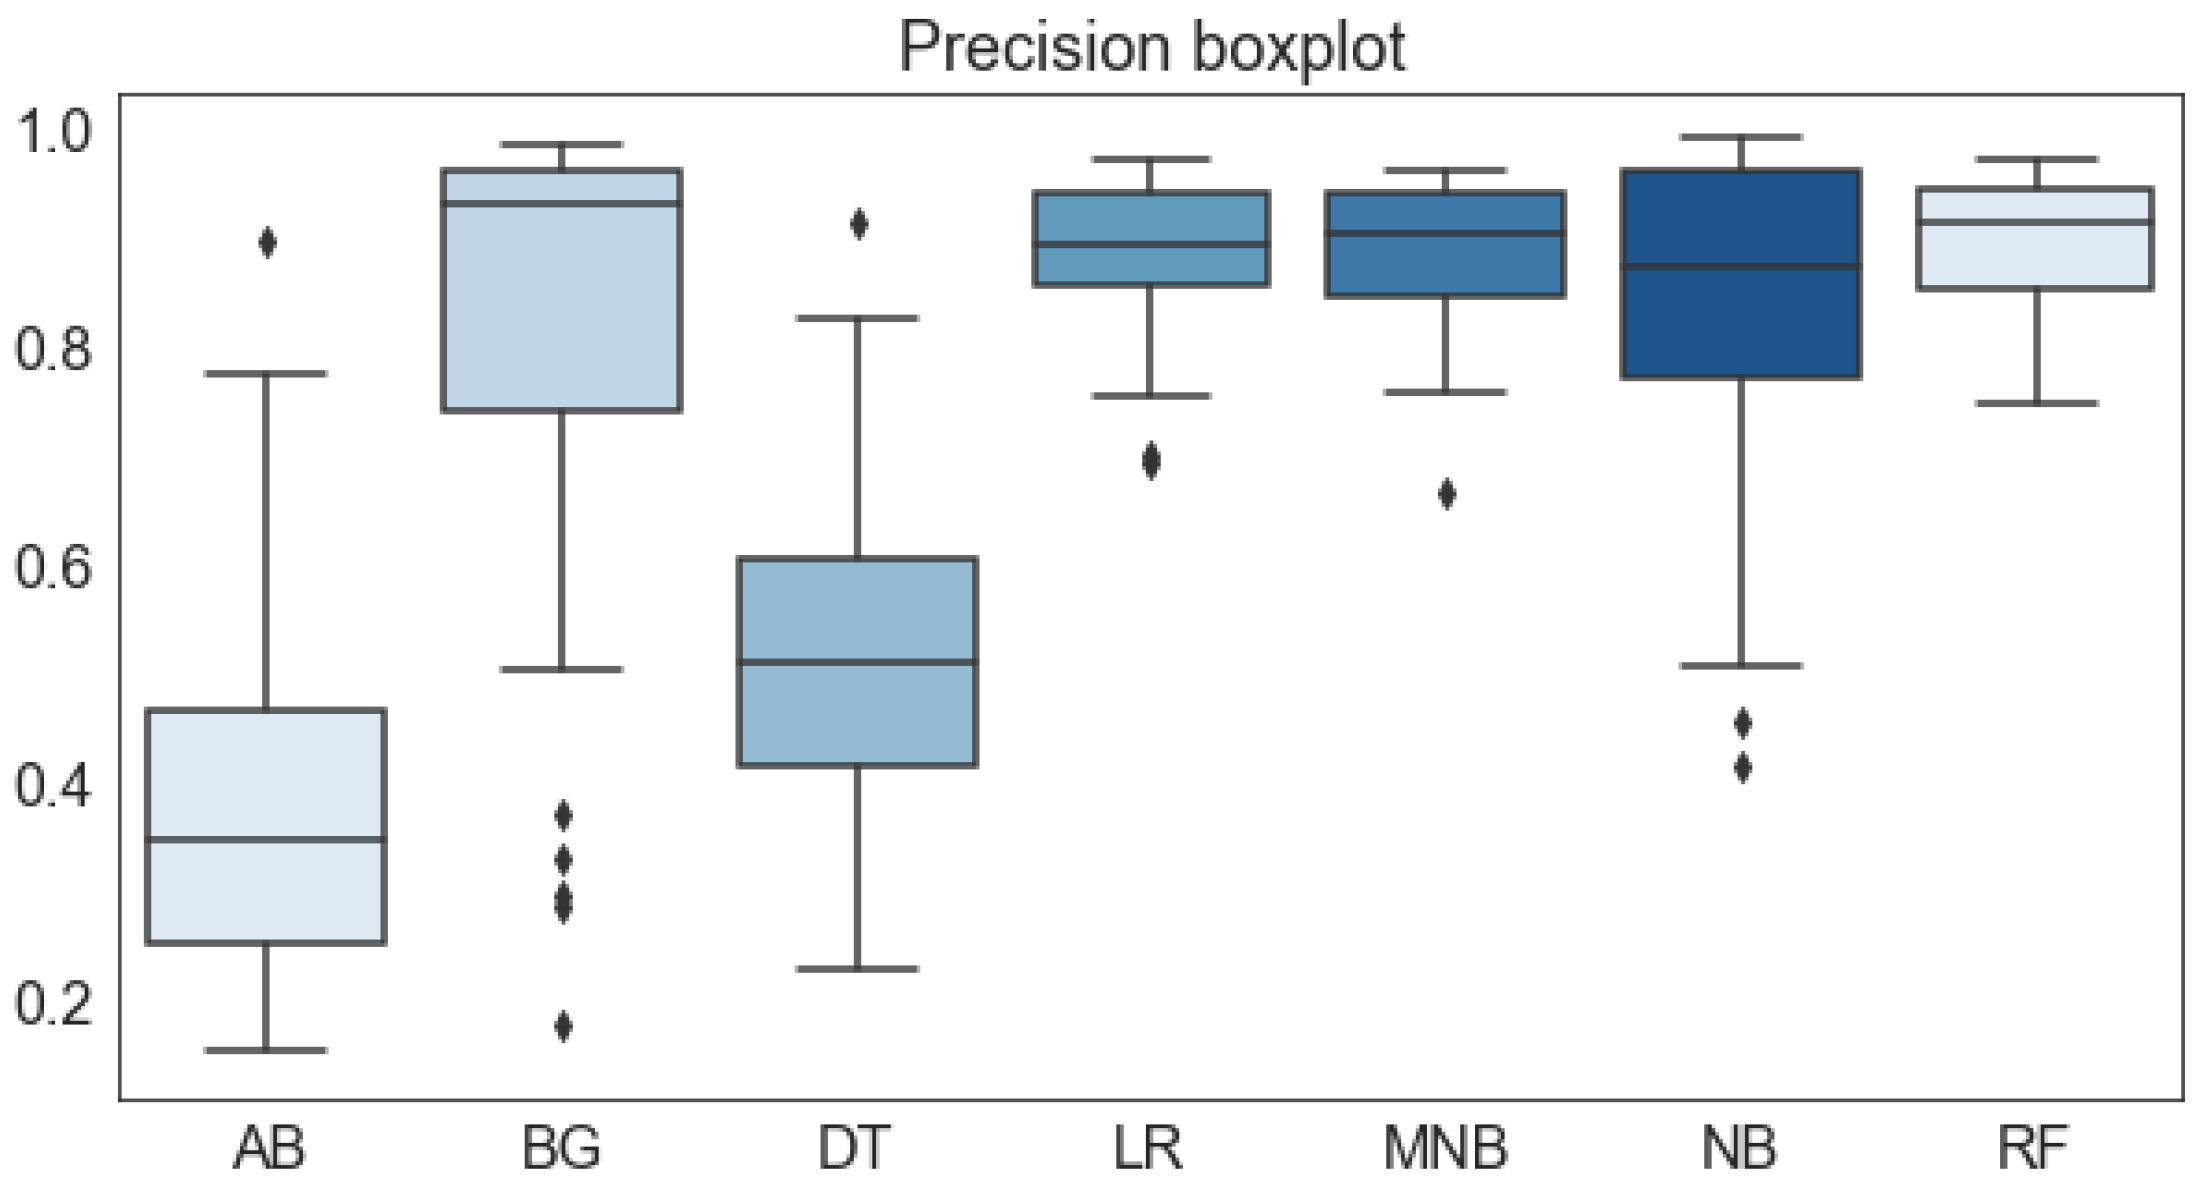
- Which ML classification techniques have the best performance of new commits classification?
- RQ3:
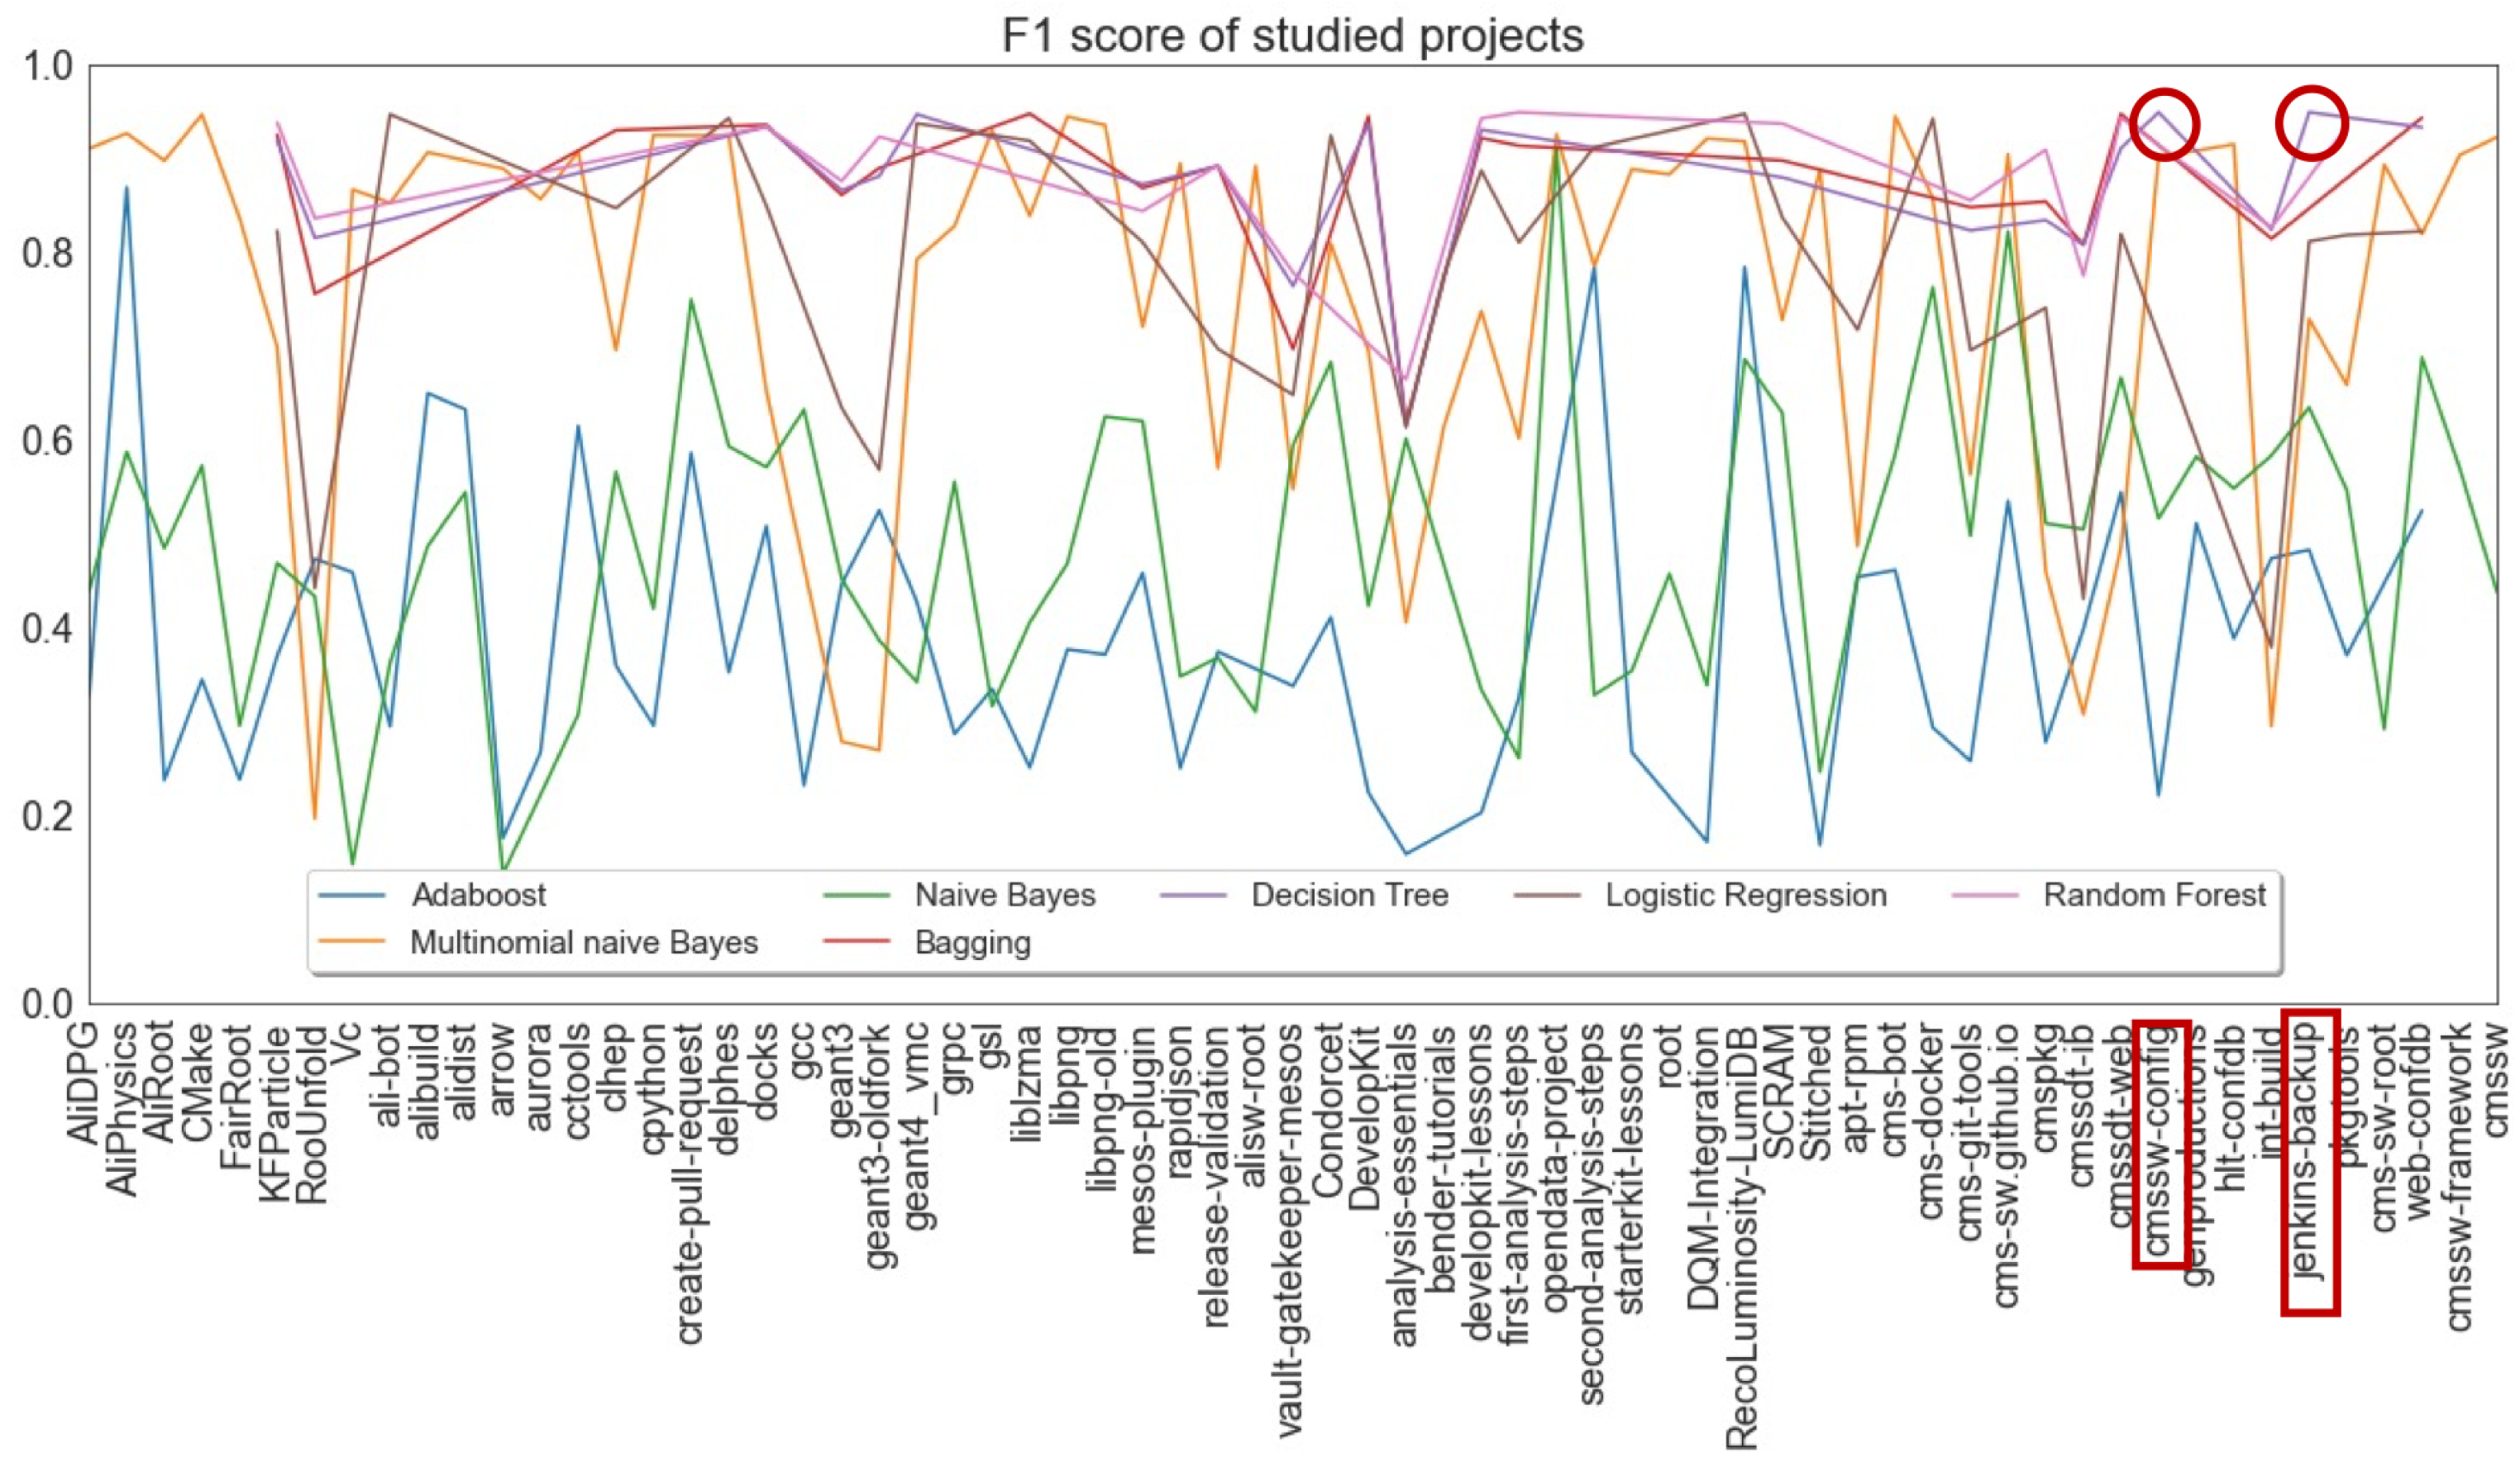
- Do the models behave differently for different projects?
2. Related Work
2.1. NLP Techniques on Commit Messages
2.2. Classification of Commits
2.3. Clustering Analysis of Commits
2.4. Sentiment Analysis and Clustering Models
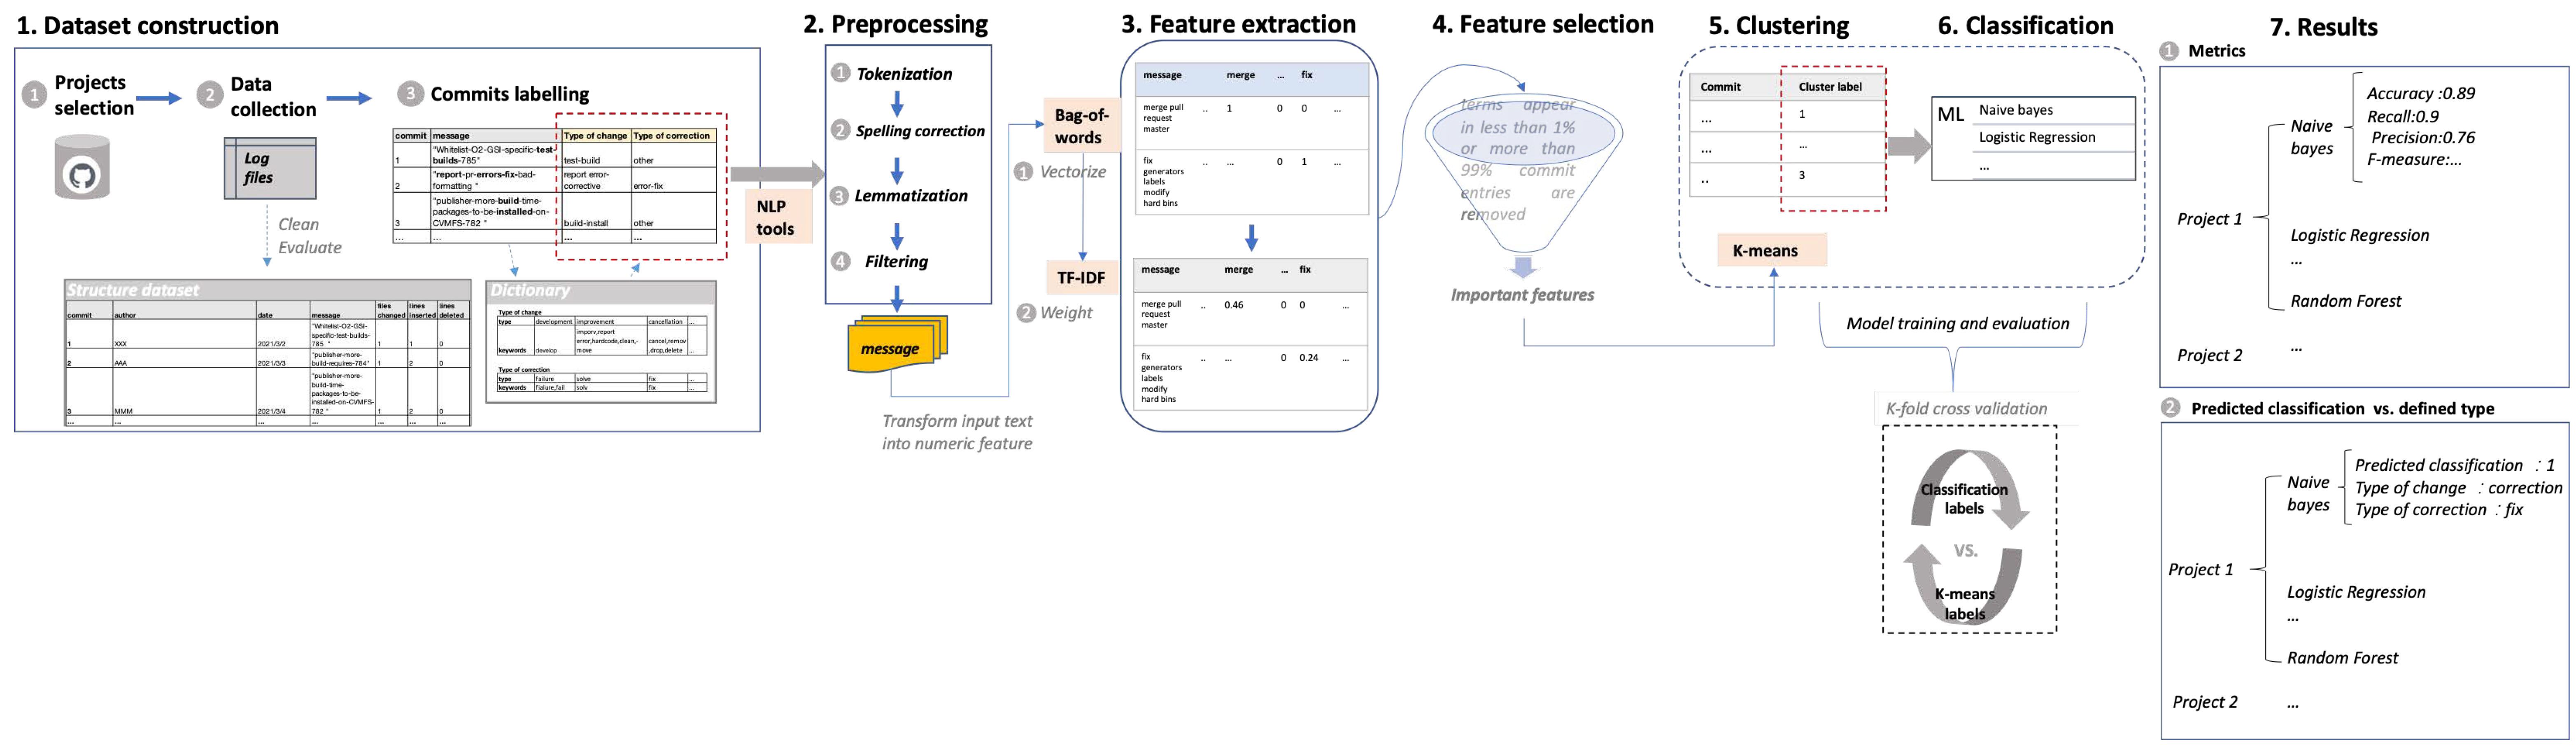
3. Methodology
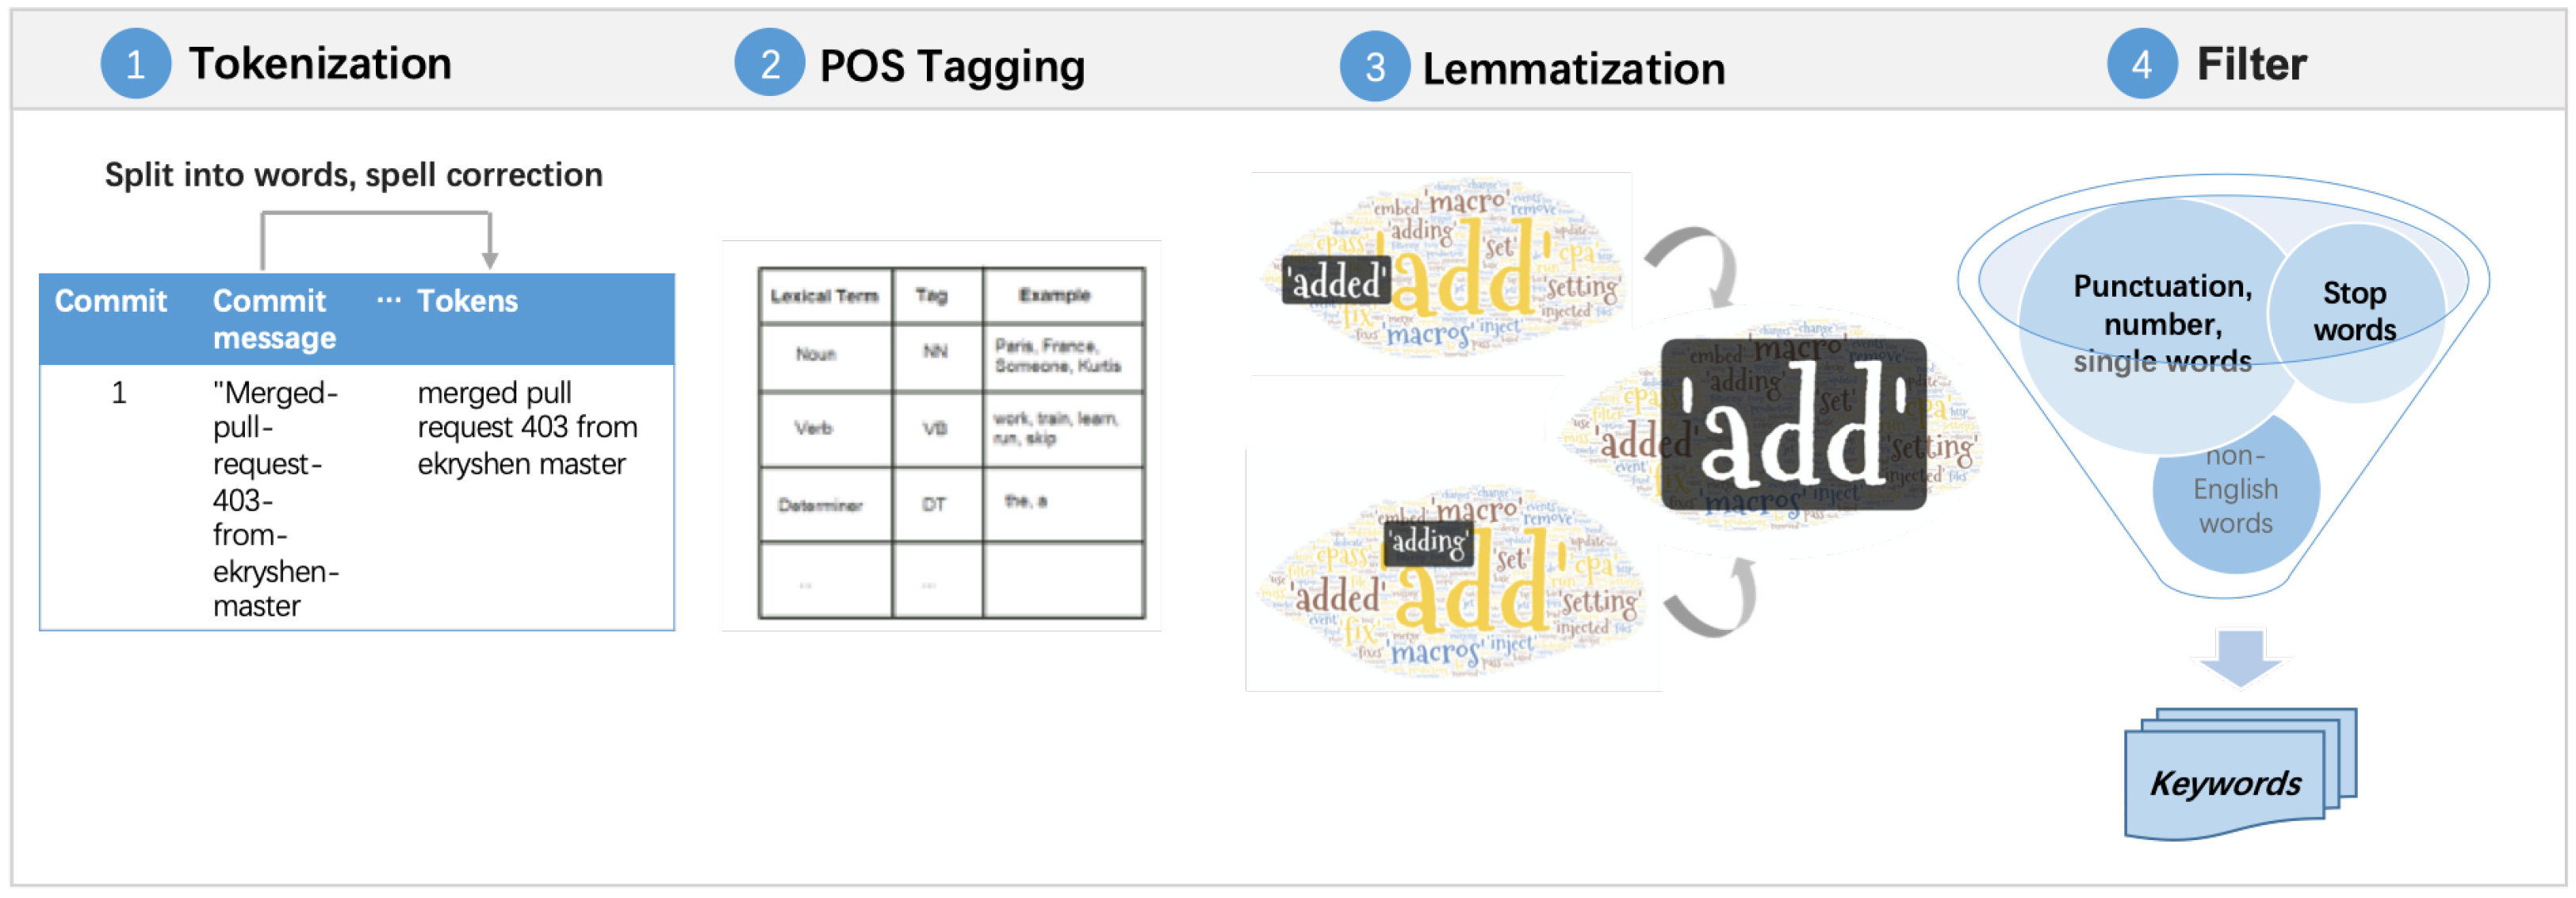
- Tokenization splits text into single words. Usually, word tokens are separated by spaces and sentence tokens are separated by stop characters. In this study, we have applied word tokenization removing punctuation and capital letters.
- POS tagging involves adding a part-of-speech category to each token in the text. Categories include nouns, verbs, adverbs, adjectives, pronouns, conjunctions, and their subcategories. POS tagging helps to identify the syntactic relationships between words to understand the meaning of sentences.
- Lemmatization takes into consideration the morphological analysis of the words, converting the given word to its base form in a dictionary. This approach recognizes the inflectional form of the word and returns its basic form (for example, “are” is reduced to “be”).
- Stop-words removal exploits words, such as articles, pronouns, and prepositions, that bring little contextual information, but their occurrence frequency is high. This activity reduces the number of features and the noise in text, and helps to obtain key information.
- Naive Bayes and Multinomial Naive Bayes techniques that belong to the same model family. The various Naive Bayes classifiers have a different assumption about the likelihood of the features [49]. For example, in the Multinomial Naive Bayes classifier (that is usually used when data contains discrete features), the assumption is that features are generated from a multinomial distribution.
- Logistic Regression that is a special generalized linear model that is used to explain the relationship between a dependent variable and one or more independent variables. Logistic regression can be binomial or multinomial: binary logistical regression is used for a dependent variable that has two types of outcome, and multinomial logistic regression is used for a dependent variable that has more than two types of outcome [50].
- Decision Tree that is widely used in data mining, and there are two types of tree models, i.e., classification trees and regression trees. They aim at predicting the value of a target variable based on input variables [50].
- Random Forest that is a type of Bagging method, and its base classifier is a decision tree. It is an ensemble learning method mainly for classification and regression tasks. It constructs a great number of decision trees at the training phase, and its final result is the mode of the classes or the mean value of individual trees. During the training phase, it also introduces randomness for feature selection. Only a subset of features and samples are considered for each decision tree. Random Forest reduces the risk of over-fitting.
- Bagging, also called bootstrap aggregating, that is an ensemble meta-algorithm that aims at improving the model stability. Bagging trains each model using a subset that is chosen randomly from the training set. It takes the majority vote class or takes the mean value of the individual model as the final prediction result. It can be applied to some base classifiers (e.g, decision trees, K-nearest neighbour, and logistic regression).
- AdaBoost is an adaptive boosting algorithm. The method increases the weight of the misclassified samples of the previous classifiers so that the new classifier can focus on the training samples that are prone to misclassification. As for the Bagging method, it relies on Decision Tree models as base classifier thus its results can be compared with tree-based methods [51] (e.g., Decision Tree and Random Forest).
4. Database Construction
5. Data Preprocessing
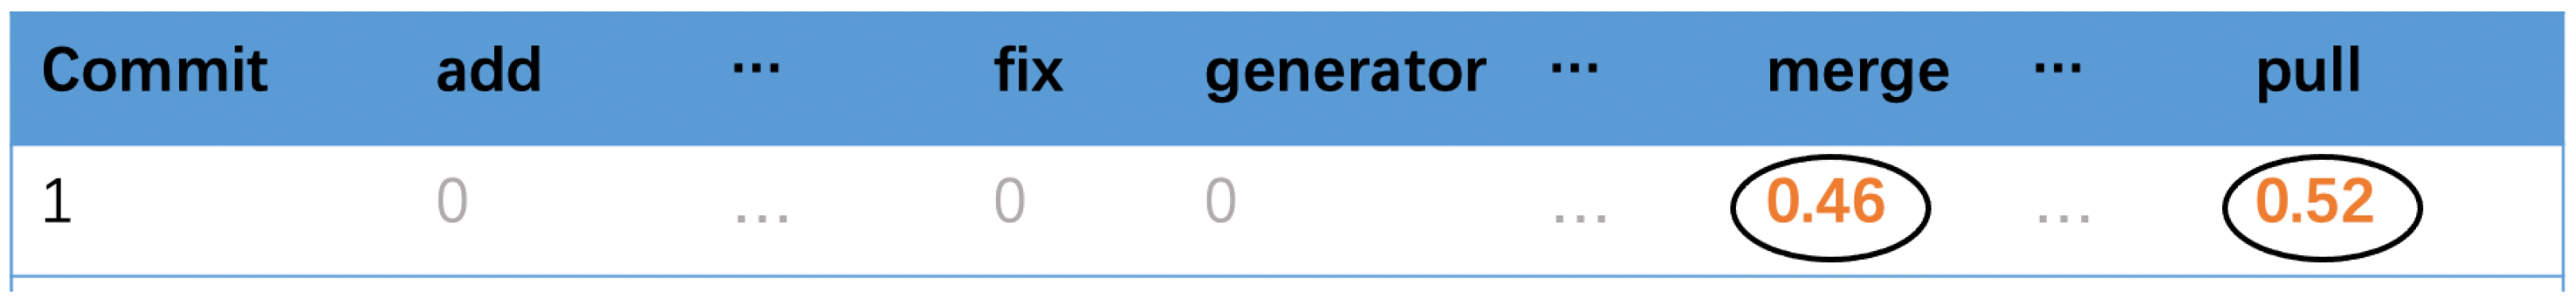
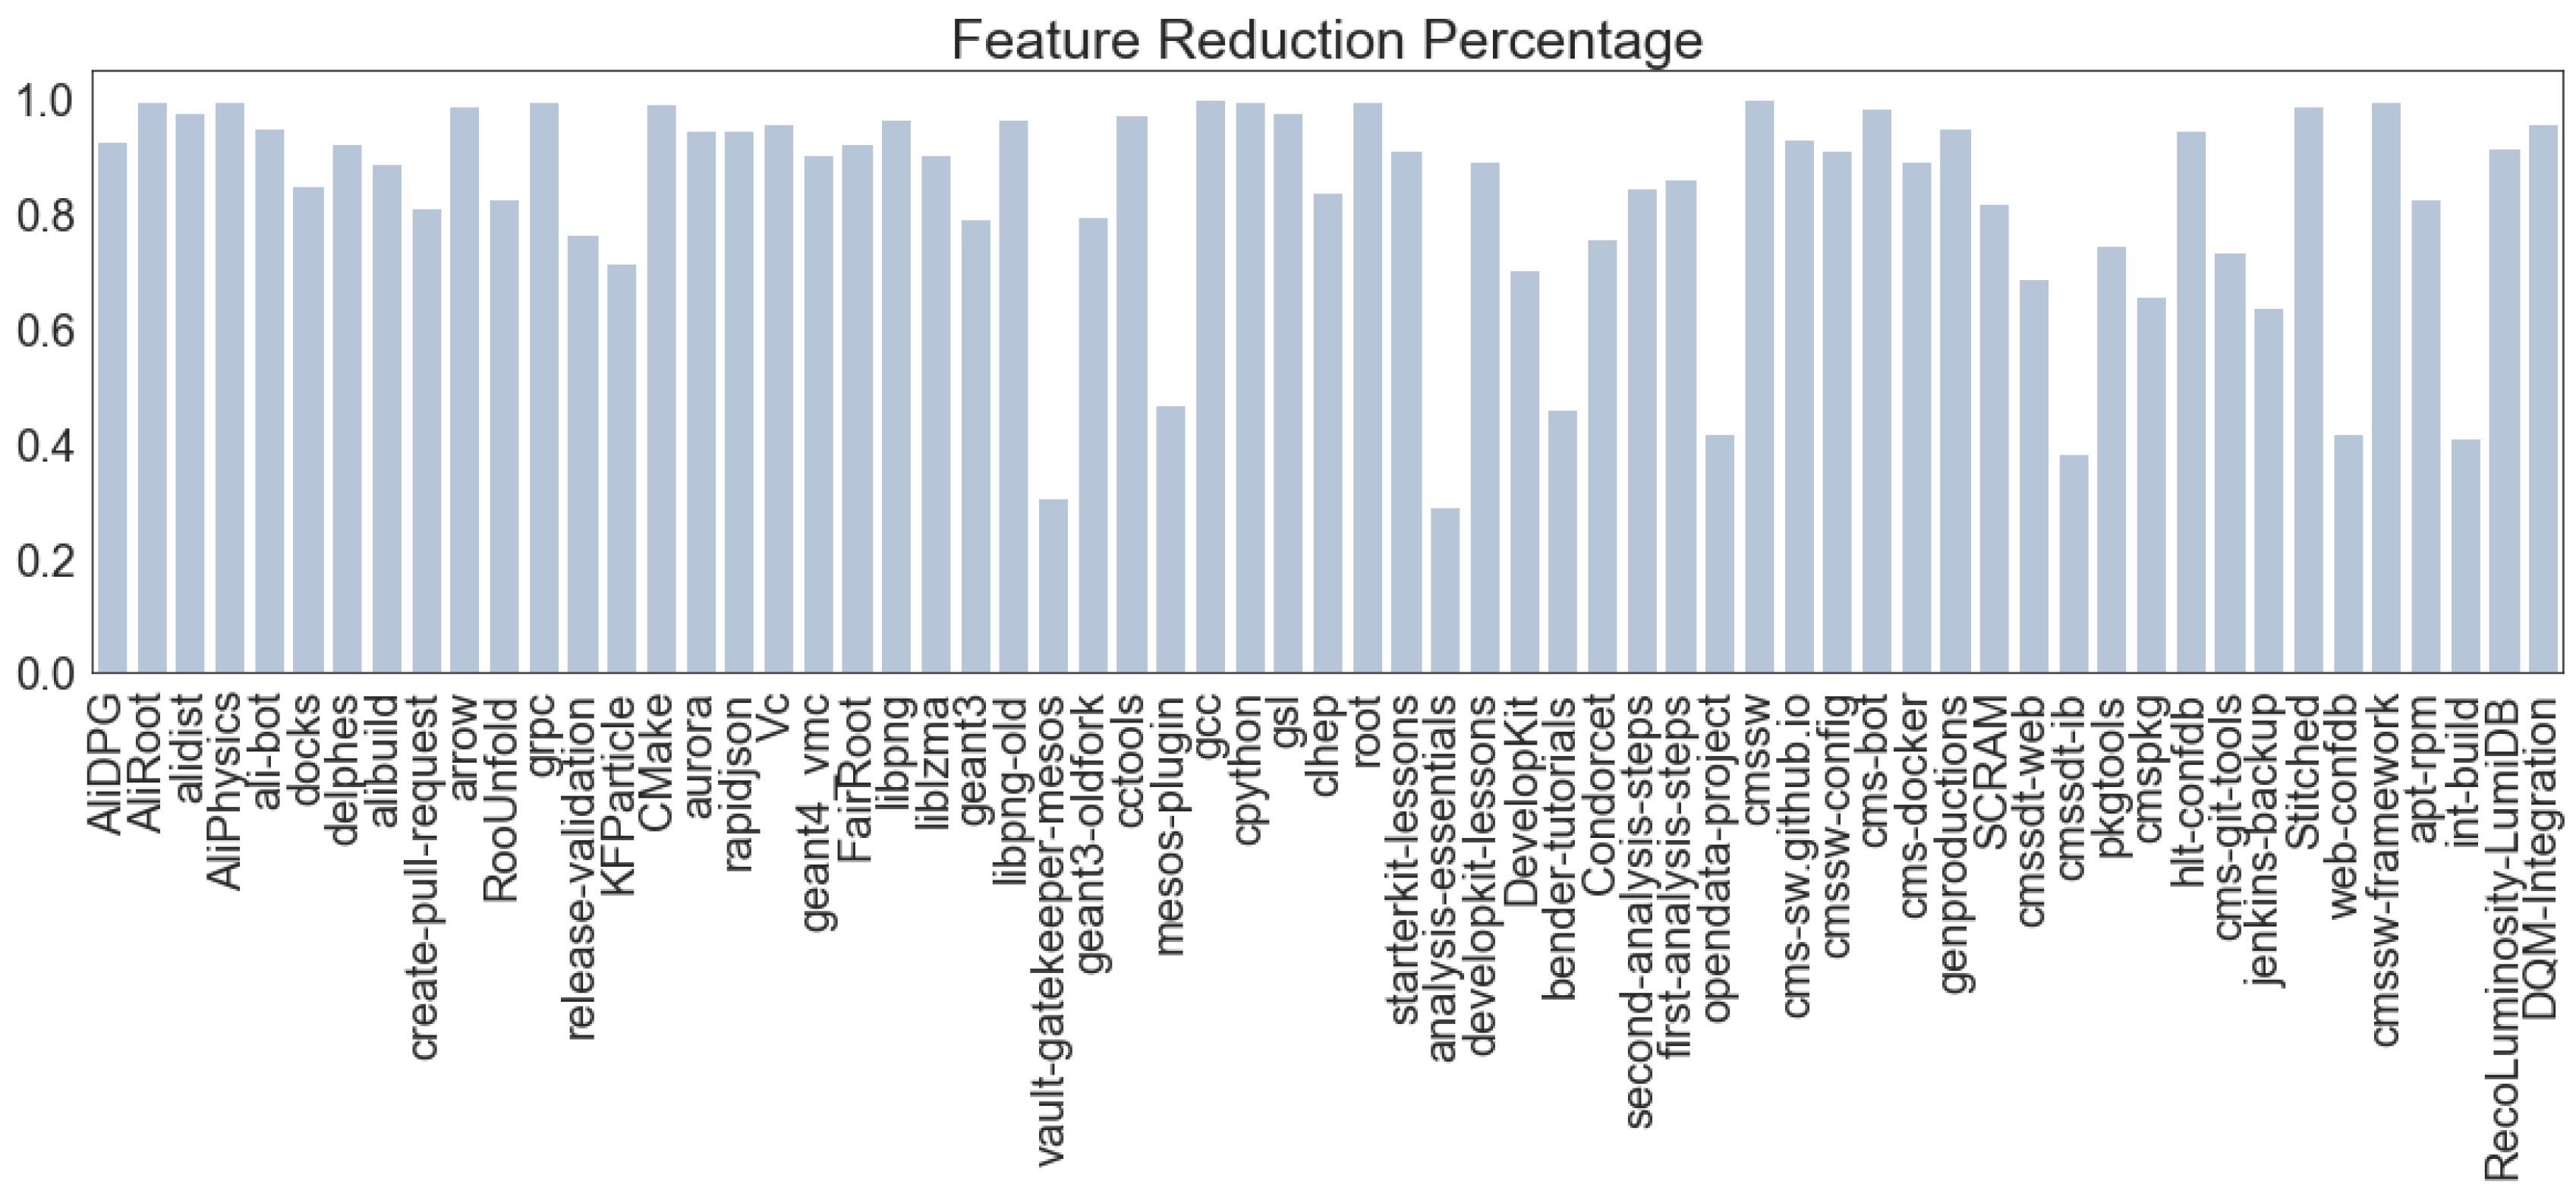
6. Feature Extraction
- (1)
- tf(t, d) is the term frequency (i.e., the number of times) of the term t in a document d;
- (2)
- idf(t) = is the inverse document frequency of the term t across a set of documents D: the number 1 is used when the term t is not in the corpus; is the number of documents where the term t appears and tf(t, d) ≠ 0; D is the set of documents d; N is the number of documents in the corpus .
7. Clustering
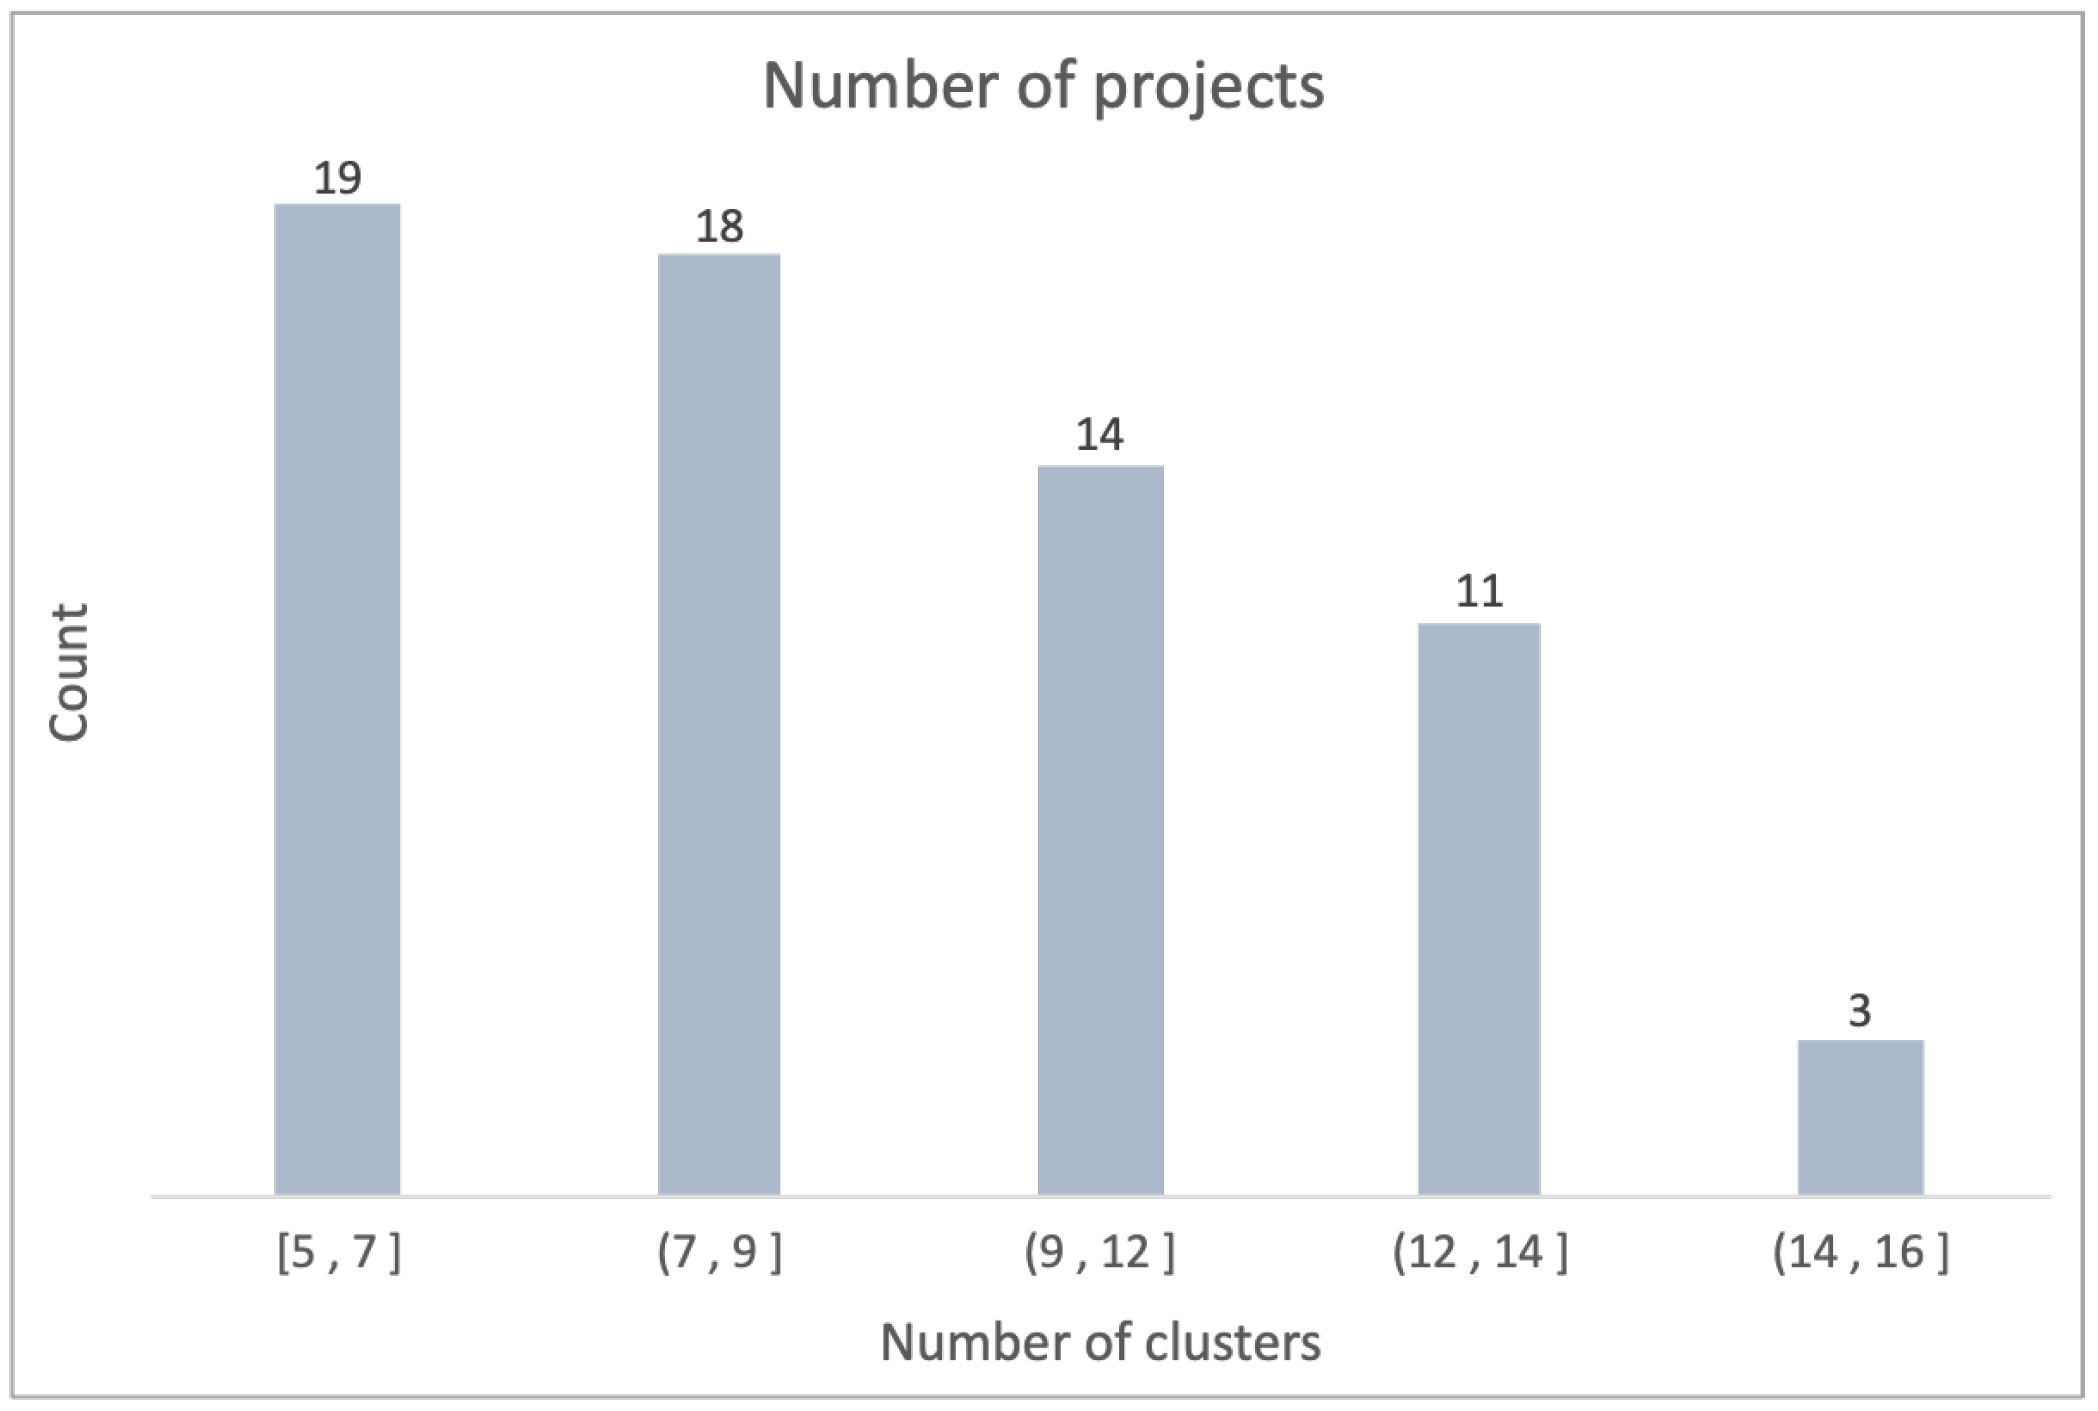
7.1. Number of Clusters
7.2. Clustering Evaluation
8. Classification
9. Results and Validity
10. Conclusions
Author Contributions
Funding
Institutional Review Board Statement
Informed Consent Statement
Data Availability Statement
Conflicts of Interest
References
- Constantinou, E.; Kapitsaki, G.M. Identifying Developers’ Expertise in Social Coding Platforms. In Proceedings of the 2016 42th Euromicro Conference on Software Engineering and Advanced Applications (SEAA), Limassol, Cyprus, 31 August–2 September 2016; pp. 63–67. [Google Scholar] [CrossRef]
- Thung, F.; Bissyandé, T.F.; Lo, D.; Jiang, L. Network Structure of Social Coding in GitHub. In Proceedings of the 2013 17th European Conference on Software Maintenance and Reengineering, Genova, Italy, 5–8 March 2013; pp. 323–326. [Google Scholar] [CrossRef]
- Sarwar, M.U.; Zafar, S.; Mkaouer, M.W.; Walia, G.S.; Malik, M.Z. Multi-label Classification of Commit Messages using Transfer Learning. In Proceedings of the 2020 IEEE International Symposium on Software Reliability Engineering Workshops (ISSREW), Coimbra, Portugal, 12–15 October 2020; pp. 37–42. [Google Scholar] [CrossRef]
- Bavota, G. Mining unstructured data in software repositories: Current & future trends. In Proceedings of the 2016 IEEE 23rd International Conference on Software Analysis, Evolution, and Reengineering, SANER 2016, Osaka, Japan,, 14–18 March 2016; pp. 1–12. [Google Scholar] [CrossRef]
- Jiang, S.; Armaly, A.; McMillan, C. Automatically generating commit messages from diffs using neural machine translation. In Proceedings of the 2017 32nd IEEE/ACM International Conference on Automated Software Engineering (ASE), Urbana, IL, USA, 30 October–3 November 2017; pp. 135–146. [Google Scholar] [CrossRef]
- Jalote, P. An Integrated Approach to Software Engineering; Texts in Computer Science; Springer: Boston, MA, USA, 2005. [Google Scholar] [CrossRef]
- Yalla, P.; Sharma, N. Integrating Natural Language Processing and Software Engineering. Int. J. Softw. Eng. Its Appl. 2015, 9, 127–136. [Google Scholar] [CrossRef]
- Venigalla, A.S.M.; Chimalakonda, S. Understanding Emotions of Developer Community towards Software Documentation. In Proceedings of the IEEE/ACM 43rd International Conference on Software Engineering: Software Engineering in Society (ICSE-SEIS), Madrid, Spain, 25–28 May 2021; pp. 87–91. [Google Scholar] [CrossRef]
- Garousi, V.; Bauer, S.; Felderer, M. NLP-assisted software testing: A systematic mapping of the literature. Inf. Softw. Technol. 2020, 126, 106321. [Google Scholar] [CrossRef]
- Siow, J.; Gao, C.; Fan, L.; Chen, S.; Liu, Y. CORE: Automating Review Recommendation for Code Changes. In Proceedings of the 27th IEEE International Conference on Software Analysis, Evolution and Reengineering (SANER), London, ON, Canada, 18–21 February 2020. [Google Scholar]
- Zhao, L.; Alhoshan, W.; Ferrari, A.; Letsholo, K.J.; Ajagbe, M.A.; Chioasca, E.V.; Batista-Navarro, R.T. Natural Language Processing (NLP) for Requirements Engineering: A Systematic Mapping Study. arXiv 2020, arXiv:2004.01099. [Google Scholar]
- Ye, X.; Bunescu, R.; Liu, C. Mapping Bug Reports to Relevant Files: A Ranking Model, a Fine-Grained Benchmark, and Feature Evaluation. IEEE Trans. Softw. Eng. 2016, 42, 379–402. [Google Scholar] [CrossRef]
- Gilson, F.; Weyns, D. When Natural Language Processing Jumps into Collaborative Software Engineering. In Proceedings of the 2019 IEEE International Conference on Software Architecture Companion (ICSA-C), Hamburg, Germany, 25–26 March 2019; pp. 238–241. [Google Scholar] [CrossRef]
- Catolino, G.; Ferrucci, F. Ensemble techniques for software change prediction: A preliminary investigation. In Proceedings of the 2018 IEEE Workshop on Machine Learning Techniques for Software Quality Evaluation (MaLTeSQuE), Campobasso, Italy, 20 March 2018; pp. 25–30. [Google Scholar] [CrossRef]
- Catolino, G.; Palomba, F.; De Lucia, A.; Ferrucci, F.; Zaidman, A. Enhancing change prediction models using developer-related factors. J. Syst. Softw. 2018, 143, 14–28. [Google Scholar] [CrossRef]
- Zhou, Y.; Leung, H.; Xu, B. Examining the Potentially Confounding Effect of Class Size on the Associations between Object-Oriented Metrics and Change-Proneness. IEEE Trans. Softw. Eng. 2009, 35, 607–623. [Google Scholar] [CrossRef]
- Pritam, N.; Khari, M.; Hoang Son, L.; Kumar, R.; Jha, S.; Priyadarshini, I.; Abdel-Basset, M.; Viet Long, H. Assessment of Code Smell for Predicting Class Change Proneness Using Machine Learning. IEEE Access 2019, 7, 37414–37425. [Google Scholar] [CrossRef]
- Ronchieri, E.; Yang, Y.; Canaparo, M.; Costantini, A.; Duma, D.C.; Salomoni, D. A new code change prediction dataset: A case study based on HEP software. In Proceedings of the IEEE NSS MIC 2020, Boston, MA, USA, 31 October–7 November 2020. [Google Scholar]
- Ronchieri, E.; Canaparo, M.; Yang, Y. Using Natural Language Processing to Extract Information from Unstructured code-change version control data: Lessons learned. In Proceedings of the International Symposium on Grids & Clouds, Taipei, Taiwan, 22–26 March 2021; p. 025. [Google Scholar] [CrossRef]
- Piris, Y.; Gay, A.C. Customer satisfaction and natural language processing. J. Bus. Res. 2021, 124, 264–271. [Google Scholar] [CrossRef]
- Ozturkmenoglu, O.; Alpkocak, A. Comparison of different lemmatization approaches for information retrieval on Turkish text collection. In Proceedings of the 2012 International Symposium on Innovations in Intelligent Systems and Applications, Trabzon, Turkey, 2–4 July 2012; pp. 1–5. [Google Scholar] [CrossRef]
- Patil, L.H.; Atique, M. A Novel Approach for Feature Selection Method TF- IDF in Document Clustering. In Proceedings of the 2013 3rd IEEE International Advance Computing Conference (IACC), Ghaziabad, India, 22–23 February 2012; pp. 858–862. [Google Scholar]
- dos Santos, G.E.; Figueiredo, E. Commit Classification using Natural Language Processing: Experiments over Labeled Datasets. In Proceedings of the CIbSE, Curitiba, Brazil, 9–13 November 2020. [Google Scholar]
- Nyamawe, A.S. Mining commit messages to enhance software refactorings recommendation: A machine learning approach. Mach. Learn. Appl. 2022, 9, 100316. [Google Scholar] [CrossRef]
- Sagar, P.S.; AlOmar, E.A.; Mkaouer, M.W.; Ouni, A.; Newman, C.D. Comparing Commit Messages and Source Code Metrics for the Prediction Refactoring Activities. Algorithms 2021, 14, 289. [Google Scholar] [CrossRef]
- Rebai, S.; Kessentini, M.; Alizadeh, V.; Sghaier, O.B.; Kazman, R. Recommending refactorings via commit message analysis. Inf. Softw. Technol. 2020, 126, 106332. [Google Scholar] [CrossRef]
- Rantala, L.; Mäntylä, M. Predicting technical debt from commit contents: Reproduction and extension with automated feature selection. Softw. Qual. J. 2020, 28, 1–29. [Google Scholar] [CrossRef]
- Jung, T. CommitBERT: Commit Message Generation Using Pre-Trained Programming Language Model. arXiv 2021, arXiv:2105.14242. [Google Scholar]
- Yan, M.; Zhang, X.; Liu, C.; Xu, L.; Yang, M.; Yang, D. Automated change-prone class prediction on unlabeled dataset using unsupervised method. Inf. Softw. Technol. 2017, 92, 1–16. [Google Scholar] [CrossRef]
- Levin, S.; Aviv, T.; Aviv, T. Boosting Automatic Commit Classification Into Maintenance Activities By Utilizing Source Code Changes. arXiv 2017, arXiv:1711.05340. [Google Scholar]
- Messaoud, M.B. On the Classification of Software Change Messages using Multi-label Active Learning. In Proceedings of the 34th ACM/SIGAPP Symposium on Applied Computing, Limassol, Cyprus, 8–12 April 2019. [Google Scholar] [CrossRef]
- Barnett, J.G.; Gathuru, C.K.; Soldano, L.S.; McIntosh, S. The relationship between commit message detail and defect proneness in Java projects on GitHub. In Proceedings of the 13th Working Conference on Mining Software Repositories, MSR 2016, Austin, TX, USA, 14–22 May 2016; pp. 496–499. [Google Scholar] [CrossRef]
- Levin, S.; Yehudai, A. Boosting Automatic Commit Classification Into Maintenance Activities By Utilizing Source Code Changes. In Proceedings of the 13th International Conference on Predictive Models and Data Analytics in Software Engineering, Toronto, ON, Canada, 8 November 2017; Association for Computing Machinery: New York, NY, USA, 2017; pp. 97–106. [Google Scholar] [CrossRef]
- Zhong, S.; Khoshgoftaar, T.M.; Seliya, N. Unsupervised learning for expert-based software quality estimation. In Proceedings of the Eighth IEEE Internation Symposium on High Assurance Systems Engineering, Tampa, FL, USA, 25–26 March 2004. [Google Scholar] [CrossRef]
- Hattori, L.P.; Lanza, M. On the nature of the nature of law. Arch. Rechts Sozialphilosophie 2012, 98, 457–467. [Google Scholar] [CrossRef]
- Yamauchi, K.; Yang, J.; Hotta, K.; Higo, Y.; Kusumoto, S. Clustering commits for understanding the intents of implementation. In Proceedings of the 30th International Conference on Software Maintenance and Evolution, ICSME 2014, Victoria, BC, Canada, 29 September–3 October 2014; pp. 406–410. [Google Scholar] [CrossRef]
- Zhang, Z.; Guo, J.; Zhang, H.; Zhou, L.; Wang, M. Product selection based on sentiment analysis of online reviews: An intuitionistic fuzzy TODIM method. Complex Intell. Syst. 2022, 8, 3349–3362. [Google Scholar] [CrossRef]
- Zhou, L.; Tang, L.; Zhang, Z. Extracting and ranking product features in consumer reviews based on evidence theory. J. Ambient. Intell. Humaniz. Comput. 2022, 1868–5145. [Google Scholar] [CrossRef]
- Zhou, L.; Zhang, Z.; Zhao, L.; Yang, P. Attention-based BiLSTM models for personality recognition from user-generated content. Inf. Sci. 2022, 596, 460–471. [Google Scholar] [CrossRef]
- Zhang, H.; Zhang, Z. Characteristic Analysis of Judgment Debtors Based on Hesitant Fuzzy Linguistic Clustering Method. IEEE Access 2021, 9, 119147–119157. [Google Scholar] [CrossRef]
- Jiang, Z.; Gao, B.; He, Y.; Han, Y.; Doyle, P.; Zhu, Q. Text Classification Using Novel Term Weighting Scheme-Based Improved TF-IDF for Internet Media Reports. Math. Probl. Eng. 2021, 2021, 1–30. [Google Scholar] [CrossRef]
- Ali, A.; Bin Faheem, Z.; Waseem, M.; Draz, U.; Safdar, Z.; Hussain, S.; Yaseen, S. Systematic Review: A State of Art ML Based Clustering Algorithms for Data Mining. In Proceedings of the 2020 IEEE 23rd International Multitopic Conference (INMIC), Bahawalpur, Pakistan, 5–7 November 2020; pp. 1–6. [Google Scholar] [CrossRef]
- Kapil, S.; Chawla, M.; Ansari, M.D. On K-means data clustering algorithm with genetic algorithm. In Proceedings of the 2016 Fourth International Conference on Parallel, Distributed and Grid Computing (PDGC), Waknaghat, India, 22–24 December 2016; pp. 202–206. [Google Scholar] [CrossRef]
- Alsarhan, Q.; Ahmed, B.S.; Bures, M.; Zamli, K.Z. Software Module Clustering: An In-Depth Literature Analysis. IEEE Trans. Softw. Eng. 2020, 48, 1905–1928. [Google Scholar] [CrossRef]
- Nainggolan, R.; Perangin-Angin, R.; Simarmata, E.; Tarigan, A.F. Improved the Performance of the K-Means Cluster Using the Sum of Squared Error (SSE) optimized by using the Elbow Method. J. Phys. Conf. Ser. 2019, 1361. [Google Scholar] [CrossRef]
- Yuan, C.; Yang, H. Research on K-Value Selection Method of K-Means Clustering Algorithm. J 2019, 2, 226–235. [Google Scholar] [CrossRef]
- Kaoungku, N.; Suksut, K.; Chanklan, R.; Kerdprasop, K.; Kerdprasop, N. The silhouette width criterion for clustering and association mining to select image features. Int. J. Mach. Learn. Comput. 2018, 8, 69–73. [Google Scholar] [CrossRef]
- Berkhin, P. A Survey of Clustering Data Mining Techniques. In Grouping Multidimensional Data: Recent Advances in Clustering; Kogan, J., Nicholas, C., Teboulle, M., Eds.; Springer: Berlin/Heidelberg, Germany; New York, NY, USA, 2006; pp. 25–71. [Google Scholar] [CrossRef]
- Daniel Jurafsky, J.H.M. Speech and Language Processing: An Introduction to Natural Language Processing, Computational Linguistics, and Speech Recognition; PEARSON: London, UK, 2008; pp. 1–306. [Google Scholar] [CrossRef]
- Dönmez, P. Introduction to Machine Learning. Nat. Lang. Eng. 2013, 19, 285–288. [Google Scholar] [CrossRef]
- Sutton, C.D. Classification and Regression Trees, Bagging, and Boosting. In Data Mining and Data Visualization; Rao, C., Wegman, E., Solka, J., Eds.; Elsevier: Amsterdam, The Netherlands, 2005; Volume 24, pp. 303–329. [Google Scholar] [CrossRef]
- Browne, M.W. Cross-Validation Methods. J. Math. Psychol. 2000, 44, 108–132. [Google Scholar] [CrossRef]
- Oh, S.L.; Jahmunah, V.; Ooi, C.P.; Tan, R.S.; Ciaccio, E.J.; Yamakawa, T.; Tanabe, M.; Kobayashi, M.; Rajendra Acharya, U. Classification of heart sound signals using a novel deep WaveNet model. Comput. Methods Programs Biomed. 2020, 196, 105604. [Google Scholar] [CrossRef]
- ALISW. 2022. Available online: https://github.com/alisw (accessed on 15 September 2022).
- LHCB. 2022. Available online: https://github.com/lhcb (accessed on 15 September 2022).
- CMS-SW. 2022. Available online: https://github.com/cms-sw (accessed on 15 September 2022).
- ROOT. 2022. Available online: https://github.com/root-project/root (accessed on 15 September 2022).
- Swanson, E.B. The dimensions of maintenance. In Proceedings of the 2nd International Conference on Software Engineering, San Francisco, CA, USA, 13–15 October 1976; pp. 492–497. [Google Scholar]
- Hindle, A.; German, D.M.; Holt, R. What Do Large Commits Tell Us? A Taxonomical Study of Large Commits. In Proceedings of the 2008 International Working Conference on Mining Software Repositories, MSR ’08, Leipzig, Germany, 10–11 May 2018; Association for Computing Machinery: New York, NY, USA, 2008; pp. 99–108. [Google Scholar] [CrossRef]
- Islam, K.; Ahmed, T.; Shahriyar, R.; Iqbal, A.; Uddin, G. Early prediction for merged vs abandoned code changes in modern code reviews. Inf. Softw. Technol. 2022, 142, 106756. [Google Scholar] [CrossRef]
- Golzadeh, M.; Decan, A.; Legay, D.; Mens, T. A ground-truth dataset and classification model for detecting bots in GitHub issue and PR comments. J. Syst. Softw. 2021, 175, 110911. [Google Scholar] [CrossRef]
- Khatiwada, S.; Kelly, M.; Mahmoud, A. STAC: A tool for Static Textual Analysis of Code. In Proceedings of the 2016 IEEE 24th International Conference on Program Comprehension (ICPC), Austin, TX, USA, 16–17 May 2016; pp. 1–3. [Google Scholar] [CrossRef]
- Lan, M.; Tan, C.L.; Su, J.; Lu, Y. Supervised and Traditional Term Weighting Methods for Automatic Text Categorization. IEEE Trans. Pattern Anal. Mach. Intell. 2009, 31, 721–735. [Google Scholar] [CrossRef]


| Experiment Name | Project Names | ||
|---|---|---|---|
| ROOT | root | ||
| Condorcet | DevelopKit | analysis-essentials | |
| LHCb | bender-tutorials | developkit-lessons | first-analysis-steps |
| opendata-project | second-analysis-steps | starterkit-lessons | |
| cmssw | cms-sw.github.io | cmssw-config | |
| cms-bot | cms-docker | genproductions | |
| SCRAM | root | cmssdt-web | |
| CMS-SW | cmssdt-ib | pkgtools | hlt-confdb |
| cms-git-tools | jenkins-backup | Stitched | |
| web-confdb | cmssw-framework | apt-rpm | |
| apt-rpm | int-build | RecoLuminosity-LumiDB | |
| DQM-Integration | cmspkg | ||
| AliDPG | AliPhysics | AliRoot | |
| CMake | FairRoot | KFParticle | |
| RootUnfold | Vc | ali-bot | |
| alibuild | alidist | arrow | |
| aurora | cctools | clhep | |
| ALISW | cpython | create-pull-request | delphes |
| docks | gcc | geant3 | |
| geant3-oldfork | geant4_vmc | grpc | |
| gsl | liblzma | libpng | |
| libpng-old | mesos-plugin | rapidjson | |
| release-validation | root | vault-gatekeeper-mesos |
| Commit ID | Author | Date | Commit Message | N. Files Changed | N. Lines Inserted | N. Lines Deleted |
|---|---|---|---|---|---|---|
| 1 | XXX | 2 March 2021 | Whitelist-O2-GSI-specific-test-builds-785 | 1 | 1 | 0 |
| 2 | AAA | 3 March 2021 | publisher-more-build-requires-784 | 1 | 2 | 0 |
| 3 | MMM | 4 March 2021 | publisher-more-build-time-packages- to-be-installed-on-CVMFS-782 | 1 | 2 | 0 |
| Category | Values | ||
|---|---|---|---|
| Development | Improvement | Performance | |
| Optimization | Cancellation | Documentation [31] | |
| Installation | Deployment | Debugging [31] | |
| Build [31] | Upgrade | Versioning [31] | |
| Type of changes | Refactoring [31] | Testing [31] | Feature Addition |
| Update | Configuration | Dependency | |
| Indentation [31] | Initialization [31] | Platform [31] | |
| Corrective [31] | Branch [31] | Legal [31] | |
| Merge [31] | Revert | New Functionality | |
| Bug [31,60] | Issue | Solve | |
| Patch [59,60] | Abort [59,60] | Error [59,60] | |
| Bad [59,60] | Conflict [59,60] | Problem [59,60] | |
| Type of corrections | Wrong [59,60] | Mistake | Avoid [59,60] |
| Warning [59,60] | Fix | Anomaly | |
| Failure Exception | Crash | Incident | |
| Side Effect | Fail | Defect | |
| Glitch |
| Commit | Commit Message | Type of Change | Type of Correction |
|---|---|---|---|
| 1 | “Whitelist-O2-GSI-specific-test-builds-785” | test-build | other |
| 2 | “report-pr-errors-fix-bad-formatting” | improvement-corrective | error-fix |
| 3 | “publisher-more-build-time-packages -to-be-installed-on-CVMFS-782” | build-install | other |
| Cluster Label | Number of Commits | Percentage of Commits |
|---|---|---|
| 0 | 474 | 36.05 |
| 1 | 201 | 15.29 |
| 2 | 82 | 6.24 |
| 3 | 112 | 8.52 |
| 4 | 146 | 11.10 |
| 5 | 98 | 7.45 |
| 6 | 158 | 12.02 |
| 7 | 44 | 3.35 |
| Type of Change | Type of Correction | Number of Commits | Percentage of Commits |
|---|---|---|---|
| other | other | 307 | 23.35 |
| merge | other | 196 | 14.90 |
| feature addition | other | 186 | 14.14 |
| corrective | fix | 90 | 6.84 |
| configuration | other | 63 | 4.79 |
| update | other | 61 | 4.64 |
| branch-merge | other | 45 | 3.42 |
| cancellation | other | 37 | 2.81 |
| corrective | bug-fix | 24 | 1.83 |
| configuration - feature addition | other | 21 | 1.60 |
| internal or ThirdParty dependency | other | 17 | 1.29 |
| corrective | fault | 14 | 1.06 |
| versioning | other | 14 | 1.06 |
| Cluster Number | Type of Change | Type of Correction | Number of Commits |
|---|---|---|---|
| Cluster 0 | other | other | 227 |
| configuration | other | 52 | |
| cancellation | other | 31 | |
| feature addition | other | 22 | |
| Internal or Third Party dependency | other | 14 | |
| corrective | fault | 13 | |
| corrective | bug-fix | 10 | |
| Cluster 1 | merge | other | 186 |
| corrective-merge | patch | 5 | |
| corrective-merge | fix | 3 | |
| Cluster 2 | update | other | 56 |
| configuration-update | other | 10 | |
| cancellation-corrective-feature addition-update | fault | 2 | |
| cancellation-update | other | 2 | |
| configuration-corrective-update | fault | 2 | |
| merge-update | other | 2 | |
| update-versioning | other | 2 | |
| Cluster 3 | other | other | 40 |
| feature addition | other | 16 | |
| corrective | fix | 9 | |
| cancellation | other | 5 | |
| Cluster 4 | other | other | 40 |
| feature addition | other | 16 | |
| corrective | fix | 9 | |
| cancellation | other | 5 | |
| versioning | other | 4 | |
| update | other | 4 | |
| configuration | other | 4 | |
| Cluster 5 | feature addition | other | 36 |
| other | other | 35 | |
| configuration | other | 7 | |
| corrective | fix | 4 | |
| Cluster 6 | feature addition | other | 111 |
| configuration-feature addition | other | 19 | |
| feature addition-revert | other | 5 | |
| feature addition-merge | other | 4 | |
| cancellation-feature addition | other | 3 | |
| Cluster 7 | branch-merge | other | 44 |
| ML Techniques | Accuracy | Recall | Precision | F1-Score |
|---|---|---|---|---|
| AdaBoost (AB) | 0.6377 | 0.4846 | 0.4359 | 0.4482 |
| Bagging (BG) | 0.9519 | 0.9280 | 0.9337 | 0.9247 |
| Decision Tree (DT) | 0.9517 | 0.9295 | 0.9345 | 0.9262 |
| Logistic Regression (LR) | 0.9027 | 0.8268 | 0.8810 | 0.8401 |
| Multinomial Naive Bayes (MNB) | 0.8454 | 0.7487 | 0.8252 | 0.7695 |
| Naive Bayes (NB) | 0.4979 | 0.6066 | 0.5252 | 0.4964 |
| Random Forest (RF) | 0.9590 | 0.9382 | 0.9448 | 0.9360 |
| Metric Score | ML Techniques | Mean | Std | CV |
|---|---|---|---|---|
| AB | 0.6377 | 0.1712 | 26.85 | |
| BG | 0.9519 | 0.0506 | 5.32 | |
| DT | 0.9517 | 0.0497 | 5.22 | |
| Accuracy | LR | 0.9027 | 0.0959 | 10.63 |
| MNB | 0.8454 | 0.1103 | 13.05 | |
| NB | 0.4979 | 0.1827 | 36.70 | |
| RF | 0.9590 | 0.0461 | 4.81 | |
| AB | 0.4846 | 0.2151 | 44.40 | |
| BG | 0.9280 | 0.0760 | 8.19 | |
| DT | 0.9295 | 0.0699 | 7.52 | |
| Recall | LR | 0.8268 | 0.1565 | 18.92 |
| MNB | 0.7487 | 0.1908 | 25.49 | |
| NB | 0.6066 | 0.1527 | 25.18 | |
| RF | 0.9382 | 0.0691 | 7.37 | |
| AB | 0.436 | 0.232 | 53.27 | |
| BG | 0.934 | 0.973 | 7.85 | |
| DT | 0.935 | 0.068 | 7.27 | |
| Precision | LR | 0.881 | 0.149 | 16.86 |
| MNB | 0.825 | 0.204 | 24.74 | |
| NB | 0.525 | 0.146 | 27.89 | |
| RF | 0.945 | 0.063 | 6.63 | |
| AB | 0.4482 | 0.2265 | 50.54 | |
| BG | 0.9247 | 0.0792 | 8.56 | |
| DT | 0.9262 | 0.0736 | 7.94 | |
| F1-score | LR | 0.8401 | 0.1584 | 18.85 |
| MNB | 0.7695 | 0.2027 | 26.34 | |
| NB | 0.4964 | 0.1687 | 33.97 | |
| RF | 0.9360 | 0.0706 | 7.54 |
Publisher’s Note: MDPI stays neutral with regard to jurisdictional claims in published maps and institutional affiliations. |
© 2022 by the authors. Licensee MDPI, Basel, Switzerland. This article is an open access article distributed under the terms and conditions of the Creative Commons Attribution (CC BY) license (https://creativecommons.org/licenses/by/4.0/).
Share and Cite
Yang, Y.; Ronchieri, E.; Canaparo, M. Natural Language Processing Application on Commit Messages: A Case Study on HEP Software. Appl. Sci. 2022, 12, 10773. https://doi.org/10.3390/app122110773
Yang Y, Ronchieri E, Canaparo M. Natural Language Processing Application on Commit Messages: A Case Study on HEP Software. Applied Sciences. 2022; 12(21):10773. https://doi.org/10.3390/app122110773
Chicago/Turabian StyleYang, Yue, Elisabetta Ronchieri, and Marco Canaparo. 2022. "Natural Language Processing Application on Commit Messages: A Case Study on HEP Software" Applied Sciences 12, no. 21: 10773. https://doi.org/10.3390/app122110773
APA StyleYang, Y., Ronchieri, E., & Canaparo, M. (2022). Natural Language Processing Application on Commit Messages: A Case Study on HEP Software. Applied Sciences, 12(21), 10773. https://doi.org/10.3390/app122110773