Article

Position Detection of Doors and Windows Based on DSPP-YOLO

1
Unmanned System Research Institute, Northwestern Polytechnical University, Xi’an 710072, China
2
School of Astronautics, Northwestern Polytechnical University, Xi’an 710072, China
3
Tianjin Jinhang Institute of Technical Physics, Tianjin 300308, China
*
Author to whom correspondence should be addressed.
Appl. Sci. 2022, 12(21), 10770; https://doi.org/10.3390/app122110770
Submission received: 26 August 2022 / Revised: 12 October 2022 / Accepted: 21 October 2022 / Published: 24 October 2022

Abstract

:
Autonomous exploration of autonomous mobile robots in unknown environments is a hot topic at present. Object detection is an important research direction in improving the autonomous capability of autonomous mobile robots in unknown environments. In object detection, doors and windows have many similar features and are difficult to distinguish. Therefore, improving the detection accuracy of doors and windows is helpful to improve the autonomous ability of autonomous mobile robots. Aiming at the problem of insufficient doors and windows detection accuracy caused by the large difference between the receptive fields of doors and windows, this paper proposes DSPP-YOLO (DenseNet SPP) algorithm. Firstly, on the basis of deepening the network addition, to prevent the loss of shallow location feature information, some residual blocks in YOLOV3 are improved to dense blocks by using the idea of DenseNet. Secondly, the spatial pyramid pooling (SPP) structure is fused into the YOLOV3 feature extraction network to realize multiscale receptive field fusion. Finally, K-means ++ algorithm is used to re-cluster the size of candidate boxes to reduce the error caused by candidate boxes. DSPP-YOLO realizes the position detection of doors and windows by an autonomous robot in an unknown, complex environment. This method is tested. Under the condition of the same data set, the detection accuracy of the DSPP-YOLO algorithm is 77.4% for doors and 38.1% for windows. Compared with YOLOV3 algorithm, the calculation consumption time of the DSPP-YOLO algorithm does not increase, and the detection accuracy of doors is improved by 3.3%, the detection accuracy of windows is improved by 8.8%, and the average accuracy of various types is improved by 6.05%.

1. Introduction

When autonomous mobile robots perform tasks in unknown and complex environments, the following accidents may occur: navigation system failure due to collision, or the inability to accept a GPS signal leading to a loss of communication, which requires it to have greater autonomy to deal with this situation [1]. In order to improve the autonomous performance of autonomous mobile robots, many research teams have developed various advanced technologies. SLAM was first proposed in the 1980s. SLAM technology is now being used in many scenarios, including simultaneous localization [2,3] and mapping [4]. There is also a VIO algorithm, VINS-Mono, which is an open source by the Hong Kong University of Science and Technology [5]. Both of them can make autonomous mobile robots realize an autonomous exploration function.
Object detection is also very important for autonomous exploration of autonomous mobile robots. With the development of machine learning technology, object detection and recognition based on deep learning [6,7] has become the mainstream method. Target detection methods based on deep learning are mainly divided into two types: two-stage detection and one-stage detection. After entering the deep era, people use candidate boxes as target detection methods based on prior knowledge, such as Selective Search [8] and CPMC [9]. In the subsequent development, people generated candidate regions by the network itself, and gave them a new name anchor box, which formed a new direction for object detection task development. However, for some objects with many common features, such as doors and windows, the target detection results are still not ideal. Therefore, this paper proposes DSPP-YOLO algorithm based on YOLOV3 algorithm improvement.
The object detection algorithm based on the convolutional neural network (CNN) can detect the location of doors and windows in unknown complex environments, and meet the requirements of fast detection speed, strong generalization ability and high accuracy of autonomous mobile robots in unknown complex environments. In 2014, Girshick et al. proposed R-CNN algorithm [10], which combines CNN with a selective search algorithm and uses Support Vector Machine [11] (SVM) for feature classification and region regression. In 2015, Girshick et al. optimized the structure of R-CNN based on SPP-Net [12], and improved the Fast R-CNN algorithm [13]. Ren et al. further generated the Faster R-CNN algorithm based on the Fast R-CNN algorithm, which realized the end-to-end training through Region Proposal Network [14] (RPN). In order to improve the detection performance of small targets, T. kong et al. proposed HyperNet [15], which integrates the information of shallow, middle and deep layers. Dai et al. proposed region-based Fully Convolutional Network [16] (RFCN) on the basis of Fully Convolutional Networks (FCN). Despite the high detection accuracy of the two-stage algorithm, it is difficult to improve the detection rate effectively due to the large amount of computation in selecting candidate boxes. The one-stage algorithm realizes feature extraction, classification, and regression in one CNN, treats the whole image as a complete candidate region as input data, and then regresses the position and category information of the target in the graph. In 2016, W. Liu et al. put forward the SSD algorithm [17], which improves the detection accuracy of single-stage detector by multireference and multiresolution detection technology. The YOLO algorithm proposed by Redmon et al. makes YOLO detection network have the functions of classification, localization, and detection simultaneously by dividing the image into multigrid mosaics [18]. In 2017, Cheng et al. proposed the DSSD algorithm to replace the VGG16 backbone network with ResNet101 to optimize the SDD algorithm. The YOLO algorithm was optimized to generate the YOLOV2 algorithm [19], and the anchor box mechanism of the fast R-CNN algorithm was used to make the network have fine granularity. In 2018, a new algorithm called YOLOV3 was proposed in the backbone network-Darknet53 [20], which abandoned the idea of full connection layer and fused residual error.
However, the YOLOV3 algorithm still has the following three problems when the autonomous mobile robot detects the position of doors and windows: (1) Since windows with different backgrounds have different features, the features learned by CNN will change with the background, and it is difficult to find general features. (2) Certain types of windows and doors have common features that will confuse the network when learning labels. (3) The size and area of different windows vary greatly, even some remote windows have the feature of small targets. Therefore, in this paper, we propose the DSSP-YOLO framework based on YOLOV3 that can help to address these three challenges in the position detection of doors and windows. Our contribution can be summarized as below:
(1)
We propose the DSPP-YOLO algorithm to detect doors and windows in an unknown environment and optimize the SLAM algorithm to realize the classification of an unknown environment.
(2)
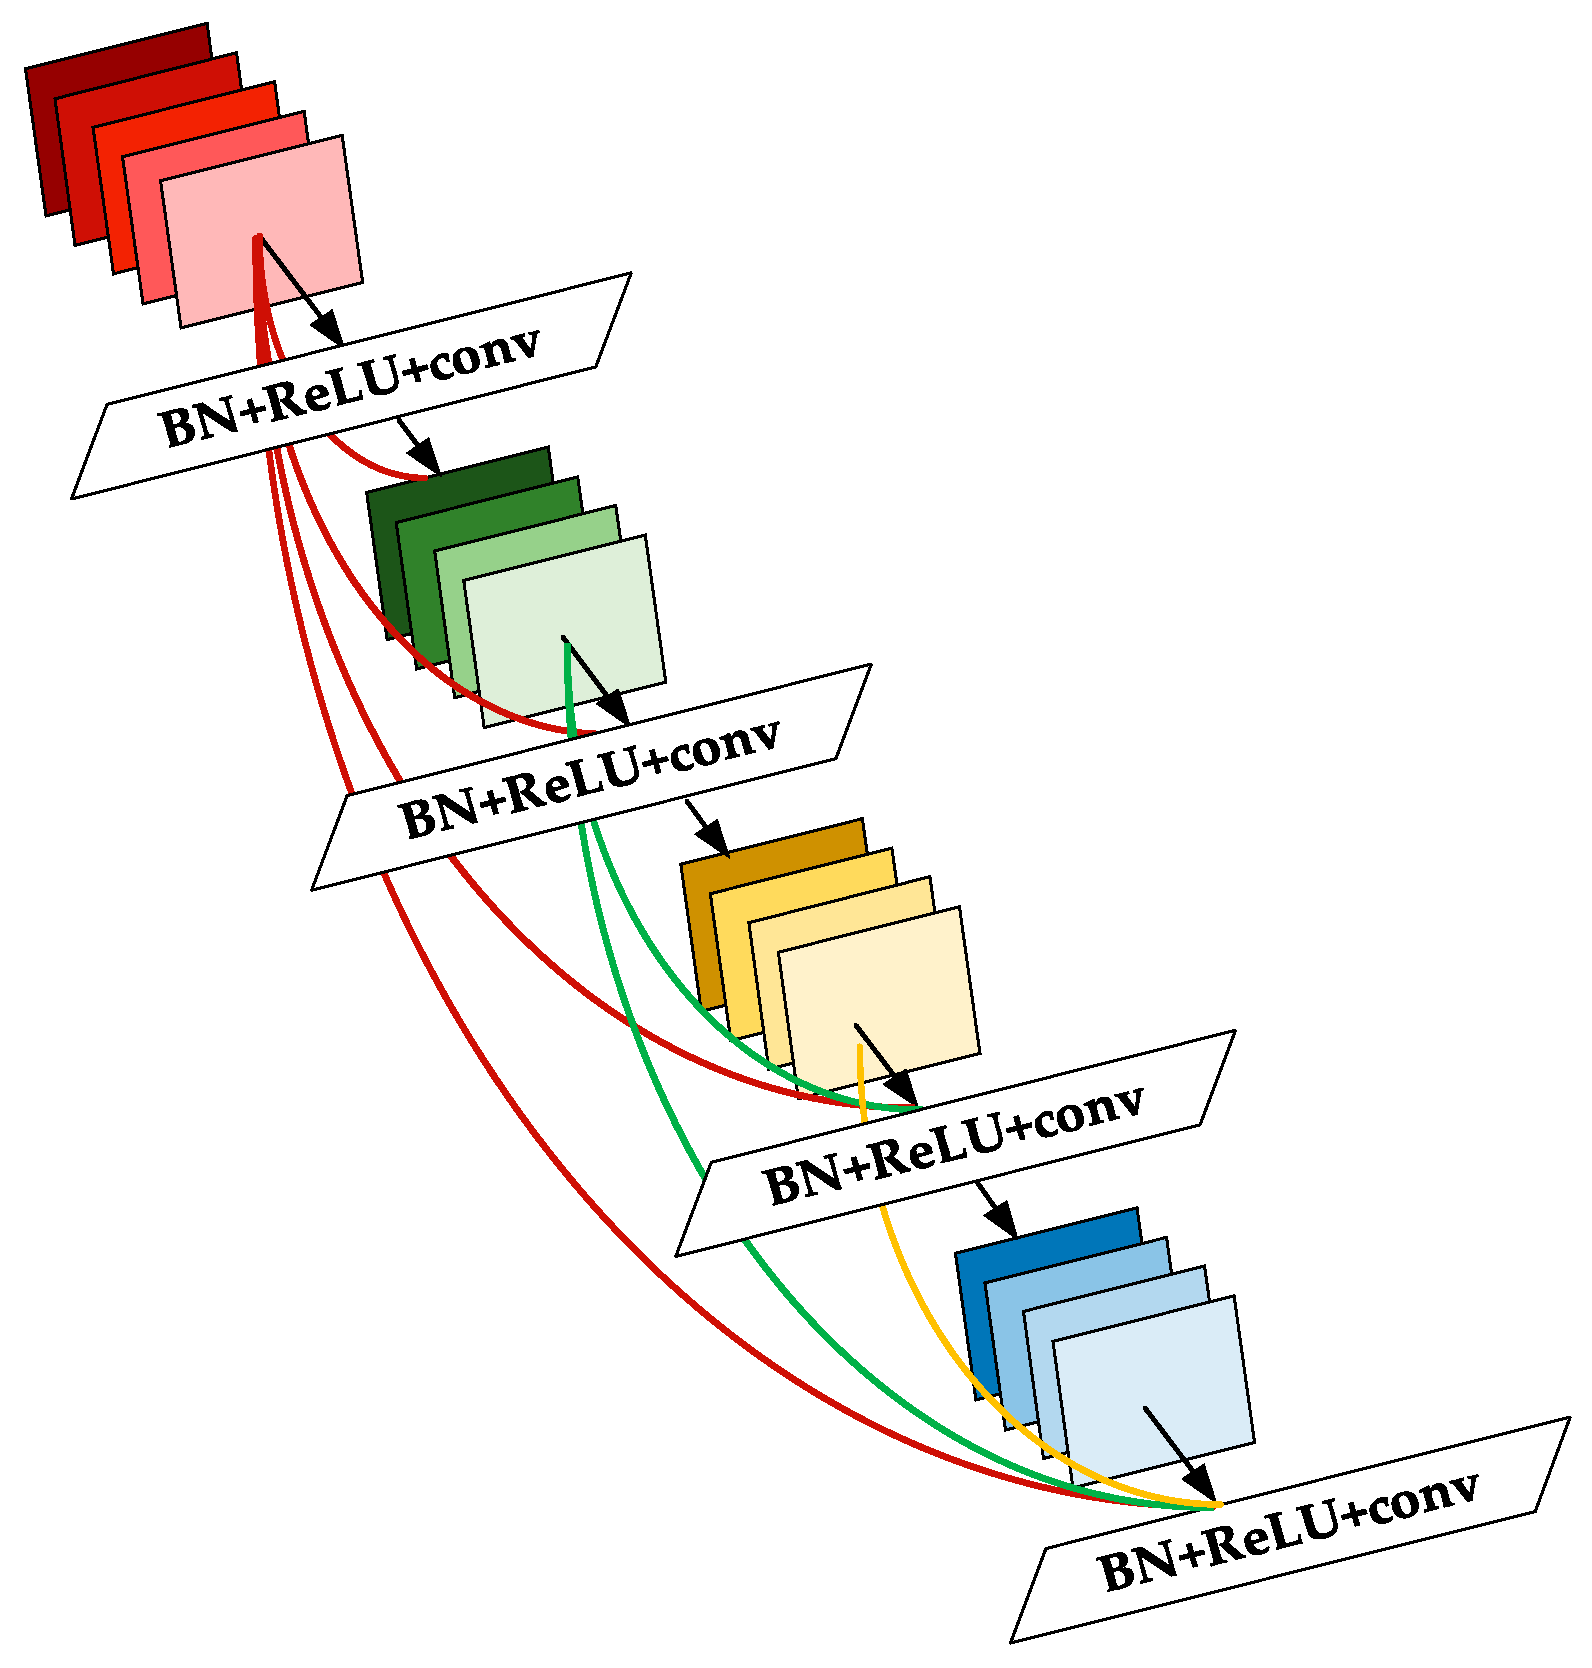
We add down the sampled layer to deepen the Darknet53 network structure to enhance the learning of target semantic features and integrate the YOLOV3 network framework with the idea of DenseNet and spatial pooling pyramids to achieve optimization.
(3)
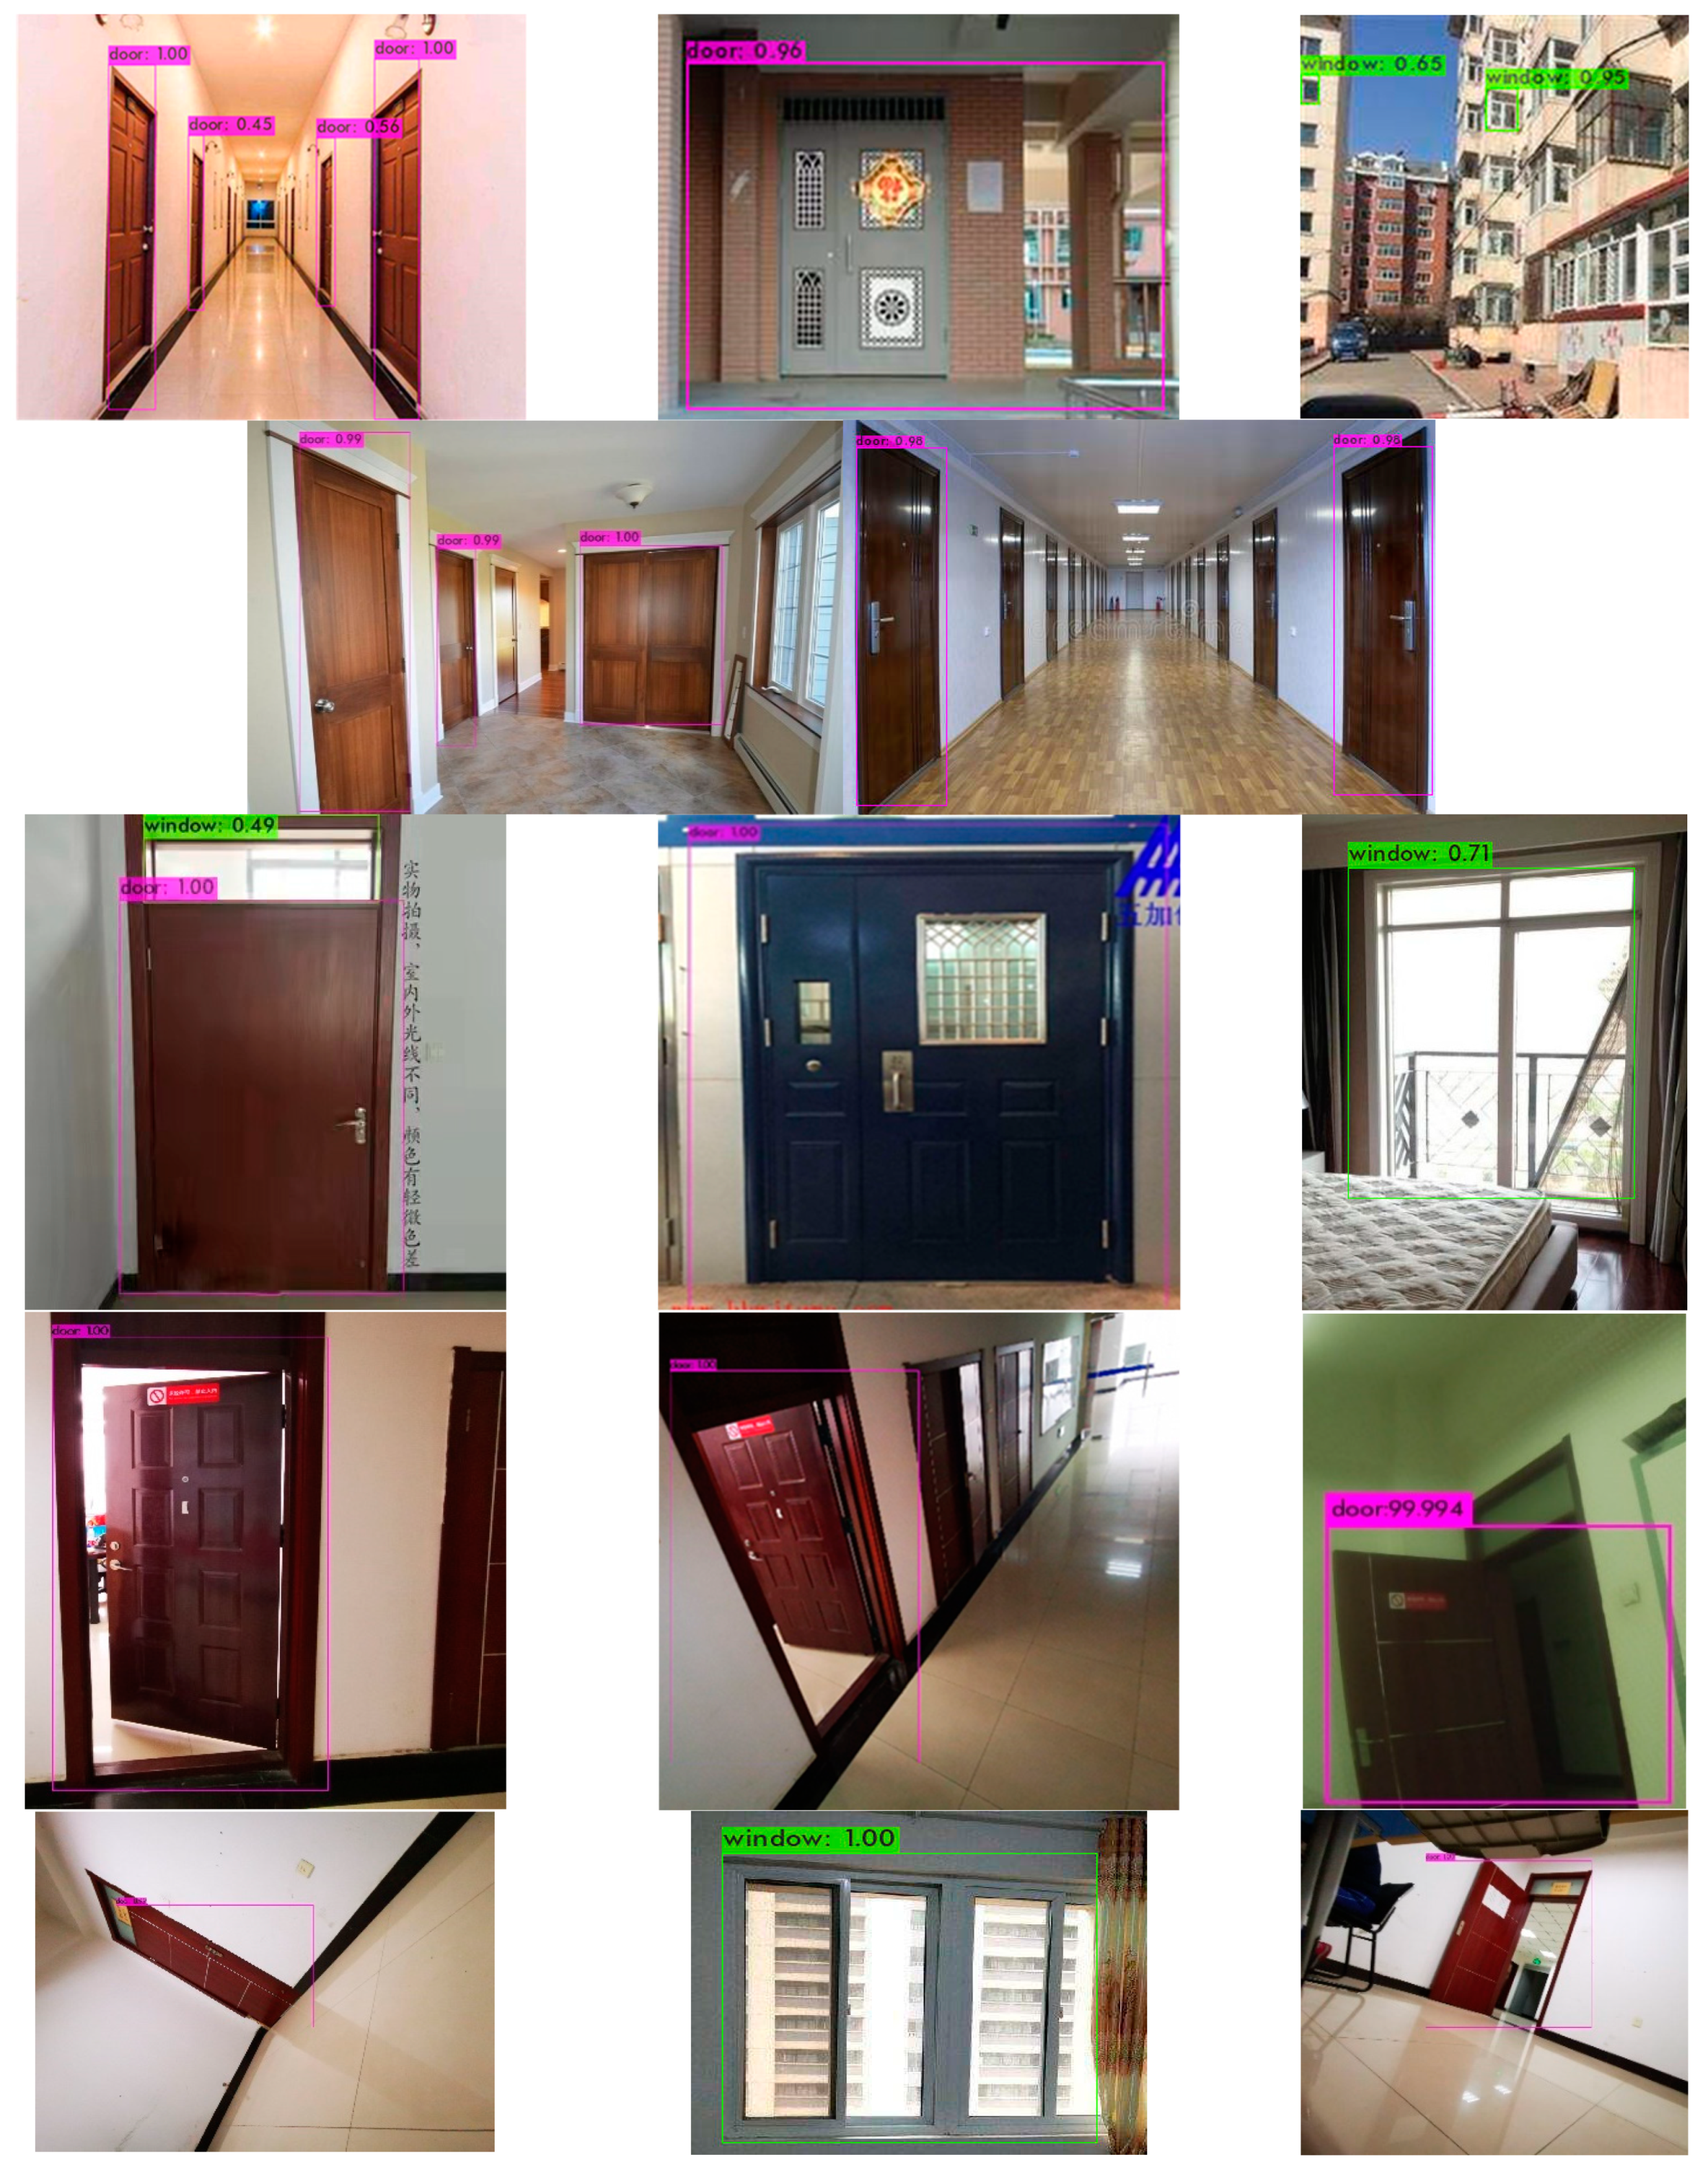
We use K-means++ clustering method to generate anchor boxes to improve the training accuracy. After training, according to the experimental results of the improved network, we can know that the detection accuracy of doors is improved by 3.3%, the detection accuracy of windows is improved by 8.8%, and the average accuracy of various types is improved by 6.05%.

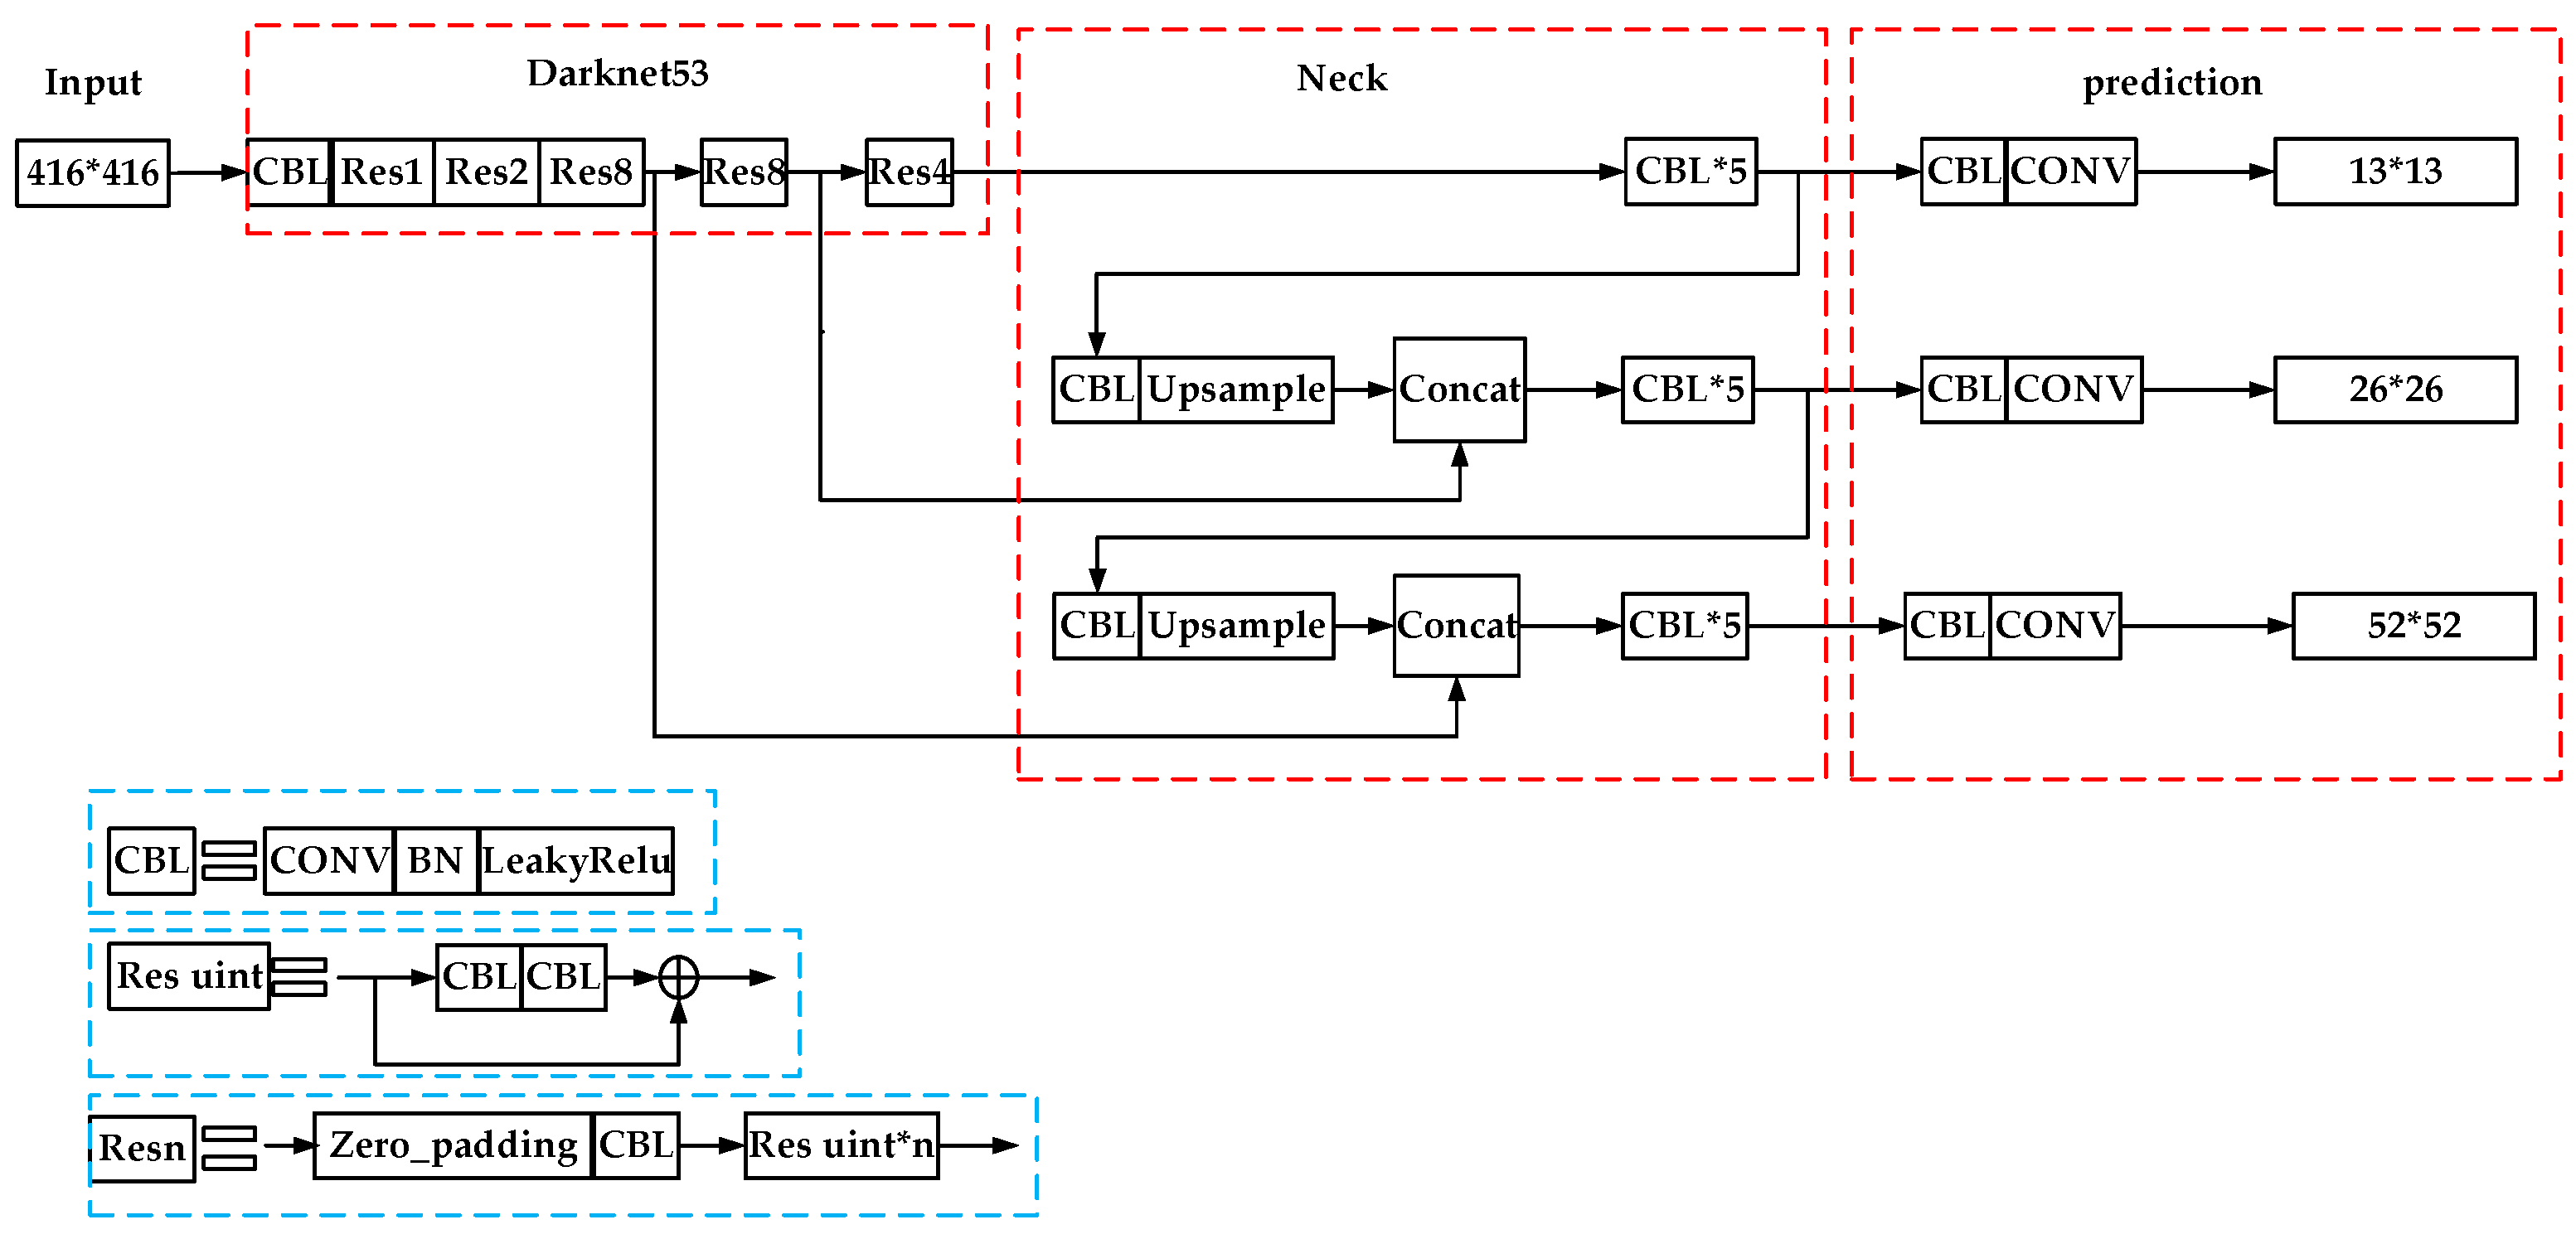
2. The Algorithm Principle of Yolov3
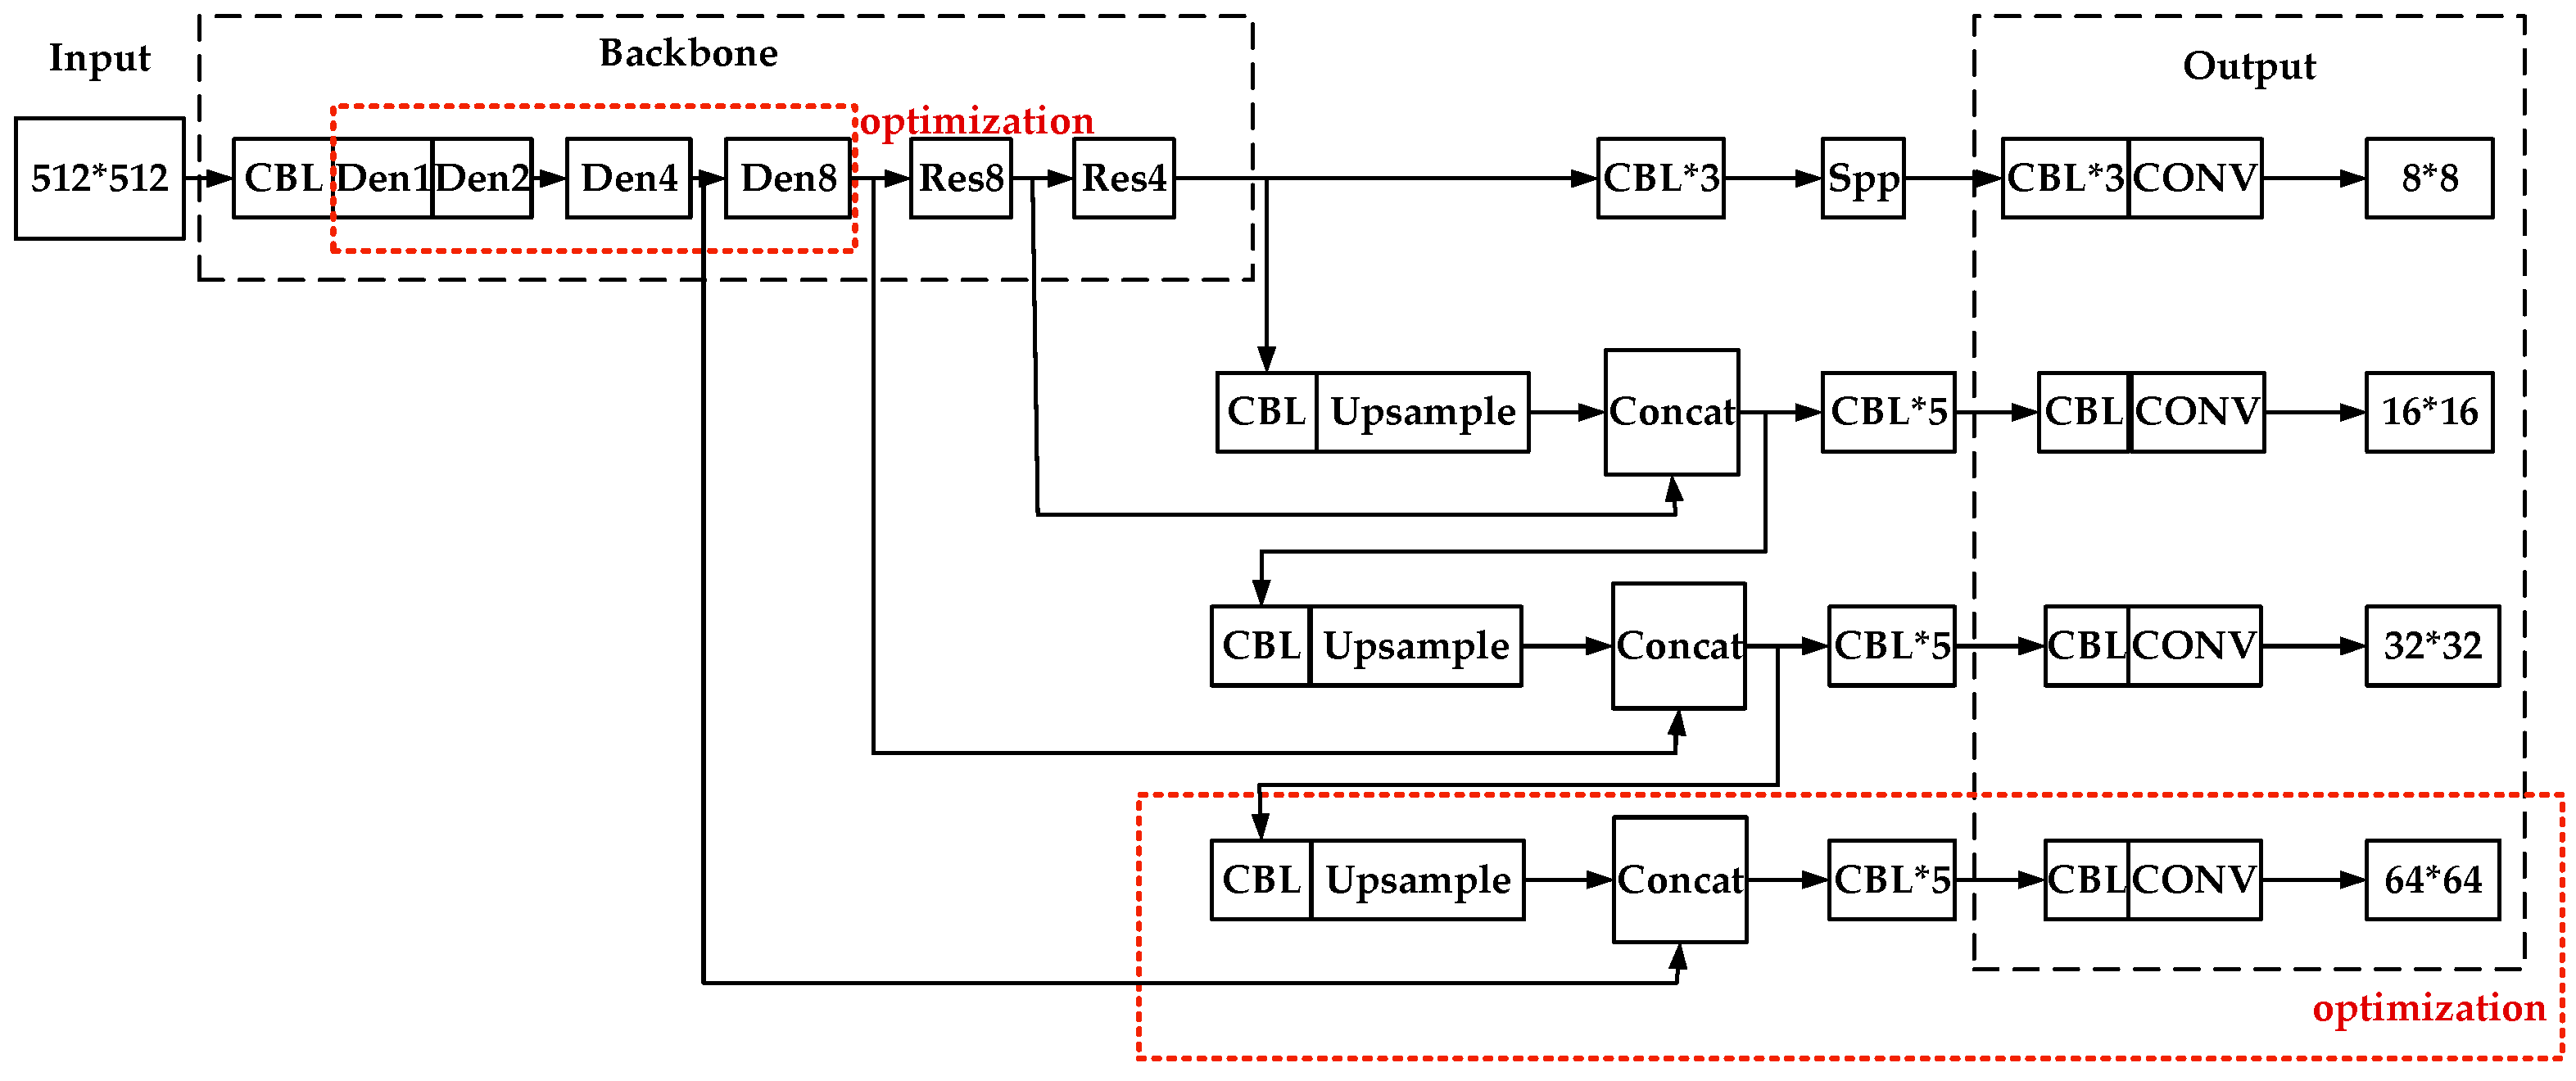
The YOLOV3 network architecture is shown in Figure 1. It is divided into a feature extraction part and a target detection part. In the feature extraction part, it continues and deepens the YOLOV2 backbone network Darknet19. The convolution layer and the batch normalization layer (batch normalization, BN) and the Leaky ReLU activation function layer [21] are connected to the basic unit of the network, CBL. Many 1 × 1 and size 3 × 3 CBL units are alternately connected to form Darknet53, and a skipping connection structure is adopted to ensure that the gradient explosion and the training convergence cannot occur while deepening the network. And in the target detection network part, the idea of the feature pyramid network (Feature Pyramid Network, FPN [22]) is used for reference, and the feature maps with sizes of 13 × 13 , 26 × 26 , 52 × 52 are passed on. After sampling, it is fused with the upper-layer feature map of the corresponding size to achieve multi-scale output. The output feature map with the size of 13 × 13 has a larger receptive field and is suitable for larger targets, whereas the output feature map with the size of 52 × 52 is suitable for the detection of small targets.
The basic idea of YOLOV3 algorithm is to divide the input image into S × S grid, when there is a target center point in the grid, the center point is responsible for predicting the class position of the target. In order to help predict the size of priori boxes, three sizes of anchor boxes are set up by K-means algorithm. The detection frames are filtered according to the threshold of the intersection over union (IOU), and the detection frames with the highest confidence are output as the final detection results by non-maximum suppression (NMS).
In YOLOV3 algorithm, multi-label training is realized by using a logistic classifier, and binary cross entropy is used to describe the classification loss function. The smaller the binary cross entropy is, the smaller the value of the loss function is, and the more the learning result of the network model is close to the actual result. The expressions of the loss function are given in (1).
L o s s = λ c o o r d i = 0 S 2 j = 0 B I i j o b j [ ( x i x ^ i j ) 2 + ( y i y ^ i j ) 2 ] + λ c o o r d i = 0 S 2 j = 0 B I i j o b j [ ( w i j w ^ i j ) 2 + ( h i j h ^ i j ) 2 ] i = 0 S 2 j = 0 B I i j o b j [ C ^ i j l o g ( C i j ) + ( 1 C ^ i j ) l o g ( 1 C i j ) ] λ n o o b j i = 0 S 2 j = 0 B I i j n o o b j [ C ^ i j l o g ( C i j ) + ( 1 C ^ i j ) l o g ( 1 C i j ) ] i = 0 S 2 I i j o b j c c l a s s e s [ P ^ i j l o g ( P i j ) + ( 1 P ^ i j ) l o g ( 1 P i j ) ]
where, the first line is the error term of center coordinates; The second line is the coordinate error term of the height and width of the border; The third line is the bounding box confidence loss of the existing object. The fourth line is the bounding box confidence loss of non-existent objects. The fifth line is the classification loss of the cell in which the object resides. S 2 is the number of cells, B is the number of bounding boxes predicted by each grid. I i j o b j indicates whether the bounding box j in grid i is responsible for the object; I i j n o o b j indicates that the bounding box j in grid i is not responsible for the object, C ^ i j is the parameter confidence, which is jointly determined by I i j o b j and I i j n o o b j , and λ c o o r d is the scaling factor to ensure stable convergence in the initial stage of training.

3. DSPP-YOLO

3.1. The Algorithm Design

Applying YOLOV3 algorithm to door and window position detection, the precision of door and window position detection is much higher than that of window position detection. There are three reasons for this: (1) compared with the door, the window is a transparent object, there is no obvious large area, fixed color and other characteristics. Therefore, in the process of network learning, the features learned by CNN in the window will change with the change of the background, and it is difficult to find a universal feature as a symbol to identify the type and location of the window. (2) certain types of windows and doors have some common features, such as glass doors and French windows, doors with windows. (3) some high-rise building sample image window size is too small, resolution is too low, with small target features, less than 32 × 32 pixels. Because of the size difference, the detection network should consider not only the recognition of door semantic information, but also the determination of remote window position information. If the network depth is only increased, the feature information of the small-size remote window will disappear in the deep network due to the down sampled, and the detection accuracy will decrease.
In order to solve these problems, based on the YOLOV3 network structure, this paper optimizes the network structure of Darknet53 by combining DenseNet [23] and SPP module, as shown in Figure 2. Firstly, add the Res·4 module between Res·2 and Res·8 models in Figure 1 to deepen the network hierarchy for more semantic features. Secondly, combining DenseNet’s idea of dense block and residual block, dense block is used to replace Res·1, Res·2, Res·4 and Res·8 models. Thirdly, based on the original 3rd output scale 52 × 52 feature map, the 4th output scale 104 × 104 is generated by connecting the 3rd output scale with the 24th layer feature map by up sampling. As mentioned above, large-scale feature maps have smaller receptive fields and are suitable for detecting smaller targets; four-scale output feature mapping can consider the position detection between the door, the near window and the far window. Finally, the SPP module is added after the feature extraction network.

3.2. Improvement of Darknet53
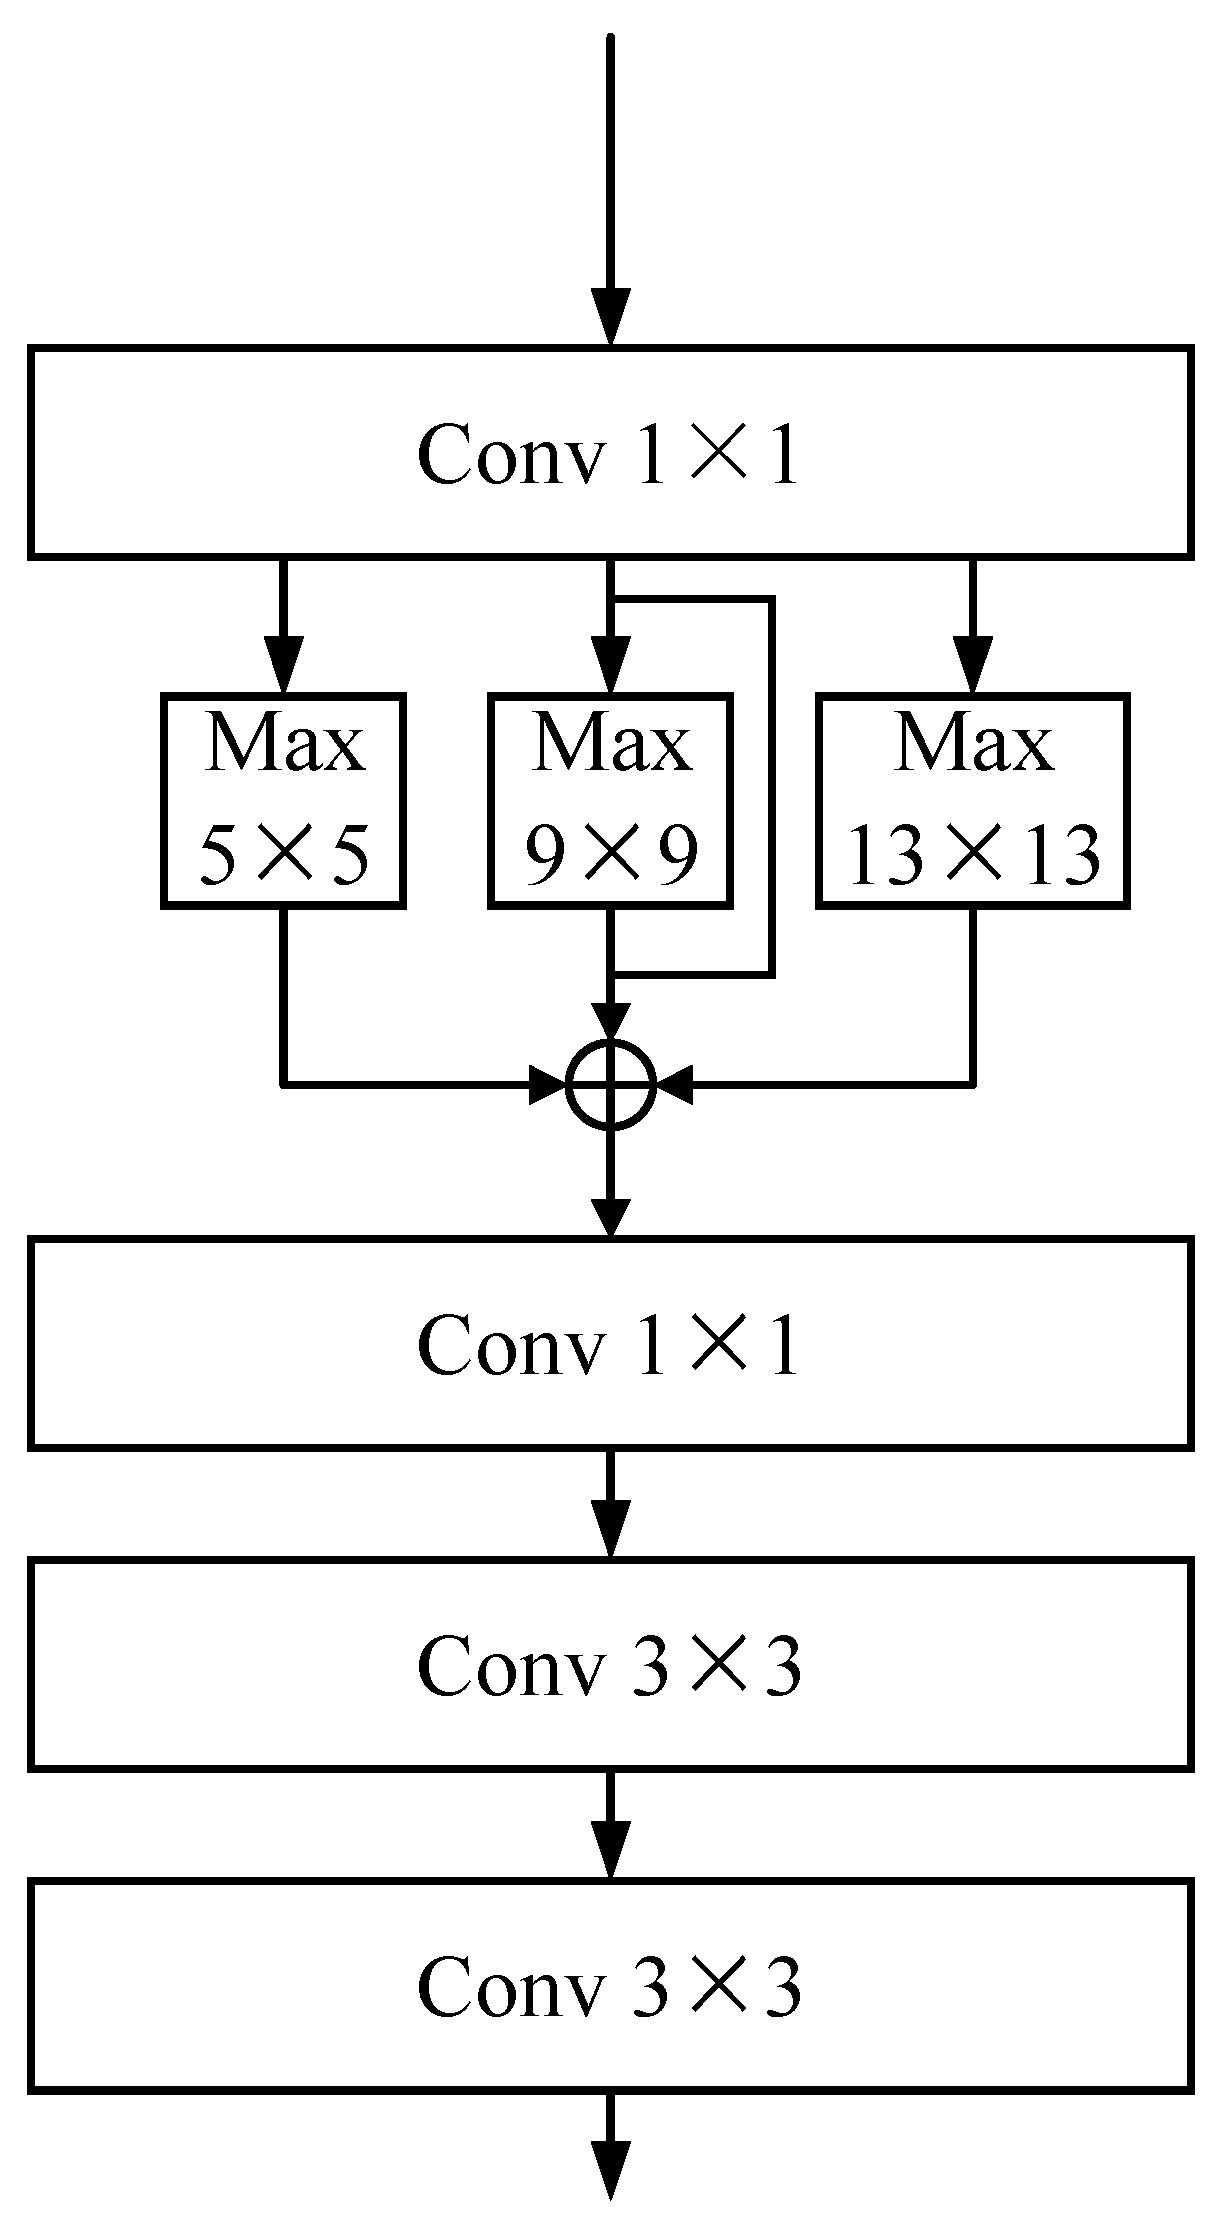
The improvement of the feature extraction network focuses on learning more door semantic features, while maintaining the original position and semantic information of the remote window in shallow network. DenseNet’s idea is applied to the feature extraction network, and dense block des n is added to the feature extraction network.
DenseNet consists of dense blocks, bottleneck layers, and transition layers. The dense block is similar in structure to the CBL module and consists of a BN Layer, a ReLU Layer, and a convolution Layer; it is a collection between layers of dense connectivity, as shown in Figure 3. The dense connection will lead to the repeated use of the feature map, which will result in the operation load. Therefore, bottleneck layers are set up and a transition layer is added after each dense block to reduce the dimension of the output feature map, to solve the problem that the output information is too wide. DenseNet optimizes the learning result by repeatedly using the feature graph to reduce the number of parameters used. Its parameter passing mechanism is to let all the convolution layers in the network have a direct connection, and the convolution input of each layer is the sum of all the convolution outputs of the upper layer, at the same time, its output will be used as part of the input of each later convolution layer, which can be connected directly to each other to achieve maximum information transfer.
In summary, DenseNet has the advantages of a narrow network structure, few learning parameters, alleviating gradient disappearance, enhancing feature propagation, and reusing learned features. Therefore, the first four Res·n modules are improved into Des·n modules and the last two Res·n modules are kept unchanged. This change is to superimpose the remote window position information learned in the shallow network to the deep network. In the input features, the problem of missing remote window position information after multiple down sampled is solved, so that the shallow features can be used multiple times and more effectively while ensuring the depth of the network.

3.3. SPP Module

The SPP module draws on the idea of the image pyramid, as shown in Figure 4. It consists of multiple pooling layers with different steps. In the network framework designed in this paper, it consists of three sizes of 5 × 5 , 9 × 9 , 13 × 13 max pooling layer with stride 1 and a skip connection. The emergence of the SPP module enables the network to ensure the learning accuracy while ensuring multi-size input. At the same time, the size of the maximum pooling kernel in the SPP module is the same as the feature map size of the last Des·n output, which can make local features and global features. Feature fusion enriches the expressive ability of feature maps, realizes fusion of multiple receptive fields, and optimizes the large difference in door and window sizes in the data set in this paper. The SPP module is an independent structure, only at the end of the backbone Darknet53 Partial addition, no more impact on the overall network structure.

3.4. K-Means++ Algorithm

Anchor boxes can solve the problem of multiple target objects in the same grid. In the DSSP-YOLO algorithm, the IOU between the actual detection boxes and the initial bounding boxes is used as the clustering basis. As shown in (2), the K-Means++ algorithm is used to cluster the labels in the data set used in this paper. To improve the accuracy of training and detection. The K-Means++ algorithm is optimized on the basis of the K-Means algorithm. Assuming that there are already n points as the initial cluster center, when selecting the n + 1th initial cluster center, the K-Means++ algorithm will preferentially select the same as the previous one. The points farther from the center point are used as the initial cluster center.
d ( b o x , c e n t r o i d ) = 1 I O U ( b o x , c e n t r o i d ) I O U = P r e d i c t e d   b o x     G r o u n d t r u t h   b o x P r e d i c t e d   b o x     G r o u n d t r u t h   b o x
In the type, centroid is the anchor box. The K-means ++ algorithm has three steps:
(1)
A random sample is selected as the initial cluster center in the dataset c 1 ;
(2)
Calculate the shortest distance between each sample and the current cluster center, and calculate the probability that each sample will be selected as the next cluster center, D ( x ) 2 / x χ D ( x ) 2 , and then get the next cluster center through the wheel method;
(3)
Repeat the previous step until a given number k of cluster centers are selected and stop the calculation.
According to the improvement of the output scale in Section 3.1, the number of anchor boxes are correspondingly increased from 9 to 12. The clustering results are shown in Table 1. The average IOU value of the new anchor boxes generated after re-clustering is the same as that of YOLOV3. Compared with the original anchor box, the average IOU is increased by 10.85%, which is more suitable for the dataset used in this paper.

3.5. Pseudocode

In Figure 2, the flow of DSPP-YOLO algorithm is introduced. This section presents the pseudocode of feature extraction in Algorithm 1 and training model in Algorithm 2.
Algorithm 1 The pseudocode of feature extraction
1. For X = 1 ; X < = ( t o t a l   n u m b e r   o f   t r a i n i n g   i m a g e s ) ; X + +
2.   Read photos of doors and Windows
3.   Divide the picture into n × n areas for use
4.   Search for areas with possible target centers
5.   Generate bounding boxes in possible regions
6.   Predict target width and height
7.   According to anchor boxes size and object size adjust bounding boxes size
8.   Predict the target category
9.   Calculate the confidence score of bounding boxes
10.  Output the center coordinates, width and height, and object category of the bounding box with the highest confidence
11. end for
Algorithm 2 The pseudocode of training model.
Input: I : set of n training images
     M : the width of anchor boxes
     N : the height of anchor boxes
Output:   P : the target category
     ( X , Y ) : coordinates of the center of the bounding boxes
     W : the width of the bounding boxes
     H : the height of the bounding boxes
1. For n = 1 to I do:
2.   According to the feature extraction algorithm to extract the training picture: P , X , Y , W , H
3.   Calculate the error between the target center coordinates predicted by the model ( X , Y ) and the real training images ( X n , Y n )
4.   Calculate the error between the width-height coordinates of the model predicted detection box ( W , H ) and the real detection box ( W n , H n )
5.   Calculate the confidence errors of the objects in the predictive detection boxes of models C n
6.   Calculate the confidence errors of the objects is not found in the predictive detection boxes of models
7.   Calculate the error between the prediction categories P n and P
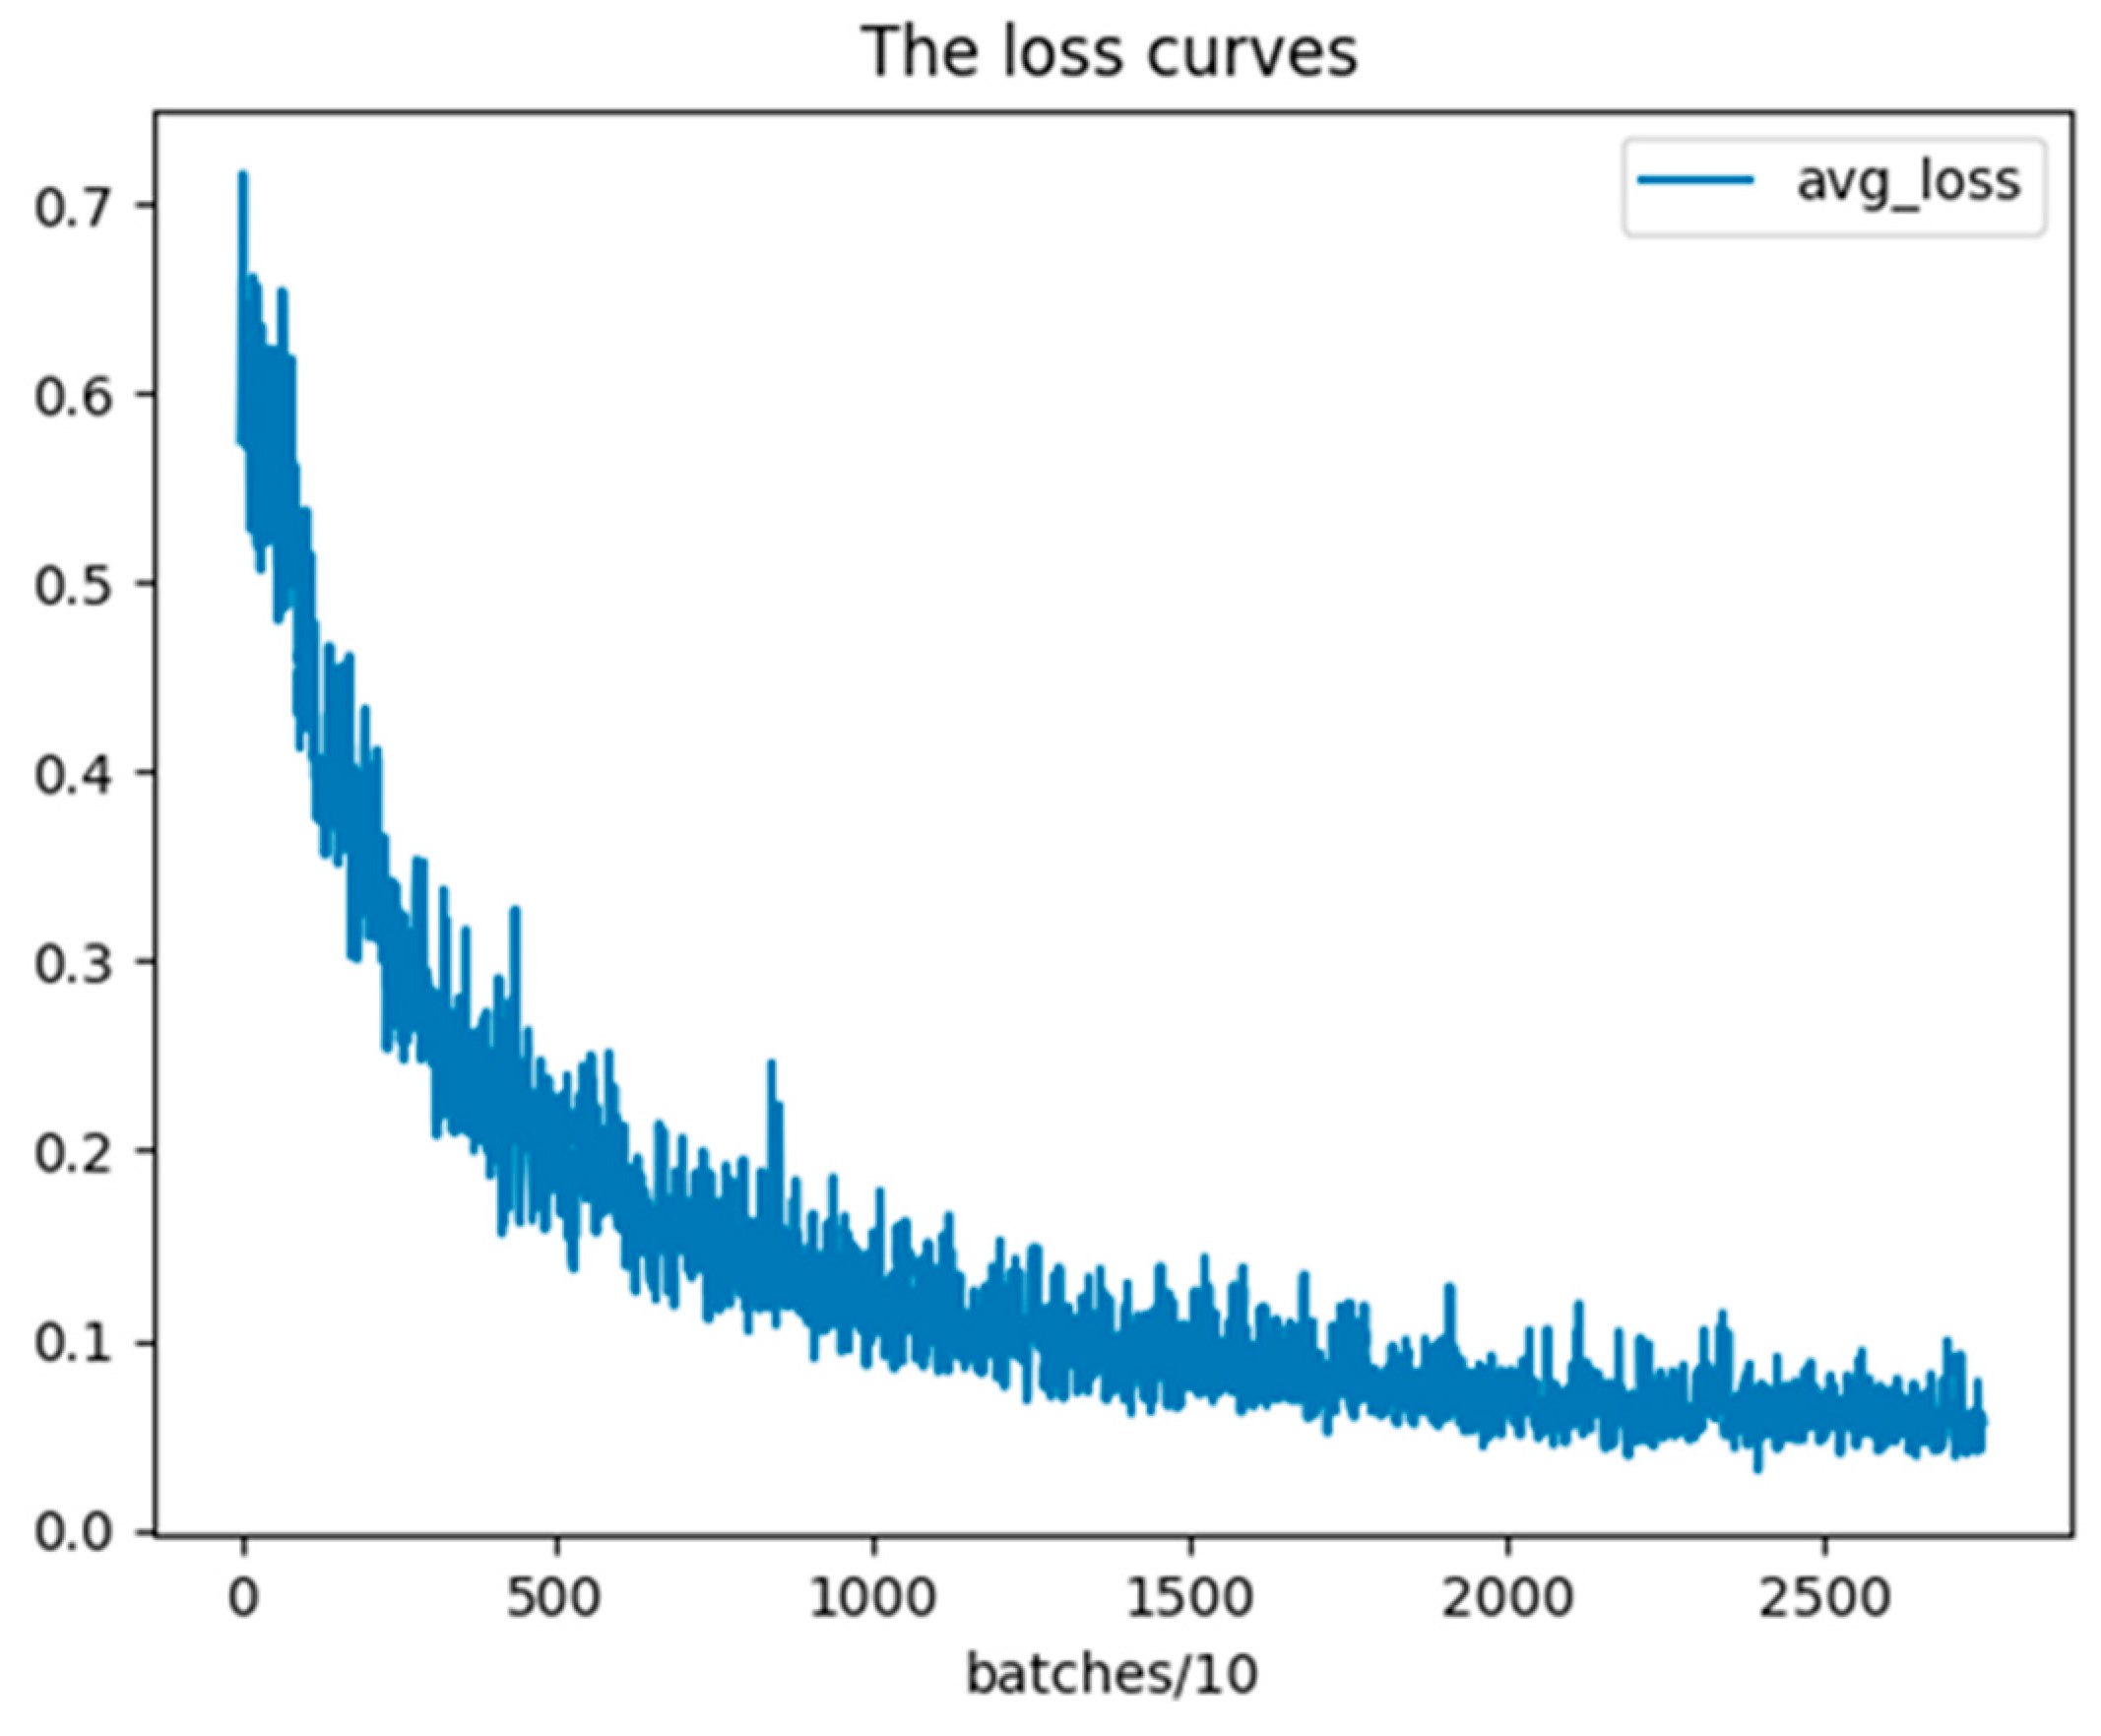
8.   The training model adaptively adjusts learning according to the loss function
9.   Convergence of loss function
10.   Obtain the training model with the minimum loss function to achieve target detection

4. Experimental Analysis

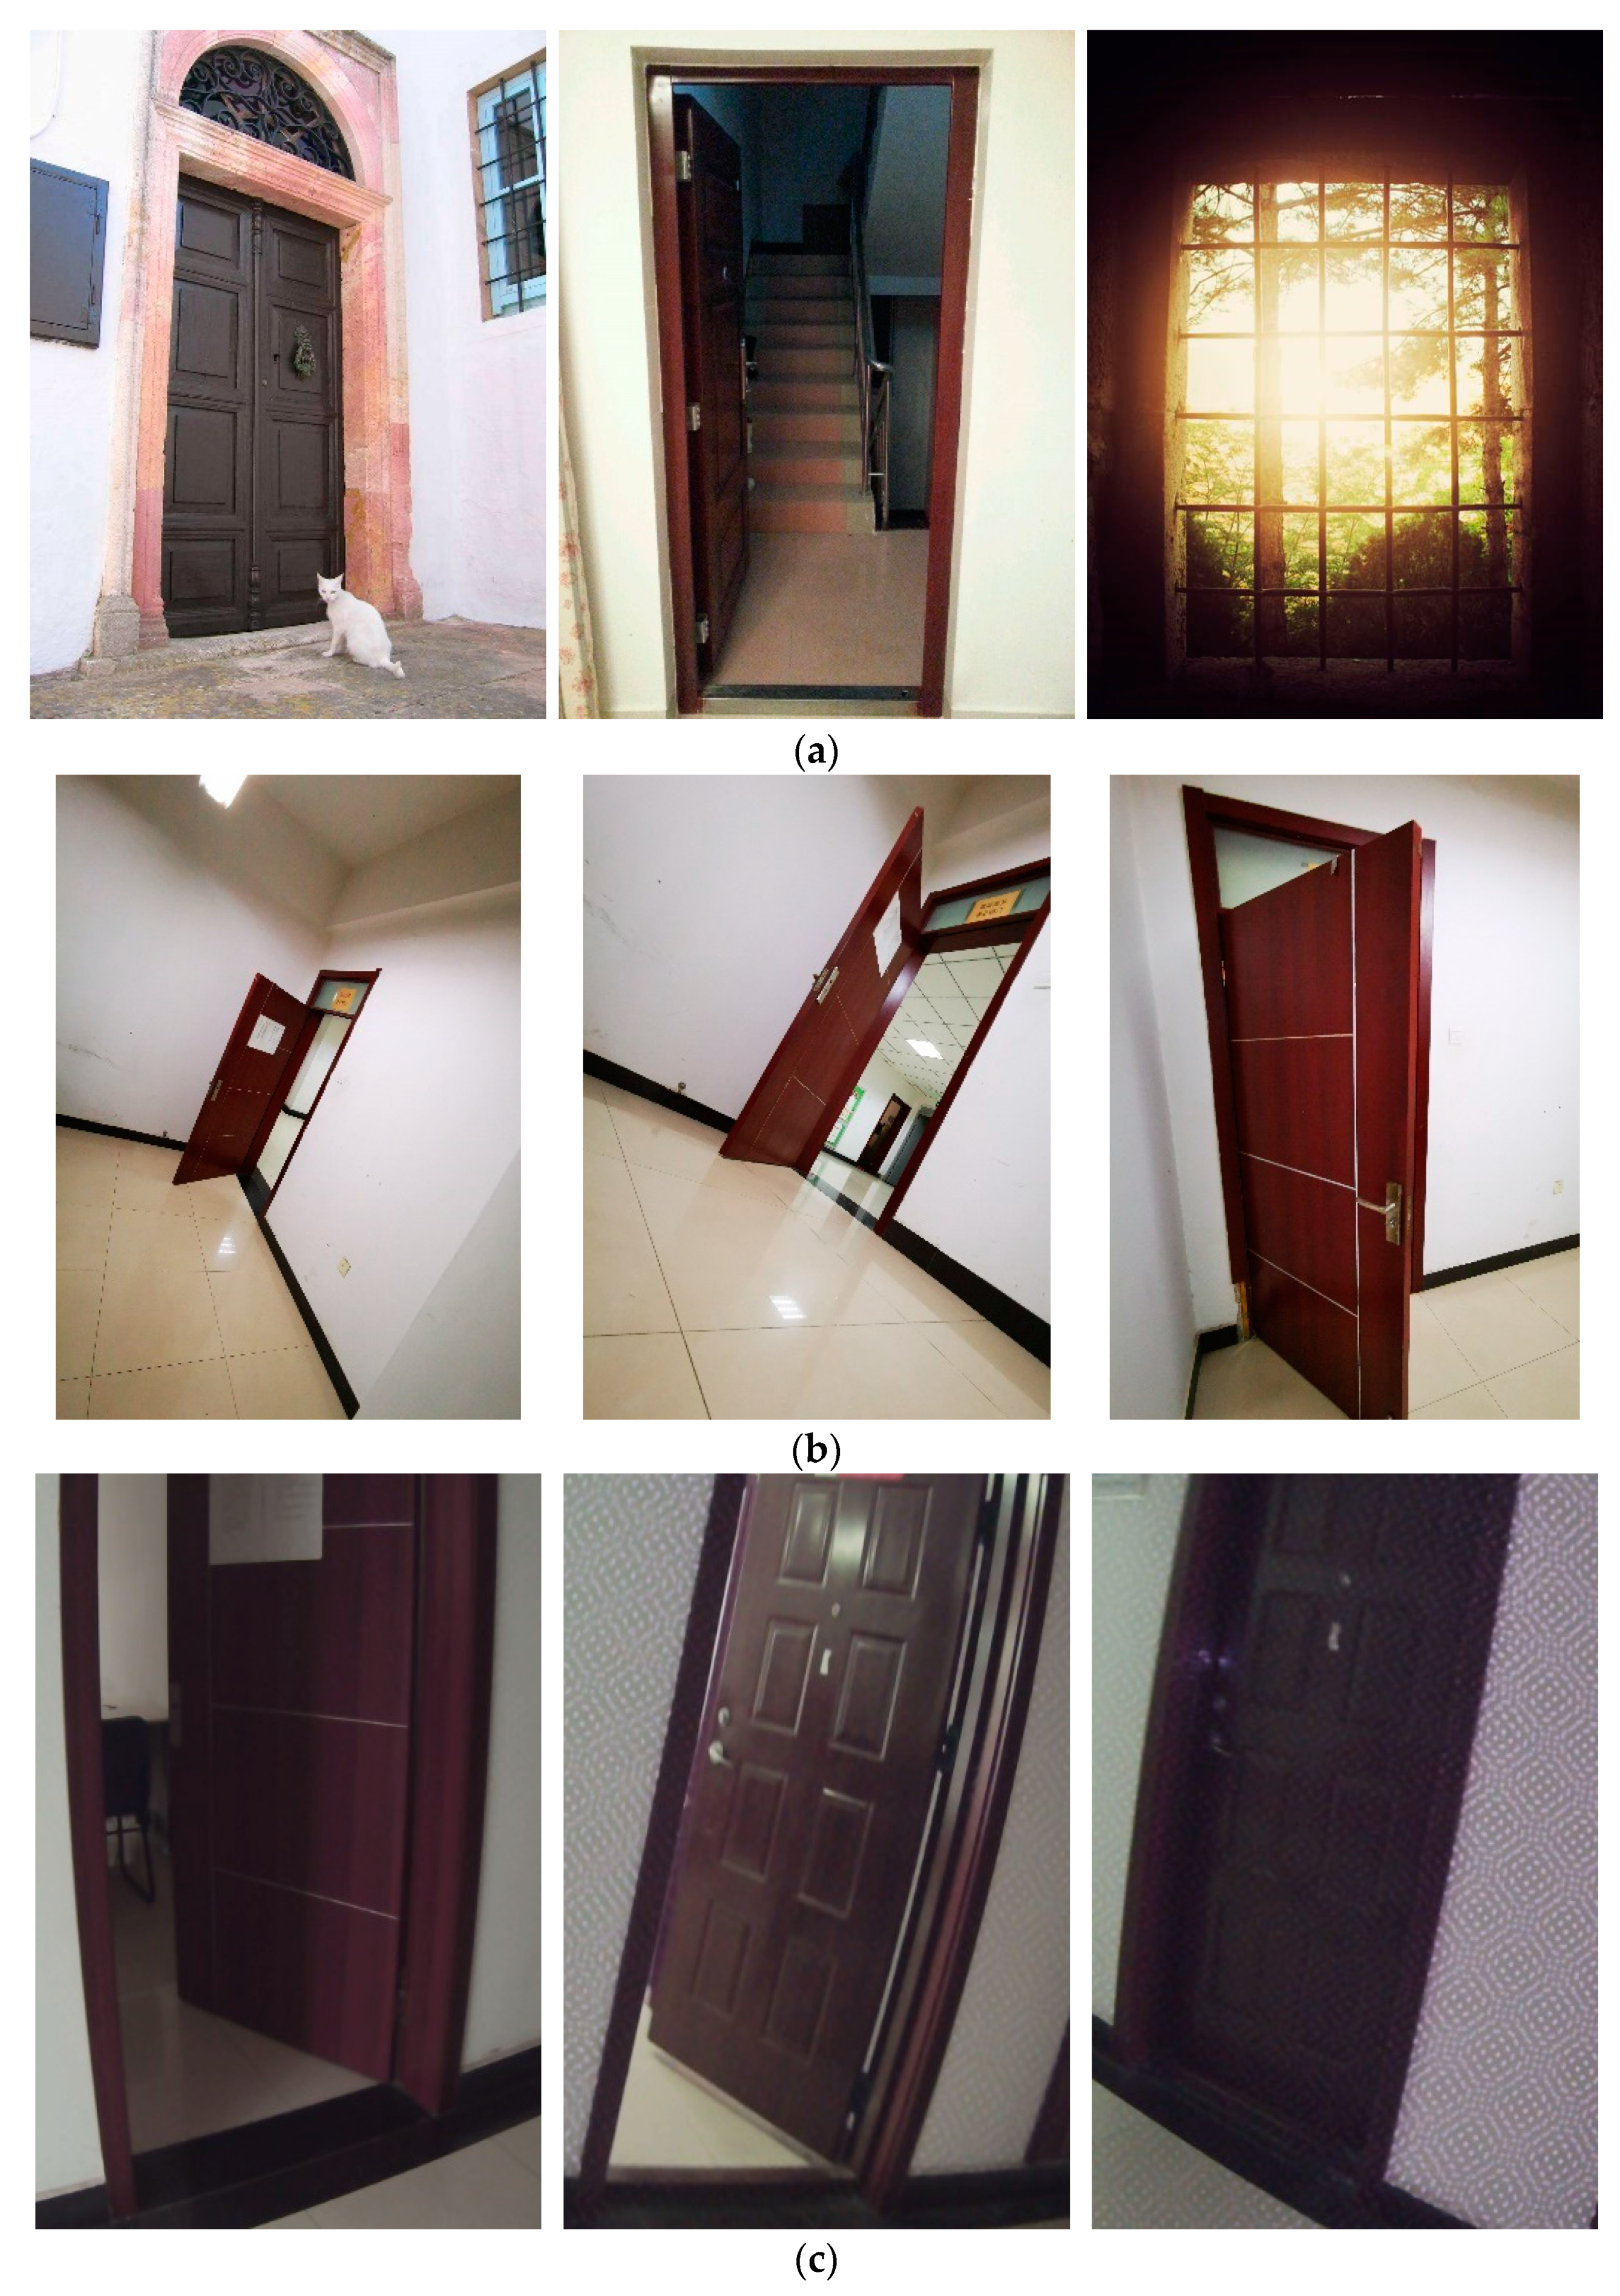
4.1. Experimental Data Set and Environment

Data set: the experimental data used in this experiment is divided into two parts, one part is the public images collected on the internet, the other part is the multi-angle, multi-state images collected by different devices based on the experimental scene, which are taken in the classrooms and laboratory. There are 1105 samples. The data set of this experiment covers rich picture information of different shapes, different shooting angles, different sizes and different scenes of the target, which can increase the generalization ability of the network. However, some pictures are not clear enough. As shown in Table 2 are the hardware configuration. The total samples are proportionally divided into training set and test set, and 25% of the training set is divided into cross-validation set, which is used to verify the periodic learning results in the training process. Figure 5 shows part of the dataset from different sources. (a) It’s some pictures we found from the Internet. (b) It’s some pictures we had taken with a mobile phone from different angles. (c) It’s some pictures we had taken with a car from different angles. All images are not preprocessed and in rgb format.
This experiment is trained by GPU acceleration. The relevant configuration of the experiment is shown in Table 2. The training parameters are selected according to the experience of multiple experiments. In training, batch refers to the number of samples for updating training parameters in each batch of batch training, and subdivisions are subdivisions. The number of batches is used to reduce the burden on the graphics card. The batch is set to 32, and the subdivisions are set to 8; the momentum parameter is set to 0.9; the weight decay regular coefficient is set to 0.0005; the initial learning rate is set to 0.01; and the threshold value of IOU in NMS is 0.5.

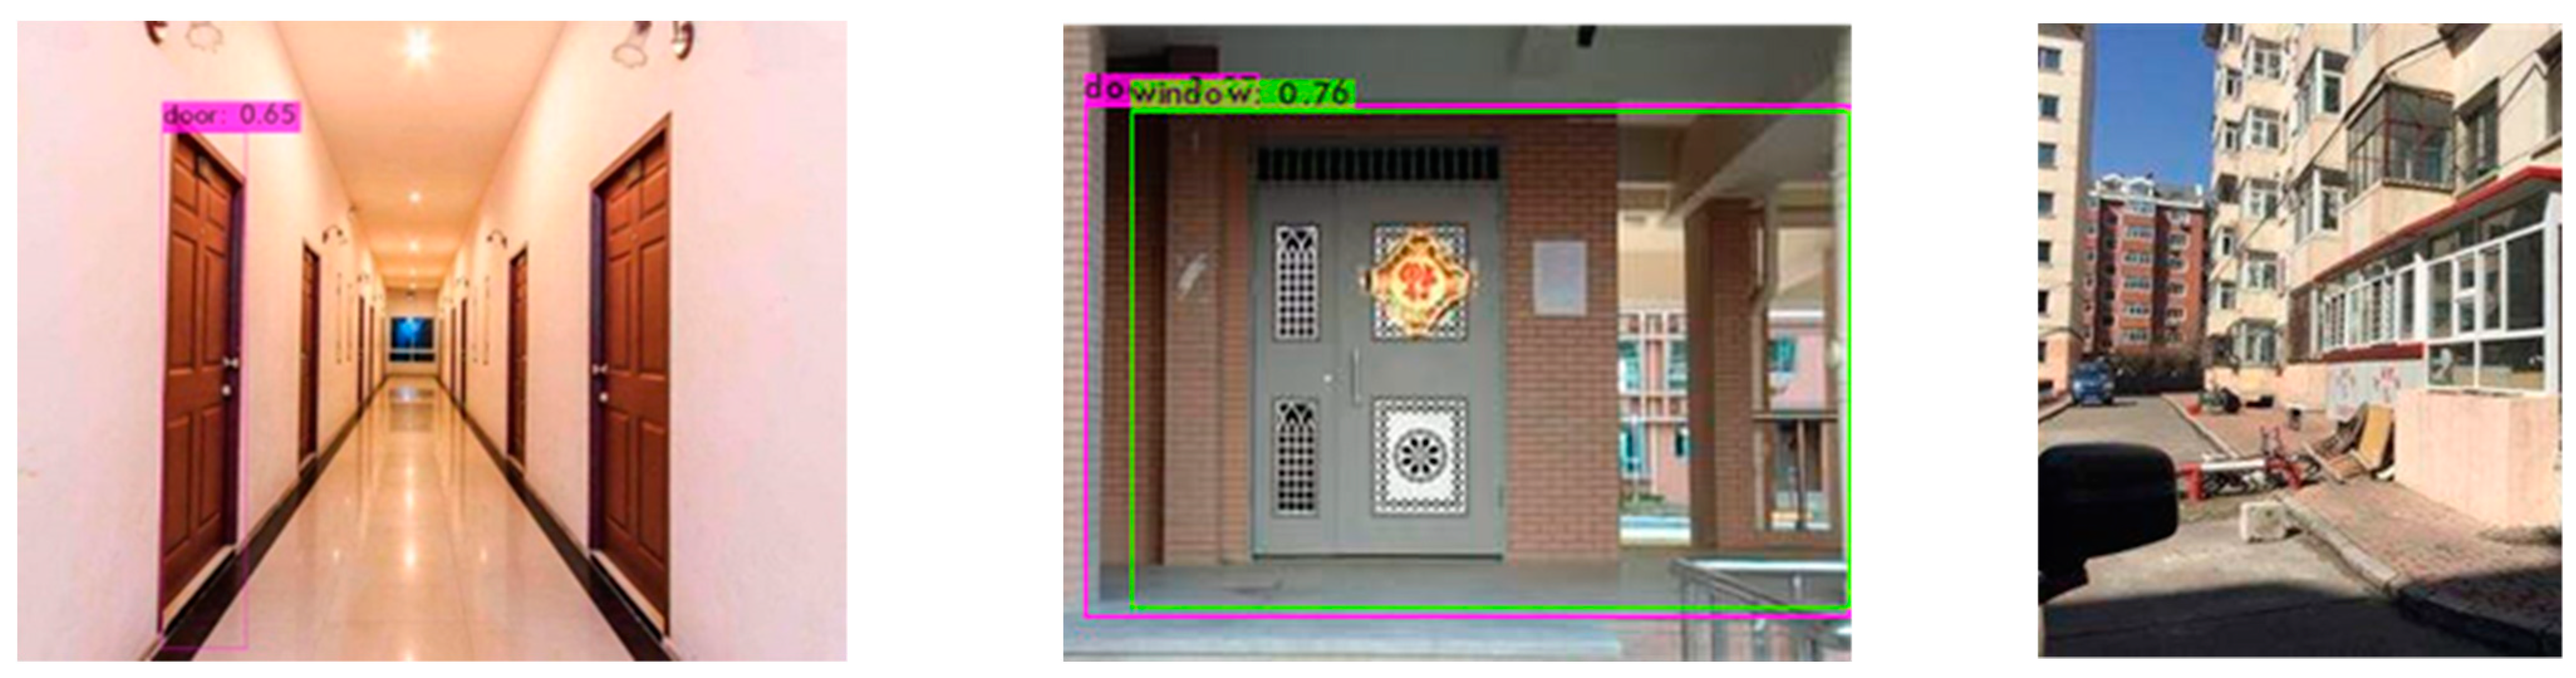
4.2. Experimental Results

The loss function of DSPP-YOLO algorithm in training is shown in Figure 6 When the DSPP-YOLO algorithm has been trained for 22,000 times, the loss function has dropped below 0.1, and gradually becomes flat, but the loss function fluctuates greatly, due to the DSPP-YOLO algorithm changing some Res·n modules to Des·n modules.
Under the same experimental conditions, the YOLOV1 algorithm, the YOLOV2 algorithm, the YOLOV3 algorithm, the YOLOV3-Tiny algorithm, the YOLOV3-144884 algorithm after extending the Darknet53 backbone network, and the DSPP-YOLO algorithm in this paper were trained separately, and the test results are shown in the Table 3 shown.
According to the Table 3, the detection accuracy of DSPP-YOLO algorithm is 77.4% for door, 38.1% for window, and the mean average precision is 57.75%. Compared with the original YOLOV3 algorithm, the detection accuracy is improved by 3.3%, 8.8% and 6.05% respectively. And with the same amount of test data set being tested, although some Res·n modules are replaced by Des·n modules. However, the algorithm of DSPP-YOLO algorithm is only about 2 s slower than that of YOLOV3 algorithm, because it still keeps the hop connection in the deep network structure and reduces the influence on the detection speed. Compared with other algorithms in the same series, YOLOV1 algorithm and YOLOV2 algorithm are the earlier and simpler models of YOLO algorithm. However, YOLOV3-tiny is a variant of YOLOV3 with a simple network structure, which only contains 23 layers of network and two output scales, so its detection speed is the fastest, only 5.34 s, compared with DSPP-YOLO, the detection precision of door is only 73.9%, and that of window is reduced to 27.5%. The YOLOV3-144884 algorithm extends Darknet53 network by adding a Res·4 module and a lower sampling layer, the Res·2 module of the original YOLOV3 is extended to Res·4, but it can be seen from the experimental results that the increase of the network depth leads to the instability of the structure, which leads to the decrease of the detection precision, therefore, the superiority of DSPP-YOLO algorithm can be verified.
The target detection results of the YOLOV3 algorithm and the DSPP-YOLO algorithm are shown in Figure 7 and Figure 8. The YOLOV3 algorithm has a big problem in the detection of the public image part of the data set. Small windows are overlooked, or the detection frame of the door contains other background distractors. However, DSPP-YOLO can improve this situation, correcting the small target that was missed in the original network—the remote window, and the misidentification—taking the entire image as the door and actually being the window, but since the window is not relatively fixed characteristics, so there will still be false detections and missed detections.

5. Conclusions

Based on the YOLOV3 algorithm, this paper proposes an improved algorithm model for the detection of doors and windows by autonomous mobile robots in unknown environments-DSPP-YOLO. Firstly, we introduce SPP module to solve the problem of large sample size gap and inconsistent receiving domain scale. In order to better distinguish the semantic information of special types of doors and windows, we add a down sampled layer to deepen the learning of semantic features. Then, to solve the problem that the position information of the remote window may be lost in the deep network, we combined the idea of DenseNet and replaced the first four Res·n modules in the YOLOV3 algorithm with Des·n modules. Finally, the K-means++ algorithm is used to re-cluster the anchor size to reduce the detection error caused by the candidate frame.
YOLOV3 algorithm is a typical one-stage object detection algorithm, which can be improved from the following two aspects in the future: (1) We can build a backbone network with stronger representation ability to improve the accuracy of the algorithm; (2) We can propose a new loss function to solve the problem of sample imbalance encountered in the process of object detection. In the future, we plan to apply the doors and windows object detection in the autonomous exploration algorithm of autonomous mobile robots in unknown environments.

Author Contributions

Writing—Review & Editing, T.Z.; Writing—Original Draft Preparation, J.L.; Validation, Y.J.; Methodology, M.Z.; Project administration, M.P. All authors have read and agreed to the published version of the manuscript.

Funding

This research was funded by the National Natural Science Foundation of China (NSFC) (61603297) and Natural Science Foundation of Shanxi Province (2020JQ-219).

Informed Consent Statement

The paper does not involve any ethical guidelines.

Conflicts of Interest

The authors declare no conflict of interest.

References

  1. Di, K.; Wan, W.; Zhao, H.; Liu, Z.; Wang, R.; Zhang, F. Progress and Applications of Visual SLAM. Acta Geod. Et Cartogr. Sin. 2018, 47, 770–779. [Google Scholar]
  2. Artieda, J.; Sebastian, J.M.; Campoy, P.; Correa, J.F.; Mondragon, I.F.; Martinez, C.; Olivares, M. Visual 3-D SLAM from UAVs. J. Intell. Robot. Syst. 2009, 55, 299–321. [Google Scholar] [CrossRef]
  3. Steder, B.; Grisetti, G.; Stachniss, C.; Burgard, W. Visual SLAM for Flying Vehicles. IEEE Trans. Robot. 2008, 24, 1088–1093. [Google Scholar] [CrossRef] [Green Version]
  4. Thrun, S.; Montemerlo, M.; Dahlkamp, H.; Stavens, D.; Aron, A.; Diebel, J.; Fong, P.; Gale, J.; Halpenny, M.; Hoffmann, G.; et al. Stanley: The robot that won the DARPA Grand Challenge. J. Field Robot. 2006, 23, 661–692. [Google Scholar] [CrossRef]
  5. Qin, T.; Li, P.; Shen, S. VINS-Mono: A Robust and Versatile Monocular Visual-Inertial State Estimator. IEEE Trans. Robot. 2018, 34, 1004–1020. [Google Scholar] [CrossRef] [Green Version]
  6. Wu, X.; Song, X.; Gao, S.; Chen, C. Review of target detection algorithms based on deep learning. Transducer Microsyst. Technol. 2021, 40, 4. [Google Scholar]
  7. Hong-kun, C.; Hui-lan, L. Survey of Object Detection Based on Deep Learning. Acta Electonica Sin. 2020, 48, 1230–1239. [Google Scholar] [CrossRef]
  8. Uijlings, J.R.R.; Van De Sande, K.E.A.; Gevers, T.; Smeulders, A.W.M. Selective search for object recognition. Int. J. Comput. Vis. 2013, 104, 154–171. [Google Scholar] [CrossRef] [Green Version]
  9. Carreira, J.; Sminchisescu, C. CPMC: Automatic Object Segmentation Using Constrained Parametric Min-Cuts. IEEE Trans. Pattern Anal. Mach. Intell. 2012, 34, 1312–1328. [Google Scholar] [CrossRef] [PubMed]
  10. Girshick, R.; Donahue, J.; Darrell, T.; Malik, J. Rich feature hierarchies for accurate object detection and semantic segmentation. In Proceedings of the 27th IEEE Conference on Computer Vision and Pattern Recognition, CVPR 2014, Columbus, OH, USA, 23–28 June 2014; pp. 580–587. [Google Scholar]
  11. An, J.; Wang, Z. A Fast Iteration Algorithm Suitable for Incremental Learning for Training Support Vector Machine. Comput. Appl. 2003, 23, 12. [Google Scholar]
  12. He, K.; Zhang, X.; Ren, S.; Sun, J. Spatial Pyramid Pooling in Deep Convolutional Networks for Visual Recognition. IEEE Trans. Pattern Anal. Mach. Intell. 2015, 37, 1904–1916. [Google Scholar] [CrossRef] [PubMed]
  13. Girshick, R. Fast R-CNN. In Proceedings of the 15th IEEE International Conference on Computer Vision, ICCV 2015, Santiago, Chile, 11–18 December 2015; pp. 1440–1448. [Google Scholar]
  14. Ren, S.; He, K.; Girshick, R.; Sun, J. Faster R-CNN: Towards real-time object detection with region proposal networks. In Proceedings of the 29th Annual Conference on Neural Information Processing Systems, NIPS 2015, Montreal, QC, Canada, 7–12 December 2015; pp. 91–99. [Google Scholar]
  15. Kong, T.; Yao, A.; Chen, Y.; Sun, F. HyperNet: Towards Accurate Region Proposal Generation and Joint Object Detection. In Proceedings of the 2016 IEEE Conference on Computer Vision and Pattern Recognition (CVPR), Las Vegas, NV, USA, 27–30 June 2016; pp. 845–853. [Google Scholar]
  16. Dai, J.F.; Li, Y.; He, K.M.; Sun, J. R-FCN: Object Detection via Region-based Fully Convolutional Networks. In Proceedings of the 30th Conference on Neural Information Processing Systems (NIPS), Barcelona, Spain, 5–10 December 2016. [Google Scholar]
  17. Liu, W.; Anguelov, D.; Erhan, D.; Szegedy, C.; Reed, S.; Fu, C.-Y.; Berg, A.C. SSD: Single shot multibox detector. In Proceedings of the 14th European Conference on Computer Vision, ECCV 2016, Amsterdam, The Netherlands, 8–16 October 2016; pp. 21–37. [Google Scholar]
  18. Redmon, J.; Divvala, S.; Girshick, R.; Farhadi, A. You only look once: Unified, real-time object detection. In Proceedings of the 29th IEEE Conference on Computer Vision and Pattern Recognition, CVPR 2016, Las Vegas, NV, USA, 26 June–1 July 2016; pp. 779–788. [Google Scholar]
  19. Redmon, J.; Farhadi, A. YOLO9000: Better, faster, stronger. In Proceedings of the 30th IEEE Conference on Computer Vision and Pattern Recognition, CVPR 2017, Honolulu, HI, USA, 21–26 July 2017; pp. 6517–6525. [Google Scholar]
  20. Redmon, J.; Farhadi, A. YOLOv3: An incremental improvement. arXiv 2018, arXiv:1804.02767. [Google Scholar]
  21. Khalid, M.; Baber, J.; Kasi, M.K.; Bakhtyar, M.; Devi, V.; Sheikh, N. Empirical Evaluation of Activation Functions in Deep Convolution Neural Network for Facial Expression Recognition. In Proceedings of the 43rd International Conference on Telecommunications and Signal Processing (TSP), Electr Network, Milan, Italy, 7–9 July 2020; pp. 204–207. [Google Scholar]
  22. Lin, T.-Y.; Dollar, P.; Girshick, R.; He, K.; Hariharan, B.; Belongie, S. Feature pyramid networks for object detection. In Proceedings of the 30th IEEE Conference on Computer Vision and Pattern Recognition, CVPR 2017, Honolulu, HI, USA, 21–26 July 2017; pp. 936–944. [Google Scholar]
  23. Forrest, I.; Moskewicz, M.; Karayev, S.; Girshick, R.; Darrell, T.; Keutzer, K. DenseNet: Implementing Efficient ConvNet Descriptor Pyramids; Cornell University Library: Ithaca, NY, USA, 2014. [Google Scholar]
Figure 1. YOLOV3 network model.
Applsci 12 10770 g001
Figure 2. DSSP-YOLO Network Architecture.
Applsci 12 10770 g002
Figure 3. Dense Block.
Applsci 12 10770 g003
Figure 4. SPP structure.
Applsci 12 10770 g004
Figure 5. The dataset used in the experiment. (a) Public image. (b) Mobile phone camera shot. (c) Binocular camera (left eye) shot.
Applsci 12 10770 g005
Figure 6. DSPP-YOLO loss function.
Applsci 12 10770 g006
Figure 7. Error detection and missed detection in YOLOV3.
Applsci 12 10770 g007
Figure 8. DSPP-YOLO test results.
Applsci 12 10770 g008
Table 1. Anchor box size after clustering based on K-Means++.
Feature Map 13 × 13 26 × 26 52 × 52 104 × 104
Receptive fieldBigMediumSmallSmaller
Anchor box ( 199 × 279 ) ( 61 × 167 ) ( 44 × 90 ) ( 24 × 32 )
( 145 × 195 ) ( 83 × 102 ) ( 16 × 105 ) ( 18 × 16 )
( 97 × 218 ) ( 36 × 102 ) ( 26 × 55 ) ( 6 × 24 )
Table 2. The hardware configuration of the experiment in this paper.
HardwareCorrelation Configuration
Central processing unitIntel(R) Core(TM) i5-9300H CPU @ 2.40GHz
GPUNVIDIA GTX 1080TI
GPU acceleration libraryCUDA10.1, CuDNN7.6.5
Operating systemUbuntu16.04
Deep Learning FrameworkDarknet53
Table 3. Comparison of detection indexes between YOLOV3 and DSPP-YOLO.
AP (Average Precision)mAP (Mean Average Precision)Detection Time (136 Images)
YOLOdoor 70.2 % 45.85 % 7.7032 s
window 21.5 %
YOLOV2door 72.6 % 48 % 7.7124 s
window 23.4 %
YOLOV3-Tinydoor 73.9 % 50.7 % 5.34 s
window27.5%
YOLO-144884door 71.3 % 48.35 % 8.0031 s
window 25.4 %
YOLOV3door 74.1 % 51.7 % 7.7007 s
window 29.3 %
DSPP-YOLOdoor 77.4 % 57.75 % 7.906 s
window 38.1 %
Publisher’s Note: MDPI stays neutral with regard to jurisdictional claims in published maps and institutional affiliations.

