

Game Development Topics: A Tag-Based Investigation on Game Development Stack Exchange

Abstract
1. Introduction
2. Background
2.1. Game Development Stack Exchange
3. Related Work
3.1. Research on Video Game Development
3.2. Research Studies Based on Stack Overflow
4. Empirical Study Setup
4.1. Study Overview
4.2. Research Questions and Metrics
- Its failure rate: the percentage of questions that do not have an accepted answer;
- Its median (success) wait time: in other words, the median time for satisfactory answers (in these cases, where the question received an answer that its asker accepted).
4.3. Data Collection and Processing
5. Results of RQ.1: Community Attention per Topic
5.1. Tech Tags: Technology/Library Choices
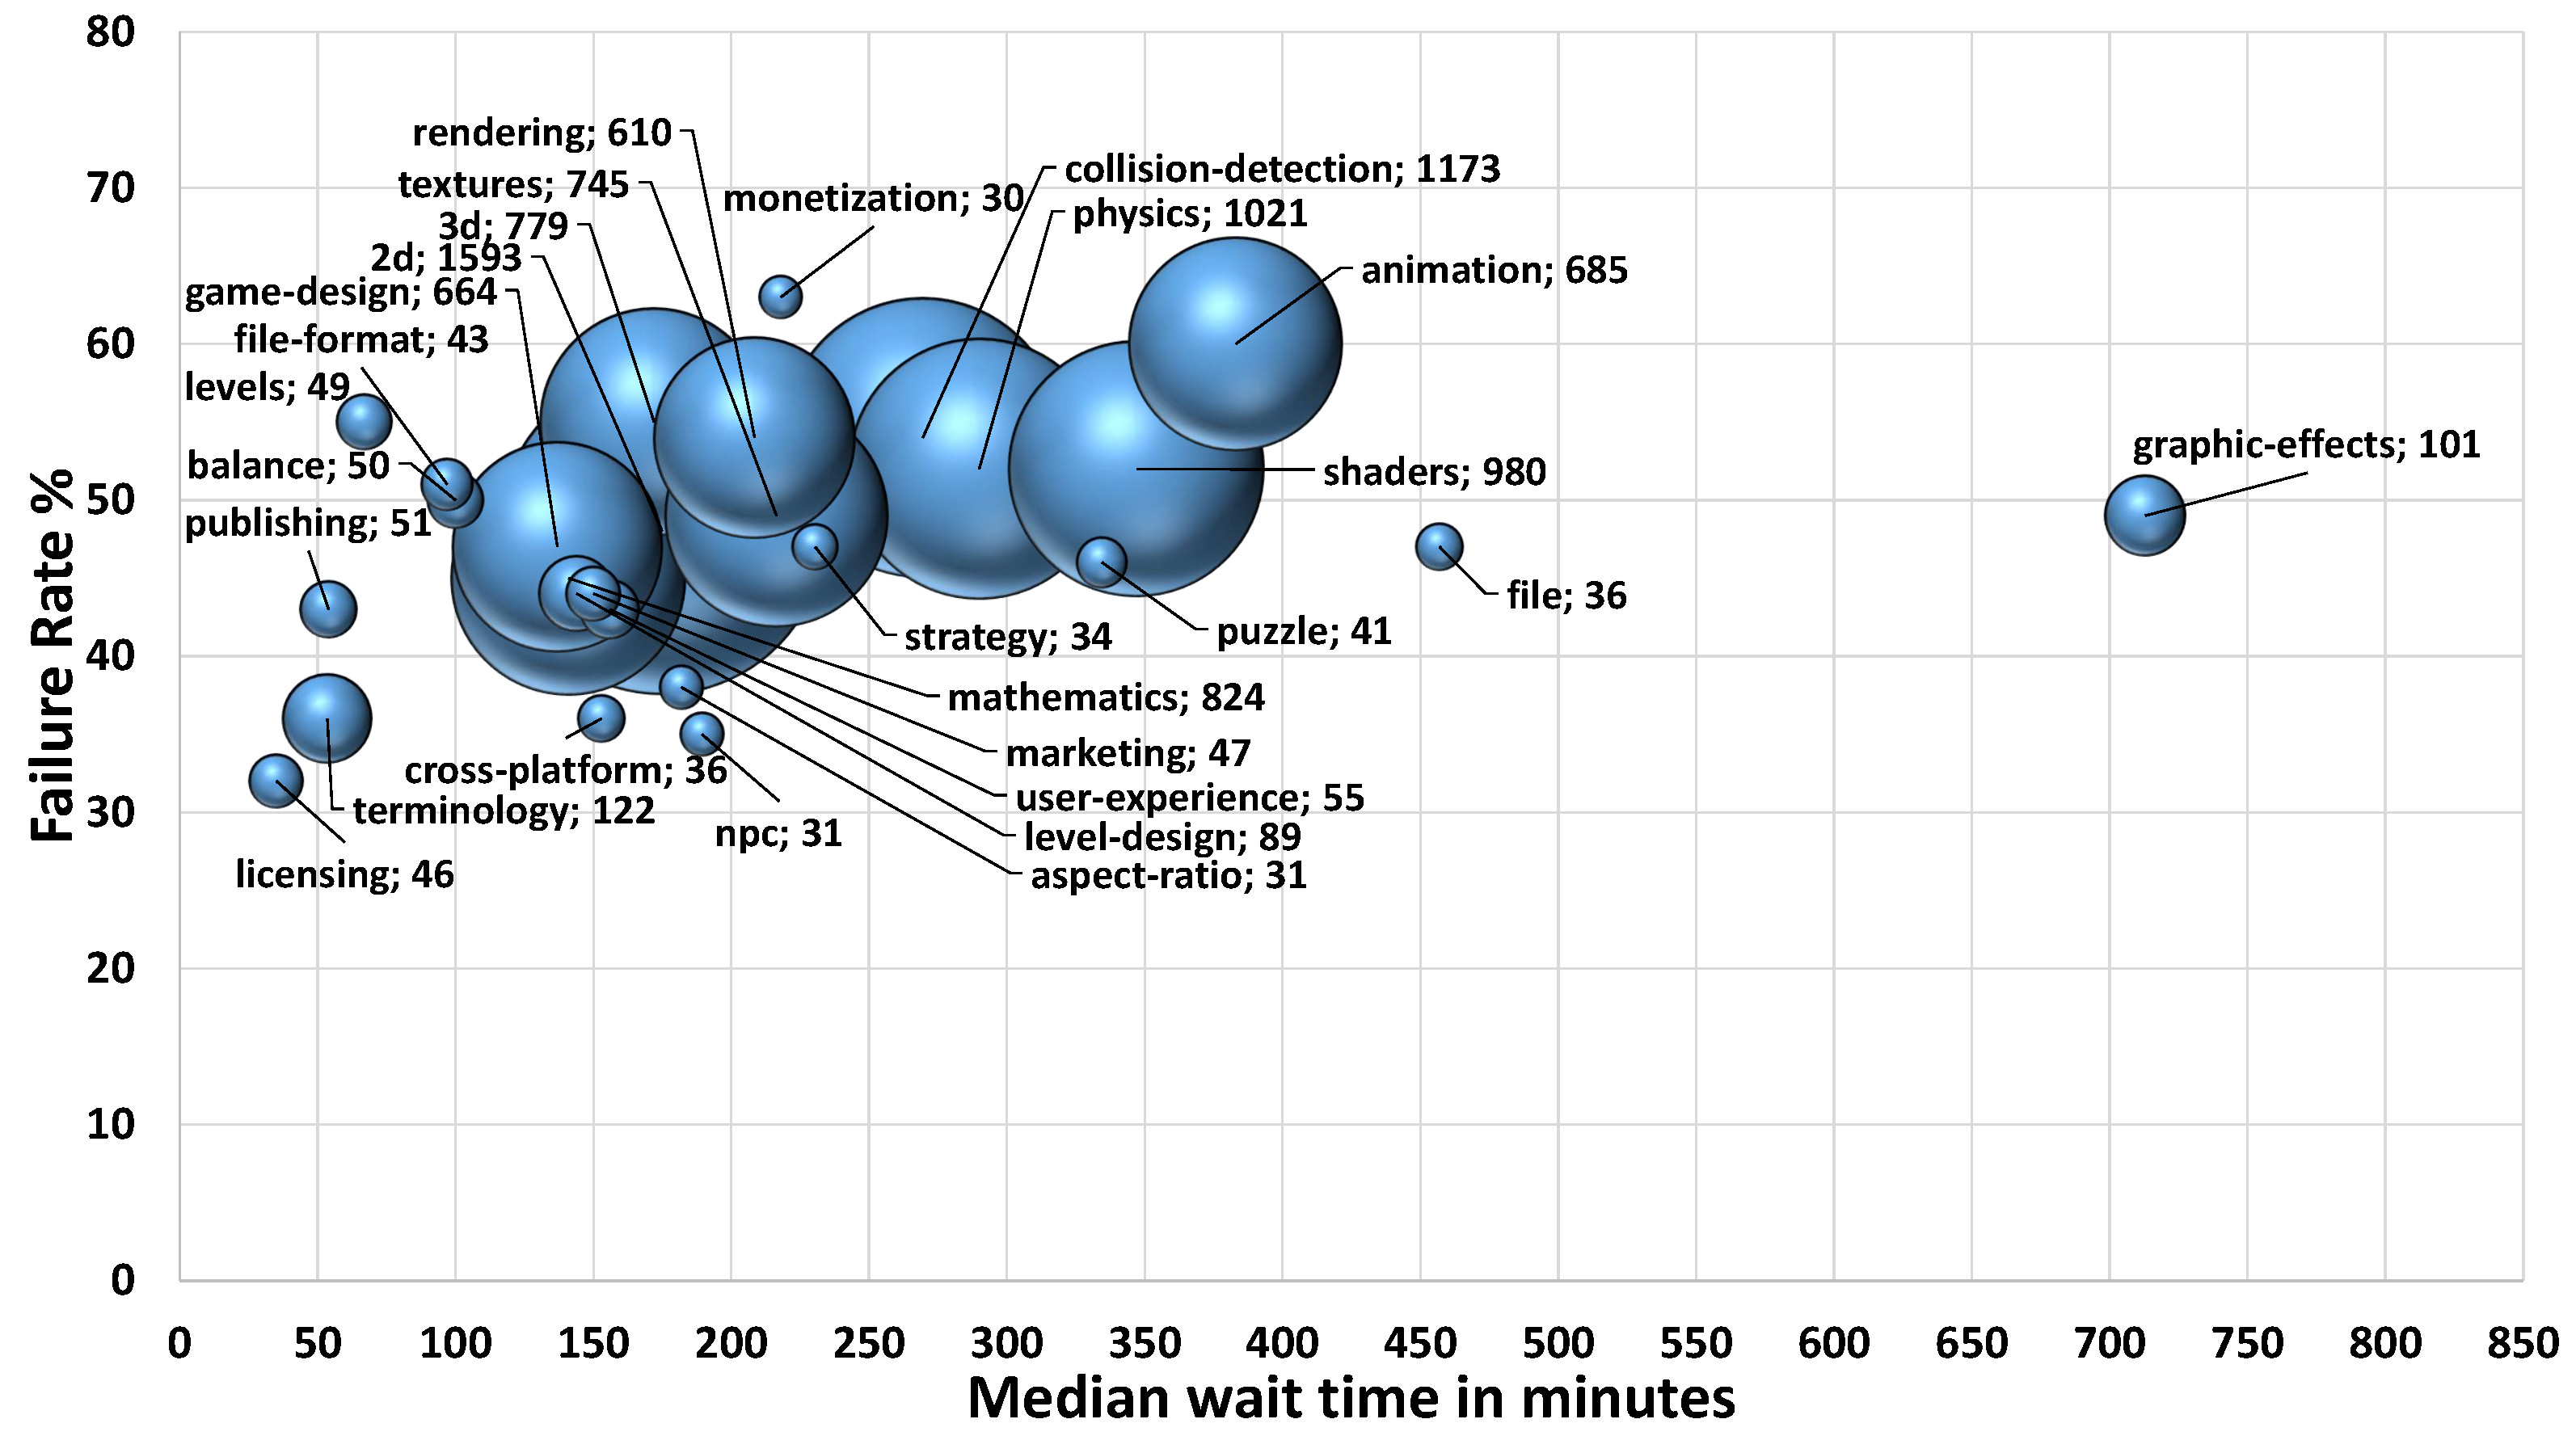
5.2. Concept Tags: Game Development Aspects
- Topics that receive the most attention include technologies such as Unity, C#, Android, and Vulkan and concepts such as 2D, 3D, collision detection, animation, game design, and terminology.
- The average number of questions per technology is higher than that of concepts, but questions attached to concepts are twice more upvoted or marked as favourite.
- Most game development questions are not about gaming elements per se; in fact, only about one question out of eight is tagged with a concept that refers to some gaming aspect, with game genres appearing the most.
6. Results of RQ.2: Community Support per Topic
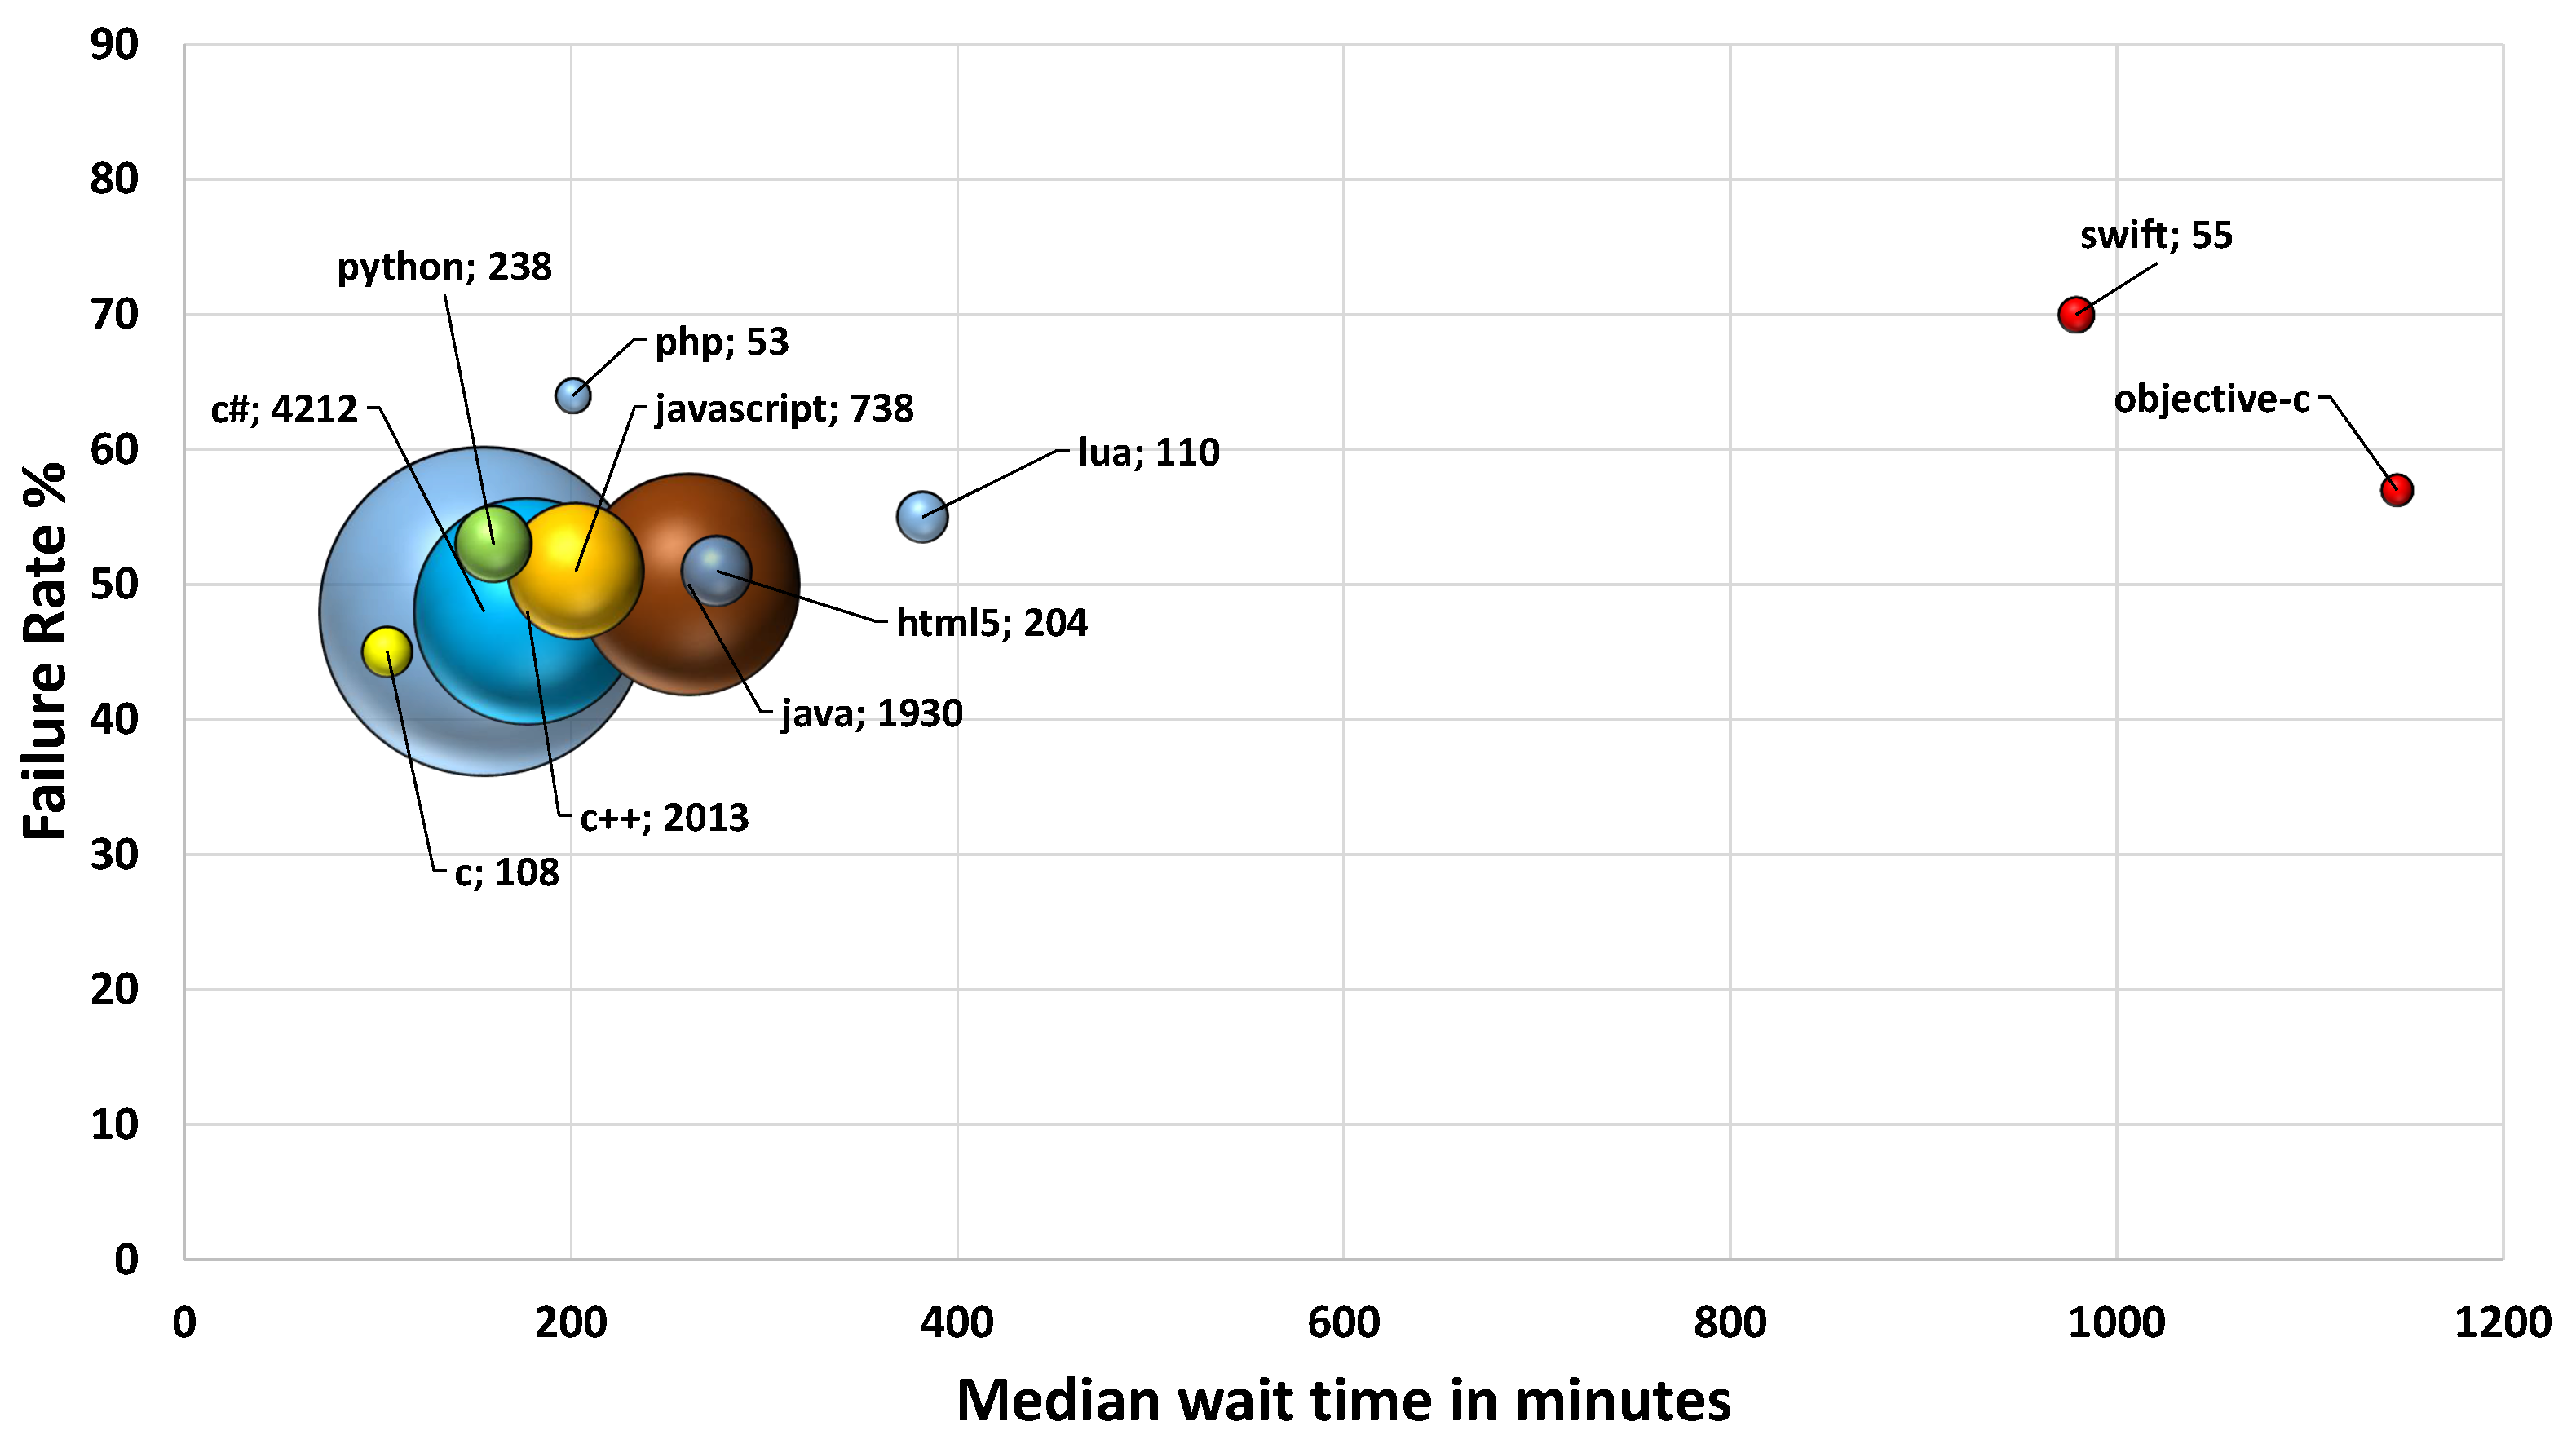
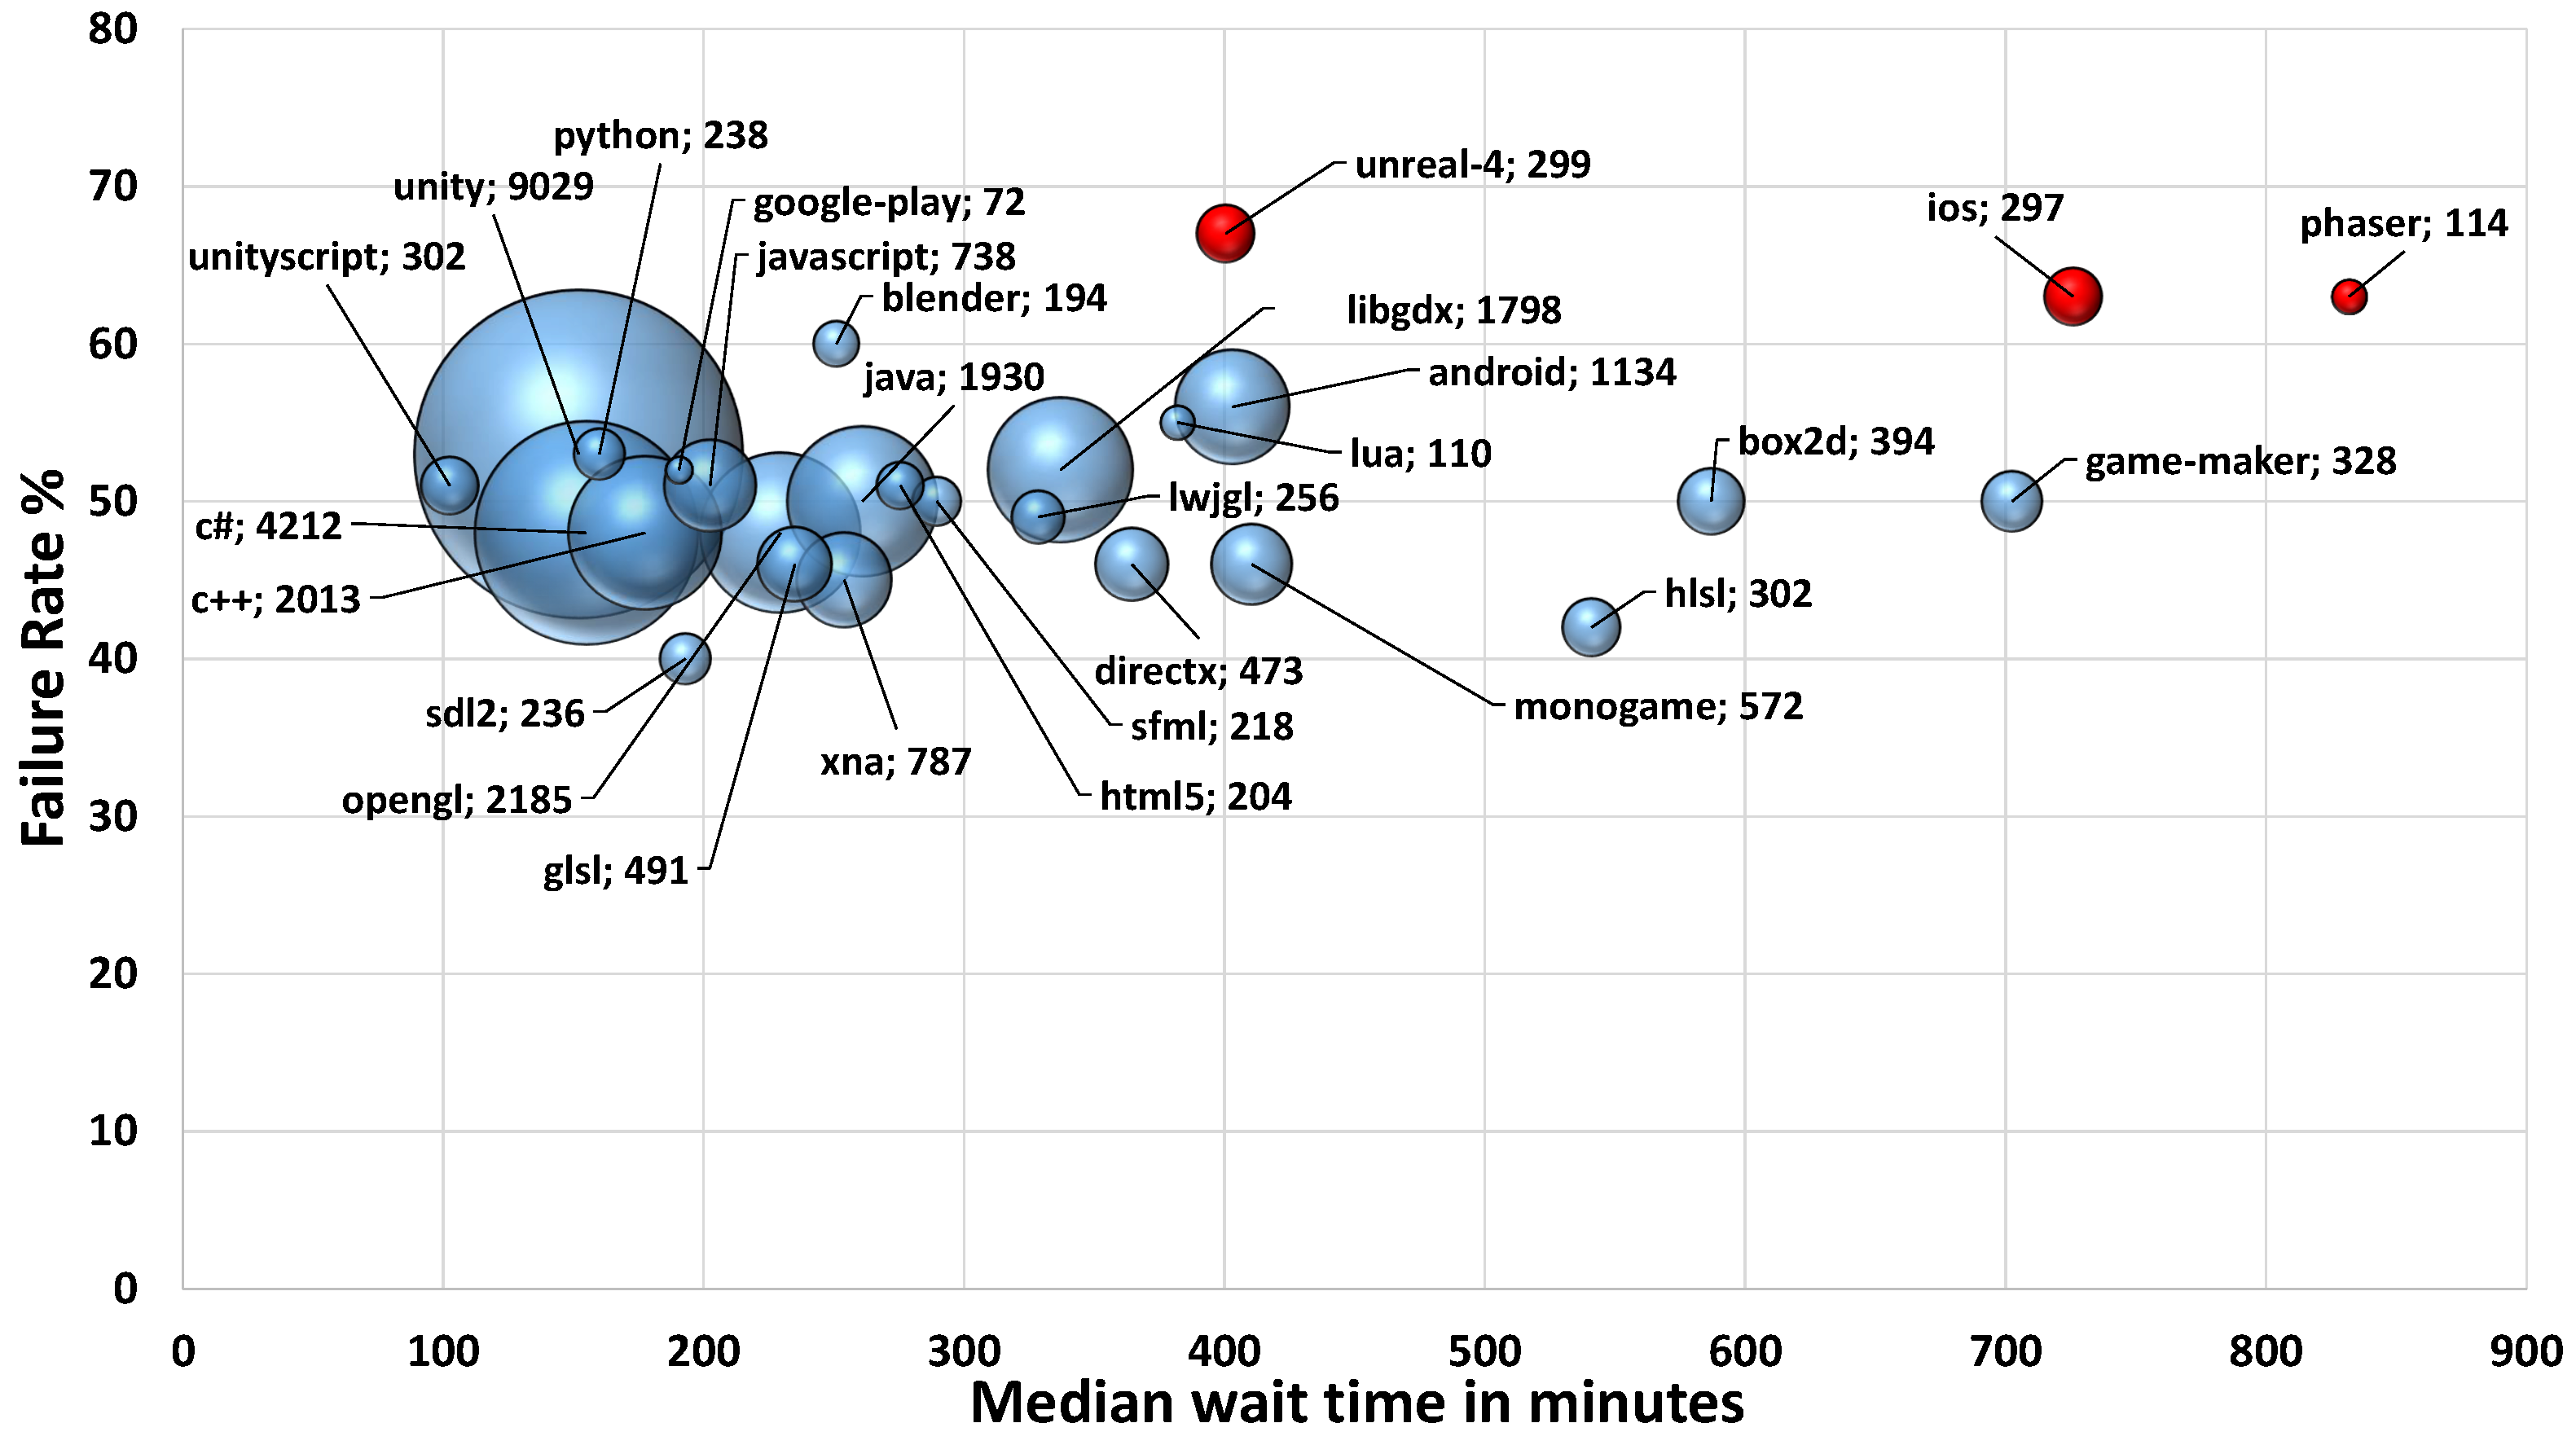
6.1. Community Support for Tech Tags
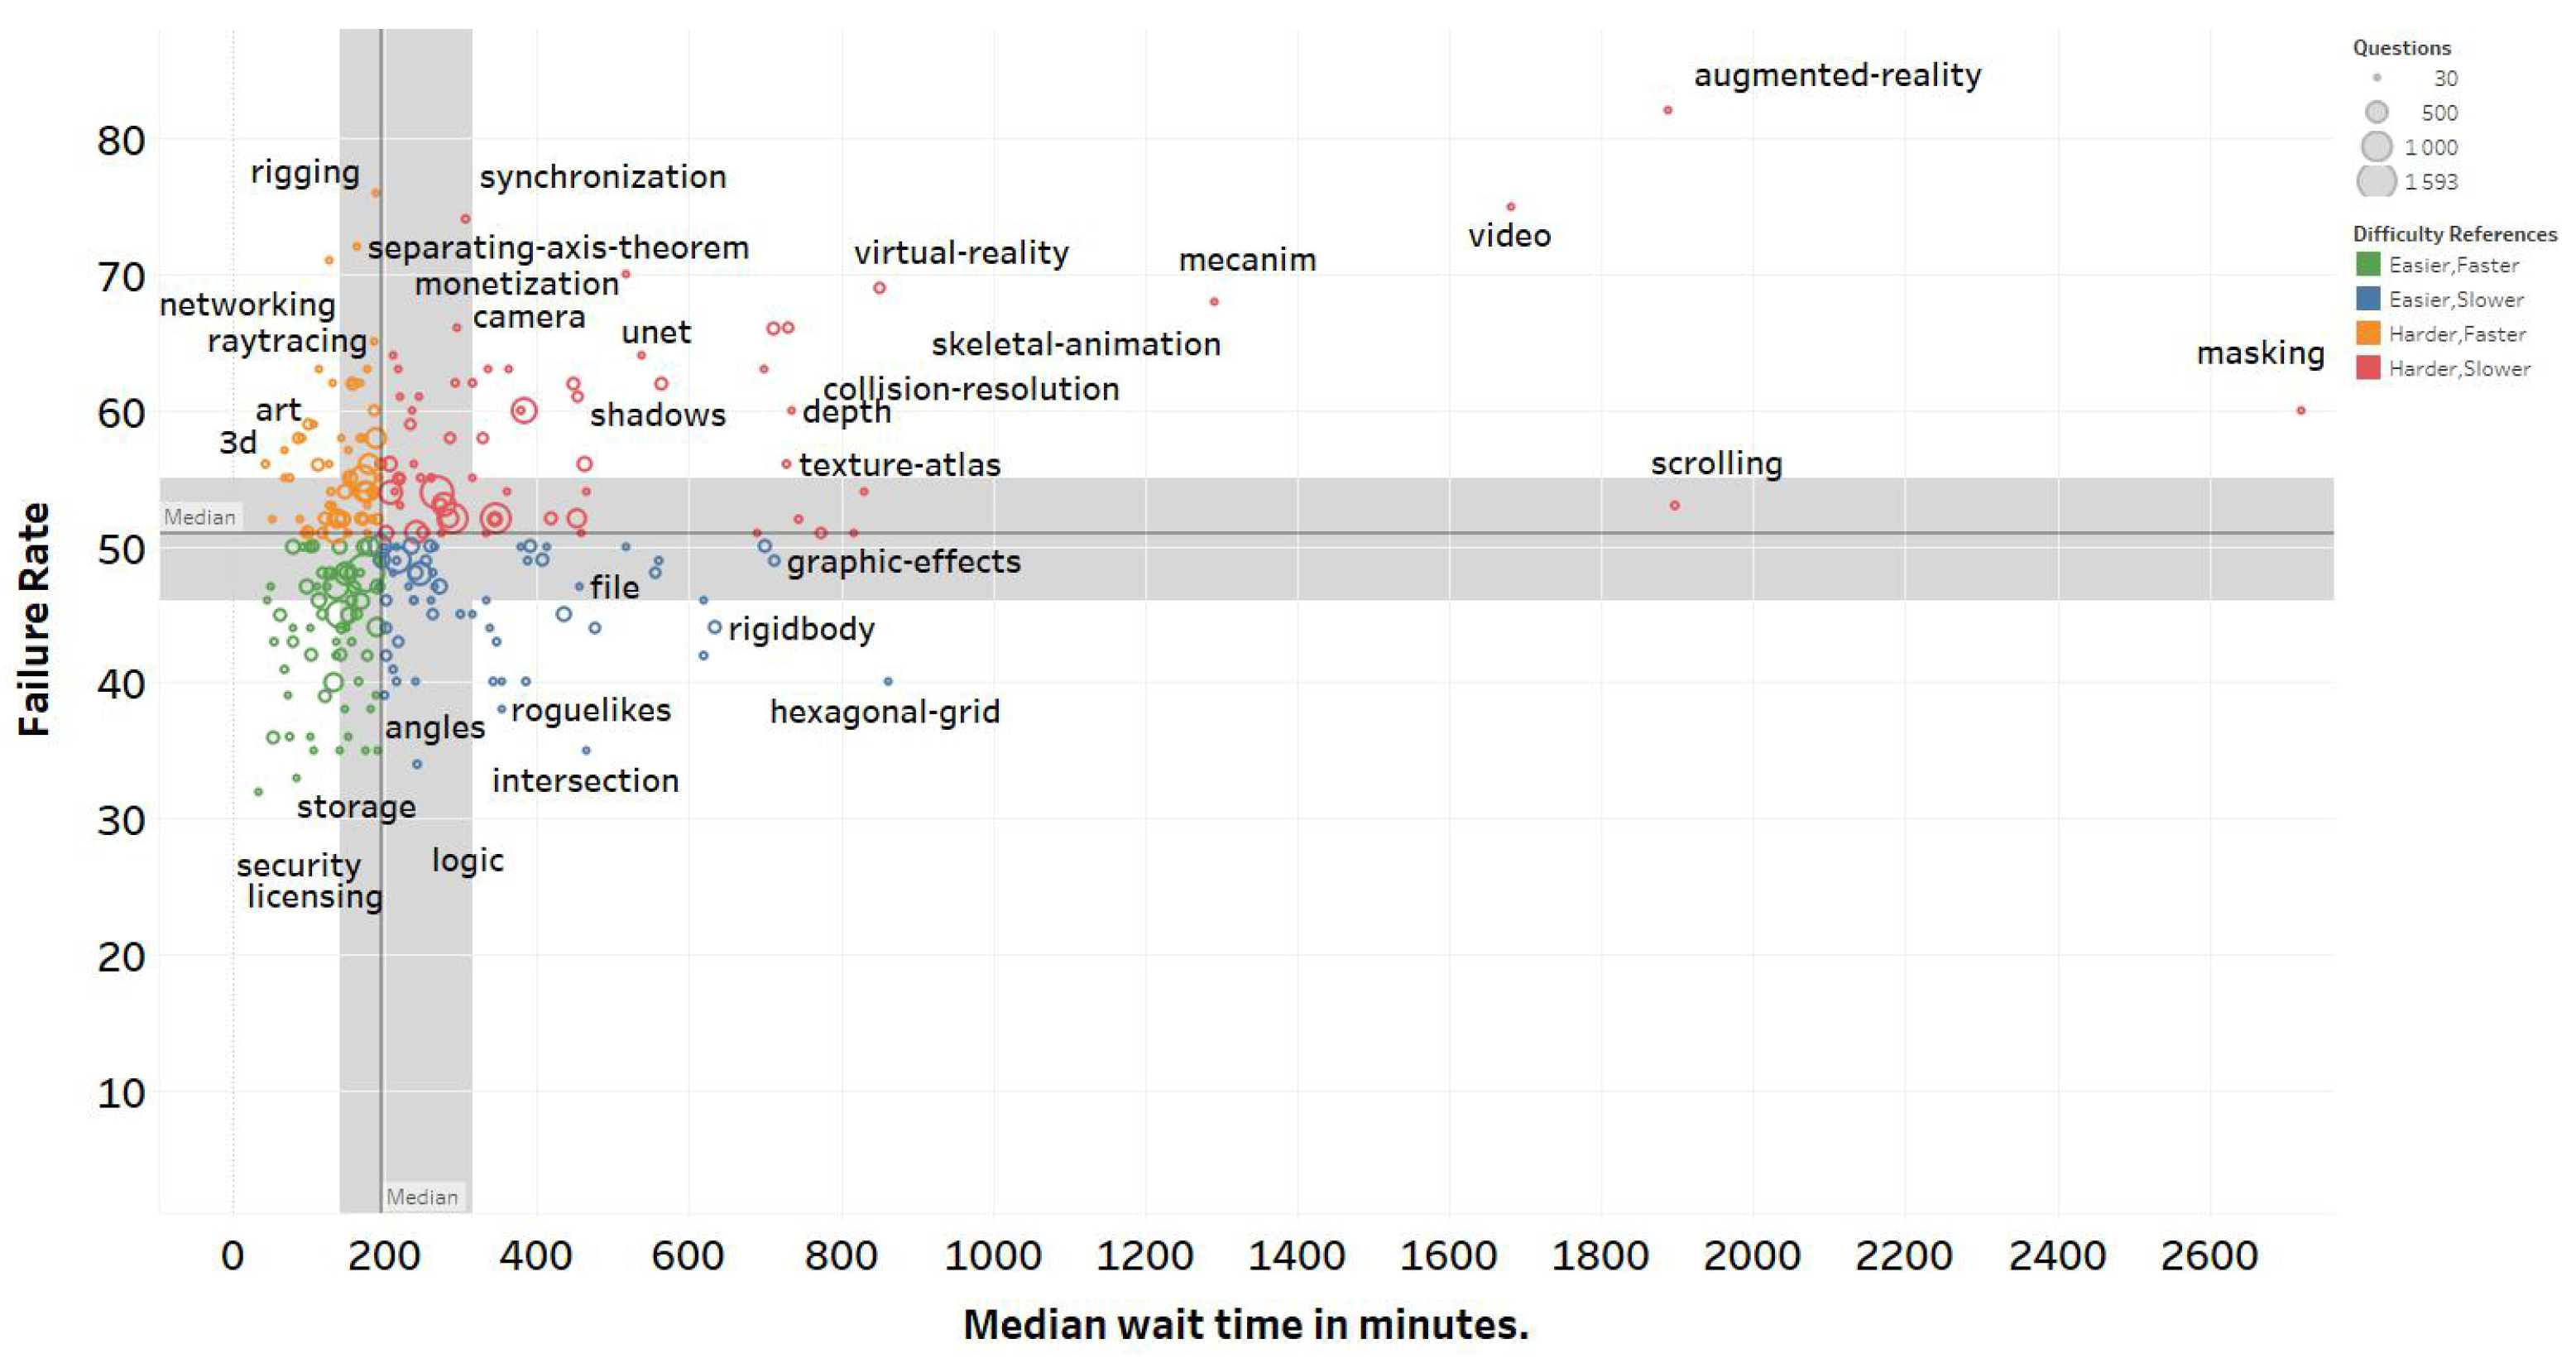
6.2. Community Support for Concept Tags
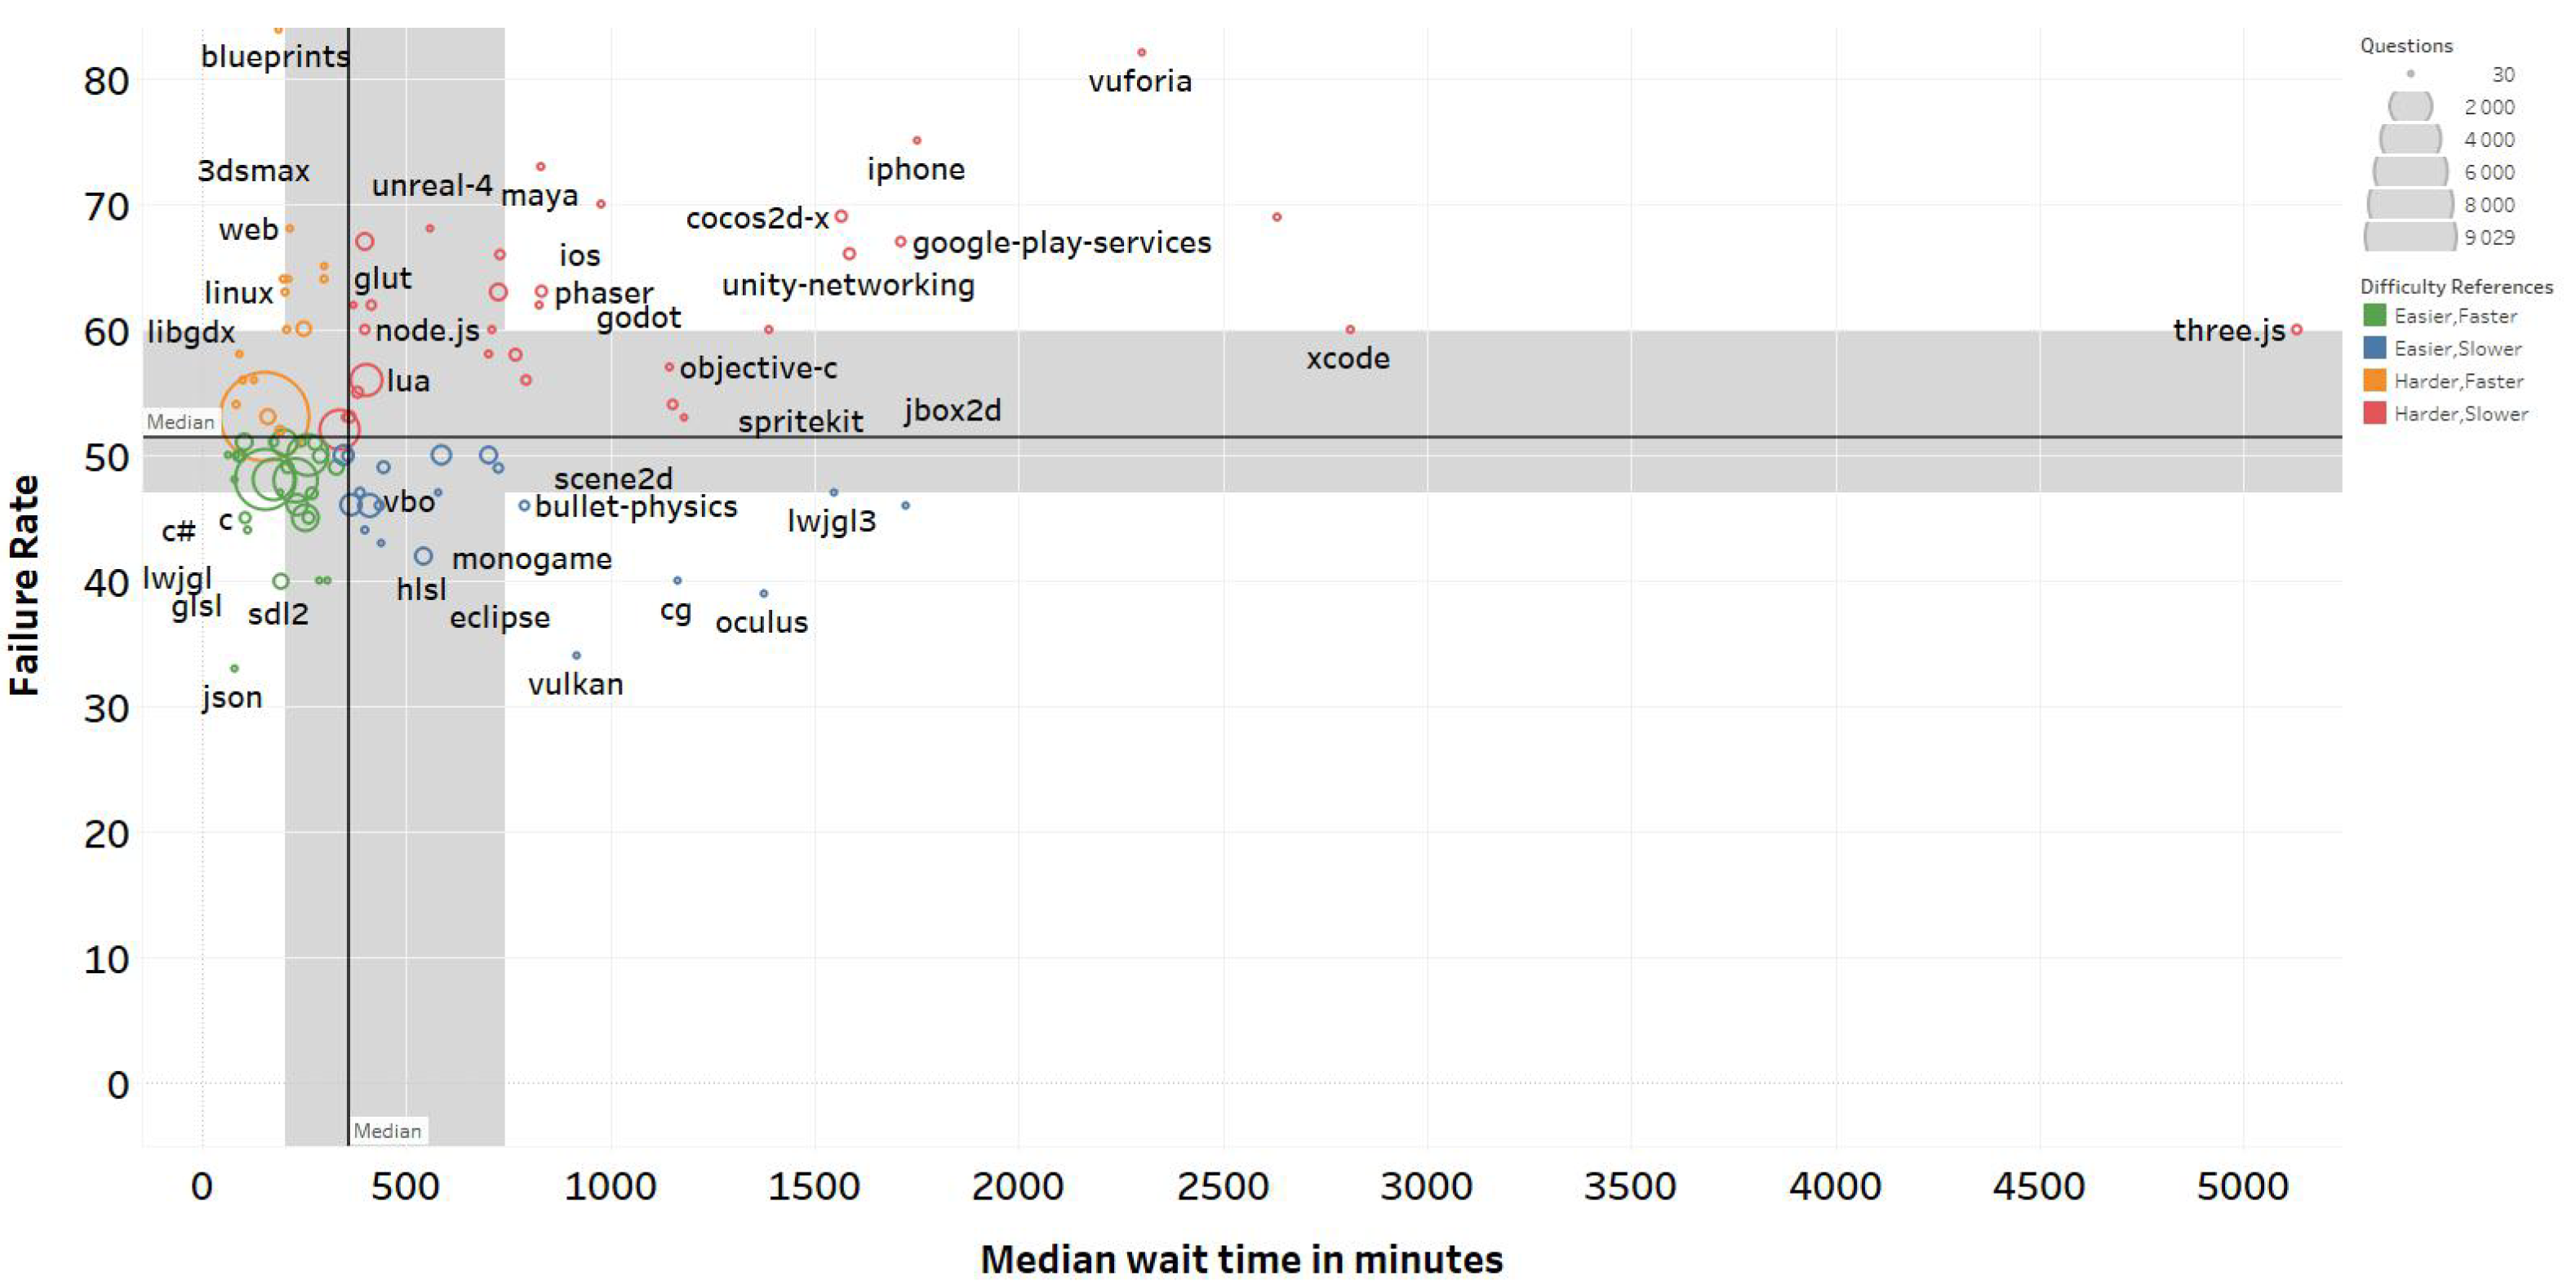
- For both concept and tech tags, popular tags generally have a failure rate around 50% (±10%) and a median wait time between 30 min and 6 h (for concept tags) and 2 and 7 h (for tech tags).
- We uncovered some clear differences of support between technologies occupying the same space: for instance, Unreal-4 has a much lower support than its rival Unity, while Android-related tags are generally better supported than iOS-related tags.
- For concept tags, we found that 3D questions have, unsurprisingly, less support than 2D, whereas purely mathematical concepts generally have good support; additionally, relatively new paradigms such as virtual reality and augmented reality seem to be trailing in community support.
7. Results of RQ.3
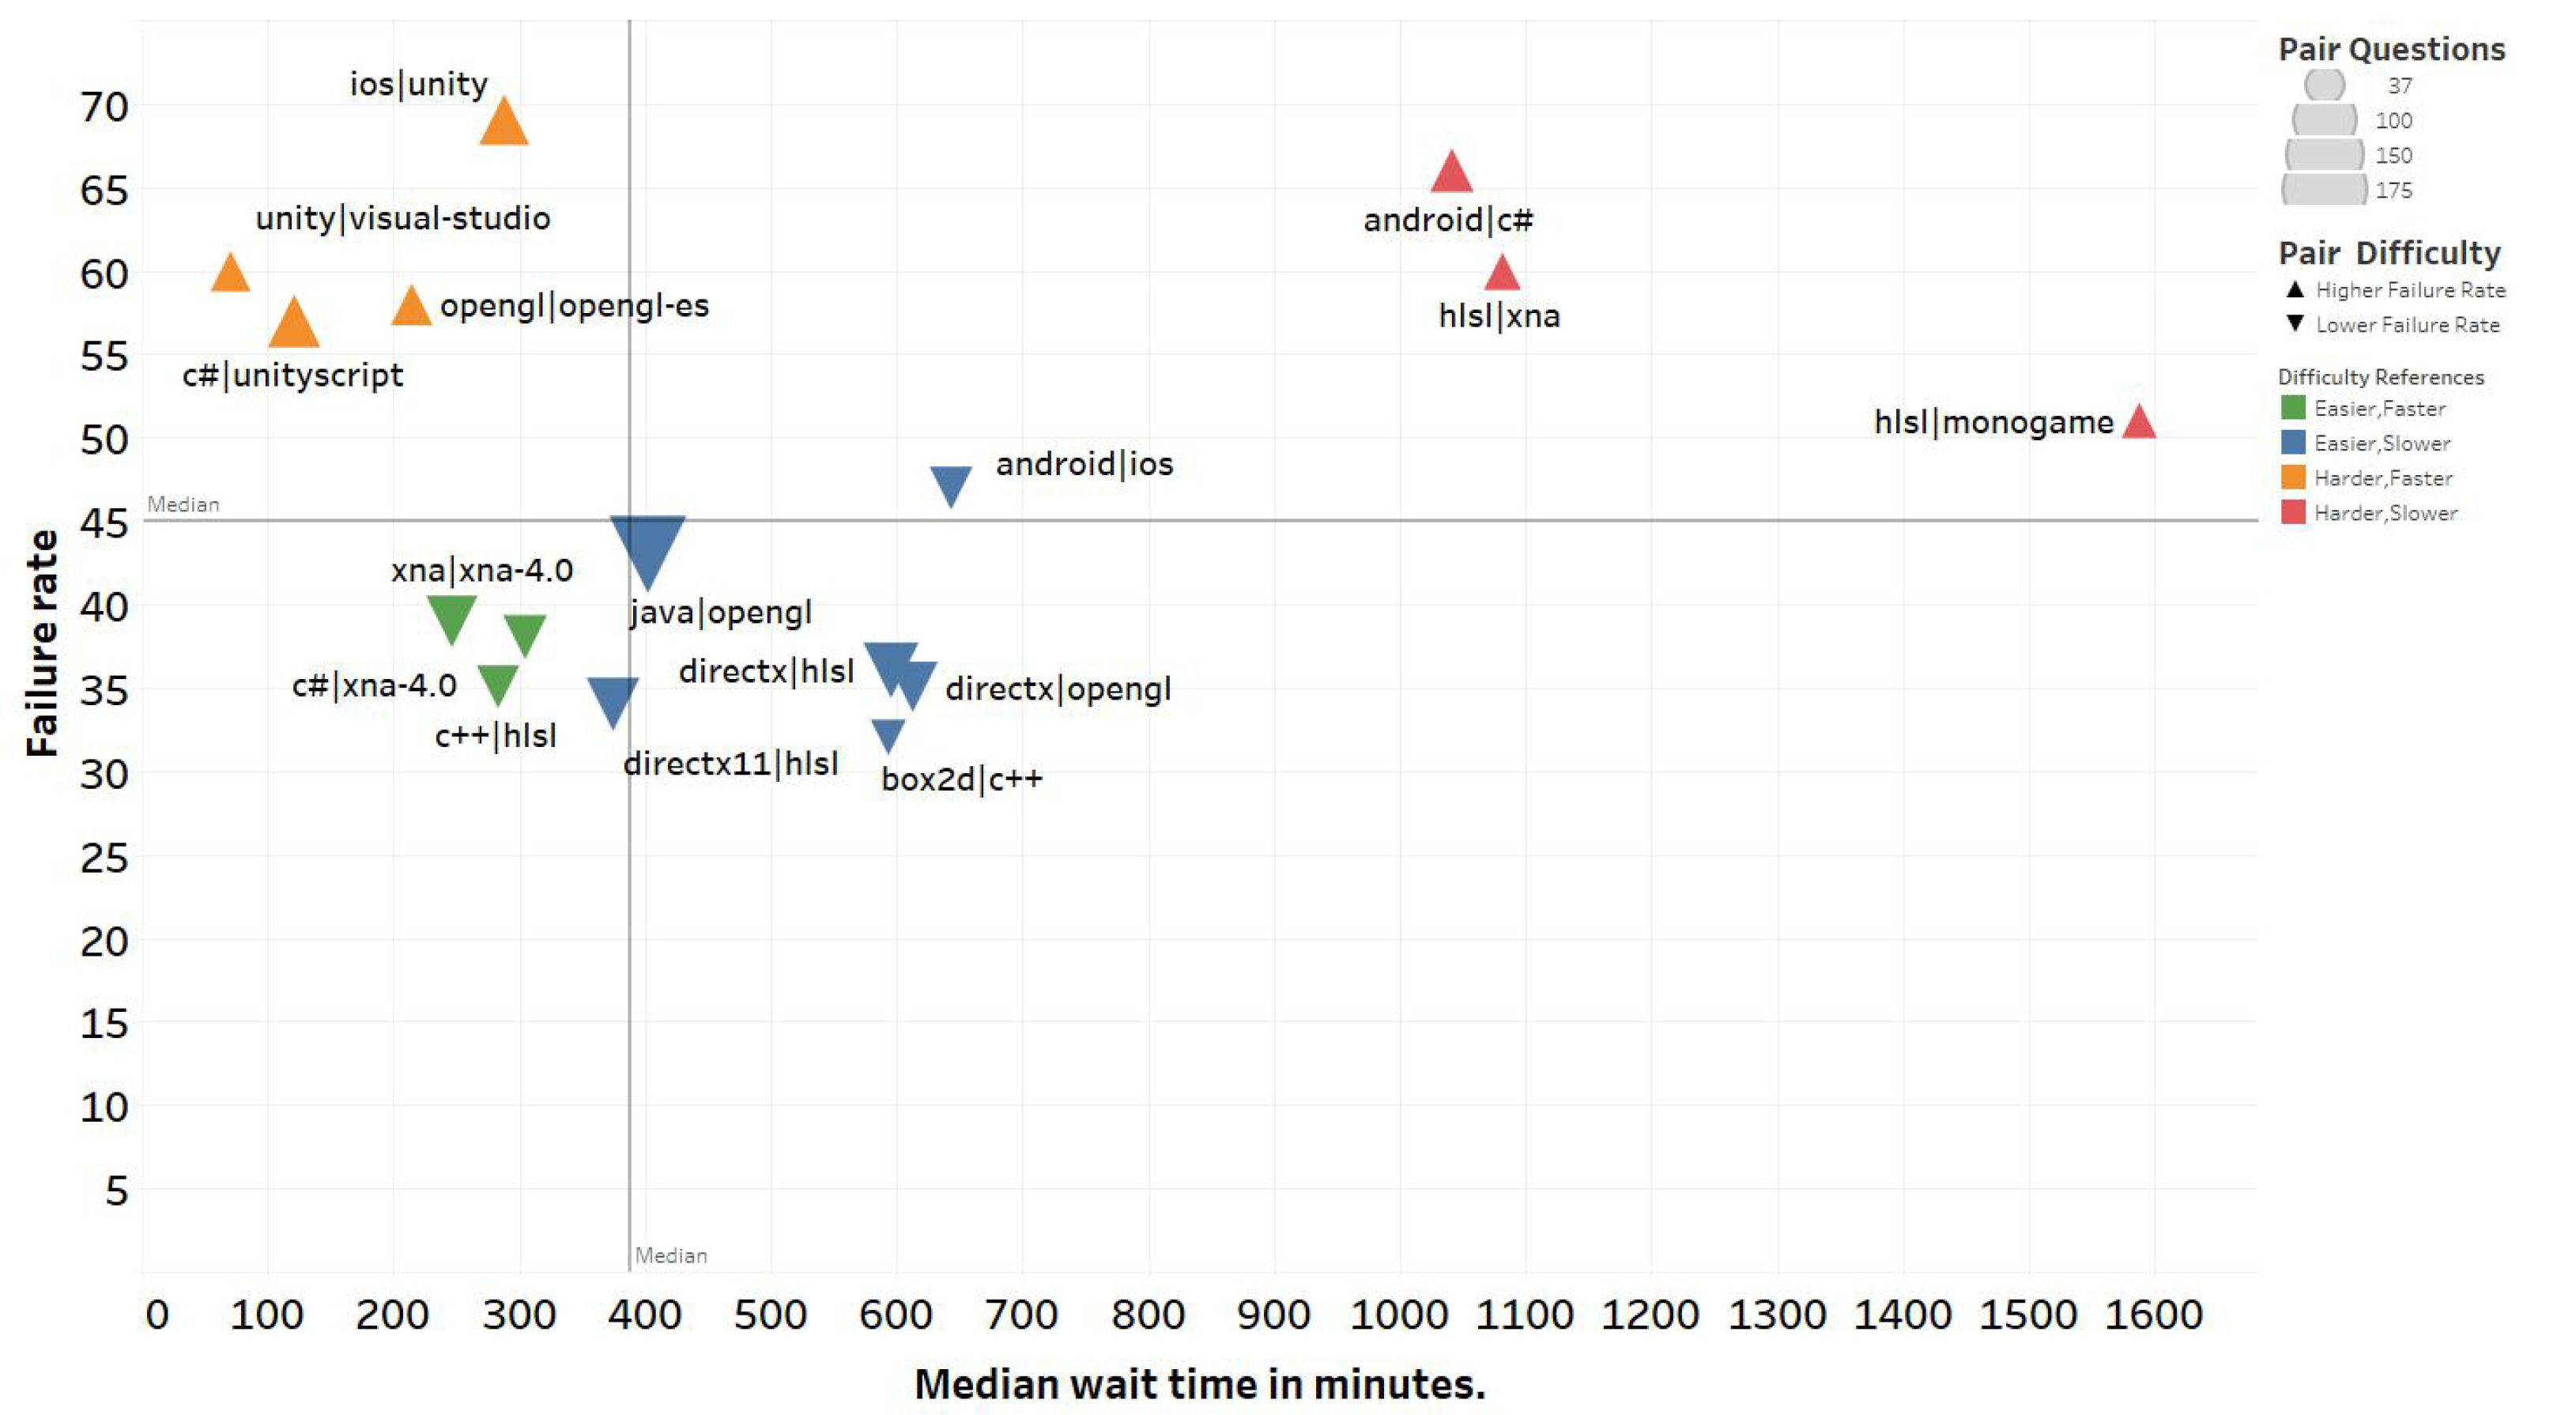
7.1. Tech–Tech Pairs: Integrating Two Technologies
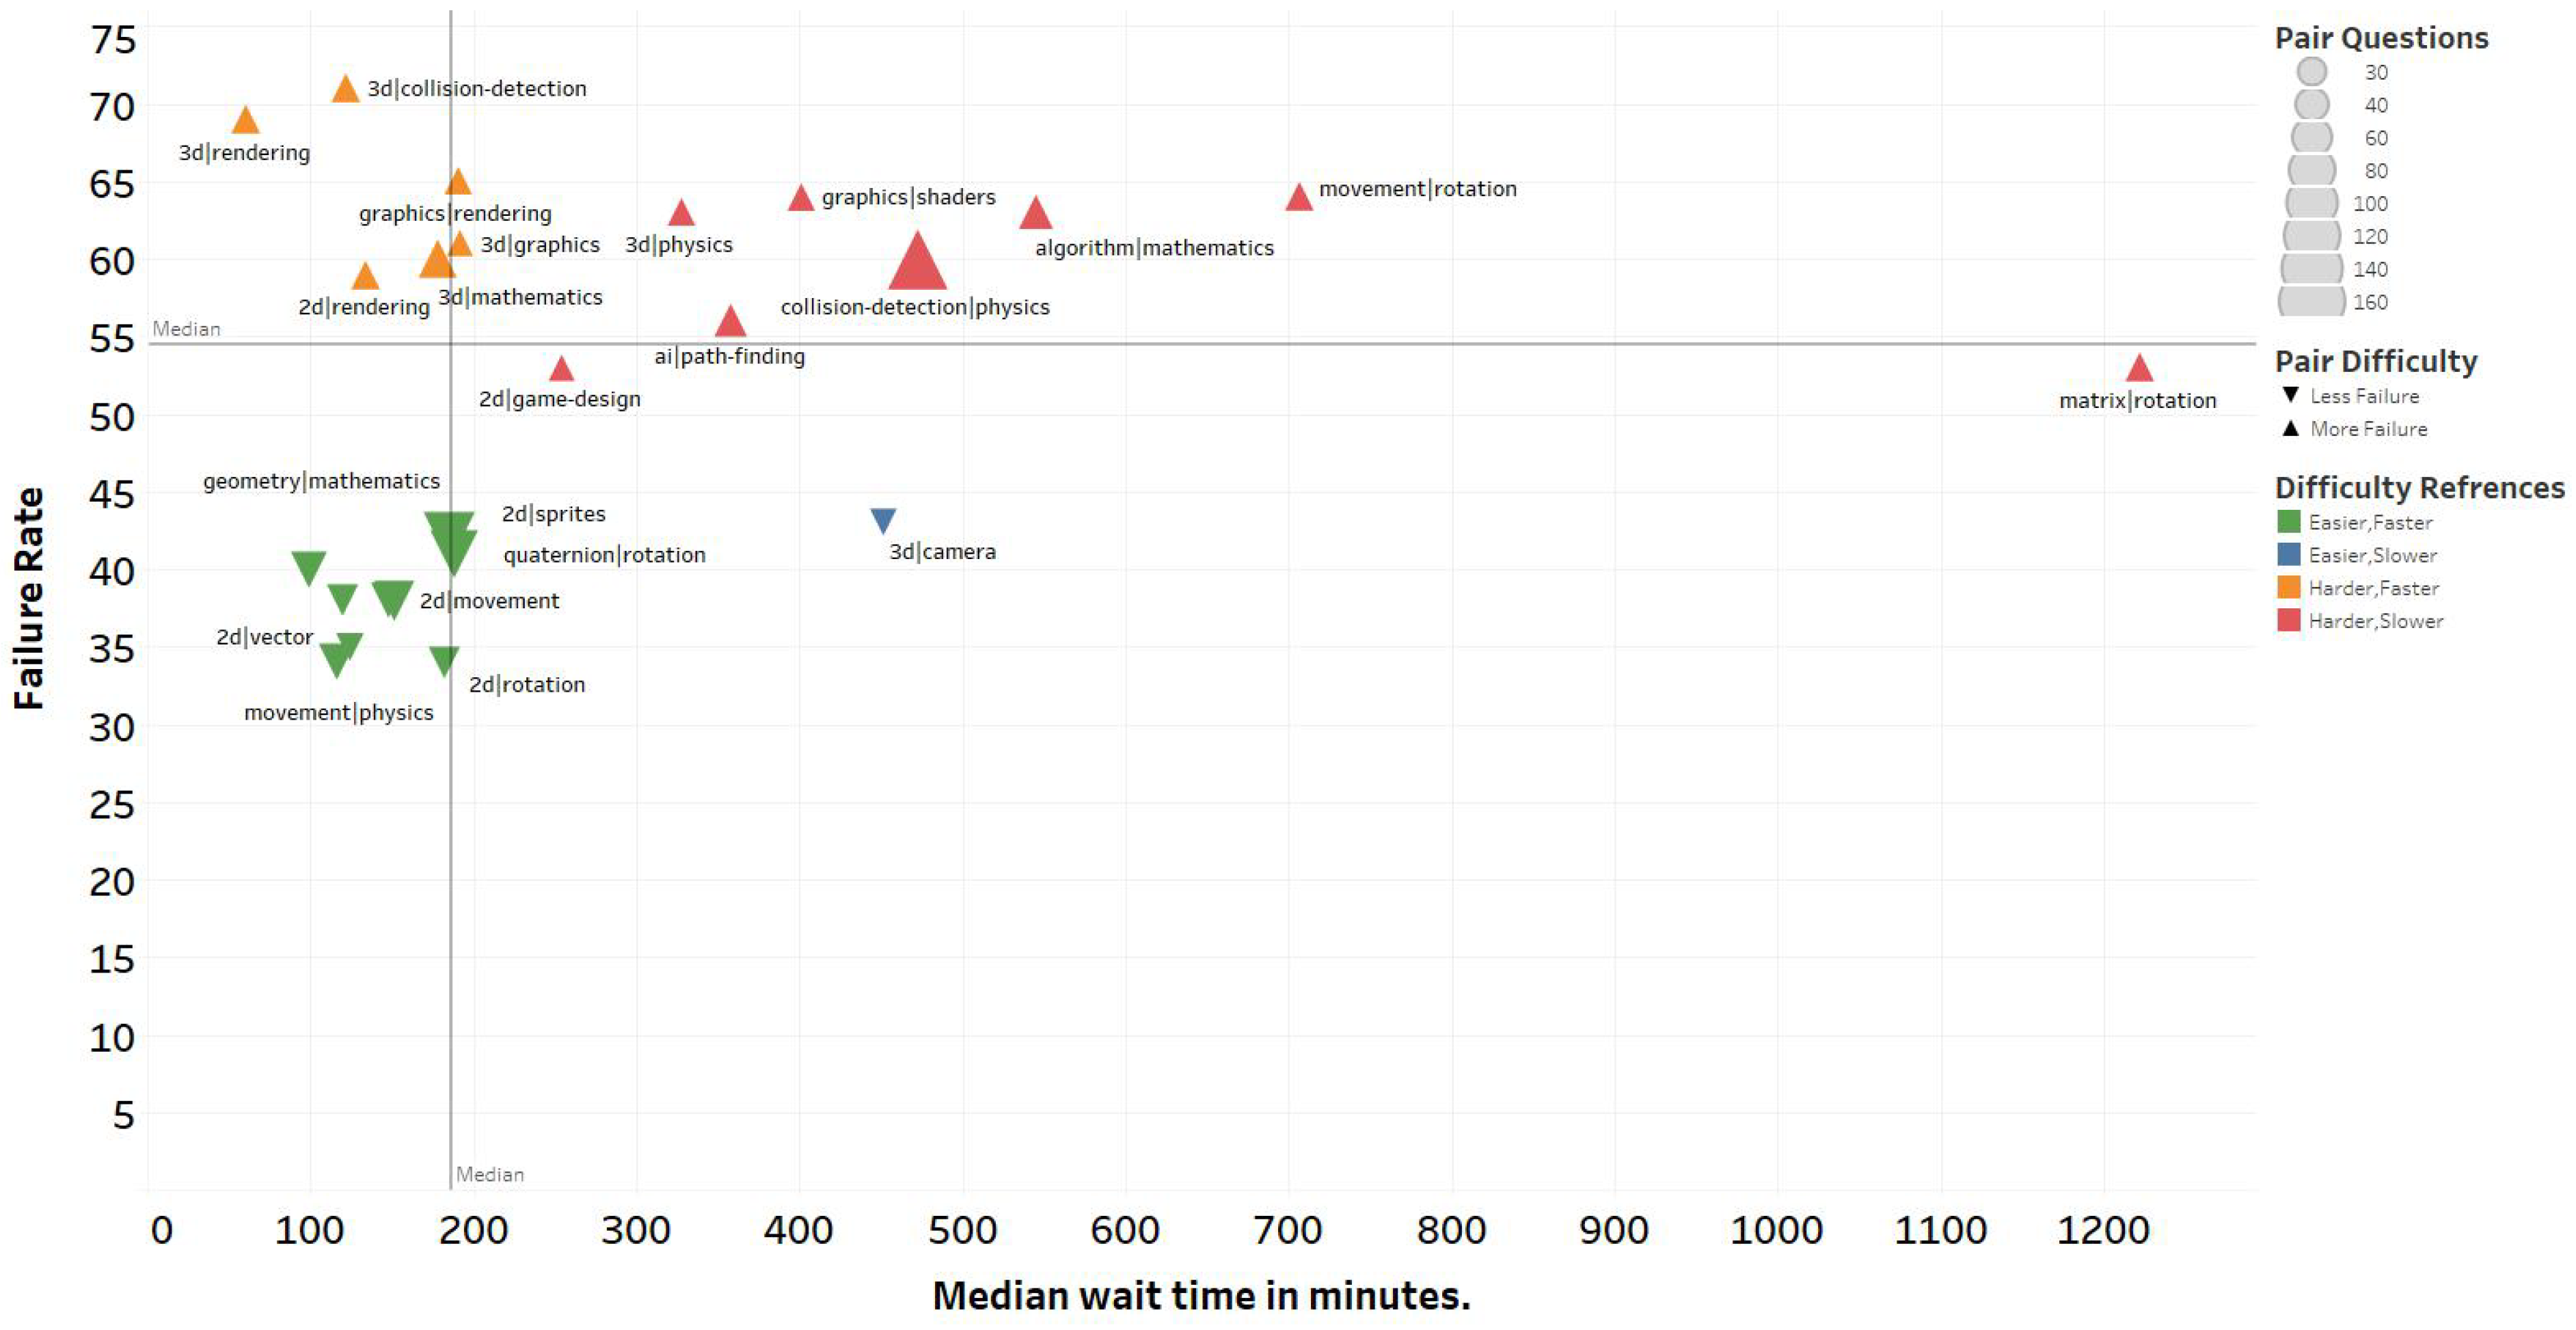
7.2. Concept–Concept Pairs: Handling Conjointly Two Concepts
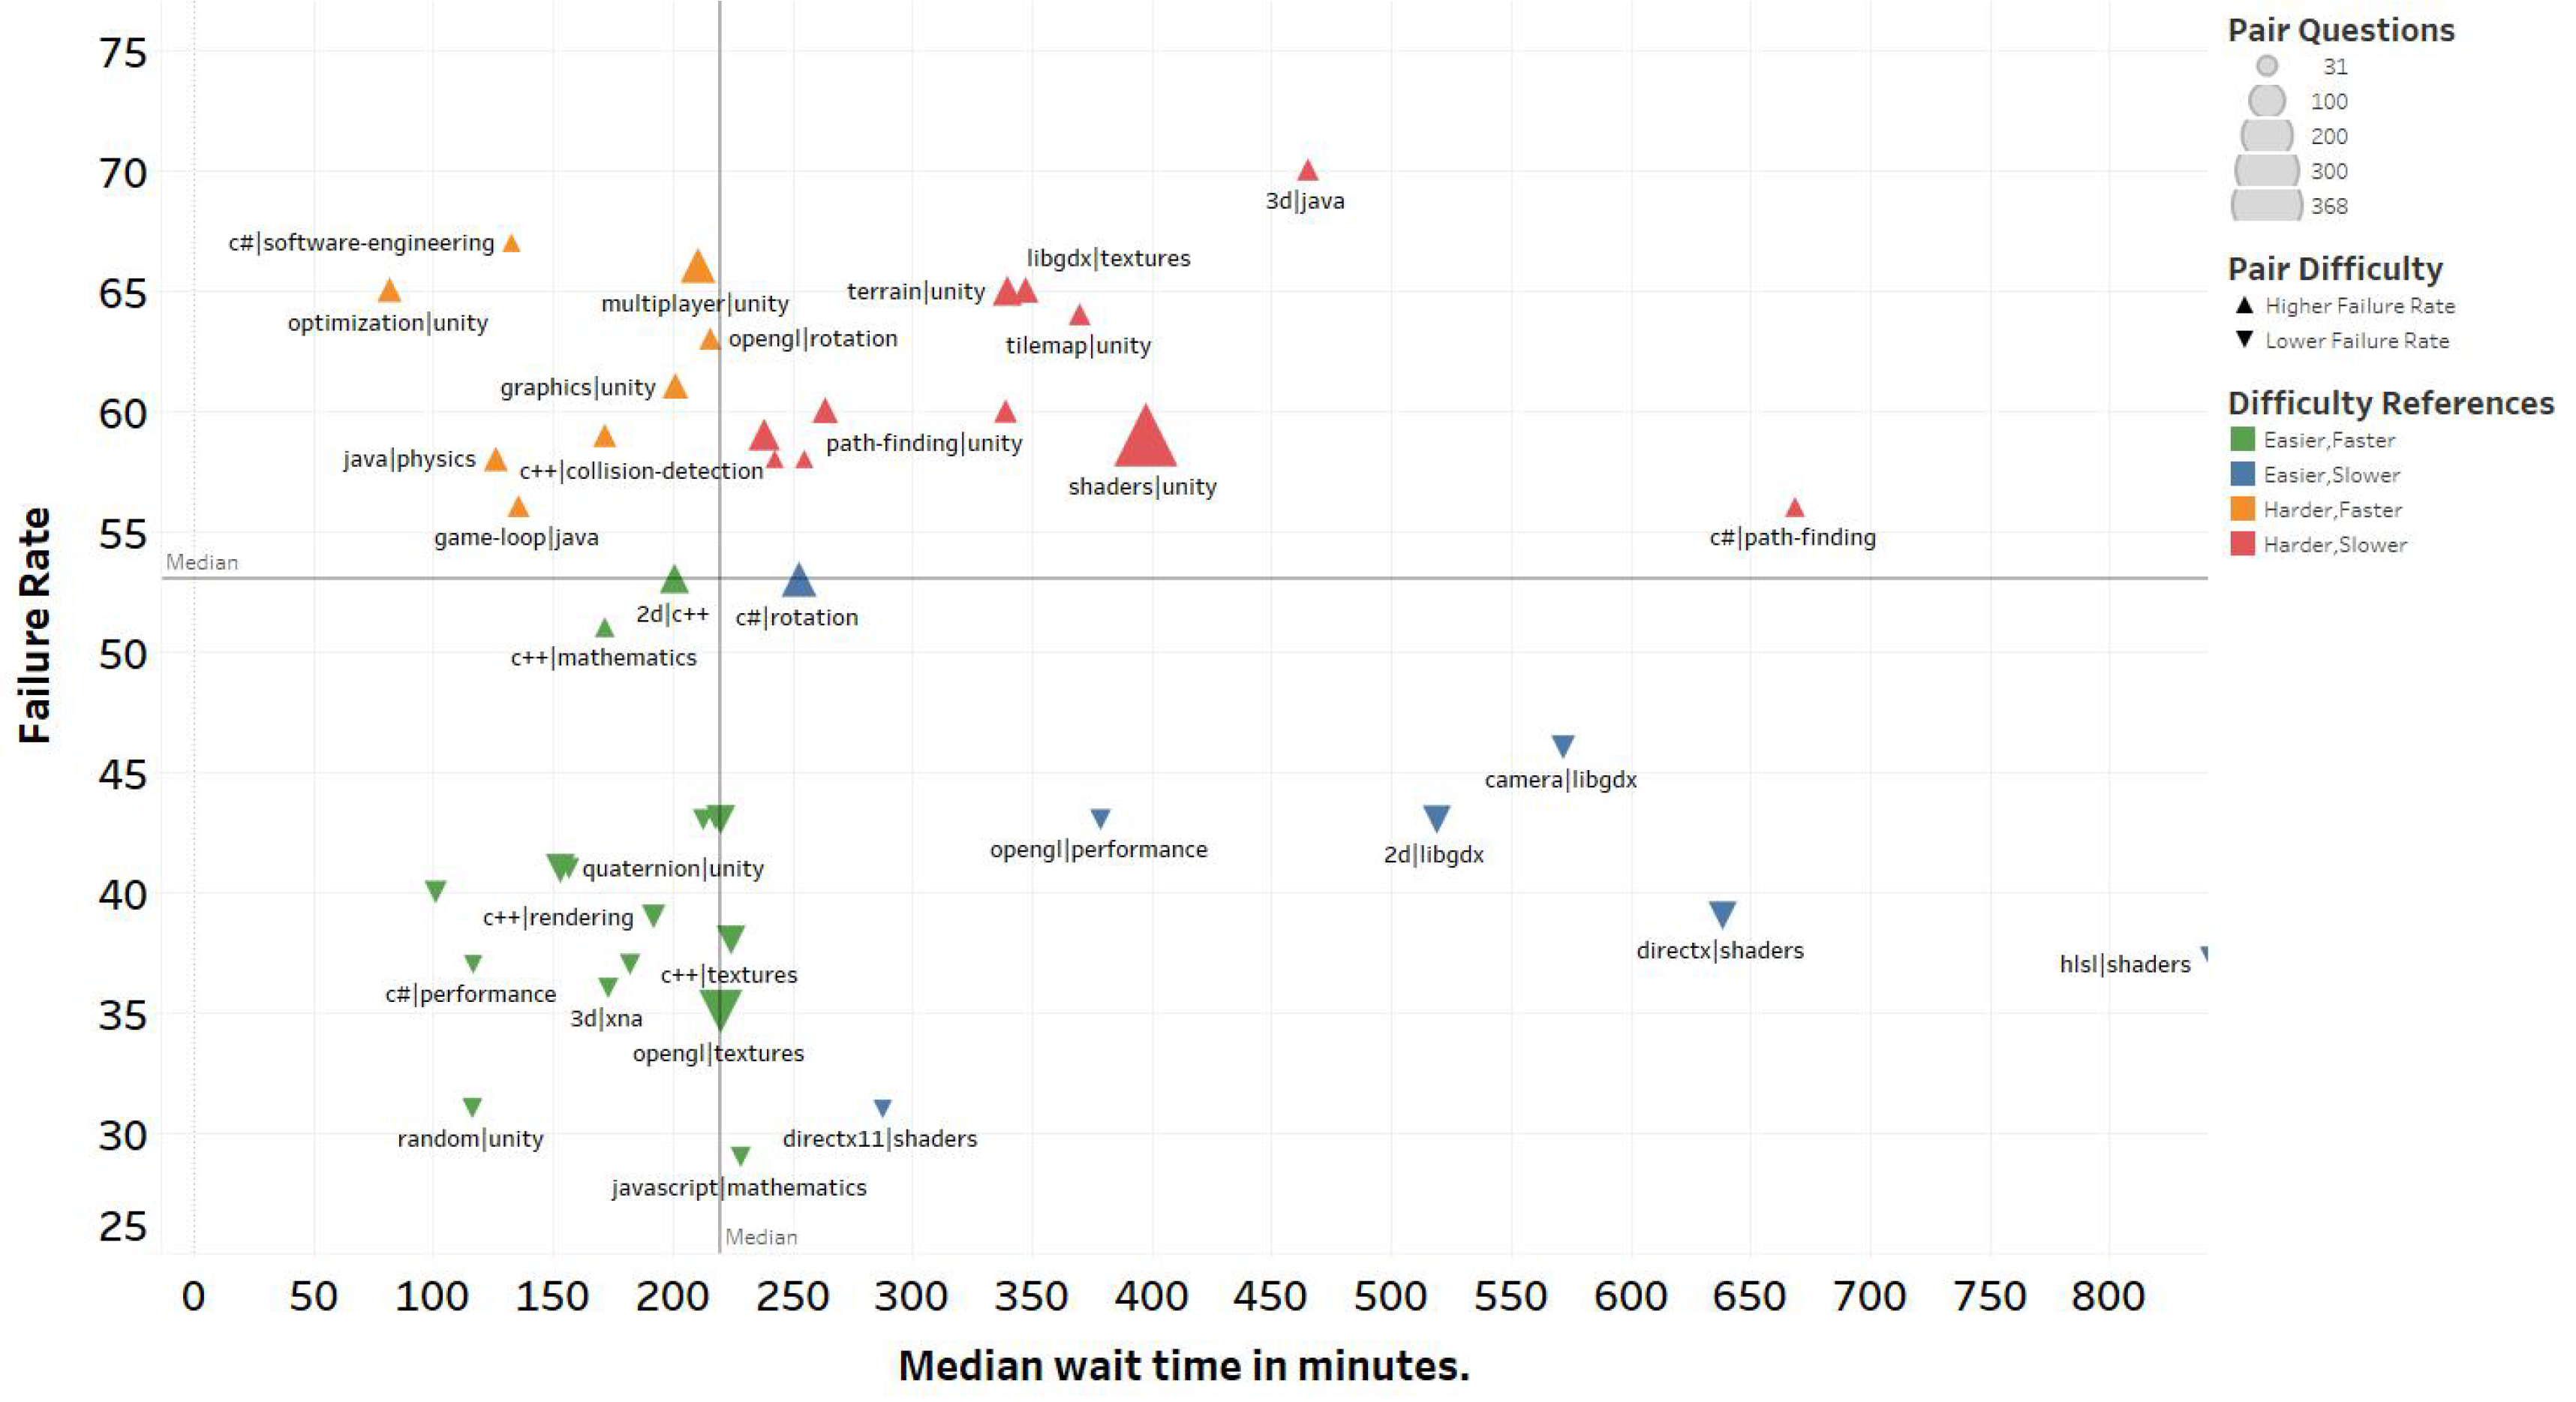
7.3. Tech–Concept Pairs: Handling a Concept with a Given Technology
- We uncovered technologies that, from a community support standpoint, seem to work well together (e.g., C++ and Box2D, HLSL and C++) and some others that receive less support when present together (e.g., Android and C#, HLSL and XNA).
- We found that, from a community support standpoint, some game development concepts mesh well (e.g., 2D and movement, 2D and rotation) and some others not at all (e.g., movement and rotation, 3D and collision detection).
- Finally, we uncover, from a community support standpoint, hints about which technologies may work better (e.g., XNA for 3D, OpenGL for textures) or worse (e.g., Java for 3D, libGDX for textures) when used for a particular concept.
8. Discussion
8.1. RQ1 Discussion
8.2. RQ2 Discussion
- What are “affordances” in game design?
- What is an optimum failure rate that will keep people coming back to my game?
- How to avoid players getting lost in and/or bored by the meta game?
- Why do some games persistently have mostly one viable strategy, while others can have many?
- Pygame for python 3.5?
- How to detect that user has touched UI canvas in Unity 4.6?
- How can i export Unity games to Android?
- How do I have a camera follow my object in Unity?
8.3. RQ3 Discussion
8.4. Alternative Classification
8.5. Implications
9. Threats to Validity
10. Conclusions and Future Work
10.1. Conclusions
10.2. Future Work
Author Contributions
Funding
Data Availability Statement
Conflicts of Interest
References
- Ampatzoglou, A.; Stamelos, I. Software engineering research for computer games: A systematic review. Inf. Softw. Technol. 2010, 52, 888–901. [Google Scholar] [CrossRef]
- Aleem, S.; Capretz, L.F.; Ahmed, F. Game development software engineering process life cycle: A systematic review. J. Softw. Eng. Res. Dev. 2016, 4, 1–30. [Google Scholar] [CrossRef]
- Lewis, C.; Whitehead, J.; Wardrip-Fruin, N. What went wrong: A taxonomy of video game bugs. In Proceedings of the Fifth International Conference on the Foundations of Digital Games, Monterey, CA, USA, 19–21 June 2010; pp. 108–115. [Google Scholar]
- Pascarella, L.; Palomba, F.; Di Penta, M.; Bacchelli, A. How Is Video Game Development Different from Software Development in Open Source? In Proceedings of the 2018 IEEE/ACM 15th International Conference on Mining Software Repositories (MSR), Gothenburg, Sweden, 27 May–3 June 2018; pp. 392–402. [Google Scholar]
- Murphy-Hill, E.; Zimmermann, T.; Nagappan, N. Cowboys, ankle sprains, and keepers of quality: How is video game development different from software development? In Proceedings of the 36th International Conference on Software Engineering, Hyderabad, India, 31 May–7 June 2014; pp. 1–11. [Google Scholar]
- Callele, D.; Neufeld, E.; Schneider, K. Requirements engineering and the creative process in the video game industry. In Proceedings of the 13th IEEE International Conference on Requirements Engineering (RE’05), 29 August–2 September 2005; pp. 240–250. [Google Scholar]
- Petrillo, F.; Pimenta, M.; Trindade, F.; Dietrich, C. What went wrong? A survey of problems in game development. Comput. Entertain. (CIE) 2009, 7, 1–22. [Google Scholar] [CrossRef]
- Kanode, C.M.; Haddad, H.M. Software engineering challenges in game development. In Proceedings of the 2009 Sixth International Conference on Information Technology, New Generations, Las Vegas, NV, USA, 27–29 April 2009; pp. 260–265. [Google Scholar]
- Washburn, M., Jr.; Sathiyanarayanan, P.; Nagappan, M.; Zimmermann, T.; Bird, C. What went right and what went wrong: An analysis of 155 postmortems from game development. In Proceedings of the 38th International Conference on Software Engineering Companion, Austin, TX, USA, 14–22 May 2016; pp. 280–289. [Google Scholar]
- Politowski, C.; Fontoura, L.; Petrillo, F.; Guéhéneuc, Y.G. Are the old days gone? A survey on actual software engineering processes in video game industry. In Proceedings of the 5th International Workshop on Games and Software Engineering, Austin, TX, USA, 16 May 2016; pp. 22–28. [Google Scholar]
- Politowski, C.; Petrillo, F.; Ullmann, G.C.; de Andrade Werly, J.; Guéhéneuc, Y.G. Dataset of video game development problems. Proceedings of 17th International Conference on Mining Software Repositories, Seoul, Korea, 29–30 June 2020; pp. 553–557. [Google Scholar]
- Politowski, C.; Petrillo, F.; Ullmann, G.C.; Guéhéneuc, Y.G. Game industry problems: An extensive analysis of the gray literature. Inf. Softw. Technol. 2021, 134, 106538. [Google Scholar] [CrossRef]
- Treude, C.; Barzilay, O.; Storey, M.A. How do programmers ask and answer questions on the web?: Nier track. In Proceedings of the 2011 33rd International Conference on Software Engineering (ICSE), Honolulu, HI, USA, 21–28 May 2011; pp. 804–807. [Google Scholar]
- Barua, A.; Thomas, S.W.; Hassan, A.E. What are developers talking about? an analysis of topics and trends in stack overflow. Empir. Softw. Eng. 2014, 19, 619–654. [Google Scholar] [CrossRef]
- Linares-Vásquez, M.; Dit, B.; Poshyvanyk, D. An exploratory analysis of mobile development issues using stack overflow. In Proceedings of the 10th Working Conference on Mining Software Repositories, San Francisco, CA, USA, 18–19 May 2013; pp. 93–96. [Google Scholar]
- Beyer, S.; Pinzger, M. A manual categorization of android app development issues on stack overflow. In Proceedings of the International Conference on Software Maintenance and Evolution (ICSME), Victoria, BC, Canada, 29 September–3 October 2014; pp. 531–535. [Google Scholar]
- Rosen, C.; Shihab, E. What are mobile developers asking about? a large scale study using stack overflow. Empir. Softw. Eng. 2016, 21, 1192–1223. [Google Scholar] [CrossRef]
- Bajaj, K.; Pattabiraman, K.; Mesbah, A. Mining questions asked by web developers. In Proceedings of the 11th Working Conference on Mining Software Repositories, Hyderabad, India, 31 May–1 June 2014; pp. 112–121. [Google Scholar]
- Venkatesh, P.K.; Wang, S.; Zhang, F.; Zou, Y.; Hassan, A.E. What do client developers concern when using web apis? an empirical study on developer forums and stack overflow. In Proceedings of the 2016 IEEE International Conference on Web Services (ICWS), San Francisco, CA, USA, 27 June–2 July 2016; pp. 131–138. [Google Scholar]
- Mehrab, Z.; Yousuf, R.B.; Tahmid, I.A.; Shahriyar, R. Mining Developer Questions about Major Web Frameworks; Sience and Technology Publications: LdaSetùbal, Portugal, 2017; pp. 191–198. [Google Scholar]
- Almansoury, F.; Kpodjedo, S.; Boussaidi, G.E. Investigating Web3D topics on StackOverflow: A preliminary study of WebGL and Three. js. In Proceedings of the The 25th International Conference on 3D Web Technology, Virtual Event, Korea, 9–13 November 2020; pp. 1–2. [Google Scholar]
- Kochhar, P.S. Mining testing questions on stack overflow. In Proceedings of the 5th International Workshop on Software Mining, Singapore, 3 September 2016; pp. 32–38. [Google Scholar]
- Shariff, S.M. Investigating Selenium Usage Challenges and Reducing the Performance Overhead of Selenium-Based Load Tests. Doctoral Dissertation, Queen’s University, Kingston, ON, Canada, 2019. [Google Scholar]
- Yang, X.L.; Lo, D.; Xia, X.; Wan, Z.Y.; Sun, J.L. What security questions do developers ask? a large-scale study of stack overflow posts. J. Comput. Sci. Technol. 2016, 31, 910–924. [Google Scholar] [CrossRef]
- Fischer, F.; Böttinger, K.; Xiao, H.; Stransky, C.; Acar, Y.; Backes, M.; Fahl, S. Stack overflow considered harmful? the impact of copy&paste on android application security. In Proceedings of the 2017 IEEE Symposium on Security and Privacy (SP), San Jose, CA, USA, 25 May 2017; pp. 121–136. [Google Scholar]
- Meng, N.; Nagy, S.; Yao, D.; Zhuang, W.; Argoty, G.A. Secure coding practices in java: Challenges and vulnerabilities. In Proceedings of the 40th International Conference on Software Engineering, Gothenburg, Sweden, 27 May 2018; pp. 372–383. [Google Scholar]
- Lopez, T.; Tun, T.T.; Bandara, A.; Levine, M.; Nuseibeh, B.; Sharp, H. An investigation of security conversations in stack overflow: Perceptions of security and community involvement. In Proceedings of the 1st International Workshop on Security Awareness from Design to Deployment, Gothenburg, Sweden, 27 May 2018–3 June 2018; pp. 26–32. [Google Scholar]
- Vasilescu, B. Academic Papers Using Stack Exchange Data. 2020. Available online: https://meta.stackexchange.com/questions/134495/academic-papers-using-stack-exchange-data (accessed on 26 June 2020).
- Tamla, P.; Böhm, T.; Nawroth, C.; Hemmje, M.; Fuchs, M. What Do Serious Games Developers Search Online? A Study of GameDev StackExchange. CERC, Darmstadt, Germany, 29–30 March 2019; pp. 131–142. [Google Scholar]
- Sekaran, U.; Bougie, R. Research Methods for Business: A Skill Building Approach; John Wiley & Sons: Hoboken, NJ, USA, 2016. [Google Scholar]
- Almansoury, F.; Kpodjedo, S. Game Developers Issues. 2020. Available online: https://zenodo.org/record/3908627#.Yy7U_ORBxPY (accessed on 1 January 2020).
- Mamykina, L.; Manoim, B.; Mittal, M.; Hripcsak, G.; Hartmann, B. Design lessons from the fastest q&a site in the west. In Proceedings of the SIGCHI Conference on Human Factors in Computing Systems, Vancouver, BC, Canada, 7–12 May 2011; pp. 2857–2866. [Google Scholar]
- Vargha, A.; Delaney, H.D. A critique and improvement of the CL common language effect size statistics of McGraw and Wong. J. Educ. Behav. Stat. 2000, 25, 101–132. [Google Scholar]
- Singh Gill, S.; Xu, M.; Ottaviani, C.; Patros, P.; Bahsoon, R.; Shaghaghi, A.; Golec, M.; Stankovski, V.; Wu, H.; Abraham, A.; et al. AI for Next Generation Computing: Emerging Trends and Future Directions. Internet Things 2022, 19, 100514. [Google Scholar] [CrossRef]


| Name | Description |
|---|---|
| Id | Post ID |
| PostTypeId | Post type: 1 for questions and 2 for answers |
| AcceptedAnswerId | ID of the accepted answer post |
| ParentId | ID of the parent element, if relevant |
| CreationDate | The date when the post was created |
| DeletionDate | The date when the post was deleted |
| Score | Number of upvotes minus number of downvotes. |
| ViewCount | Number of views for the question post |
| Body | Content of the question post |
| Title | Title of the question post |
| Tags | Tags provided for the post |
| AnswerCount | Number of answers received for the question post |
| CommentCount | Number of comments received for the question post |
| FavoriteCount | Number of users who marked the question post as favorite |
| Tag Names | Q | R-Q | AvgV | R-AvgV | AvgS | R-AvgS | AvgF | R-AvgF |
|---|---|---|---|---|---|---|---|---|
| Unity | 9029 | 1 | 1202 | 10 | 1.17 | 49 | 0.29 | 32 |
| C# | 4212 | 2 | 1074 | 18 | 0.97 | 73 | 0.25 | 45 |
| OpenGL | 2185 | 3 | 870 | 27 | 1.62 | 13 | 0.4 | 15 |
| C++ | 2013 | 4 | 837 | 30 | 1.4 | 20 | 0.4 | 15 |
| Java | 1930 | 5 | 734 | 41 | 1.06 | 59 | 0.25 | 45 |
| libGDX | 1798 | 6 | 821 | 32 | 1.28 | 36 | 0.29 | 32 |
| Android | 1134 | 7 | 1100 | 14 | 1.2 | 44 | 0.29 | 32 |
| XNA | 787 | 8 | 512 | 77 | 1.1 | 55 | 0.22 | 55 |
| Javascript | 738 | 9 | 711 | 47 | 1.08 | 57 | 0.26 | 39 |
| MonoGame | 572 | 10 | 556 | 72 | 1.15 | 52 | 0.19 | 68 |
| GLSL | 491 | 11 | 842 | 29 | 1.64 | 9 | 0.42 | 12 |
| Game-Maker | 328 | 15 | 678 | 52 | 2.47 | 5 | 0.86 | 3 |
| Unityscript | 302 | 16 | 1436 | 7 | 0.81 | 86 | 0.22 | 55 |
| Windows | 126 | 35 | 652 | 56 | 1.64 | 9 | 0.29 | 32 |
| Phaser | 114 | 37 | 1121 | 11 | 1.84 | 6 | 0.43 | 11 |
| Lua | 110 | 38 | 831 | 31 | 1.64 | 9 | 0.84 | 4 |
| SpriteKit | 91 | 41 | 696 | 50 | 1.66 | 8 | 0.45 | 9 |
| Google-Play-Services | 89 | 42 | 1365 | 8 | 1.21 | 41 | 0.38 | 17 |
| Three.js | 75 | 49 | 1440 | 6 | 1.23 | 39 | 0.6 | 7 |
| Google-Play | 72 | 51 | 3136 | 2 | 3.17 | 4 | 0.78 | 6 |
| Steam | 65 | 57 | 1582 | 5 | 3.55 | 3 | 0.83 | 5 |
| Godot | 54 | 65 | 588 | 66 | 1.67 | 7 | 0.09 | 91 |
| 45 | 70 | 1223 | 9 | 0.8 | 87 | 0.38 | 17 | |
| JSON | 42 | 74 | 1008 | 20 | 1.36 | 22 | 0.45 | 9 |
| UDP | 40 | 75 | 1717 | 4 | 3.77 | 2 | 1.27 | 2 |
| Eclipse | 34 | 85 | 1812 | 3 | 1.06 | 59 | 0.26 | 39 |
| Oculus | 33 | 89 | 612 | 62 | 1.64 | 9 | 0.3 | 28 |
| Vulkan | 32 | 90 | 3910 | 1 | 5.41 | 1 | 1.63 | 1 |
| Tag Names | Q | R-Q | AvgV | R-AvgV | AvgS | R-AvgS | AvgF | R-AvgF |
|---|---|---|---|---|---|---|---|---|
| 2D | 1593 | 1 | 1142 | 55 | 1.75 | 129 | 0.52 | 110 |
| collision-detection | 1173 | 2 | 774 | 160 | 1.31 | 185 | 0.34 | 161 |
| physics | 1021 | 3 | 746 | 166 | 1.64 | 142 | 0.46 | 128 |
| shaders | 980 | 4 | 957 | 94 | 1.91 | 110 | 0.58 | 96 |
| mathematics | 824 | 5 | 800 | 154 | 2 | 92 | 0.62 | 85 |
| 3D | 779 | 6 | 850 | 136 | 1.62 | 143 | 0.47 | 124 |
| textures | 745 | 7 | 894 | 120 | 1.44 | 168 | 0.3 | 178 |
| animation | 685 | 8 | 1011 | 84 | 1.32 | 184 | 0.34 | 161 |
| game-design | 664 | 9 | 1476 | 21 | 5.79 | 9 | 1.88 | 11 |
| rendering | 610 | 10 | 909 | 111 | 2.15 | 72 | 0.52 | 110 |
| terminology | 122 | 66 | 3039 | 2 | 8.75 | 3 | 2.09 | 7 |
| graphic-effects | 101 | 85 | 1419 | 28 | 5.38 | 12 | 2.46 | 3 |
| level-design | 89 | 96 | 1371 | 34 | 5.49 | 11 | 1.96 | 9 |
| user-experience | 55 | 142 | 1805 | 9 | 7.2 | 5 | 1.36 | 18 |
| publishing | 51 | 151 | 1760 | 10 | 1.98 | 95 | 0.45 | 129 |
| balance | 50 | 154 | 2892 | 3 | 12.42 | 1 | 3.82 | 1 |
| levels | 49 | 156 | 1192 | 47 | 5.2 | 13 | 1.9 | 10 |
| marketing | 47 | 164 | 1257 | 41 | 7.11 | 6 | 1.15 | 30 |
| licensing | 46 | 168 | 1862 | 8 | 3.83 | 21 | 0.72 | 61 |
| file-format | 43 | 183 | 905 | 114 | 6.3 | 7 | 2.07 | 8 |
| puzzle | 41 | 188 | 1396 | 32 | 5.59 | 10 | 1.61 | 12 |
| cross-platform | 36 | 208 | 2122 | 5 | 5.83 | 8 | 1.22 | 26 |
| file | 36 | 208 | 2767 | 4 | 2.11 | 78 | 0.64 | 80 |
| strategy | 34 | 217 | 1432 | 25 | 5.12 | 14 | 2.35 | 4 |
| aspect-ratio | 31 | 236 | 4483 | 1 | 4.06 | 16 | 2.61 | 2 |
| npc | 31 | 236 | 2010 | 6 | 8.35 | 4 | 2.1 | 6 |
| monetization | 30 | 243 | 1913 | 7 | 8.93 | 2 | 2.23 | 5 |
| min | Q1 | Median | Q3 | max | avg | std | ||
|---|---|---|---|---|---|---|---|---|
| Score | noAA | −18 | 0 | 1 | 2 | 132 | 1.52 | 3.93 |
| AA | −10 | 0 | 1 | 2 | 209 | 2.14 | 6.83 | |
| Views | noAA | 17 | 163 | 424 | 1046 | 77,003 | 1110.79 | 2581.83 |
| AA | 15 | 168 | 472 | 1301 | 129,994 | 1547.20 | 4423.81 |
Publisher’s Note: MDPI stays neutral with regard to jurisdictional claims in published maps and institutional affiliations. |
© 2022 by the authors. Licensee MDPI, Basel, Switzerland. This article is an open access article distributed under the terms and conditions of the Creative Commons Attribution (CC BY) license (https://creativecommons.org/licenses/by/4.0/).
Share and Cite
Almansoury, F.; Kpodjedo, S.; El Boussaidi, G. Game Development Topics: A Tag-Based Investigation on Game Development Stack Exchange. Appl. Sci. 2022, 12, 10750. https://doi.org/10.3390/app122110750
Almansoury F, Kpodjedo S, El Boussaidi G. Game Development Topics: A Tag-Based Investigation on Game Development Stack Exchange. Applied Sciences. 2022; 12(21):10750. https://doi.org/10.3390/app122110750
Chicago/Turabian StyleAlmansoury, Farag, Segla Kpodjedo, and Ghizlane El Boussaidi. 2022. "Game Development Topics: A Tag-Based Investigation on Game Development Stack Exchange" Applied Sciences 12, no. 21: 10750. https://doi.org/10.3390/app122110750
APA StyleAlmansoury, F., Kpodjedo, S., & El Boussaidi, G. (2022). Game Development Topics: A Tag-Based Investigation on Game Development Stack Exchange. Applied Sciences, 12(21), 10750. https://doi.org/10.3390/app122110750