Abstract
Due to the contrast of X-ray images being low, significant elements including organs, bones, and nodules are very difficult to identify, so contrast enhancement is necessary. In this paper, an X-ray image enhancement algorithm based on adaptive gradient domain guided image filtering is proposed. The amplification factor in the gradient domain guided image filtering needs to be set manually; it needs to constantly adjust the parameters to achieve the best enhancement effect, and this also increases the computational complexity. In order to solve this problem, an adaptive amplification factor is defined in this paper, and the proposed algorithm is applied to the X-ray image enhancement. Experimental results demonstrate that the proposed method is superior to state-of-the art algorithms in terms of detail enhancement and edge-preserving.
1. Introduction
Inspecting X-ray images is an important element of medical diagnosis. Due to factors of the imaging equipment and illumination, the contrast and definition of X-ray images are low, and it is difficult for doctors to observe the tissues of patients, including organs, bones, and nodules. Therefore, it is necessary to process the X-ray image using effective image enhancement technology [1,2].
At present, image enhancement techniques can be roughly divided into the following categories: Spatial domain, transform domain and edge-preserving filtering [3,4]. The traditional image enhancement methods based on spatial domain are histogram equalization (HE) [5], gamma correction [6], unsharp filter [7] and multi-scale retinex [8], etc. The histogram equalization (HE) can produce over-enhancement when enhancing images. In order to solve this problem, many improved algorithms based on histogram equalization are proposed, such as contrast-limited adaptive histogram equalization (CLAHE) [9], brightness preserving adaptive fuzzy histogram equalization (BPDFHE) [10], recursive exposure-based sub-image histogram equalization (RESIHE) [11], etc. HE-based approaches aim to automatically determine the global mapping function by maximizing the histogram entropy of the enhanced image. The methods based on HE are effective, but when the histogram distribution has a peak, they tend to over enhance the image and produce unnatural artifacts. Finally, these global tone mapping methods cannot adaptively enhance local image regions. In terms of the transform domain, there are many image enhancement algorithms, based on wavelet [12], dual-tree complex wavelet transform [13], contourlet [14], nonsubsampled contourlet transform (NSCT) [15], shearlet [16], nonsubsampled shearlet transform (NSST) [17], etc. Yang et al. [18] proposed an image enhancement method based on retinex and dual-tree complex wavelet transform, and this method has a good performance in terms of contrast enhancement. Feng et al. [19] proposed an image enhancement technique based on contourlet transform. This algorithm achieves enhancement by adjusting the decomposed contourlet coefficients, but as the contourlet transform does not have shift-invariance, this method can lead to the appearance of the pseudo-Gibbs phenomenon. The NSCT is an improved version of contourlet transform, which has shift-invariance, and the pseudo-Gibbs phenomenon can be effectively avoided in the application of image processing. Li et al. [20] introduced an enhancement technique using NSCT; the gamma correction and adaptive threshold are used to process the low-frequency and high-frequency components, respectively. The unsharp filter is used to process the reconstructed image achieved by inverse NSCT. The result is a dramatic advance in image contrast. The enhancement methods based on NSCT show good performance, but NSCT has a high computational complexity. Compared with the NSCT, shearlet has lower computational complexity and better sparse representation characteristics. Li et al. [21] proposed a medical image enhancement algorithm using singular value decomposition in NSST domain, and a good image enhancement performance was achieved. Zhao et al. [22] introduced another enhancement method utilizing nonsubsampled shearlet transform for X-ray images.
In recent years, guided image filtering is very popular in image processing fields [23], such as image enhancement, image fusion, image classification, image restoration, image super-resolution, image dehazing, etc. Based on guided image filtering, some extended versions were proposed, such as weighted guided image filtering (WGIF) [24], gradient domain guided image filtering (GDGIF) [25], weighted guided image filtering with steering kernel (SKWGIF) [26], anisotropic guided filtering (AnisGF) [27], effective guided image filtering [28], side window guided filtering (SWGF) [29], weighted aggregation for guided image filtering (WAGIF) [30], and robust double-weighted guided image filtering [31]. Among them, the effect of gradient domain guided image filtering in image enhancement has a good performance status. But the amplification factor in the GDGIF needs to be set manually; it needs to constantly adjust parameters to obtain a better enhanced image. This also increases the computational complexity. In order to deal with this weakness, an adaptive amplification factor is defined in this paper, and the proposed algorithm is applied to X-ray image enhancement.
2. Related Works
Gradient Domain Guided Image Filtering
The gradient domain guided image filter is proposed by incorporating an explicit first-order edge-aware constraint, and it overcomes the disadvantage of halo artifacts in the guided image filter [25]. This method is widely used in image enhancement, image fusion, and image defogging, etc. In the GDGIF method, we suppose the guidance image, input image and output image as , and , respectively [25]. The is defined as follows:
where and are constants in the window , the corresponding values can be calculated by minimizing the cost function , and it is computed by:
where depicts an edge-aware weighting, and it is computed by the following:
where is defined as .
The optimal values of and can be defined as follows:
The final value of the output image can be calculated by the following:
where and represent the mean values of and in the window, respectively. The corresponding formulas can be defined as follows:
where represents the cardinality of .
3. The Proposed Method
In this section, an adaptive amplification factor is proposed. From Section 2, we can denote that the detail layer is defined as the following [25,28]:
where presents the base layer.
Multiplying the detail layer by an amplification factor , the corresponding equation is defined as follows:
where shows the enhanced detail layer, and is an adjustable parameter, which can influence the enhanced result. In traditional gradient domain guided image filtering, the value of is set to 5 [25].
The output image can be computed by the following:
Substituting Equation (8) into Equation (12):
The gradient of the enhanced detail layer can be defined as follows:
From Equation (1), we can define the gradient of base layer, and it is defined as follows:
In general, the is less than . If not, the noise in the detail layer will be amplified. We have the following equation:
Substituting Equations (15) and (16) into Equation (17):
From Formula (18), we can have the following equation:
When the value of is large, the noise can be amplified; when the value of is small, the details will be suppressed. From the above analysis, we can see that a proper value of is very important to balance the noise suppression and detail enhancement. In this section, the value of is defined as follows:
where is an adaptive parameter, and its value does not need to be set manually.
4. Experimental Results
In order to demonstrate the effectiveness of the proposed method, we experimented on a large number of X-ray images from the website http://acm.cs.nctu.edu.tw/ (accessed on 20 September 2022) which was provided by Prof Ching-Chun Huang, and the following seven image enhancement approaches are compared: McCann [32], RLBHE [33], RESIHE [11], TBCSSR [34], gradient domain guided image filtering (GDGIF) [25], statistical methods with image processing concepts (SMIPC) [35], and improved type-II fuzzy set (FuzzyII) [36]. Subjective and objective assessments are used to evaluate the performance of different image enhancement methods. In terms of the objective index, the average gradient (AG) [37], information entropy (H) [37], average local contrast (ALC) [38], spatial frequency (SF) [37] and mean gradient [38] are used in the comparison. The bigger these indexes are, the better the image enhancement effect is.
The average gradient (AG) is defined as follows [37]:
where shows the pixel intensity at , and shows the size of the image.
Information entropy (H) estimates the amount of information in the image, and it is calculated by the following [37]:
where shows the probability of intensity value in the image.
The average local contrast (ALC) of the image is achieved by calculating the average value of the local contrast metric, and the local contrast is defined as follows [38]:
where the local mean of intensity is calculated for the pixels within the sliding 3 3 window centered on the pixel , and shows the local variance of intensity.
Spatial frequency (SF) denotes the overall information level in the regions, and it is defined as follows [37]:
where
The mean gradient (MG) evaluates the edge information of image; it is defined as follows [38]:
where shows the magnitude of the gradient at the pixel location in the image.
Figure 1 shows the enhancement images of eight methods experimented on X-ray image 1. Figure 1a shows the original X-ray image 1; Figure 1b shows the image obtained by McCann, and the image is too bright; Figure 1c shows the image achieved by RLBHE—the image is too dark and the performance of enhancement is poor, the details of the image are difficult to ascertain; Figure 1d is the result obtained by RESIHE—the definition of the image is low; Figure 1e shows the image enhanced by TBCSSR; Figure 1f represents the image obtained by GDGIF—the image has a lot of noise; Figure 1g and Figure 1h show the result enhanced by SMIPC and FuzzyII, respectively, and the images have poor enhancement performance; Figure 1i is the image achieved by the proposed method—it has moderate brightness and better clarity. Table 1 is the evaluation index values of various algorithms in Figure 1. From this table, we can denote that the values of AG, ALC, SF and MG obtained by the proposed technique are the best; the value of H achieved by SMIPC is the best, and the corresponding value obtained by the proposed method is still ranked second.
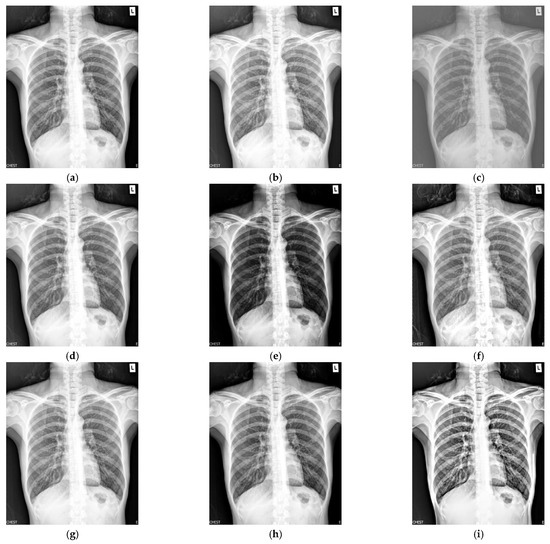
Figure 1.
Comparison on X-ray image 1. (a) Original image; (b) McCann; (c) RLBHE; (d) RESIHE; (e) TBCSSR; (f) GDGIF; (g) SMIPC; (h) FuzzyII; (i) Proposed method.

Table 1.
The metric data of eight methods on X-ray image 1.
Figure 2 shows the enhancement images of eight approaches experimented on X-ray image 2. Figure 2a shows the original X-ray image 2; Figure 2b is the result obtained by McCann—the contrast is low; Figure 2c presents the image enhanced by RLBHE—it does not achieve the effect of image enhancement, the image is too dark, and we can hardly get effective information from it; Figure 2d shows the result achieved by RESIHE—the effect of enhancement is not obvious; the images obtained by TBCSSR and FuzzyII are shown in Figure 2e and Figure 2h, respectively. The contrast and the definition are low; Figure 2f and Figure 2g show the results enhanced by GDGIF and SMIPC, respectively. The two images appear to have noise amplification. The result enhanced by the proposed algorithm is shown in Figure 2i—it reveals more image details and suppresses the noise. Bone information can be clearly obtained, which is helpful for doctors to diagnose. Table 2 is the evaluation index values of various methods in Figure 2. Except for H, our method is the best for other indicators.
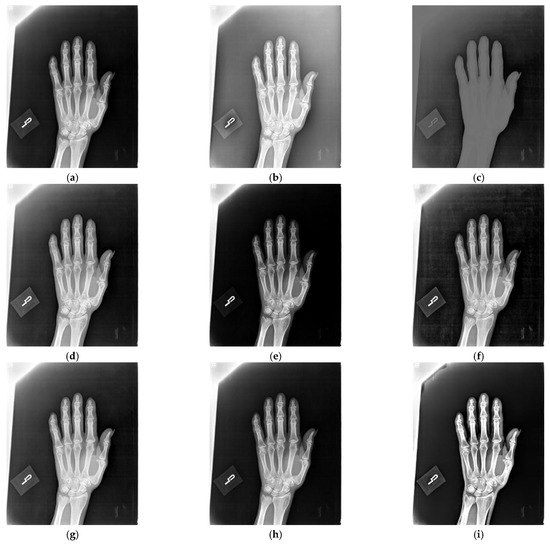
Figure 2.
Comparison on X-ray image 2. (a) Original image; (b) McCann; (c) RLBHE; (d) RESIHE; (e) TBCSSR; (f) GDGIF; (g) SMIPC; (h) FuzzyII; (i) Proposed method.
Table 2.
The metric data of eight methods on X-ray image 2.
Figure 3 shows the enhancement images of eight approaches experimented on X-ray image 3. Figure 3a shows the original X-ray image 3; Figure 3b shows the enhancement result computed by McCann—the image is too bright, resulting in the loss of image details; Figure 3c shows the image achieved by RLBHE—the image is too dark, the useful information is lost; Figure 3d depicts the result achieved by RESIHE—the effect of enhancement is not obvious; Figure 3e shows the image obtained by TBCSSR—the image becomes gray and it is difficult to observe the details; the results enhanced by GDGIF, SMIPC, and FuzzyII are shown in Figure 3f–h, respectively. They are very similar and the enhancement effect is not prominent. Our method is depicted in Figure 3i—it performs well, and more details are retained. Table 3 shows the evaluation index values of the methods in Figure 3. Our method obtains the best values for all the metrics.
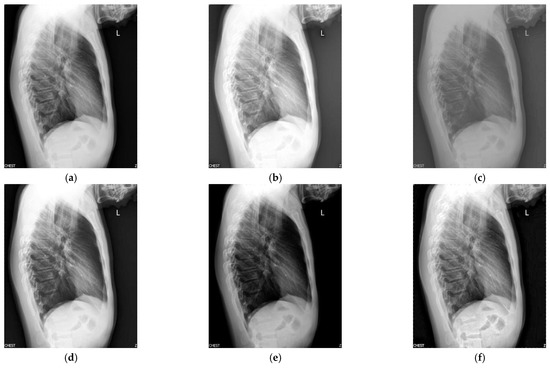
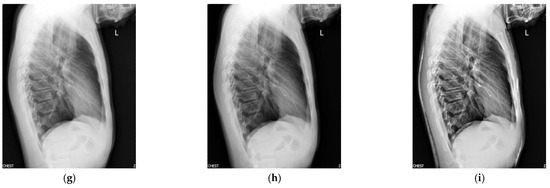
Figure 3.
Comparison on X-ray image 3. (a) Original image; (b) McCann; (c) RLBHE; (d) RESIHE; (e) TBCSSR; (f) GDGIF; (g) SMIPC; (h) FuzzyII; (i) Proposed method.
Table 3.
The metric data of eight methods on X-ray image 3.
Figure 4 shows the enhancement images of eight approaches experimented on X-ray image 4. Figure 4a shows the original X-ray image 4; Figure 4b is the result computed by McCann—the image is too bright; Figure 4c depicts the image enhanced by RLBHE—the image is too dark; Figure 4d is the result achieved by RESIHE—the effect of enhancement is not obvious; the image obtained by TBCSSR is shown in Figure 4e—the image is dark; Figure 4f is the result enhanced by GDGIF—the details of the image are well preserved; Figure 4g and Figure 4h are the results enhanced by SMIPC and FuzzyII, respectively; Figure 4i is the result calculated by our approach. Table 4 shows evaluation data in Figure 4, and we can notice that the values of AG, H, ALC, SF and MG are the best.
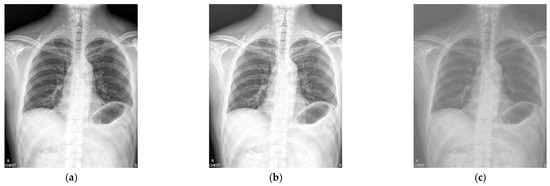
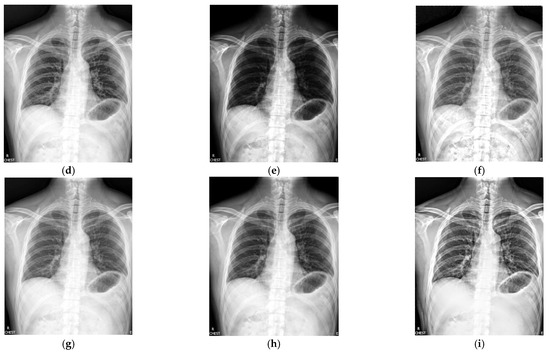
Figure 4.
Comparison on X-ray image 4. (a) Original image; (b) McCann; (c) RLBHE; (d) RESIHE; (e) TBCSSR; (f) GDGIF; (g) SMIPC; (h) FuzzyII; (i) Proposed method.
Table 4.
The metric data of eight methods on X-ray image 4.
We used eight image enhancement methods to experiment on 69 X-ray images, which we collected from the website http://acm.cs.nctu.edu.tw/ (accessed on 20 September 2022), and the corresponding average data are shown in Table 5. From this table, we can notice that the values of AG, H, ALC SF and MG are the best. Through the above comprehensive analysis, the experiment results show that our method has obvious advantages in terms of both subjective and objective evaluations.
Table 5.
The average metric data of eight methods on 69 X-ray images.
5. Conclusions
The low contrast of X-ray images makes it difficult to identify tiny and abnormal details. In order to solve this problem, a novel X-ray image enhancement method based on adaptive gradient domain guided image filtering is proposed, which solves the disadvantage that the amplification factor needs to be adjusted manually in traditional gradient domain guided image filtering. The proposed adaptive amplification factor is adopted to gradient domain guided image filtering and can effectively suppress the noise and boost the fine details in the detail layer. Compared to the state-of-the-art image enhancement methods, the proposed algorithm can produce a good enhanced performance in terms of the subjective and objective assessment. In follow-up work, we will apply this algorithm to the enhancement of other medical images to help doctors carry out auxiliary diagnosis and treatment for patients.
Author Contributions
The experimental measurements and data collection were carried out by L.L. and H.M. The manuscript was written by L.L. with the assistance of M.L., H.M., Z.J., X.Y. and W.Y. All authors have read and agreed to the published version of the manuscript.
Funding
This work was supported by the Cross-Media Intelligent Technology Project of Beijing National Research Center for Information Science and Technology (BNRist) under Grant No. BNR2019TD01022.
Institutional Review Board Statement
Not applicable.
Informed Consent Statement
Not applicable.
Data Availability Statement
Not applicable.
Conflicts of Interest
The authors declare no conflict of interest.
References
- Huang, C.; Manh, H. X-ray enhancement based on component attenuation, contrast adjustment, and image fusion. IEEE Trans. Image Process. 2019, 28, 127–141. [Google Scholar] [CrossRef]
- Hussain, L. Lung cancer prediction using robust machine learning and image enhancement methods on extracted gray-level co-occurrence matrix features. Appl. Sci. 2022, 12, 6517. [Google Scholar] [CrossRef]
- Yao, L.; Lin, Y.; Muhammad, S. An improved multi-scale image enhancement method based on retinex theory. J. Med. Imaging Health Inform. 2018, 8, 122–126. [Google Scholar] [CrossRef]
- Guo, Q.; Jia, Z.; Yang, J.; Nikola, K. Contrast enhancement of medical images using fuzzy set theory and nonsubsampled shearlet transform. Int. J. Imaging Syst. Technol. 2019, 29, 110–117. [Google Scholar]
- Kansal, S.; Purwar, S.; Tripathi, R. Image contrast enhancement using unsharp masking and histogram equalization. Multimed. Tools Appl. 2018, 77, 26919–26938. [Google Scholar] [CrossRef]
- Kallel, F.; Sahnoun, M.; Hamida, A. CT scan contrast enhancement using singular value decomposition and adaptive gamma correction. Signal Image Video Process. 2018, 12, 905–913. [Google Scholar] [CrossRef]
- Joseph, J.; Anoop, B.; Williams, J. A modified unsharp masking with adaptive threshold and objectively defined amount based on saturation constraints. Multimed. Tools Appl. 2019, 78, 11073–11089. [Google Scholar] [CrossRef]
- Rahman, Z.; Jobson, D.J.; Woodell, G. Multi-scale retinex for color image enhancement. In Proceedings of the International Conference on Image Processing, Lausanne, Switzerland, 19 September 1996; pp. 1003–1006. [Google Scholar]
- Zuiderveld, K. Contrast limited adaptive histograph equalization. In Graphic Gems IV; Academic Press Professional: San Diego, CA, USA, 1994; pp. 474–485. [Google Scholar]
- Subramani, B.; Veluchamy, M. MRI brain image enhancement using brightness preserving adaptive fuzzy histogram equalization. Int. J. Imaging Syst. Technol. 2018, 28, 217–222. [Google Scholar] [CrossRef]
- Singh, K.; Kapoor, R.; Sinha, S. Enhancement of low exposure images via recursive histogram equalization algorithms. Optik 2015, 126, 2619–2625. [Google Scholar] [CrossRef]
- Ashiba, H.; Mansour, H.; Ahmed, H. Enhancement of IR images using histogram processing and the undecimated additive wavelet transform. Multimed. Tools Appl. 2019, 78, 11277–11290. [Google Scholar] [CrossRef]
- Selesnick, I.; Baraniuk, R.; Kingsbury, N. The dual-tree complex wavelet transform. IEEE Signal Process. Mag. 2005, 22, 123–151. [Google Scholar] [CrossRef]
- Do, M.; Vetterli, M. The contourlet transform: An efficient directional multiresolution image representation. IEEE Trans. Image Process. 2005, 14, 2091–2106. [Google Scholar] [CrossRef] [PubMed]
- Cunha, A.; Zhou, J.; Do, M. The nonsubsampled contourlet transform: Theory, design, and applications. IEEE Trans. Image Process. 2006, 15, 3089–3101. [Google Scholar] [CrossRef] [PubMed]
- Guo, K.; Labate, D.; Lim, W. Edge analysis and identification using the continuous shearlet transform. Appl. Comput. Harmon. Anal. 2009, 27, 24–46. [Google Scholar] [CrossRef]
- Easley, G.; Labate, D.; Lim, W. Sparse directional image representations using the discrete shearlet transform. Appl. Comput. Harmon. Anal. 2008, 25, 25–46. [Google Scholar] [CrossRef]
- Yang, M.; Tang, G.; Liu, X. Low-light image enhancement based on retinex theory and dual-tree complex wavelet transform. Optoelectron. Lett. 2018, 14, 470–475. [Google Scholar] [CrossRef]
- Feng, P.; Pan, Y.; Wei, B. Enhancing retinal image by the contourlet transform. Pattern Recognit. Lett. 2007, 28, 516–522. [Google Scholar] [CrossRef]
- Li, L.; Si, Y.; Jia, Z. A novel brain image enhancement method based on nonsubsampled contourlet transform. Int. J. Imaging Syst. Technol. 2018, 28, 124–131. [Google Scholar] [CrossRef]
- Li, L.; Si, Y.; Wang, L. Brain image enhancement approach based on singular value decomposition in nonsubsampled shearlet transform domain. J. Med. Imaging Health Inform. 2020, 10, 1785–1794. [Google Scholar] [CrossRef]
- Zhao, T.; Zhang, S. X-ray image enhancement based on nonsubsampled shearlet transform and gradient domain guided filtering. Sensors 2022, 22, 4074. [Google Scholar] [CrossRef] [PubMed]
- He, K.; Sun, J.; Tang, X. Guided image filtering. IEEE Trans. Pattern Anal. Mach. Intell. 2013, 35, 1397–1409. [Google Scholar] [CrossRef] [PubMed]
- Li, Z.; Zheng, J.; Zhu, Z. Weighted guided image filtering. IEEE Trans. Image Process. 2015, 24, 120–129. [Google Scholar]
- Kou, F.; Chen, W.; Wen, C. Gradient domain guided image filtering. IEEE Trans. Image Process. 2015, 24, 4528–4539. [Google Scholar] [CrossRef] [PubMed]
- Sun, Z.; Han, B.; Li, J. Weighted guided image filtering with steering kernel. IEEE Trans. Image Process. 2020, 29, 500–508. [Google Scholar] [CrossRef]
- Ochotorena, C.; Yamashita, Y. Anisotropic guided filtering. IEEE Trans. Image Process. 2020, 29, 1397–1412. [Google Scholar] [CrossRef]
- Lu, Z.; Long, B.; Li, K. Effective guided image filtering for contrast enhancement. IEEE Signal Process. Lett. 2018, 25, 1585–1589. [Google Scholar] [CrossRef]
- Yin, H.; Gong, Y.; Qiu, G. Side window guided filtering. Signal Process. 2019, 165, 315–330. [Google Scholar] [CrossRef]
- Chen, B.; Wu, S. Weighted aggregation for guided image filtering. Signal Image Video Process. 2020, 14, 491–498. [Google Scholar] [CrossRef]
- Zhang, X.; He, C. Robust double-weighted guided image filtering. Signal Process. 2022, 199, 108609. [Google Scholar] [CrossRef]
- Funt, B.; Ciurea, F.; Mccann, J. Retinex in MATLABTM. J. Electron. Imaging 2004, 13, 48–57. [Google Scholar] [CrossRef]
- Zuo, C.; Chen, Q.; Sui, X. Range limited bi-histogram equalization for image contrast enhancement. Optik 2013, 124, 425–431. [Google Scholar] [CrossRef]
- Al-Ameen, Z. A new algorithm for improving the low contrast of computed tomography images using tuned brightness controlled single-scale retinex. Scanning 2015, 37, 116–125. [Google Scholar] [CrossRef] [PubMed]
- Al-Ameen, Z. Contrast enhancement of medical images using statistical methods with image processing concepts. In Proceedings of the 2020 6th International Engineering Conference, Sustainable Technology and Development (IEC) 2020, Erbil, Iraq, 26–27 February 2020; pp. 169–173. [Google Scholar]
- Al-Ameen, Z. Contrast enhancement of digital images using an improved Type-II fuzzy set-based algorithm. Traitem. Signal 2021, 38, 39–50. [Google Scholar] [CrossRef]
- Kumar, B.S. Image fusion based on pixel significance using cross bilateral filter. Signal Image Video Process. 2015, 9, 1193–1204. [Google Scholar] [CrossRef]
- Zhan, K.; Shi, J.; Teng, J. Linking synaptic computation for image enhancement. Neurocomputing 2017, 238, 1–12. [Google Scholar] [CrossRef]


Publisher’s Note: MDPI stays neutral with regard to jurisdictional claims in published maps and institutional affiliations. |
© 2022 by the authors. Licensee MDPI, Basel, Switzerland. This article is an open access article distributed under the terms and conditions of the Creative Commons Attribution (CC BY) license (https://creativecommons.org/licenses/by/4.0/).