Abstract
Computer Aided Design (CAD) is a family of techniques that support the automation of designing and drafting 2D and 3D models with computer programs. CAD software is a software platform that provides the process from designing to modeling, such as AutoCAD or FreeCAD. Due to complex functions, the quality of CAD software plays an important role in designing reliable 2D and 3D models. There are many dependencies between defects in CAD software. Software testing is a practical way to detect defects in CAD software development. However, it is expensive to frequently run all the test cases for all functions. In this paper, we design an approach to learning to prioritize test cases for the CAD software, called PriorCadTest. The key idea of this approach is to quantify functional units and to train a learnable model to prioritize test cases. The output of the approach is a sequence of existing test cases. We evaluate PriorCadTest on seven modules of an open-source real-world CAD project, ArtOfIllusion. The Average Percentage of Fault Detect (APFD) is used to measure the effectiveness. Experimental results show that the proposed approach outperforms the current industrial practice without test case prioritization.
1. Introduction
Computer Aided Design (CAD) is a family of techniques that replaces manual designing and drafting models with an automated process [1]. CAD software is a software platform that provides the process from designing to modeling, such as AutoCAD [2] or FreeCAD [3]. CAD software, an indispensable tool for CAD technology applications, provides the capability and adaptability of graphic designing and drafting. Due to complex functions, many defects may be hidden in the CAD software. This badly hurts the output of CAD software, i.e., the generation of 2D and 3D models. Two major reasons result in the defects in CAD software. One is the complexity of functionality in CAD software; the other is the dependencies among the defects. It is important to find a way to trigger defects at an early stage. Thus, software testing is an indispensable step in the development process of CAD software [4].
The basic idea of testing CAD software is to run test cases to detect potential defects [5]. The updating of functionality of CAD software requires frequently running test cases. A direct way is to apply regression testing to run test cases to ensure a new code update does not violate existing functional behaviors [6]. However, due to the scale of functions in CAD software, it is expensive to frequently run all the test cases for all functions [7].
A solution to reduce the cost of running test cases is to prioritize test cases to find defects early. In this paper, we design an approach (called PriorCadTest) to learning to prioritize test cases for CAD software. The output of PriorCadTest is a sequence of existing test cases. The key idea of PriorCadTest is to quantify functional units (A functional unit can be a component, a package, or a function in different programming languages. In this evaluation of this paper, we evaluate the results on program functions). Then, each functional unit being tested is converted into a vector. PriorCadTest trains a learnable model from known test results and ranks tests for new functional units. To the best of our knowledge, this paper is the first work that prioritizes test cases for CAD software.
We evaluate the proposed approach on seven modules of an open-source CAD project, ArtOfIllusion (Project ArtOfIllusion, http://www.ArtOfIllusion.org/, accessed on 16 May 2022). In the evaluation, the Average Percentage of Fault Detect (APFD) that counts covered statements is used to measure the effectiveness of test case prioritization. We selected the model with the best ranking result from the models in comparison and used this model to validate against the test set. Experimental results show that the proposed approach outperforms the current industrial practice without test case prioritization.
Application scenario and motivation. The source code of the CAD software can be frequently updated due to the code updates. A common way to ensure that a new code update does not violate existing program behaviors is regression testing [8]. In general, the process of regression testing is to run all the test cases if the source code is updated. The proposed approach in this paper is to re-rank test cases to trigger potential defects as the early stage. Applying this approach can reduce the time cost of running test cases and save the time of developing CAD software.
Contributions. This paper makes the following main contributions.
- A new approach for ranking test cases for CAD software. We proposed an automatic approach for converting each functional unit or each test case into a 103-dimensional numeric vector. Then, each functional unit and each test case is combined into a pair, which is converted into a 206-dimensional vector based on the coverage relationship between CAD software functions and test cases. A learnable ranking model of test cases is trained using the data of 206-dimension vectors (Section 3).
- An experimental setup on six ranking models of learning and ranking test cases for CAD software (Section 4).
- Evaluation results of the proposed approach PriorCadTest with six ranking models on a real open-source CAD software, ArtOfIllusion. We find that the random forest classifier is effective in ranking the test case for CAD software (Section 5).
The rest of this paper is organized as follows. Section 2 shows the basic background of testing CAD software. Section 3 presents the design of our approach, PriorCadTest. Experimental setup and results are presented in Section 4 and Section 5. Section 6 discusses threats to validity. Finally, Section 7 concludes the paper and lists the future work.
2. Background
In this section, we discuss the background of CAD software, the background of software testing, and the related work.
2.1. CAD Software
CAD software is widely used in many fields, such as civil construction, machinery manufacturing, aerospace, landscape design, and urban planning. CAD software is a powerful tool for product innovation, with powerful graphic editing functions that enable accurate design of various 2D and 3D graphic models. The user interface of CAD software, which allows various operations to be performed through interactive menus or command lines. Meanwhile, CAD software supports secondary development. This highly increases the fields of applications. Figure 1 shows an example of using CAD software to draft a 3D model with three objects. Defects may be hidden in CAD software. This highly hurts the generation of CAD models.
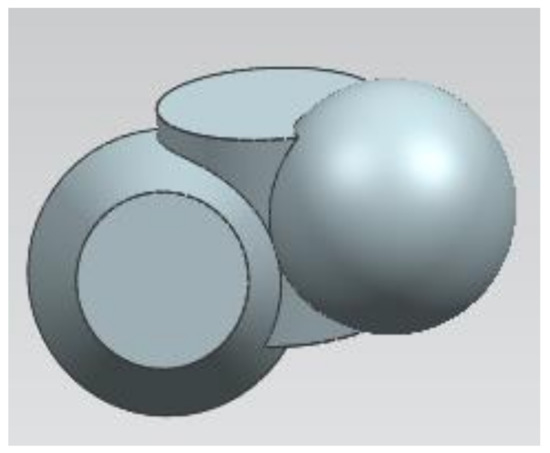
Figure 1.
Sketch of a 3D model drafted by the CAD software.
In terms of model types, models in the CAD software can be generally divided into 2D CAD models and 3D CAD models. A 2D CAD model consists of several components in plane geometry. A 3D CAD model is a computer representation of the actual shape of the product into a three-dimensional model, which includes various information about the points, lines, surfaces, and shape bodies of the solid geometry. Depending on the requirements, CAD software can also be divided into architectural CAD software, mechanical CAD software, circuit CAD software, etc. [9].
2.2. Software Testing
With the development of software and IT industry, the number of software products grows rapidly. Software quality has attracted much attention from developers. In the 1980s, the basic theory and practical techniques of software testing were gradually formed [10]. The purpose of software testing is to check whether the software system meets the requirements. Software testing has been integrated into the entire development process.
Automation testing is a technique of software testing that uses an automated tool to validate various software testing requirements, including the management and implementation of testing activities and the development and execution of test scripts [11,12]. Software automation testing techniques are also classified into various types for different applications. Software functional testing aims to test the functionality of the software by giving appropriate input values, determining the output and verifying the actual output using the expected values. Functional testing techniques is widely applied. For example, Abbot Java GUI Test Framework [13] is mainly used for automated testing of Java GUI tests. Soapui [14] is mainly applied to web service testing. This tool is used to test web service through HTTP protocol.
The existence of software defects greatly harms the quality of software and increases the cost of software maintenance. To detect software defects early, software testing becomes an essential stage in software development [15]. In software testing, developers design test cases in anticipation of early detection of potential software defects. Test cases are critical to reducing software defects in rapid code integration. A typical development process is test-driven development, designed to drive iterative code development with test cases generated ahead of code details [16]. To improve software quality, developers do everything they can to find, locate, analyze, and fix code defects. Typically, before a software is released, developers often write a set of supporting test cases to test the correctness and stability of the software based on the functions that need to be implemented and the possible execution paths of the software. However, due to the complexity of the software functions and structure, the set of supporting test cases written by the developers often cannot cover all the situations of the software operation, and all software defects still occur from time to time.
2.3. Related Work
We summarize the work related to CAD software testing and test case prioritization as follows.
Existing researchers have studied several research topics of testing CAD software. Frome [17] studied the perceptions of users or developers of a CAD system; results show that the users’ perceptions of a CAD system are quite different from the developers’.
Grinthal [18] introduced an overview of software quality assurance and its relation to user interfaces for CAD systems. Hallenbeck et al. [19] discussed a CAD supporting tool for designing a digital system that meets predefined testability requirements. Gelsinger et al. [20] proposed CAD tools, which are created to accelerate the design of the i486 CPU.
Sprumont and Xirouchakis [21] proposed a model of the CAD process that allows an adaptive man-machine task sharing by allocating the user interaction to the knowledge model. The CAD processes can be used to recursively define the CAD activities of high levels of abstraction. Wang and Nnaji [22] addressed a soft constraint representation scheme based on nominal intervals. Su and Zeng [23] introduced a test methodology that detects both catastrophic and parametric faults. Issanchou and Gauchi [24] proposed a novel feed-forward neural network model that considers the framework of the nonlinear regression models to construct designs. Veisz et al. [25] presented a comparison between the role of CAD and sketching in engineering. Their results suggest that it is necessary to emphasize the importance of sketching and the deep understanding to the utility of CAD tools at each stage of the design process.
Banerjee et al. [26] introduced a computer-aided-test (CAT) tool for mixed signal designs. The CAT tool provides a hardware efficient integrated solution. Bahar [27] presented the leading-edge research and development solutions, and identified future road-maps for design automation research areas. Ramanathan et al. [28] presented a novel approach to the test case prioritization problem that addresses this limitation. Chi et al. [29] proposed a new approach AGC (Additional Greedy method Call) sequence, the approach leverages dynamic relation-based coverage as measurement to extend the original additional greedy coverage algorithm in test case prioritization techniques. An empirical study [30] was conducted to examine the relative importance of the size and coverage attributes in affecting the fault detection effectiveness of a randomly selected test suite.
Gupta [31] proposed a novel prioritization algorithm that can be applied over both original and reduced test suites depending upon the size of test suites. Gupta [31] introduced search-based regression testing that is applied to improve the quality of the test suite in order to select a minimum set of test cases. The performance of different meta-heuristics for the test suite minimization problem is compared with a hybrid approach of the ant colony optimization and the genetic algorithm. Chen et al. [32] presented an adaptive random sequence approach based on clustering techniques using black-box optimization. Liu [33] studied the topic of ranking great amounts of documents based on their relation to a given query, i.e., the examination of the inner mechanics of the search engines. Mirarab and Tahvildari [34] proposed an approach based on the probability theory to incorporate source code changes, software fault-proneness, and test coverage into a unified model. Lin et al. [35] used a pairwise learning-to-rank strategy XGBoost to combine several existing metrics to improve the effectiveness of test case prioritization.
To the best of our knowledge, our work is the first technique that prioritizes test cases for CAD software via qualifying functional units. The idea of our work is to propose a practical way to reduce the time cost of frequent test execution.
3. Learning to Prioritize Test Cases for CAD Software, PriorCadTest
Our proposed approach, called PriorCadTest, learns to prioritize test cases for CAD software. This approach consists of two major phases, the learning phase and the ranking phase. The learning phase trains the ranking model based on known testing results, while the ranking phase uses the learned model to rank test cases for new functional unit. The ranking model in the approach is based on feature extraction. In this section, we show the overview, the feature extraction, the learning phase, and the ranking phase as follows.
3.1. Overview
Our proposed approach, PriorCadTest, aims to generate a sequence of test cases that are prioritized. The goal of this approach can prioritize test cases for a new functional unit (e.g., a new component of source code). Then, the prioritization can reduce the time of running test cases via triggering potential defects at the early stage.
Figure 2 shows the overview of the proposed approach to learning to prioritize test cases for CAD software. This approach consists of two major phases, the learning phase and the ranking phase. First, in the learning phase, a functional unit under test and a test case are converted into a function vector and a test vector, respectively. Each function vector and each test vector are connected into a vector. A learning model is then built based on the above extracted vectors. In our work, four machine learning models are used and the random forest model performs the best. Second, in the ranking phase, for any new functional unit, such as a new component under test, the ranking model combines the functional unit with each test. Such combination is also converted into a vector. Then, the ranking model ranks these vectors based on the ranking scores. The test case with the highest ranking score is ranked as the first in the sequence of running test cases.
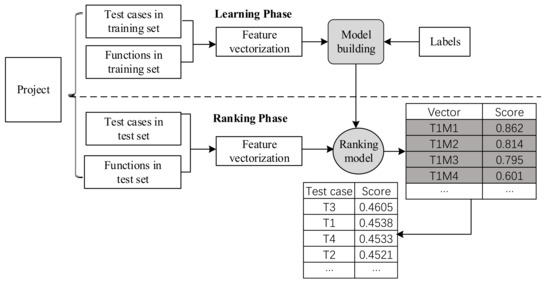
Figure 2.
Overview of the approach to learning to prioritize test cases for CAD software.
3.2. Feature Extraction
To train a ranking model for test case prioritization, we convert each functional unit and each test case into a numeric vector. In many programming languages, a test case is a specific function that can be directly run in the testing framework, such as Java test cases in Java testing framework, JUnit [36]. This facilitates the conversion from source code to numeric vectors. In our work, both functional units and test cases are converted into a vector with the same dimensions.
Vector conversion. In our approach PriorCadTest, an off-the-shelf tool, CodeZhi, is used to conduct the conversion. CodeZhi is a tool of qualifying Java source code (Project CodeZhi, http://cstar.whu.edu.cn/pr/codezhi/, accessed on 20 May 2022).This tool can extract features at the method level for Java programs. CodeZhi tries to find representative features, which can distinguish methods well. It picked up 103 features as the metrics to profile Java methods. For example, the CodeZhi tool profiles the function outset(double dist) to get a feature vector with 103 dimensions as shown in Figure 3. A piece of compilable source code is converted into a vector with 103 dimensions. Each dimension indicates a manual-defined feature. The categories of features consist of features about statements, variables, objects, methods, operators and operands, complexity, code blocks, nested blocks, jumping statement, finals and statics, assignments, and distance. For example, the number of if-conditions and the cyclomatic complexity of the source code can be viewed as two features in feature extraction [37]. We denote a vector of the functional unit as (), and m is the number of functional units. We denote a vector of the test case as (), and n is the number of test cases. Then, each of and is a feature vector with 103 dimensions.
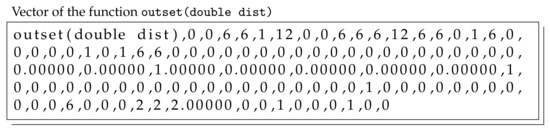
Figure 3.
Example of the feature vector of a function outset(double dist).
Test coverage matrix. In the CAD software, a functional unit may be covered by multiple test cases; and one test case may cover multiple functional units. We construct a test coverage matrix to show the coverage relationship between test cases and functional units. We run each test case and analyze test results to obtain a matrix C and in the train set, where indicates that the ith test case covers the jth functional unit. The value of is 1 if a test case has covered a functional unit , and 0 otherwise. Table 1 is an example of a test coverage matrix.

Table 1.
Example of a test coverage matrix. indicate the i-th test case and indicates the j-th functional unit.
Vectors with labels. In our work, each vector of a functional unit and each vector of a test case are connected into a vector. This vector is a pair of the functional unit and the test case, called a test pair in this paper. The vector contains 206 dimensions and indicates the qualification of the coverage , where indicates that the ith test case covers the jth functional unit. To train a model that ranks test cases, we use a classifier to assign scores to the test cases. In our work, we label a vector with 206 dimension as 1 if and the functional unit contains a defect; otherwise, we label the vector as 0. Such labeling shows that the value of the label indicates the test coverage of a functional unit with a defect. Base on the labeling, each vector of the test coverage (indicating the coverage of a functional unit by a test case) and its label are conducted. In the learning phase of our approach, the labels are known as 1 or 0; in the ranking phase, the label is unknown, and the ranking model will assign a score to each 206-dimension vector. Then test cases can be ranked according to the assigned scores of test cases.
3.3. Learning Phase
Based on the test pairs (i.e., combined vectors) and their labels, we employ a machine learning model to assign a score to each new test pair. In general, any classifier in machine learning can be workable. In our experiment, we use six classifiers to conduct the evaluation. We briefly describe the classifiers in our work.
The Classification and Regression Trees (CART) [38] represents a data-driven, model-based, nonparametric estimation method that implements the define-your-own-model approach. In other words, CART is a method that provides mechanisms for building a custom-specific, nonparametric estimation model based solely on the analysis of measurement project data, called training data. The random forest [39] is a combination of tree predictors such that each tree depends on the values of a random vector sampled independently and with the same distribution for all trees in the forest. The Support Vector Machine (SVM) [40] is a binary classification model whose basic model is a linear classifier defined by maximizing the interval on the feature space, which distinguishes it from a perceptron. SVM also includes kernel tricks, which make them essentially nonlinear classifiers. The learning strategy of SVM is interval maximization and can be formalized as a problem of solving convex quadratic programming. The Bayesian network is ideal for taking an event that occurred and for predicting the likelihood of a possible cause being the contributing factor. For example, a Bayesian network could represent the probabilistic relationships between diseases and symptoms. Convolutional neural network (CNN) [41] is a type of feed-forward neural network that includes convolutional computation. CNN is one of the representative algorithms of deep learning. Recurrent Neural Network (RNN) [42] is a type of recursive neural network that takes sequential data as input. The evolutionary direction of the sequence determines the next node of the recursion, and all nodes are connected in a chain-like manner. Given a classifier model, the test pairs and their labels can be used to build a concrete model that can be used in the follow-up ranking phase.
3.4. Ranking Phase
In the learning model, a classifier is built to show the coverage of functional units that contain defects. In the ranking phase, a new functional unit is connected with each test case to conduct a vector of 206 dimensions. This new vector (i.e., a test pair of the functional unit and the test case ) has no label, and the ranking model can assign a score to the vector. This score indicates the probability that the test case can cover potential defects. Then all the test cases can be ranked as a sequence based on the assigned scores.
In the ranking phase, the score of one test case is defined as the average learned probability of finding defects in all functional units by the test case. The definition is shown as follows:
where is the j-th functional unit, m is the number of all functional units under test, and is the learned probability for a test pair of the functional unit and the test case by the ranking model. A high value of means the i-th test case is likely to find defects.
4. Experimental Setup
In this section, we describe the research questions, the data preparation, and the evaluation metrics.
4.1. Research Questions
To evaluate the proposed approach, we design two research questions (RQs) to conduct the evaluation. In RQ1, we compare the effectiveness of machine learning models (including deep learning models) that could be embedded in our approach; In RQ2, we evaluate the ability of test case prioritization.
- RQ1. Can we find a better ranking model to prioritize test cases for CAD software? To save the time cost of defect detection, developers want to find out defects within a limited time. That is, developers need to automatically prioritize test cases before executing them. In this paper, we design RQ1 to explore the effectiveness of machine learning models in the model of test case prioritization.
- RQ2. How effective is the proposed approach in test case prioritization in testing CAD software? In CAD software, a single test case may cover multiple functions, and a single function may be covered by multiple test cases. Therefore, it is difficult for developers to determine which test case should be executed first. We design RQ2 to evaluate the ability of test case prioritization in testing CAD software.
4.2. Data Preparation and Implementation
Project under evaluation. To investigate the ranking of test cases in CAD software, we select the most widely-used open-source CAD software, Project ArtOfIllusion, as an experimental dataset. We select Project ArtOfIllusion based on the following reasons. First, to conduct the experiment, we need an open-source project; second, our approach relies on the conversion from source code to vector and the tool for such conversion, i.e., CodeZhi, is designed for Java programs; third, we tend to select a well-known CAD software in the evaluation. Based on the above three reasons, we check the CAD software written in Java in GitHub (Github, http://github.com/, accessed on 16 May 2022) and then select the one candidate, Project ArtOfIllusion. (Source code of Project ArtOfIllusion, http://github.com/ArtOfIllusion/ArtOfIllusion/, accessed on 16 May 2022). Project ArtOfIllusion is a free, multi-platform modeling, animation, and rendering suite written in Java programming language. ArtOfIllusion features a simple and streamlined interface to a broad array of powerful features, including key-frame-based and pose-based animations as well as a built-in raytracer. There are 15 modules in ArtOfIllusion, including animation, icons, image, keystroke, material, math, object, procedural, script, texture, titleImages, ui, unwrap, util, and view. There are seven modules with pre-defined test cases, i.e., module animation, math, object, procedural, raytracer, texture, and util. We use the source code and test cases in these seven modules. To increase the diversity of the datasets, we created a new dataset based on 5-fold cross validation [43]. We randomly divided all the files in the seven modules into five folds. Table 2 shows the summary of two datasets in Project ArtOfIllusion, including Dataset 1 with seven modules and Dataset 2 with five folds. Due to the limited development budget allocated for open-source projects, some of functions are not directly covered by manually-written test cases.
Table 2.
Dataset information with functions and test cases in Project ArtOfIllusion. # Functions indicates the number of functional units in the module. # Test Cases indicates the number of test cases that are manually-written for testing the module.
Defect seeding. We employ Project ArtOfIllusion in the evaluation. To conduct the scenario of triggering defects, we follow the existing work [44] and use program mutation to automatically seed defects in the source code of Project ArtOfIllusion. Program mutation is a technique of modifying the source code in a target program to create a defective program. The purpose of program mutation is to obtain a program with seeded defects [45]. To seed defects in the source code, we use a simple way to mutate the original source code. We select all functions without return values as the mutation candidates and apply mutation rules that remove 30% of the statements in functions. Such kinds of functions are considered as defective, and the other functions are considered as non-defective. Such mutation is easy to be implemented and can keep the programs compilable without any manual effort. The program mutation is implemented based on the Spoon tool (Spoon, http://spoon.gforge.inria.fr/, accessed on 17 May 2022). to remove the source code from the original code base. Figure 4 shows an example of seeding a defect via program mutation. The two code snippets are a function outset() before and after program mutation. The Mutation Code removes maxy += dist (line 7) and maxz += dist (line 8) from the Original Code.
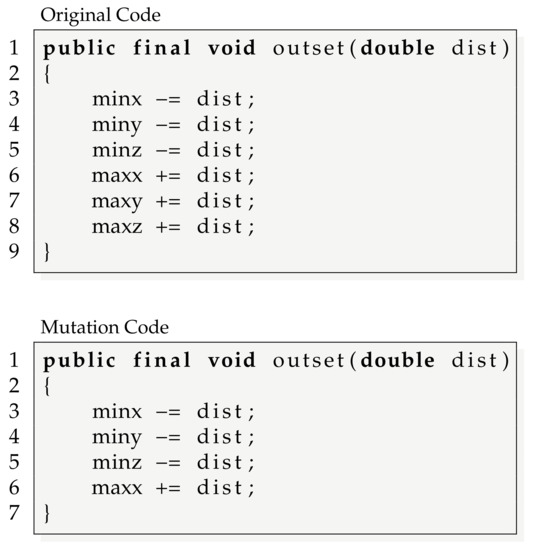
Figure 4.
Example of seeding a defect in a function outset().
Dataset. We conducted cross-validation experiments to evaluate the proposed approach. In the seven modules of Project ArtOfIllusion, we selected four modules with over 10 test cases as the test set of each round of evaluation. Then, module animation, math, object, and procedural are, respectively, selected as the test set; the remaining six modules are formed the train set. However, in module animation, no defective functions are covered by manually written test cases. Then, in the follow-up evaluation, we do not consider module animation as a test set. Finally, three rounds of cross-validation experiments are conducted. In the five folds of Project ArtOfIllusion, we used each fold in turn as the test set and the remaining four folds as the train set, and conducted five rounds of experiments. So we conducted eight rounds of experiments from different datasets in the whole Project ArtOfIllusion. Table 3 shows the data description of the train sets and the test sets of eight rounds of evaluation.
Table 3.
Data information of training sets and test sets. We show the division of training sets and test sets of eight rounds of evaluation. # Defective functions covered by tests is the number of defective functions that are covered by test cases.
Implementation. We implemented our approach in Spoon, Codezhi, and JaCoCo. Spoon is used in program mutation; CodeZhi is used in feature extraction; JaCoCo is used to collect test coverage and to filter out invalid mutants (JaCoCo, http://github.com/jacoco/jacoco/, accessed on 20 May 2022).
4.3. Evaluation Metrics
We evaluate the effectiveness of our approach with two sets of metrics, including as well as to show the performance of classifiers and to show the performance of ranking test cases.
Evaluating the classifiers in test case prioritization. We measured the evaluation of classifiers in the ranking models in test case prioritization with typical measurements: , , , and . Those measurements are defined based on True Positive (TP), False Positive (FP), False Negative (FN), and True Negative (TN) for test pairs, i.e., a vector that combines a functional unit and a test case.
- TP: # of defective test pairs that are predicted as defective.
- FP: # of undefective test pairs that are predicted as defective.
- FN: # of defective test pairs that are predicted as undefective.
- TN: # of undefective test pairs that are predicted as undefective.
Then, we defined the metrics in the evaluation of prediction as follows,
where is the proportion of returned results that are truly correct; is the proportion of the truly correct number in all retrieved results in the test set; is the trade-off between and ; and is the proportion of the correct number in all results in the whole dataset.
Evaluating the ranking of test cases in test case prioritization. Suppose the program under test contains k defects and the set of test cases contains n test cases. We use the Average Percentage of Fault Detect (APFD) [46] to evaluate the effectiveness of the ranking of test cases generated by each of the ranking models.
where denotes the test case in the ranking of test cases that first covers the kth defect in the program. That is, a high value of the APFD metric indicates the defects are defective in the early stage.
5. Experimental Results
In this section, we present the evaluation results and empirically answer the two RQs about the effectiveness.
5.1. RQ1. Can We Find a Better Ranking Model to Prioritize Test Cases for CAD Software?
The goal of our work PriorCadTest is to re-rank test cases to trigger defects early. This can reduce the time cost of frequently running test cases. PriorCadTest relies on a ranking model, which is a binary classifier in machine learning. In RQ1, we check the effectiveness of six different classifiers based on the dataset of Project ArtOfIllusion.
Method. The evaluation method in the section is to compare the results of the proposed approach, PriorCadTest, when we change the machine learning algorithms (including deep learning algorithms). First, we extracted functions and their corresponding test cases from Project ArtOfIllusion and constructed a test coverage matrix between functions and test cases; second, we vectorized functions and test cases using the CodeZhi tool and merged the functions and test cases according to the test coverage matrix; finally, we trained six learning-based ranking models, respectively. The six ranking models are the decision trees (CART), the random forest (RF), the SVM, the Bayesian networks (BN), the convolutional neural networks (CNN), and the recurrent neural network (RNN).
Result and analysis. We trained six ranking models and evaluated the effectiveness using , , , , , and . Table 4 shows the evaluation results on the six ranking models for eight rounds of evaluation. As shown in Table 4, the CART and the random forest outperform the SVM, the Bayesian networks according to the values of four evaluation metrics in all the test sets. As shown in Table 4, the CART and the random forest outperform the SVM, the Bayesian networks, the CNN, and the RNN according to the values of four evaluation metrics (, , , and ) in all the test sets. When the SVM model ranks the test cases, it predicts all functions as non-defective functions. Thus, the values of and are not available (N/A) for the SVM model when we use Module object as the test set. The values of and are N/A for the SVM model, the CNN model, and the RNN model when we use Module object and Fold 4 as the test set. In terms of , the CART model is lower than the random forest model in all test sets. This shows that the random forest model is better at truly predicting defects for three different test sets. The random forest model does not perform well in terms of memory consumption and time consumption based on two different datasets. In terms of , the CART model is higher than the random forest model. The CART model is also slightly higher than the random forest model when we compare the values of and . The evaluation metrics of the random forest model also performs well in the evaluation.
Table 4.
Results of six ranking models under six evaluation metrics. is the proportion of returned results that are truly correct; is the proportion of the truly correct results in all retrieved results from the test set; is the trade-off between and ; is the proportion of correct results in all results from the whole data set; is the time consumption on the test set; and is the memory consumption on the test set. N/A indicates the denominator is zero.
Conclusion. The main purpose of this paper is to trigger defects in CAD software by test cases in the early stage. The results in Table 4 show that the CART model and the random forest model are better than the other ranking models.
5.2. RQ2. How Effective Is the Proposed Approach in Test Case Prioritization in Testing CAD Software?
We evaluate whether the ranking of test cases can trigger the defects early. During testing the CAD software, given the same set of test cases, if a sequence of test cases (i.e., a ranked list of test cases) can trigger defects earlier than another sequence of test cases, we consider the earlier sequence is better. The effectiveness of such sequences of test cases can be evaluated with the pre-defined APFD metric [46]. A high value of APFD indicates an effective sequence of test case ranked. We designed RQ2 to evaluate the test case sequences.
Method. In the comparison, we employed the random ranking of test cases as a baseline. We validated the test cases, respectively, for the CART, the random forest, the SVM, the Bayesian networks, the CNN, and the RNN. In our study, the number of triggered defects in top-10, top-20, and top-30 test cases of each test case sequence is reported as a metric to evaluate the capability of the ranking model. A high value of the number of defects detected in top-k indicates that the test case ranking performs well.
Result and analysis. Table 5 shows the evaluation results of ranking test cases for the CAD software. Table 5 demonstrates that among the top-10 test cases. The Bayesian networks can find the least number of defects and the random forest detects the most defects from dataset one. In the top-20 test cases, the random ranking finds the least number of defects and the random forest model detects the most defects for most modules, but the values are the same in module procedura, module math, and part 2. The reason is that the number of defective functions is less than 20. In the top-30 test cases, the random ranking model detects the least number of defects and the random forest model detected the most defects for most modules, but the values are equal in module procedura, module math, and Fold 2. The number of defective functions is less than 30. Among the five models in comparison, the random forest model shows the largest APFD value and the random ranking model shows the smallest value.
Table 5.
Evaluation results of the six models and the baseline of random rankings. We show the result in top-10, top-20, top-30, and the APFD. The top-k metric indicates the number of defects that are found by the top k test cases in an ordered sequence of test cases. The zero value in the evaluation metrics means that no defective method is detected by the test cases.
To show details, we use Table 6 to directly present one example of the top-10 results of ranking test cases by the random forest model. As shown in Table 6, point_outside_influence_ radius_is_0 and point_inside_radius_is_greater_than_1 have the highest value (0.4605) among the top-10 test cases. This means that these two test cases are more likely to find defects than the other test cases.
Table 6.
Top-10 of results of ranking test cases based on the random forest model. Function is the name of a test case. Score is the average probability that a test case is identified in the model. A higher value indicates that the test case is more likely to trigger a defect.
Conclusion. Experimental results show that the random forest model is able to find the highest number of defects in the top-k metric compared with the other six models. This means that the random forest model is more capable of ranking test cases. Therefore, we consider that the random forest should be an effective choice for finding defects.
6. Discussion
In the paper, we propose an approach to learning to prioritize test cases for CAD software. We present the discussions as follows. We present the threats as follows.
Generality. We evaluated the effectiveness of our approach PriorCadTest with an open-source CAD software, Project ArtOfIllusion. Experimental results show that the proposed approach to test case prioritization is better than the current practice. In the evaluation, Project ArtOfIllusion is implemented in the Java programming language. However, our proposed approach can be applied to test case prioritization in CAD projects that are written in other programming languages, like C or C#. The proposed approach can be generalized via the implementation on qualifying functions in other programming languages.
Industrial practice. In current industrial practice, the test case prioritization in development of CAD software is immature. Most of the CAD projects directly apply the whole test suite to conduct the testing process. This is expensive since the version update is common in the development of CAD software. The basic goal of test case prioritization in this paper can be viewed as a trial on reducing the time cost of testing in CAD software.
7. Conclusions and Future Work
In this paper, we propose an approach to learning to prioritize test cases for CAD software, called PriorCadTest. Our proposed approach combines vectors of test cases and vectors of functional units according to the coverage matrix. The combined vectors are employed as the input to train a random forest classifier to category test cases. For a new module or component under test, the trained model is used to assign a score to each candidate test case. In the evaluation, we employ an open-source real-world CAD software, Project ArtOfIllusion as the dataset.
In future work, we plan to apply our approach to CAD software in other programming languages. We want to collect defect data from other CAD software to show the results in the evaluation. The approach in this paper aims to test functional units in the source code. In CAD software, a single function may be combined into a mixture of several application scenarios. For example, a function could be a cylindrical model, a conical model, a ball model, or their combinations. In future work, we plan to explore the construction of test coverage matrix across functional units. Improving the effectiveness of our approach is also a direction for future work. Our proposed approach combines the test cases with function features based on the test coverage matrix. The test coverage matrix may be a sparse matrix, which may take a long running time in the model training. Thus, we plan to explore other data structures to replace the test coverage matrix to reduce the space complexity. Meanwhile, to save the execution time of PriorCadTest, we will parallel the implementation of our approach in future work. We plan to explore to combine the random forest model with new strategies to save on the time and memory cost.
Author Contributions
Data curation, S.L.; Funding acquisition, J.X.; Investigation, F.Z. and J.X.; Methodology, Y.X.; Project administration, G.Z.; Software, F.Z. and F.Y.; Writing—original draft, S.L.; Writing—review & editing, J.X. All authors have read and agreed to the published version of the manuscript.
Funding
This work is supported by the National Key R&D Program of China under Grant No. 2020YFB1709000, the National Natural Science Foundation of China under Grant Nos. 61872273, 62141221, and 62202344.
Institutional Review Board Statement
Not applicable.
Informed Consent Statement
Not applicable.
Data Availability Statement
The dataset and the prototype of PriorCadTest in Java programming language are publicly available at http://cstar.whu.edu.cn/p/priorcad/, accessed on 29 August 2022.
Conflicts of Interest
The authors declare no conflict of interest.
References
- Singh, J.; Perera, V.; Magana, A.J.; Newell, B.; Wei-Kocsis, J.; Seah, Y.Y.; Strimel, G.J.; Xie, C. Using machine learning to predict engineering technology students’ success with computer-aided design. Comput. Appl. Eng. Educ. 2022, 30, 852–862. [Google Scholar] [CrossRef]
- Lane, H.C.; Zvacek, S.; Uhomoibhi, J. (Eds.) Computer Supported Education. In Proceedings of the 11th International Conference on Computer Supported Education, CSEDU 2019, Heraklion, Greece, 2–4 May 2019; SciTePress: Setubal, Portugal, 2019; Volume 2. [Google Scholar]
- Hatton, D. eights: BS 8888: 2011 first angle projection drawings from FreeCAD 3D model. J. Open Source Softw. 2019, 4, 974. [Google Scholar] [CrossRef]
- Agarwal, S.; Sonbhadra, S.K.; Punn, N.S. Software Testing and Quality Assurance for Data Intensive Applications. In Proceedings of the EASE 2022: The International Conference on Evaluation and Assessment in Software Engineering 2022, Gothenburg, Sweden, 13–15 June 2022; pp. 461–462. [Google Scholar] [CrossRef]
- Karadzinov, L.; Cvetkovski, G.; Latkoski, P. (Eds.) Power control in series-resonant bridge inverters. In Proceedings of the IEEE EUROCON 2017—17th International Conference on Smart Technologies, Ohrid, North Macedonia, 6–8 July 2017; IEEE: New York, NY, USA, 2017. [Google Scholar]
- Selvaraj, H.; Chmaj, G.; Zydek, D. (Eds.) FPGA Implementation for Epileptic Seizure Detection Using Amplitude and Frequency Analysis of EEG Signals. In Proceedings of the 25th International Conference on Systems Engineering, ICSEng 2017, Las Vegas, NV, USA, 22–24 August 2017; IEEE Computer Society: New York, NY, USA, 2017. [Google Scholar]
- Chi, Z.; Xuan, J.; Ren, Z.; Xie, X.; Guo, H. Multi-Level Random Walk for Software Test Suite Reduction. IEEE Comput. Intell. Mag. 2017, 12, 24–33. [Google Scholar] [CrossRef]
- Ali, N.B.; Engström, E.; Taromirad, M.; Mousavi, M.R.; Minhas, N.M.; Helgesson, D.; Kunze, S.; Varshosaz, M. On the search for industry-relevant regression testing research. Empir. Softw. Eng. 2019, 24, 2020–2055. [Google Scholar] [CrossRef]
- Lanchares, J.; Garnica, O.; de Vega, F.F.; Hidalgo, J.I. A review of bioinspired computer-aided design tools for hardware design. Concurr. Comput. Pract. Exp. 2013, 25, 1015–1036. [Google Scholar] [CrossRef]
- Yue, T.; Arcaini, P.; Ali, S. Quantum Software Testing: Challenges, Early Achievements, and Opportunities. ERCIM News 2022, 2022, 128. [Google Scholar]
- Denisov, E.Y.; Voloboy, A.G.; Biryukov, E.D.; Kopylov, M.S.; Kalugina, I.A. Automated Software Testing Technologies for Realistic Computer Graphics. Program. Comput. Softw. 2021, 47, 76–87. [Google Scholar] [CrossRef]
- Xuan, J.; Martinez, M.; Demarco, F.; Clement, M.; Marcote, S.R.L.; Durieux, T.; Berre, D.L.; Monperrus, M. Nopol: Automatic Repair of Conditional Statement Bugs in Java Programs. IEEE Trans. Software Eng. 2017, 43, 34–55. [Google Scholar] [CrossRef]
- IEEE Publisher. In Proceedings of the 5th IEEE/ACM International FME Workshop on Formal Methods in Software Engineering, FormaliSE@ICSE 2017, Buenos Aires, Argentina, 27 May 2017; IEEE: New York, NY, USA, 2017.
- Radhakrishna, S.; Nachamai, M. Performance inquisition of web services using soap UI and JMeter. In Proceedings of the 2017 IEEE International Conference on Current Trends in Advanced Computing (ICCTAC), Bangalore, India, 2–3 March 2017; IEEE: New York, NY, USA, 2017; pp. 1–5. [Google Scholar]
- Ma, P.; Cheng, H.; Zhang, J.; Xuan, J. Can this fault be detected: A study on fault detection via automated test generation. J. Syst. Softw. 2020, 170, 110769. [Google Scholar] [CrossRef]
- Omri, S. Quality-Aware Learning to Prioritize Test Cases. Ph.D. Thesis, Karlsruhe Institute of Technology, Karlsruhe, Germany, 2022. [Google Scholar]
- Frome, F.S. Improving color CAD Systems for Users: Some Suggestions from Human Factors Studies. IEEE Des. Test 1984, 1, 18–27. [Google Scholar] [CrossRef]
- Grinthal, E.T. Software Quality Assurance and CAD User Interfaces. IEEE Des. Test 1986, 3, 39–48. [Google Scholar] [CrossRef]
- Hallenbeck, J.J.; Kanopoulos, N.; Vasanthavada, N.; Watterson, J.W. CAD Tools for Supporting System Design for Testability. In Proceedings of the International Test Conference 1988, Washington, DC, USA, 12–14 September 1988; p. 993. [Google Scholar] [CrossRef]
- Gelsinger, P.; Iyengar, S.; Krauskopf, J.; Nadir, J. Computer aided design and built in self test on the i486TM CPU. In Proceedings of the 1989 IEEE International Conference on Computer Design (ICCD): VLSI in Computers and Processors, Cambridge, MA, USA, 2–4 October 1989; pp. 199–202. [Google Scholar] [CrossRef]
- Sprumont, F.; Xirouchakis, P.C. Towards a Knowledge-Based Model for the Computer Aided Design Process. Concurr. Eng. Res. Appl. 2002, 10, 129–142. [Google Scholar] [CrossRef]
- Wang, Y.; Nnaji, B.O. Solving Interval Constraints by Linearization in Computer-Aided Design. Reliab. Comput. 2007, 13, 211–244. [Google Scholar] [CrossRef]
- Su, F.; Zeng, J. Computer-Aided Design and Test for Digital Microfluidics. IEEE Des. Test Comput. 2007, 24, 60–70. [Google Scholar] [CrossRef]
- Issanchou, S.; Gauchi, J. Computer-aided optimal designs for improving neural network generalization. Neural Netw. 2008, 21, 945–950. [Google Scholar] [CrossRef] [PubMed]
- Veisz, D.; Namouz, E.Z.; Joshi, S.; Summers, J.D. Computer-aided design versus sketching: An exploratory case study. Artif. Intell. Eng. Des. Anal. Manuf. 2012, 26, 317–335. [Google Scholar] [CrossRef]
- Banerjee, S.; Mukhopadhyay, D.; Chowdhury, D.R. Computer Aided Test (CAT) Tool for Mixed Signal SOCs. In Proceedings of the 18th International Conference on VLSI Design (VLSI Design 2005), with the 4th International Conference on Embedded Systems Design, Kolkata, India, 3–7 January 2005; pp. 787–790. [Google Scholar] [CrossRef]
- Bahar, R.I. Conference Reports: Recap of the 37th Edition of the International Conference on Computer-Aided Design (ICCAD 2018). IEEE Des. Test 2019, 36, 98–99. [Google Scholar] [CrossRef]
- Ramanathan, M.K.; Koyutürk, M.; Grama, A.; Jagannathan, S. PHALANX: A graph-theoretic framework for test case prioritization. In Proceedings of the 2008 ACM Symposium on Applied Computing (SAC), Fortaleza, Brazil, 16–20 March 2008; pp. 667–673. [Google Scholar] [CrossRef]
- Chi, J.; Qu, Y.; Zheng, Q.; Yang, Z.; Jin, W.; Cui, D.; Liu, T. Relation-based test case prioritization for regression testing. J. Syst. Softw. 2020, 163, 110539. [Google Scholar] [CrossRef]
- Wong, W.E.; Horgan, J.R.; London, S.; Agrawal, H. A study of effective regression testing in practice. In Proceedings of the Eighth International Symposium on Software Reliability Engineering, ISSRE 1997, Albuquerque, NM, USA, 2–5 November 1997; pp. 264–274. [Google Scholar] [CrossRef]
- Gupta, P.K. K-Step Crossover Method based on Genetic Algorithm for Test Suite Prioritization in Regression Testing. J. Univers. Comput. Sci. 2021, 27, 170–189. [Google Scholar] [CrossRef]
- Chen, J.; Zhu, L.; Chen, T.Y.; Towey, D.; Kuo, F.; Huang, R.; Guo, Y. Test case prioritization for object-oriented software: An adaptive random sequence approach based on clustering. J. Syst. Softw. 2018, 135, 107–125. [Google Scholar] [CrossRef]
- Liu, T. Learning to Rank for Information Retrieval; Springer: New York, NY, USA, 2011. [Google Scholar] [CrossRef]
- Mirarab, S.; Tahvildari, L. A Prioritization Approach for Software Test Cases Based on Bayesian Networks. In Proceedings of the Fundamental Approaches to Software Engineering, 10th International Conference, FASE 2007, Held as Part of the Joint European Conferences, on Theory and Practice of Software, ETAPS 2007, Braga, Portugal, 24 March–1 April 2007; pp. 276–290. [Google Scholar] [CrossRef]
- Lin, C.; Yuan, S.; Intasara, J. A Learning-to-Rank Based Approach for Improving Regression Test Case Prioritization. In Proceedings of the 28th Asia-Pacific Software Engineering Conference, APSEC 2021, Taipei, Taiwan, 6–9 December 2021; IEEE: New York, NY, USA, 2021; pp. 576–577. [Google Scholar] [CrossRef]
- Petric, J.; Hall, T.; Bowes, D. How Effectively Is Defective Code Actually Tested?: An Analysis of JUnit Tests in Seven Open Source Systems. In Proceedings of the 14th International Conference on Predictive Models and Data Analytics in Software Engineering, PROMISE 2018, Oulu, Finland, 10 October 2018; pp. 42–51. [Google Scholar] [CrossRef]
- Zou, W.; Xuan, J.; Xie, X.; Chen, Z.; Xu, B. How does code style inconsistency affect pull request integration? An exploratory study on 117 GitHub projects. Empir. Softw. Eng. 2019, 24, 3871–3903. [Google Scholar] [CrossRef]
- Belli, E.; Vantini, S. Measure Inducing Classification and Regression Trees for Functional Data. arXiv, 2020; arXiv:2011.00046v1. [Google Scholar] [CrossRef]
- Samigulina, G.A.; Samigulina, Z.I. Immune Network Technology on the Basis of Random Forest Algorithm for Computer-Aided Drug Design. In Proceedings of the Bioinformatics and Biomedical Engineering—5th International Work-Conference, IWBBIO 2017, Proceedings Part I, Lecture Notes in Computer Science, Granada, Spain, 26–28 April 2017; Rojas, I., Guzman, F.M.O., Eds.; Volume 10208, pp. 50–61. [Google Scholar] [CrossRef]
- Hamid, L.B.A.; Khairuddin, A.S.M.; Khairuddin, U.; Rosli, N.R.; Mokhtar, N. Texture image classification using improved image enhancement and adaptive SVM. Signal Image Video Process. 2022, 16, 1587–1594. [Google Scholar] [CrossRef]
- Atik, I. A New CNN-Based Method for Short-Term Forecasting of Electrical Energy Consumption in the Covid-19 Period: The Case of Turkey. IEEE Access 2022, 10, 22586–22598. [Google Scholar] [CrossRef]
- Xie, B.; Zhang, Q. Deep Filtering with DNN, CNN and RNN. arXiv, 2021; arXiv:2112.12616v1. [Google Scholar] [CrossRef]
- Guidotti, D. Verification and Repair of Machine Learning Models. Ph.D. Thesis, University of Genoa, Genoa, Italy, 2022. [Google Scholar]
- Gu, Y.; Xuan, J.; Zhang, H.; Zhang, L.; Fan, Q.; Xie, X.; Qian, T. Does the fault reside in a stack trace? Assisting crash localization by predicting crashing fault residence. J. Syst. Softw. 2019, 148, 88–104. [Google Scholar] [CrossRef]
- Moraglio, A.; Silva, S.; Krawiec, K.; Machado, P.; Cotta, C. (Eds.) Genetic Programming. In Proceedings of the 15th European Conference, EuroGP 2012, Málaga, Spain, 11–13 April 2012; Lecture Notes in Computer Science. Springer: New York, NY, USA, 2012; Volume 7244. [Google Scholar] [CrossRef]
- Rothermel, G.; Untch, R.H.; Chu, C.; Harrold, M.J. Prioritizing Test Cases For Regression Testing. IEEE Trans. Softw. Eng. 2001, 27, 929–948. [Google Scholar] [CrossRef]
Publisher’s Note: MDPI stays neutral with regard to jurisdictional claims in published maps and institutional affiliations. |
© 2022 by the authors. Licensee MDPI, Basel, Switzerland. This article is an open access article distributed under the terms and conditions of the Creative Commons Attribution (CC BY) license (https://creativecommons.org/licenses/by/4.0/).