Abstract
In urban environments, radiation energy from the sun becomes a heat load on the human body. The radiation energy can be divided into visible, near-infrared, and far-infrared wavelengths. Far-infrared radiation is re-emitted from structures that have been warmed by the sun. On the other hand, visible and near-infrared light comes directly or reflected from structures. However, previous studies have measured environmental changes using only far-infrared cameras to study urban heat island (UHI) countermeasures. Therefore, it is important to measure the environmental radiation energy at each wavelength region to properly discuss the cause of the heat load. To conduct the measurements, we used three cameras operating at different wavelengths: visible, near-infrared, and far-infrared. In addition, the measurements were conducted in different urban locations, seasons, and weather conditions in the Tokyo area of Japan, an urban metropolis. The results for far-infrared wavelengths show that, in summer when the temperature is high, all structures except the sky have a positive heat load on the human body, while, in winter or cloudy weather when the temperature is low, the heat load on the human body is negative. The results of heat load measurements at visible and near-infrared wavelengths show that the heat load varies greatly depending on the proportion of sky, plants, and buildings, despite the proportion of ground area being the same. These results indicate that the differences in radiation wavelengths need to be considered when considering reducing the heat load on the human body in urban environments. Therefore, the proposed method could contribute to the development of more effective UHI countermeasures by measuring in a various environments and countries.
1. Introduction
The urban heat island (UHI) is becoming a serious issue globally. Tan et al. [1,2] investigated the effect of the UHI on human health from 30 years of meteorological records in Shanghai, China, and its surrounding areas. They concluded that the UHI increased the number of hot days, defined as the days exceeding 35 °C in maximum temperature in a day, in urban areas. It causes adverse human health and heightened heat-related mortality in urban regions. The high temperature of the daytime hours causes health problems, and symptoms of heat stress, heatstroke, and dehydration occur more often in large cities regardless of the climatic region [3,4]. Furthermore, with 68% of the world’s population expected to live in cities by 2050 [5], it is becoming increasingly important to advance research and response measures to rising temperatures, including the UHI [6].
The main cause of the UHI is that the absorbed solar radiation by urban structures is re-emitted as heat radiation from them [7]. However, the re-emitted radiation becomes a complex issue because it is heavily influenced by urban features such as buildings and the extent of vegetation. Moreover, the abovementioned issues include the influences from changes in the sunlight from seasonal changes and time of day. Therefore, it is not easy to quantitatively analyze and, thus, mitigate the causes of UHI [8].
Many researchers are investigating and quantifying the UHI in various cities [9,10,11,12,13,14,15,16,17,18]. As a result, it was pointed out that the heat island effect is not only caused by the radiation from urban structures but also by the large amount of heat generated by vehicles, powerplants, and air conditioners heating the atmosphere. The resulting increase in atmospheric temperature leads to increased energy consumption. To solve this problem, it is important to reduce energy consumption as much as possible. Kalbasi et al. [18] showed that energy savings could be realized when a phase change material (PCM) was used for walls and ceilings by selecting the material appropriately in accordance with the local environmental conditions. In addition to these building insulation effects, there is also growing discussion on heat radiation, such as improving materials used in urban buildings and increasing vegetation to reduce solar heat re-radiation [10].
To realize a comfortable urban environment, it is necessary to understand the heat load to the human body caused by radiation in urban environments. Yamaguchi et al. [19] analytically evaluated the exchange of heat radiation between the outdoor environment and the human body, assuming a street space flanked by buildings and space with buildings on only one side. As a result, presence or absence of the structures strongly influenced the exchange of heat radiation between the human body and the surrounding environment. In addition, the factors that contributed to a flux of heat radiation in the outdoor environments were quantitatively evaluated in [20,21,22,23,24]. Yu et al. [25] used a far-infrared camera to measure the surface temperature of the environment from specific locations to quantify the sensible heat flux in the urban landscape. The surface temperatures of road, grassland, tree, wall, water, and air in the environment changed with time, and the maximum surface temperature of the wall exceeded 55 °C in summer. In summer, the highest surface temperature of the wall was over 55 °C. In particular, the wall and road temperature increased significantly, and the highest surface temperature was observed between noon and 2 p.m.
In the study of UHI, quantitative investigations in the far-infrared wavelength range have been conducted to evaluate the temperature and radiation of structures heated by sunlight. However, of the total energy of sunlight calculated on the basis of the Planck function (temperature of sun Tsun assumed to be 5778 K), far-infrared light (wavelength λ above 2.5 µm) accounts for about 3.1%. In contrast, visible light (λ = 0.4 to 0.7 µm) and near-infrared light (λ = 0.7 to 2.5 µm) account for the remaining 36.7% and 47.7%, respectively. The far-infrared wavelengths of the heat load on humans were mainly due to the radiation emitted from any structures, including the sky, plants, ground, or any other structures such as buildings warmed by sunlight. On the other hand, visible and near-infrared radiation from the sun can reach humans directly or after being reflected by any structures; therefore, it is believed to have a significant impact on the exchange of heat between humans and the environment. Thus, the data obtained by previous researchers [20,21,22,23,24,25], who mainly studied the far-infrared wavelength range, are insufficient for analyzing the effects of radiation in each wavelength range on the UHI.
The radiation from the environment to the human body can be divided into three categories: (A) direct radiation from the sun to the human body, (B) radiation reflected or scattering by any structures, and (C) radiation from any warmed structures. Far-infrared measurements can only contribute to factors categorized in (C). Thus, we propose a method for measuring visible, near-infrared, and far-infrared radiation from environments with the aim of investigating the effect of the radiation energy (A) to (C) on the exchange of heat between the human body and the environment. To demonstrate the usefulness of the proposed method, we perform measurement experiments using charge-coupled device (CCD) cameras under visible, near-infrared, and far-infrared wavelengths at different locations, seasons, and weather conditions. The experiments revealed that the proposed method provides an overview of the effects of heat radiation in different wavelengths on the human body and could be a tool for characterizing the effects of heat radiation on human body.
2. Characterization of CCD Cameras
2.1. Assessment of Intensity of Radiation from Measured Data of CCD Cameras
To record at different wavelength ranges, we used a visible-light camera (Bitran Corporation, BU-51LN, λ = 0.4–1.0 µm), a near-infrared light camera (IRspec Corporation, NVU3VL, λ = 1.0–1.7 µm), and a far-infrared light camera (FLIR Systems Inc., Lepton 3.5, 160 × 120, 57°, λ = 8–14 µm). These cameras have image sensors that have enough measurement sensitivity in each wavelength range and can record luminance data as images according to the irradiance intensity. To examine the heat exchange between the human body and the environment, it is necessary to derive the radiation intensity i [W/(m2·sr)] from the luminance data D [-] measured as image data by the cameras. For this purpose, we prepared a light source with a known radiation intensity to know the relationship between the value of i and D. The methods of the derivation of radiation intensity for each camera are described in Section 2.1.1 and Section 2.1.2.
2.1.1. Visible Camera and Near-Infrared Camera
For this calibration experiment, a sunlight simulator (San-ei Electronics Co., Ltd., XES-50S2-TT) with a wavelength distribution similar to that of sunlight reaching the ground was used as a known value of radiation intensity. The light from the sunlight simulator was shone on a standard diffuse reflector (hemispherical reflectance at visible and near-infrared wavelengths (λ = 0.25–2.5 µm) ρref = 0.99), and the reflected light was measured by the visible camera or near-infrared camera as shown in Figure 1. This experimental setup was selected because the reflected intensity of the light source can be derived numerically and the value of i can be known. In general, solar energy reaching the ground Eground [W/m2] is about 1.0 kW/m2 [26]. Assuming that the wavelength distribution of the solar energy Eb [W/m2] has the same distribution as the Planck function [27] due to the solar temperature Tsun [K], the relationship between Eground and Eb is as follows using the constant value R [-] and Stefan–Boltzmann constant σ [W/m2·K4]:
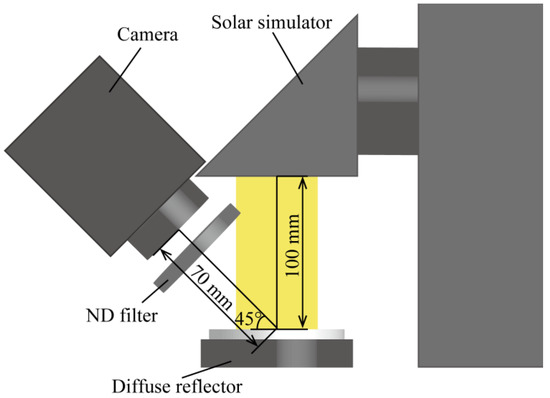
Figure 1.
Experimental system for visible and near-infrared light camera calibration.
The spectral reflected intensity idr,λ from the standard diffuse reflector exposed to the solar simulator is given by the reflector ρdr. Then, idr can be obtained by integrating idr,λ over the range of visible wavelengths or near-infrared wavelengths, as shown below.
Referring to the camera’s catalog specifications [28], the visible-light camera used in this study has a linear relationship between the energy of the incident radiation Qv on the camera’s sensor and the camera’s luminance data Dv. On the other hand, the near-infrared camera [29] has a logarithmic relationship between the incident radiation Qn and the camera’s luminance data Dn. However, these catalog specifications do not guarantee the evaluation of light sources containing light of various wavelengths, such as sunlight. Therefore, it becomes necessary to measure the camera luminance data D in response to changes in solar light energy. In this study, we used neutral density (ND) filters (SIGMAKOKI CO., LTD., MAN-25-1–70) to change the light energy of the solar simulator without changing the wavelength distribution as shown in Figure 1. In this method, Dobj measured was compared to the reflection data Ddr measured from the white diffuse reflector with ND filters, where the observed object was assumed to be a gray body with hemispherical isotropic reflections.
The measurement results of this calibration experiment are shown in Figure 2. The vertical axis shows the raw data of the camera luminance data D. The horizontal axis, i, is the value taken with respect to idr, the value obtained by integrating Equation (3) over the wavelength range in which each camera can measure. The plotted data are the average value of the central area of the diffuse reflector, and the error bars are its standard deviation. This averaging process is detailed in the Supplementary Materials (Section SA). As can be seen from the graph, the luminance data D obtained by the cameras decreases as the light intensity is reduced by the ND filters. These results reveal that the visible-light camera has a linear relationship and the near-infrared light camera has a logarithmic relationship, indicating that the intensity iobj can be evaluated from the luminance data Dobj as follows:
where Cv and are coefficients for linear approximation, and Cn and are coefficients for logarithmic approximation. These coefficients were calculated using the least-squares method. The correlation coefficient r2 is shown in each figure.
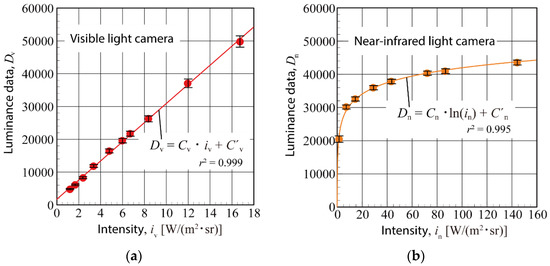
Figure 2.
Measurement results for calibration experiment of (a) visible-light camera and (b) near-infrared light camera.
2.1.2. Far-Infrared Camera
The far-infrared camera used in this study is a bolometer-type camera that can obtain the illuminance data Df,obj proportional to the radiation energy from the temperature changes caused by the temperature exchange of the radiation between the camera sensor and the object observed in environmental experiment by the camera. Through calibration experiments, the temperature of the observed object Ts and the intensity of the radiation emitted from the material if,obj can be derived from the illuminance data obtained by this far-infrared camera. This makes it possible to evaluate the heat exchange between the environment and the human body. The system of the calibration experiments conducted in this study is shown in Figure 3.
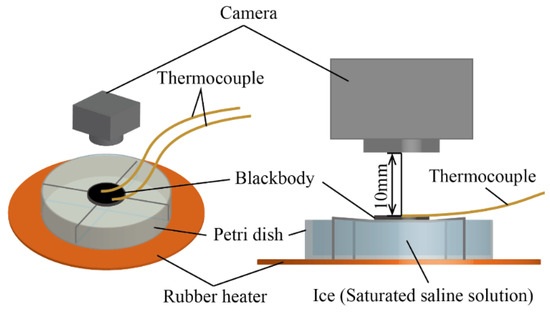
Figure 3.
Experimental system used for far-infrared light camera calibration.
In the calibration experiment, the temperature of the pseudo-blackbody Tb varied, and the illuminance data Df,obj were measured with the far-infrared camera. The energy Qb of the total radiation exchanged between the blackbody and the camera sensor is given by following equation:
where ε is the emissivity of the camera sensor, and Ab is the area of the blackbody surface observed by the camera sensor, F is the view factor from the observed object to the camera sensor, and the subscript “s” refers to the camera sensor. In other words, if we can show that the measured illuminance data Df are proportional to Qb, we can evaluate the radiation energy with the far-infrared camera.
Figure 4 shows the measured luminance data Df,b as a function of the heat exchange between the two black bodies represented by σ(Tb4 − Ts4) with the camera sensor temperature being Ts. The plotted data are the average value of the central area of the blackbody sample, and the error bars are its standard deviation. This averaging process is detailed in the Supplementary Materials (Section SA). The measured irradiance data have a linear relationship with the exchanged radiation energy with the coefficients Cf and for the linear approximation. These coefficients were calculated using the least-squares method. The correlation coefficient r2 is shown in the figure. Then, the intensity of radiation from the observed object if,obj can be expressed by the following equation:
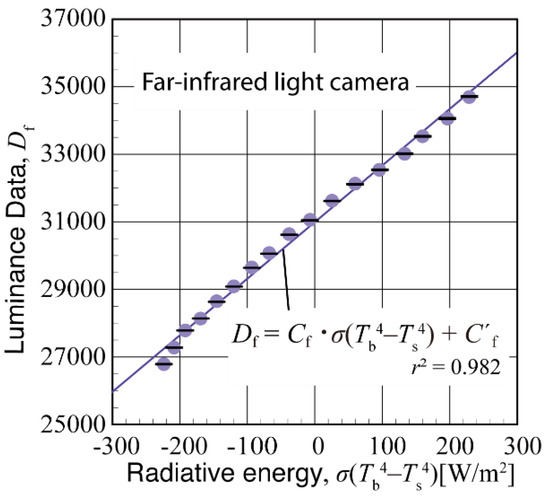
Figure 4.
Data stored in far-infrared light camera versus measured radiative energy.
2.2. Evaluation of the Exchange of Radiation between the Human Body and the Surrounding Environment Structures
It was shown in Section 2.1 that the intensity of radiation, ip, emitted from a point p on a measured area with cameras can be given by the equations as derived from the measured illuminance data D. Section 2.2 describes how to evaluate the radiant energy exchange between the human body and its surroundings, taking into account the radiant energy going from the point p measured by the camera on to the human body. Here, we treat the human body as a subscript “hb”.
The energy dQp→hb of radiation per unit time from a small area dS on the image measured by the camera toward the human body is expressed as follows:
where Fp→hb is the morphological coefficient of viewing the human body from the position of the small area, and ihb is the intensity of radiation emitted from the human body. Assuming that the surface temperature of the human body is 37 °C and that the wavelength distribution of the energy radiated from the human body has the same distribution as the Planck distribution at that temperature, the total radiant energy that a human body receives from the surrounding environment through radiant exchange is obtained by integrating Equation (8) over the entire surroundings.
As shown in Figure 5, for a small area dS on the virtual surface in the direction of the front of the human body, where the polar angle is θ and the azimuth angle is φ from the reference point, the radiation energy to the human body from that area can be calculated and integrated over all the surrounding area.
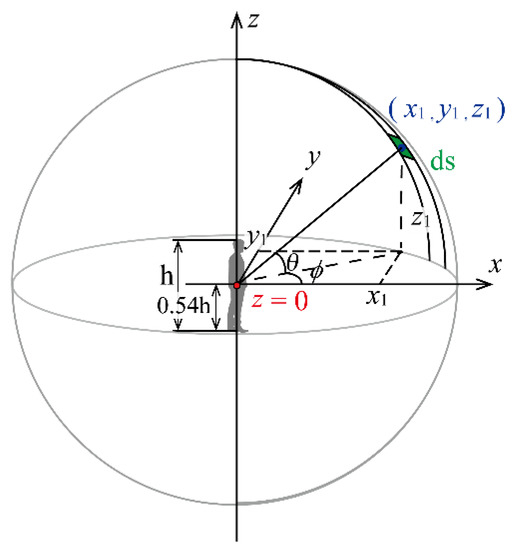
Figure 5.
View factor from the point to the human body.
Dunkel et al. [30] measured view factor on a typical subject in various positions and derived the view factor equation between the standing person and their surroundings. From this view factor, Fp→hb can be expressed by the following equation:
where a height h = 1.7 m and weight w = 70.0 kg are assumed to perform the calculations in Section 3. The camera height from the ground level was fixed at 0.54 h, which became 0.92 m. This camera height was determined on the basis of the center point of the coordinate axis as shown in Figure 5, defined by Dunkel et al. [30]. A description of the equipment used to make measurements with each camera along this coordinate axis is given in the Supplementary Materials (Section SB).
On the other hand, the model shown in Figure 5 requires data on a sphere, while the data measured by the camera are planar information. In order to project the captured luminance raw data Draw onto the spherical virtual surface, as shown in Figure 6, the sphere image data Dsph can be given with respect to the number of pixels N in the height z-direction of the captured image data according to the following equation:
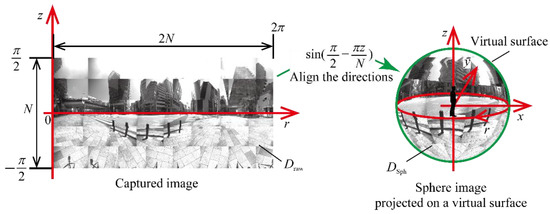
Figure 6.
Overview of how to project onto a virtual surface.
3. Measurement Results and Discussion
3.1. Summer Season Experiments
3.1.1. Measurement Location and Environmental Conditions
The measurements were carried out on sunny days in July and August, at three tourist spots in Japan, the Imperial Palace, Ginza, and Daimon, where many people gather, as the target for the urban environment. Figure 7 shows panoramic images in each location captured using a cell phone (iPhone Pro 11, Apple Inc.) as a reference to understand the measurement environment. The temperature and humidity were also recorded, and the experiment was started at noon. The measurements were taken twice per location, and the data were obtained using the visible, near-infrared, and far-infrared camera. The meteorological data are shown below in Table 1.
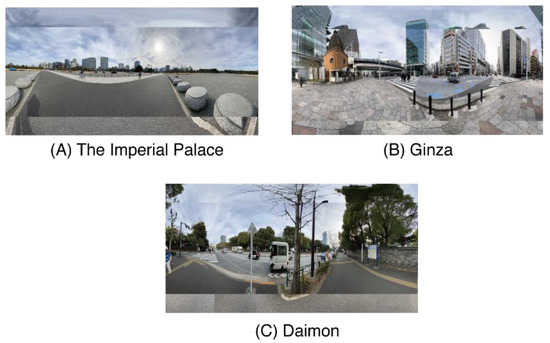
Figure 7.
Panoramic images in the measurement locations: (A) the Imperial Place, (B) Ginza, and (C) Daimon.

Table 1.
Environmental conditions of measurement location in summer experiments.
3.1.2. Measured Images with Visible, Near-Infrared, and Far-Infrared Cameras
Figure 8 shows the images of the first measurement at each location. For each camera, image areas with low intensity of radiation are shown in black, and areas with high intensity of radiation are shown in white. It is shown that the heat load of radiation from the visible wavelengths was largely due to direct sunlight, while the heat load from the ground was larger in the far-infrared wavelengths. A detailed analysis of which structures had a significant impact on the heat load on the human body in each of the measured images is presented in the next section.
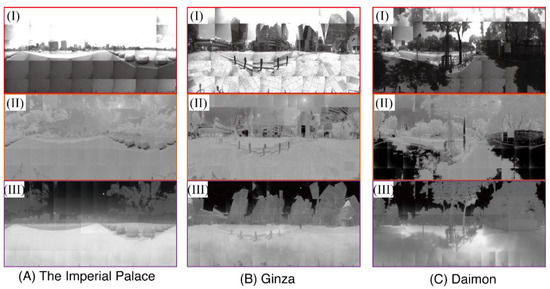
Figure 8.
Measured images in summer experiments at (A) the Imperial Palace, (B) Ginza, and (C) Daimon with (I) visible, (II) near-infrared, and (III) infrared camera in summer.
3.1.3. Analysis Results and Discussion
For more detailed analysis, the objects in the images were classified into four structures: “sky”, “plants”, “ground”, and the other remaining structures such as buildings, referred to as “buildings”. An example of the pseudo color-coded classification is shown in Figure 9. The data obtained from directly looking at the sun in the sky are not measurable due to its high radiation intensity; thus, they were omitted from these classifications. From the results of these classified images, the composition ratio of each structure at each measurement location is summarized in Figure 9. This composition ratio was calculated from the number of classification color-coded pixels before processing of the spherical projection. The heat load on the human body for each structure was calculated as explained in Section 2, and the averages of the two results measured at each location are shown in Figure 10.
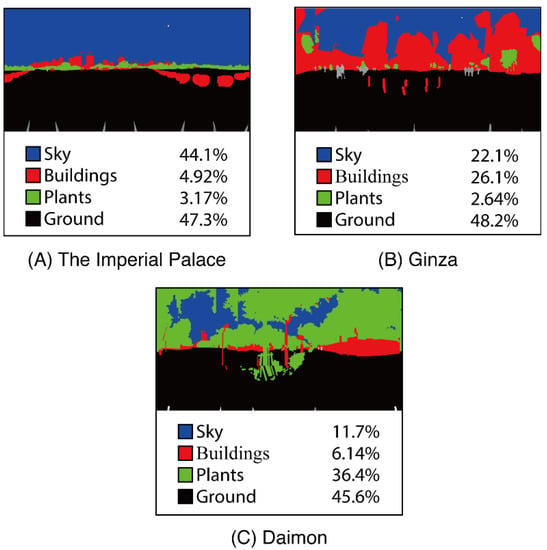
Figure 9.
Structure classification at each location: (A) the Imperial Palace, (B) Ginza, and (C) Daimon.
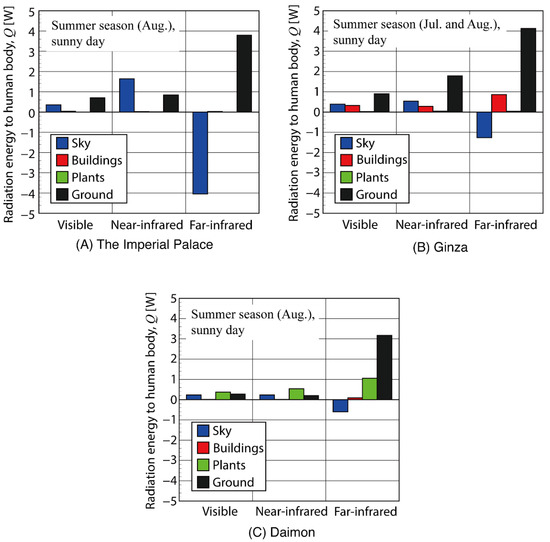
Figure 10.
Calculated radiation energy to the human body in summer experiments for each location: (A) the Imperial Palace, (B) Ginza, and (C) Daimon.
For the Imperial Palace, the sky occupied a large area (44.1%), while other structures and plants occupied less than 5%. Therefore, the radiation energy of plants and the buildings were much smaller than those of the ground and sky. In the far-infrared wavelengths, only the sky had a negative value. This implies that structures other than the sky were hotter than the human body. Yu et al. [25] showed that wall and road had high temperature than plants, and the wall and road became the heat load to the human body. The results of the current experiments likewise showed that the structure and the ground were at a higher temperature than the human body, giving a positive heat load to the human body.
Compared to the Imperial Palace, Ginza showed higher values of radiation energy for the buildings. In the far-infrared wavelengths, the negative energy value of the sky was smaller because the area of the sky had decreased (22.1%) compared to the Imperial Palace. There was a large amount of radiation energy from other structures and the ground in the visible and near-infrared wavelengths. There was no significant difference in the area of the ground between the Imperial Palace and Ginza. Therefore, the reflected light from the buildings possibly caused the energy changes in the visible and near-infrared wavelengths of the ground. In addition, far-infrared radiation energy from the ground increased despite the fact that the buildings in Ginza blocked sunlight from the sky. The radiation of far-infrared wavelengths corresponds to the energy derived from the temperature of the materials. This suggests that the observed reduction in direct sunlight to the ground due to the reduction in Ginza had little effect on lowering the temperature of the ground.
In Daimon, there were few buildings, but the area occupied by plants was large, reducing the sky’s area, which in turn reduced the negative far-infrared energy and increased the positive radiation energy from the plants to the human body. The difference with Ginza was that the ground radiation energy at visible and near-infrared wavelengths was also significantly reduced, even though the area occupied by the ground was almost the same. In Ginza, there could be the case that light reflected from the buildings may have been directed to the ground, but the absorption and diffuse reflection of sunlight by the plants largely blocked the sunlight from reaching the ground in Daimon. As a result, the heat load from the ground to the human body at far-infrared wavelengths was reduced.
As a countermeasure against UHI, the use of vegetation [8,10] and highly reflective paints [31,32] on the ground, buildings, and other structures is often considered. By blocking sunlight from reaching the ground with vegetation, the temperature of the ground can be lowered, and the heat load of far-infrared radiation from the ground to the human body can be reduced. However, the energy radiated from the human body to the sky will also be reduced, which may result in an increase in the far-infrared heat load on the human body. This can be expected from comparing the results of the Imperial Palace and Daimon. On the other hand, the effect of vegetation is also to reduce the heat load in visible and near-infrared wavelengths from the sky and ground. In addition to the radiation heat transfer, vegetation can play a role in cooling through the transpiration effect, in which plants evaporate and transpire simultaneously. The energy consumed during evapotranspiration plays a role in lowering the temperature of the air around the plants.
The use of highly reflective paints should be carefully considered. The use of highly reflective paints on buildings increases the amount of energy that is reflected by the building and directed toward the ground or the human body. In addition, the reflected radiation from the building will heat the ground, increasing the radiation from the ground at far-infrared wavelengths. Therefore, the use of paints that increase reflectivity may increase the heat load on the human body. The reflectance of asphalt, a typical ground material, is about 5% [33]. If this reflectance is simply increased several times, it means that the visible and near-infrared heat loads will also increase several times, although the far-infrared heat load will decrease due to the lower ground temperature. As with vegetation, it is a complex phenomenon that needs to be considered in conjunction with changes in atmospheric temperature due to changes in the temperature of various structures. From the viewpoint of heat load due to radiation, it is important to consider the direction in which radiation from the sun is reflected. Recent research has been conducted on paints that enable retroreflections [34], which will play an important role in counteracting UHI.
3.2. Experiments under Winter Conditions
3.2.1. Measurement Location and Environmental Conditions
As an experiment to compare the difference between summer and winter seasons, we conducted an experiment on a sunny day in February at the Imperial Palace, the same place where we conducted the investigation in summer. To simplify the comparison with cloudy weather, the Imperial Palace, where the sky is not blocked by buildings or plants, was chosen. The conditions at the time of measurement were measured in the same way as in summer. The meteorological data are shown below in Table 2.

Table 2.
Environmental conditions of measurement location in winter experiment.
3.2.2. Measured Images with Visible, Near-Infrared, and Far-Infrared Cameras
Figure 11 shows the images of the first measurement at the Imperial Palace in the winter season. Compared to the summer image in Section 3.1, the far-infrared wavelength image looked very different. In the summer image, the ground was white, and the sky was black, whereas, in this winter image, the ground and sky had a similar appearance in the far-infrared wavelengths. The heat load on the human body is discussed in the next section, as well as the summer data.
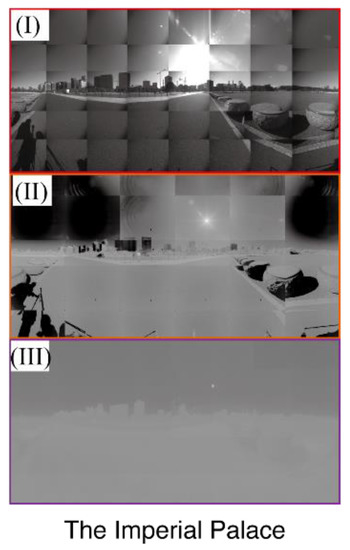
Figure 11.
Measured image in winter experiment at the Imperial Palace with (I) visible, (II) near-infrared, and (III) far-infrared light camera.
3.2.3. Analysis Results and Discussion
In order to perform the same analysis as in the summer experiment, we classified the objects in the images into four categories. Figure 12 shows the heat load on the human body for each of the structures.
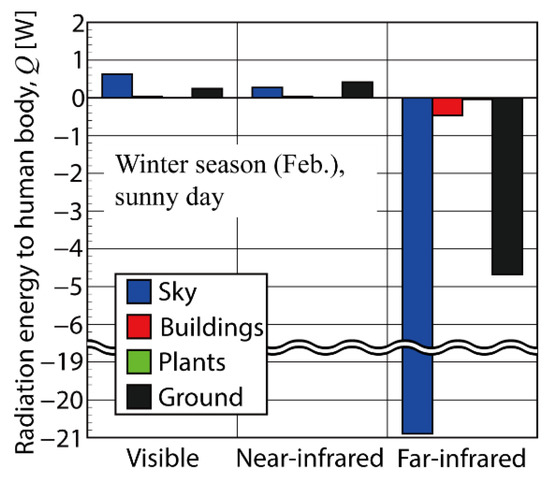
Figure 12.
Calculated radiation energy to human body in winter experiment at the Imperial Palace.
The major changes when compared to the summer experiment were seen in the results of the far-infrared experiment. In summer, the temperature of all structures except the sky was higher than that of the human body, resulting in a positive heat load on the human body. In winter, however, the temperature of all structures was lower than that of the human body, resulting in a negative heat load. Furthermore, in the visible and near-infrared radiation, the radiation energy from the sky and ground were decreased. This is due to the fact that the angle of incidence of sunlight is larger in winter than in summer, and the flux of sunlight reaching the ground surface is smaller. A comparison focusing on the difference in wavelengths showed that the negative heat load of far-infrared radiation was dominant in winter, while visible and near-infrared radiation energy had little effect on the heat load to the human body.
3.3. Experiments under Cloudy Weather Conditions
3.3.1. Measurement Location and Environmental Conditions
Lastly, cloudy days were selected as the target urban environment, mainly at the Imperial Palace, and measurements were taken during October. A cloudy day was defined as a day when the weather at the time of measurement in Tokyo was cloudy, according to meteorological data from the Japan Meteorological Agency [35]. The weather data are shown in Table 3.

Table 3.
Environmental conditions of measurement location in cloudy weather.
3.3.2. Measured Images with Visible, Near-Infrared, and Far-Infrared Cameras
Figure 13 shows the images of the first measurement at the Imperial Place in cloudy weather. Compared to the summer image in Section 3.1, the far-infrared wavelength image looked very different. In the summer image, the ground was white, and the sky was black, whereas, in this winter image, the ground and sky had a similar appearance in the far-infrared wavelengths. The heat load on the human body is discussed in the next section, as well as the summer data.
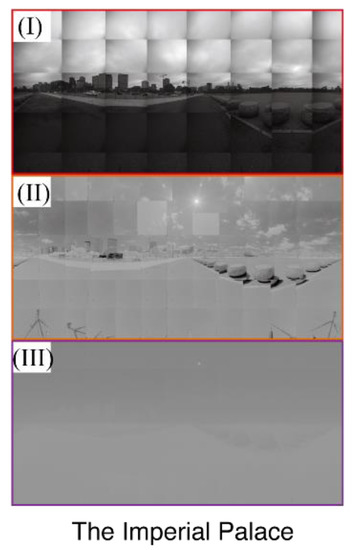
Figure 13.
Measured image in cloudy weather experiment at the Imperial Palace with (I) visible, (II) near-infrared, and (III) far-infrared light camera.
3.3.3. Analysis Results and Discussion
In order to perform the same analysis as in the summer and winter experiments, we classified the objects in the images into four categories. The heat load on the human body for each structures was calculated as shown in Figure 14.
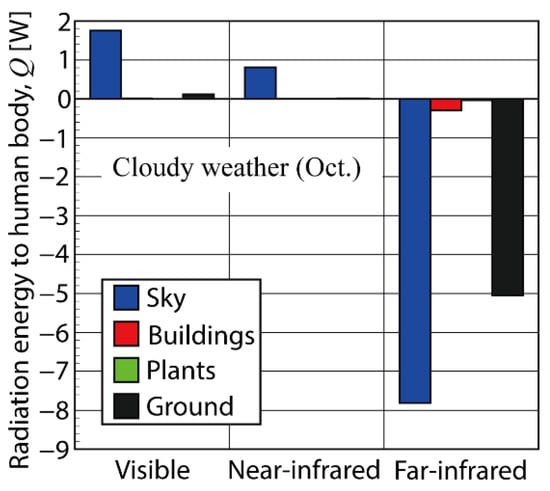
Figure 14.
Calculated radiation energy to human body in cloudy weather experiment at the Imperial Palace.
In the visible and near-infrared wavelengths, it was shown that there was little sunlight reaching ground, but the heat load reaching the human body from the sky increased. Due to the clouds blocking the sunlight, only scattered radiation reached the ground, and the heat load on the human body due to reflected radiation from the ground became small. Clouds absorb sunlight in the near-infrared wavelengths well. This is because the main component of clouds is water molecules. As a result, the reflected energy in near-infrared wavelengths was smaller than that in the visible. This cloudy experiment (Oct.) was performed in the season between summer (Aug.) and winter (Feb.). The environmental condition of this cloudy experiment (Table 3) was close to winter temperatures, as can be seen Table 1 and Table 2 for the comparison, and the heat load to the human body at far-infrared wavelengths had negative values for all structures. Furthermore, these negative heat load values were smaller than those of the winter experiments. From these experiments, we can say that there is a good link between the temperature data and the infrared radiation energy data; thus, there is possibly a relationship between the air temperature and the far-infrared radiation energy.
4. Conclusions
In this study, we proposed a method to investigate the effects of the heat load or heat radiation energy from environmental structures on the human body, using three cameras at different wavelength ranges (visible light, near-infrared light, and far-infrared light). To demonstrate the usefulness of the method, the heat load from environmental structures to the human body was measured/determined under different seasons and weather conditions at different urban locations in Tokyo, Japan. The environmental structures were classified into four main categories: sky, plants, ground, and reaming structures such as buildings. The heat load by defining them to have a positive value was evaluated individually from each environmental structure to the human body.
The measurements were conducted for the urban environment at three locations in Japan: the Imperial Palace, Ginza, and Daimon, where many people gather. The results of the structure classification showed that the percentage of ground remained almost the same at all locations, while the percentage of structures other than the ground changed.
Summer season measurements showed that structures other than the sky at far-infrared wavelengths exert a positive heat load on the human body. Therefore, considering only the far-infrared wavelengths, a larger sky area resulted in a smaller heat load on the human body. On the other hand, a positive heat load was given from the sky to the human body in the visible and near-infrared wavelengths. In addition, the heat load from the ground to the human body varied greatly even if the area of the ground remained unchanged. As the area of the plants increased, the radiation to the ground was shielded, and the heat load from the ground to the human body decreased. However, as the area of the buildings increased, the heat load from the ground also increased.
Winter season measurements showed that the heat load became negative for all structures in the far-infrared wavelengths. On the other hand, all heat loads were smaller at visible and near-infrared wavelengths because the flux of sunlight reaching the ground surface was smaller. Therefore, the negative heat load in the far-infrared was dominant in winter, and the visible and near-infrared radiation had little effect on the heat load to the human body.
Cloudy weather measurements showed that the heat load from the ground at visible and near-infrared wavelengths almost disappeared, and the heat load from the sky became dominant. Due to the cloudy weather and the seasonal difference from the summer experiment, the temperature of all structures was lower than that of the human body, and they showed negative heat loads in the far-infrared wavelengths, as in winter.
These results indicate that the heat load on the human body due to radiation at visible, near-infrared, and infrared wavelengths varies in a complex manner depending on the proportion of city structures and variations from season and weather. In this experiment, characteristic locations in Tokyo, Japan were chosen, but measurements can be realized, in fact, by extending the proposed method to a wider variety of environments over different countries. We believe the findings reported in this paper could have implications when considering the countermeasures against UHI.
Supplementary Materials
The following supporting information can be downloaded at: https://www.mdpi.com/article/10.3390/app122010412/s1, Figure S1: Example of a measured image using standard diffuse reflector taken by a visible light camera, where the red area is obtained as the average value; Figure S2: Schematic diagram of measurement using a camera attached with a rotation unit; Table S1: Specifications and the number of pixels used in the calibration experiments for each camera.
Author Contributions
Conceptualization, T.K. and J.Y.; methodology, T.K., J.Y. and U.M.R.; software, T.K. and Y.N.; validation, T.K. and Y.N.; formal analysis, T.K. and Y.N.; investigation, T.K. and Y.N.; resources, T.K. and Y.N.; data curation, T.K. and Y.N.; writing—original draft preparation, T.K. and Y.N.; writing—review and editing, J.Y. and U.M.R.; visualization, T.K. and Y.N.; supervision, T.K., J.Y. and U.M.R.; project administration, T.K., J.Y. and U.M.R.; funding acquisition, T.K. and J.Y. All authors have read and agreed to the published version of the manuscript.
Funding
This research did not receive any specific grant from public funding agencies.
Institutional Review Board Statement
Not applicable.
Informed Consent Statement
Not applicable.
Data Availability Statement
Not applicable.
Conflicts of Interest
The authors declare no conflict of interest.
Nomenclature
| C, C’ | approximation coefficients |
| D | luminance data |
| E | radiation flux, W/m2 |
| F | view factor |
| h | height of a person, m |
| i | radiation intensity, W/(m2·sr) |
| N | number of pixels |
| Q | radiation energy, W |
| R | constant value |
| r | correlation coefficient |
| S | area, m2 |
| T | temperature, K |
| w | weight of a person, kg |
| x, y, z | coordinate, m |
| θ | polar angle, ° |
| λ | wavelength, m |
| ρ | reflectivity |
| σ | Stefan–Boltzmann constant, W/(m2·K4) |
| φ | azimuth angle, ° |
| Subscripts | |
| b | black body |
| dr | standard diffuse reflector |
| f | far-infrared |
| ground | ground |
| hb | human body |
| n | near-infrared |
| obj | observed objects in environmental experiment |
| p | point |
| raw | raw image |
| s | camera sensor |
| sph | sphere image |
| sun | sun |
| v | visible |
References
- Lee, K.; Kim, Y.; Sung, H.C.; Ryu, J.; Jeon, S.W. Trend Analysis of Urban Heat Island Intensity According to Urban Area Change in Asian Mega Cities. Sustainability 2020, 12, 112. [Google Scholar] [CrossRef]
- Tan, J.; Zheng, Y.; Tang, X.; Guo, C.; Li, L.; Song, G.; Zhen, X.; Yuan, D.; Kalkstein, A.J.; Li, F.; et al. The urban heat island and its impact on heat waves and human health in Shanghai. Int. J. Biometeorol. 2010, 54, 7–84. [Google Scholar] [CrossRef]
- Mika, J.; Forgo, P.; Lakatos, L.; Olah, A.B.; Rapi, S.; Utasi, Z. Impact of 1.5 K global warming on urban air pollution and heat island with outlook on human health effects. Curr. Opin. Environ. Sustain. 2018, 30, 151–159. [Google Scholar] [CrossRef]
- Heaviside, C.; Macintyre, H.; Vardoulakis, S. The Urban Heat Island: Implications for Health in a Changing Environment. Curr. Environ. Health Rep. 2017, 4, 296–305. [Google Scholar] [CrossRef] [PubMed]
- United Nations. World Urbanization Prospects, the 2018 Revision. Available online: https://population.un.org/wup/Publications/Files/WUP2018-Report.pdf (accessed on 16 June 2022).
- McRae, I.; Freedman, F.; Rivera, A.; Li, X.; Dou, J.; Cruz, I.; Ren, C.; Dronova, I.; Fraker, H.; Bornstein, R. Integration of the WUDAPT, WRF, and ENVI-met models to simulate extreme daytime temperature mitigation strategies in San Jose, California. Build. Environ. 2020, 184, 107180. [Google Scholar] [CrossRef]
- Grimmond, S. Urbanization and global environmental change: Local effects of urban warming. Geogr. J. 2007, 173, 83–88. [Google Scholar] [CrossRef]
- Memon, R.; Leung, D.; Li, C. A review on the generation, determination and mitigation of Urban Heat Island. J. Environ. Sci. 2008, 20, 120–128. [Google Scholar]
- Rizvi, S.H.; Alam, K.; Iqbal, M.J. Spatio-temporal variations in urban heat island and its interaction with heat wave. J. Atmos. Sol. -Terr. Phys. 2019, 185, 50–57. [Google Scholar] [CrossRef]
- Shahmohamadi, P.; Che-Ani, A.I.; Etessam, I.; Maulud, K.N.A.; Tawil, N.M. Healthy Environment: The Need to Mitigate Urban Heat Island Effects on Human Health. Procedia Eng. 2011, 20, 61–70. [Google Scholar] [CrossRef]
- Kikon, N.; Singh, P.; Singh, S.K.; Vyas, A.V. Assessment of urban heat islands (UHI) of Noida City, India using multi-temporal satellite data. Sustain. Cities Soc. 2016, 22, 19–28. [Google Scholar] [CrossRef]
- Mohan, M.; Kikegawa, Y.; Gurjar, B.R.; Bhati, S.; Kolli, N.R. Assessment of urban heat island effect for different land use–land cover from micrometeorological measurements and remote sensing data for megacity Delhi. Theor. Appl. Climatol. 2013, 112, 647–658. [Google Scholar] [CrossRef]
- Singh, R.B.; Grover, A.; Zhan, J. Inter-Seasonal Variations of Surface Temperature in the Urbanized Environment of Delhi Using Landsat Thermal Data. Energies 2014, 3, 1811–1828. [Google Scholar] [CrossRef]
- Hung, T.; Uchihama, D.; Ochi, S.; Yasuoka, Y. Assessment with satellite data of the urban heat island effects in Asian mega cities. Int. J. Appl. Earth Obs. Geoinf. 2006, 8, 34–48. [Google Scholar]
- Liu, L.; Lin, Y.; Liu, J.; Wang, L.; Wang, D.; Shui, T.; Chen, X.; Wu, Q. Analysis of local-scale urban heat island characteristics using an integrated method of mobile measurement and GIS-based spatial interpolation. Build. Environ. 2017, 117, 191–207. [Google Scholar] [CrossRef]
- Shi, Y.; Lau, K.K.; Ren, C.; Ng, E. Evaluating the local climate zone classification in high-density heterogeneous urban environment using mobile measurement. Urban Clim. 2018, 25, 167–186. [Google Scholar] [CrossRef]
- Abbas, W.; Ismael, H. Assessment of constructing canopy urban heat island temperatures from thermal images: An integrated multi-scale approach. Sci. Afr. 2020, 10, e00607. [Google Scholar] [CrossRef]
- Kalbasi, R. Usefulness of PCM in building applications focusing on envelope heat exchange–energy saving considering two scenarios. Sustain. Energy Technol. Assess. 2022, 50, 101848. [Google Scholar] [CrossRef]
- Yamaguchi, K.; Kobayashi, Y. Heat Exchange by Radiation Including Insolation between Human Body and Overall Outdoor Environment including Building, Ground and Sky. Jpn. J. Biometeorol. 1980, 17, 49–57. [Google Scholar]
- Din, M.F.M.; Dzinun, H.; Ponraj MChelliapan, S.; Noor, Z.Z.; Remaz, D.; Iwao, K. Investigation of thermal effect on exterior wall surface of building material at urban city area. Int. J. Energy Environ. 2012, 3, 531–540. [Google Scholar]
- Binariti, F.; Pranowo, P.; Leksono, S.B. Thermal Infrared Images to Identify the Contribution of Surface Materials to the Canopy Layer Heat Island in Hot-Humid Urban Areas. Environ. Clim. Technol. 2020, 24, 604–623. [Google Scholar] [CrossRef]
- Chen, L.; Wang, Y.; Jia, S.; Siu, M.F. Development of panoramic infrared images for surface temperature analysis of buildings and infrastructures. Energy Build. 2021, 232, 110660. [Google Scholar] [CrossRef]
- Chui, A.C.; Gittelson, A.; Sebastian, E.; Stamler, N.; Gaffin, S.R. Urban heat islands and cooler infrastructure—Measuring near-surface temperatures with hand-held infrared cameras. Urban Clim. 2018, 24, 51–62. [Google Scholar] [CrossRef]
- Wu, H.; Liu, Z.; Yang, Y.; Bai, S. Characterizing Thermal Impacts of Pavement Materials on Urban Heat Island (UHI) Effect. In Proceedings of the International Conference on Transportation Infrastructure and Materials, (ICTIM 2016), Xi’an, China, 16–18 June 2016; ISBN 978-1-60595-367-0. [Google Scholar]
- Yu, Z.; Chen, T.; Yang, G.; Sun, R.; Xie, W.; Vejre, H. Quantifying seasonal and diurnal contributions of urban landscapes to heat energy dynamics. Appl. Energy 2020, 264, 114724. [Google Scholar] [CrossRef]
- Hasuike, H.; Yoshizawa, Y.; Suzuki, A.; Tamaura, Y. Study on design of molten salt solar receivers for beam-down solar concentrator. Sol. Energy 2006, 80, 1255–1262. [Google Scholar]
- Siegel, R.; Howell, J.R. Thermal Radiation Heat Transfer, 3rd ed.; Taylor and Francis: Abingdon, UK, 1992. [Google Scholar]
- Bitran Corporation. Catalog Data of BU Series Products. Available online: https://www.bitran.co.jp/ccd/PDF/CCDEM.pdf (accessed on 16 June 2022).
- IRspec Corporation. Catalog Data of InGaAs Infrared Camera, Eizojoho Industrial. Available online: http://www.irspec.com/eizo17.2.pdf (accessed on 16 June 2022).
- Dunkle, R.V. Configuration Factor for Radiant Heat Transfer Calculations Involving People. J. Heat Transf. 1963, 85, 71–76. [Google Scholar] [CrossRef]
- Cao, X.; Tang, B.; Zhu, H.; Zhang, A.; Chen, S. Cooling principle analyses and performance evaluation of heat-reflective coating for asphalt pavement. J. Mater. Civ. Eng. 2011, 23, 1067–1075. [Google Scholar] [CrossRef]
- Shanshan, Z.; Mai, X. A review of using reflective pavement materials as mitigation tactics to counter the effects of urban heat island. Adv. Compos. Hybrid Mater. 2019, 2, 381–388. [Google Scholar]
- Wang, H.; Zhong, J.; Feng, D.; Meng, J.; Xie, N. Nanoparticles-modified polymer-based solar-reflective coating as a cooling overlay for asphalt pavement. Int. J. Smart Nano Mater. 2013, 4, 102–111. [Google Scholar] [CrossRef]
- Hideki, S.; Iyota, H. Development of two new types of retroreflective materials as countermeasures to urban heat islands. Int. J. Thermophys. 2017, 38, 131. [Google Scholar]
- Japan Meteorological Agency. Past Weather Data. Available online: https://www.data.jma.go.jp/obd/stats/etrn/index.php (accessed on 16 June 2022).
Publisher’s Note: MDPI stays neutral with regard to jurisdictional claims in published maps and institutional affiliations. |
© 2022 by the authors. Licensee MDPI, Basel, Switzerland. This article is an open access article distributed under the terms and conditions of the Creative Commons Attribution (CC BY) license (https://creativecommons.org/licenses/by/4.0/).