Abstract
Improper design of the geometric elements and facilities of bikeway systems could endanger cyclists’ safety and comfort, resulting in an increased risk of bicycle accidents; such accidents sometimes have severe consequences, namely casualties. The method of expression for cyclists’ safety and comfort and the question of how the correlation of these factors with bikeway characteristics—such as the design of geometry and facilities—can be quantitatively described are the key problems facing a reduction in accident risk. Cycling workload can be employed to assess cyclists’ safety and comfort. However, there has been little quantitative expression research on this topic, with no clear definition of cycling workload. The quantitative expression of cycling workload is important for developing guidance for the safe design and operational management of bikeways; this is necessary for controlling conditions that might induce overworking and discomfort among users. In this paper, the concept of cycling workload is clearly defined based on cyclists’ comfort and safety formation mechanisms. Through a literature review and a comparative analysis, it is inferred that heart rate variability (HRV) can be used as a quantitative measure and the low-frequency–high-frequency ratio (LF/HF) can be used as a physiological signal to quantify cycling workload. A subjective scale was found to effectively express cyclists’ feelings of safety and comfort, with the performance assessed according to a human factor engineering research paradigm that classified cycling status into three qualitative levels—comfortable; a little stressful; and stressful. In order to form various cycling workload states and to obtain the relationship between LF/HF data and various bikeway characteristics, we designed a field cycling experiment. This was conducted by 24 participants who wore a physiological measuring apparatus under three different bikeway characteristic scenario types including variations in cycling width, direction, and bikeway edges at four cycling speeds in the 10–25 km/h range. Statistical analysis was used to address the collected LF/HF values and the subjective scale results, and a quantitative model for assessing cycling workload was established. By adopting a classification and regression tree (CART) algorithm as a data-mining method, the classification threshold values (ΔHRV) of three cycling workload levels were obtained: 19 indicated a level between comfortable and a little stressful; and 79 indicated a level between a little stressful and stressful.
1. Introduction
Bicycles as a mode of transportation are popular in countries that have committed to carbon neutrality thanks to their benefits for cyclists’ health and environment protection [1] and their capacity to resolve the “last mile problem”, which is encountered after transit stops. However, cyclists are among the vulnerable road users (VRUs) for whom traffic accidents have severe consequences [2,3]. Early research reported that in the event of a bicycle accident, the fatality rate can be as high as 30% and most survivors have serious injuries [4].
As an important factor contributing to bicycle accidents, inappropriate design of the geometric elements and facilities for bikeway systems could jeopardize cyclists’ feelings of safety and comfort, increasing the likelihood of bicycle accidents. For instance, if the cycling width of a bikeway segment is too narrow to fulfill the requirement of cyclists’ safety and comfort, then cycling in that specific segment will not be in accordance with cyclists’ expectations. Cyclists could not rely on their past experience to pass this segment and would tend to occupy other road users’ space, which means they will suffer from more mental stress in processing unexpected information and more physical stress in keeping balance during operating. This process increases the risk of accidents. There is evidence to suggest that cyclists’ perception of safety and comfort provides a key link with actual accident risk, which can be improved by addressing human factors and roadway design [5]. Furthermore, roadway facilities and geometric conditions contribute to road users’ feeling of stress, which are closely associated with road users’ reactions and information-processing abilities and estimation of road conditions [4]. In addition, as reported, among the influencing factors, roadway characteristics (such as the design of road geometry and facilities for bikeways) are considered to be one of the top two factors that contribute to bicycle accidents [6,7]. Hence, to decrease the incidence of bicycle accidents, we must ensure the appropriate design of the geometry and facilities of bikeways to fulfill the requirements of cyclists’ safety and comfort.
To bridge the gap between cyclists’ safety/comfort and bikeway design and assessment, proper quantified measurement of cyclists’ safety and comfort is essential; this will permit the careful examination and evaluation of the design of bikeway geometric elements and facilities. Such an assessment will be improved compared with an evaluation approach based only on standards and specifications. The goal of this approach is to decrease the risk of bicycle accidents during design stages and the operational management phase by considering cyclists’ feelings of safety and comfort. In practice, the design of bikeway characteristics—such as cycling width, curve radius, and longitudinal gradient—generally adopts the values specified in the relevant bicycle facility guidance and standards [8,9,10,11,12,13,14] across the world. However, the fact that bikeway characteristics (designed based on the current bikeway design and assessment criteria) and road user factors have become the top two causes of bicycle accidents [7] indicates that the specification design values are not so valid from a safety perspective; we propose that this is probably due to their lack of consideration for cyclists’ safety and comfort. Most of the indicator design values were determined on the basis of typical bicycle dimensions, geometric features, and force equilibrium, etc., and from experience gained from motorized vehicles(e.g., vehicle kinetics). For example, the minimum specified horizontal curve radius for bikeways is usually determined by the design speed, the super elevation/cross slope, and the coefficient of friction, which is inferred by force equilibrium based on a bicycle traveling on a bend; the coefficient of friction is usually determined by extrapolating from values used in highway design [9,15]. It seems that little consideration has been given to cyclists’ feelings of safety and comfort in evaluating the effectiveness of the design of geometric elements and facilities of bikeways, which should be improved to ensure a comfortable and safe design and to facilitate future evaluation. However, a lack of quantitative values for expressing cyclists’ safety and comfort makes it difficult to carry out and evaluate bikeway geometry and facility design from a perspective of cyclist safety.
Cycling workload can be employed as a reflection of cycling safety and comfort [16,17,18]. The quantitative expression of cycling workload, similarly to the quantification of cycling safety and comfort, can contribute to detailed guidance in the design of bikeway characteristics’ indicator-limiting values in design standards; additionally, it can act as the basis for establishing a valid evaluation theory and method for assessing utilized operational management conditions during the operation phase. Such advantages have theoretical and practical implications for reducing the risk of bicycle accidents.
Nevertheless, presently, the existing quantitative research on cycling workload cannot fully reflect the real workload status of traditional bikeways that require cyclists’ mental effort to interact with the bikeways’ characteristics and environment and their physical effort to maintain balance and keep their bicycle moving. Instead, research has mainly focused on the physical aspect based on static cycling through combinations of subjective scale methods such as the rate of perceived exertion (RPE) and physiological measurements such as surface electromyography (sEMG) [19,20]. Furthermore, there is no clear definition of cycling workload for conventional bicycling on bikeways for everyday travel. In the sparse studies, cycling workload was regarded as a mental workload for assessing cyclists’ feelings of safety when using electric-powered bicycles (e-bikes) [16] or was addressed physically in terms of the power output preset on an indoor cycle ergometer in cycling race field [17,18]. Without appropriate definitions and quantification research on cycling workload, it is difficult to identify a safe and comfortable range for cycling workload or to evaluate the safety effects of bikeway characteristics.
The objective of this study was to define a universal cycling workload concept based on everyday conventional cycling; to obtain reliable and proper quantitative expression techniques; and to classify cycling workload by combining a subjective scale and an objective quantification method to determine an acceptable level of safety and comfort. This will provide a practical reference for design guidance when determining the limit values of bikeway characteristics and the assessment of operational management among practitioners.
This article is arranged as follows: Section 2 introduces a cycling safety and comfort-formation mechanism; based on this, a universal cycling workload concept is proposed. The workload measurement methods are reviewed and analyzed to obtain the proper quantification indicators. Section 3 describes the materials and methods used in this study to prepare and collect the cycling workload data. Section 4 describes our data analysis process and our results. The final section presents our conclusions with some points for discussion.
2. Cycling Safety and Comfort-Formation Mechanism and Measurement Methods
2.1. Cycling Workload Definition Based on Safety and Comfort Formation
Bicycle operation involves a process of the interaction among a human, a bicycle, and a road environment—a human–bicycle–road environment system—in which the human is the dominant factor. External information from the road environment is the input to the human’s brain through their sense organs, such as their eyes, ears, etc. Then, the information is further processed by the central nervous system. Once analyses and judgments are made, the corresponding locomotor organs (hands and feet) receive instructions and take actions to brake, accelerate, turn, or yield to other road users. The whole process reflects a human mental process of sensation, decision making, and response, and simultaneously involves physical effort for continuous pedaling in every phase to maintain balance and provide power to move. Furthermore, for various traffic environments and bikeway characteristics with different safety and comfort statuses, changes in cycling behavior will occur when cyclists adjust themselves; afterwards, feedback occurs and cyclists return to the sensation process (as shown in Figure 1). Along with a behavior change, a change in cyclists’ psychophysiological status also occurs, which can be reflected in the physiological signal.
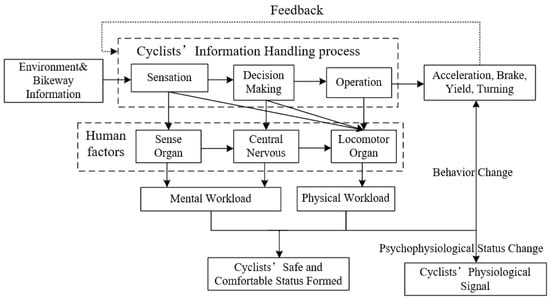
Figure 1.
Cycling safety and comfort during cycling task.
When the environment and bikeway information is complex or confusing or the supplied information does not fulfill cyclists’ expectation for a given cycling task, cyclists’ mental workload increases, leading to delayed reactions. When cyclists make a decision to change their cycling behaviors, their physical workload could increase in attempts to maintain balance and the necessary cycling speed. The increments in physical and mental workload will be reflected in cyclists’ reduced feelings of safety and comfort.
The mental workload and physical workload shown in Figure 1 comprise cyclists’ workload in dynamic cycling tasks using traditional bikeways in everyday life (dynamic cycling); it is in this context that the safe and comfortable status of cycling is formed. Given the abovementioned mechanism, we put forward a universal concept of cycling workload that is multidimensional in nature and can be interpreted as the demands of cycling tasks or the mental and physical stress experienced by cyclists under the road, traffic volume, and environmental conditions when they cycle on a bikeway.
In order to determine a safe and comfortable cycling workload level for cyclists, it is important to choose suitable measurement techniques to measure cyclists’ safe and comfortable cycling experiences; these measurement techniques must be sensitive to both the mental and physical workload while aiming to measure the total workload.
2.2. Measurement for Cycling Workload
In this study, a subjective scale and a physiological measure were utilized to quantitatively express cycling workload. We chose these measures because the study involved human factor engineering; accordingly, the subjective scale should be adopted in order to exclude the performance factors that were irrelevant to the research subject. As per the manifestation of the pattern of cycling workload shown in Figure 1, cycling workload can be reflected in the changes in behavior and performance. By formulating a subjective scale and connecting subjective feeling with performance description, we were able to form a preliminary assessment of workload. More specifically, as a direct measurement of change in psychophysiological status, the measure of physiological signals was assumed to directly reflect and measure the cycling workload.
According to the literature on workload measurement, there are three main measurement types: performance-based, subjective, and physiological measures [21]; their application and final arrangement in this research were analyzed and summarized as follows.
- (1)
- Performance Measures for Cycling Workload
The two approaches to measuring performance for workload are based on primary and secondary tasks, respectively, and the theoretical background is the assumption that humans have limited attention resources. For example, in driving workload, the primary tasks used include steering wheel movements, lane-keeping, and speed control [21]. Speed choice [16] and lateral distance [22] are the measures of primary tasks that are used to evaluate safety status during the cycling task. For secondary task measurements, the peripheral detection task (PDT) [16] is the measure used in e-bike cycling tasks. Secondary task measurements may disrupt the primary task, which is a major problem [21]. Cycling speed performance for traditional bicycles can be impacted by the performance of the selected bicycle. So, lateral distance is a promising measure for performance measurement. However, it was not chosen here due to the current technical limitation of our experimental conditions, which required a high degree of accuracy. Hence, these performance measures were not applied in this study.
- (2)
- Subjective Scale for Cycling Workload
There are four commonly used subjective scales for workload classification: the NASA task load index (TLX), the Cooper–Harper scale, and the Subjective Workload Assessment Technique (SWAT) are mainly used to assess mental workload; while Borg’s Perceived Exertion and Pain Scales (RPE) is typically used for assessing physical workload. RPE is the most popular subjective scale for assessing stationary ergometer cycling [19,23]. However, as mentioned in the previous section, dynamic cycling involves both physical and mental workloads; if there are too many classification levels for cyclists to identify the exact level during a given cycling task, then there is potential for additional mental workload, which would affect the results. Additionally, the unidimensional rating scale is also a good choice for practical experiments because it is fast, easy, and not distracting [21].
Given the principle of practical and easy operation, by combining cognitive psychology, information processing, and cycling risks, this study classified cycling status into a three-level system. This system had the capacity to qualitatively describe cycling workload surrounding feelings of safety and comfort and the corresponding performances, which were formulated based on interviews and surveys with cyclists who just completed their cycling task. The cycling workload increased from Level 1 to Level 3 in turn, as shown in Table 1.

Table 1.
Subjective scale for the cycling workload level.
Additionally, one subject matter expert—whose expertise was traffic safe engineering—was invited to validate this subjective scale; the results of this validation are shown in Table 2.
Table 2.
Results of Subject-Matter-Expert Validation.
Based on the results of the assessment, the application was within the “very good” category (so could be used without revision), scoring 86–100%.
A subjective scale method has advantages in that it is easy to collect the data and saves time and the method can account for differences in ability, state, and attitude [24]. However, subjective results alone are not satisfactory or realistic and it is difficult to accurately quantify the cycling workload using these results in isolation. The addition of objective physiological measures can compensate for the weaknesses of the subjective scale and make the results more reliable.
- (3)
- Physiological Indicator of Cycling Workload
Although there is little specific research on objective physiological quantification measurements for dynamic cycling workload, the relevant research on driving workload can be referred, analyzed, and screened to choose a suitable indicator; regardless of whether one is assessing cyclists or drivers, the research subject for measurement is the same—human factors. The difference is that the chosen indicator for cycling workload must be applicable to both the mental and physical workload of cycling.
Many physiological techniques such as electroencephalogram (EEG), electromyography (EMG), electrocardiogram (ECG), respiratory rate and electrodermal activity (EDA), have been adopted as measuring methods to quantify workload in different research fields [25,26]. EEG has been commonly used in the aircraft field due to its sensitivity; however, the data are hard to interpret and EEGs are so sensitive that the results can be affected by several potential factors not related to workload [27]; EEG is not a fit measure for the driving field experiment due to operational problems [21]. EMG is an objective measurement tool that is mainly used in ergonomic and occupational fields to study muscle strain during work and make recommendations for work design [28]; it has been recommended for use in static cycling as mentioned in Section 1, but there is no evidence for its validity in assessing mental workload. EDA has been found to be sensitive to secondary tasks and therefore was recommended for workload measurement and prediction [29]. However, it has been proven to be sensitive only in sudden workload changes rather than in gradual ones [30] and EDA results are impacted by environmental temperature, which means it is unsuitable for field tests. ECG is the most widely used workload-measurement techniques in driving tasks [26]. Among all the ECG indicators, heart rate (HR) and heart rate variability (HRV) are the most commonly used ECG indicators to measure drivers’ workload during a driving or tracking task [31]. Although HR is a common measure for cardiac monitoring, it has been reported that HR cannot measure absolute levels of workload, only relative levels [32,33].
In addition, some researchers have classified workload using physiological data, mainly in the driving and aviation domains, where ECG [34,35,36,37] and EEG [38,39,40,41] are the most commonly adopted physiological techniques. Although most of the research studies clearly presented the workloads of driver and pilot as mental workload (MWL), ECG has been used to evaluate static cycling workload and promising results have been derived, particularly for HRV [42,43]. Based on the literature analysis for the pros and cons of the available physiologic metrics, we inferred that HRV can objectively express cycling workload and effectively accounts for both the mental and physical aspects.
According to theory surrounding HRV [44], there are two methods for the analysis of HRV; i.e., time-domain methods and frequency-domain methods (sometimes called time analysis and spectral analysis, respectively). Frequency-domain methods have two types of records—short-term records (2–5 min) and long-term records (24 h period). Due to time considerations, HRV data in studies usually choose the fluctuations between consecutive instantaneous heart rates for short-term records. There are three main components in the HRV power spectrum—very low frequency (VLF), low frequency (LF), and high frequency (HF). Researchers have shown that an increase in LF is associated with sympathetic activity and a reduction in HF is linked to parasympathetic activity, so an increase in the LF to HF ratio (LF/HF) reflects increases in sympathetic nerve excitability. Among the various frequency-domain HRV measures, LF/HF is the most widely used measure [26]. Additionally, LF/HF is a simple and effective detection index; an increase in the LF/HF is an indicator of an increment in mental workload [45]. There is also evidence [46] that the LF/HF value has the largest correlation coefficient factor with HRV; this finding is significant in the evaluation of physical workload [47,48].
On the basis of theoretical analysis and the applicability to cycling workload, this study selected LF/HF for HRV as the physiological measurement indicator and combined the proposed subjective scale to explore the cycling workload quantification method. In order to obtain the limit value of the physiological signal (LF/HF) under various cycling workload statuses, a field cycling experiment—using different bikeway characteristics impacting cycling workload—was designed and executed.
3. Methods and Materials
According to the literature review and analysis of the measurement of cycling workload, we designed a field experiment to test our hypothesis that, combined with subjective scales for workload level, the LF/HF physiological signal could quantitatively express cycling workload.
3.1. Field Cycling Experiment Scheme Design
As stated in previous sections, there are many variable bikeway characteristics that can be categorized as geometric elements (cycling width, curve radius, and longitudinal gradient, etc.) and facility design (e.g., separation type—barrier, pavement marking, and curb); these impact cyclists’ safety and comfort and reflect cycling workload. In addition, cycling speed has a specific influence due to the necessary physical effort. Hence, in order to measure cycling workload and to obtain threshold values, it is important to control different stress and comfort conditions for cyclists, which can be realized by arranging different combinations of typical bikeway characteristics such as narrow and wide cycling widths with different speeds.
So, we designed a field cycling experiment to be carried out in a variety of conditions on a straight section of a bike path—such as varying the roadway edge, cycling speeds, directions, and widths (see Figure 2, Figure 3 and Figure 4, respectively)—to simulate scenarios that led to changes in cycling workload. It was decided that the test road should be free of motor vehicles and e-bikes in order to accurately reflect the circumstances of a true exclusive bicycle path where a cyclist’s behavior was the only variable; here, their own requirements were the only consideration for the road users while ensuring the safety of the participants. Therefore, the site for the test road was selected on a university campus with asphalt concrete and flat pavement—these were selected to avoid any unpleasant feelings that might be caused by pavement materials or surface. The test road segment was 280 m long, with an additional 70 m long pretest road for cyclists’ adaptability. Moreover, various widths of the test road were established and organized as shown in Figure 2, in accordance with the minimum width specifications of various international standards (Table 3). Figure 3 illustrates a variety of road edge scenarios, including curb + barrier and curb + marking scenarios. Figure 4 depicts the cycling direction conditions, including single-file, one-way abreast cycling, and two-way cycling. The tested cycling speeds for all these road scenarios were in the range of 10–25 km per hour. The final settings of test road scenarios are presented in Table 4.
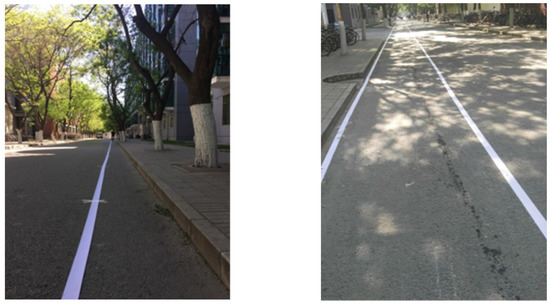
Figure 2.
Cycling workload scenarios—different widths.
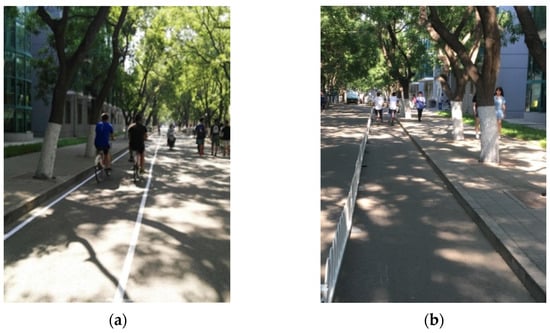
Figure 3.
Cycling workload scenarios—different road edges. (a) Curb + marking scenario; (b) curb + barrier scenario.
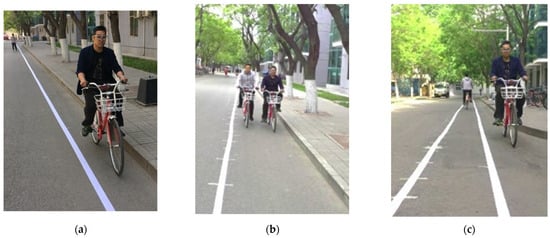
Figure 4.
Different route scenarios: (a) single-file; (b) one-way abreast cycling; (c) two-way cycling.
Table 3.
Basic cycling widths in the guidelines of various countries or regions.
Table 4.
Different scenarios and width arrangements of the test road (m).
3.2. Tested Cyclists and Typical Bicycle
Tested cyclists: All cyclists who participated in the field experiment were in excellent health and were able to respond to a typical riding reaction (i.e., they had normal or corrected eyesight and cycling experience, and they had no history of waist or leg injuries or cardiovascular diseases). According to a site survey on a Beijing bicycle path where only human-powered bicycles were allowed, a 74:26 (male: female) gender ratio was found in the survey results. Accordingly, we randomly recruited 24 cyclists (18 males and 6 females) to fulfill the above requirements; their mean age was 26.5 years (SD = 1.90). Since our experiment involved human factor engineering, the sample size (24 participants) was chosen in accordance with the typical experiments that consider human factors [49,50], which indicated that 24 participants should be sufficient to obtain a power above 0.95 for statistical analysis.
Typical bicycle: According to the site survey in Beijing, the bicycle-type ratio of rental bikes to sports bikes to ordinary bikes was 56:38:6. Therefore, the most commonly used bike—the rental bike—was chosen as the typical bicycle for this study. In accordance with the requirements of the critical state principle, the rental bicycle of the largest size used in the city was selected. This bicycle had the following measurements: handlebar width—620 mm; outer wheel diameter—700 mm; total length—1700 mm; height of the handlebars from the ground—990 mm (Figure 5). The observation data indicated that healthy and non-athletically trained individuals with excellent physical condition could ride at a speed of 10–25 km/h. Consequently, the study adopted 10, 15, 20, and 25 km/h for the test speeds with 5 km/h as the interval.
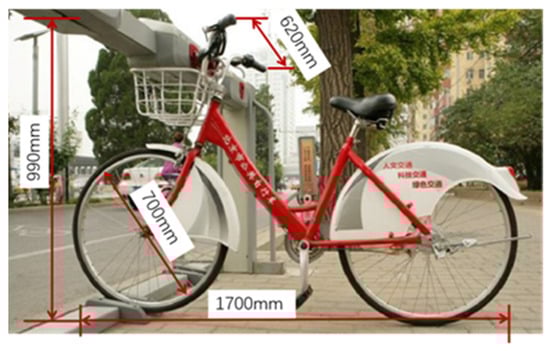
Figure 5.
Dimensions of the typical bicycle.
3.3. Apparatus for Field Cycling Test
Data analysis software was used to obtain the representative HRV indicator—LF/HF—from a wearable, wireless, dynamic multi-parameter physiological detector (BodyMon KF-2), as illustrated in Figure 6a. Figure 6b presents a speedometer that was adopted to monitor the cycling speed of cyclists during the preparatory cycling period and to ensure the required speeds for the test were attained—the tested cyclists were required to note and maintain the status of the riding pedals to maintain the corresponding cycling speed. Furthermore, to ensure the required lane width setting, other accessories such as bicycle lane marking strips, barriers, and measuring tapes were used to complete the tests.
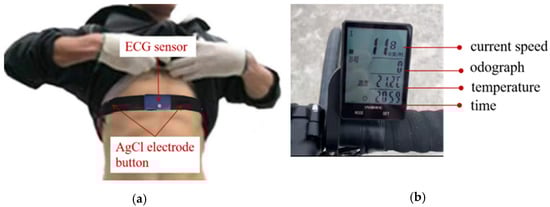
Figure 6.
Main apparatus used in the field experiment. (a) BodyMon KF-2; (b) speedometer.
3.4. Test Procedure
Test preparation: All tested cyclists were informed on the procedure of the study and signed an informed consent form. They were labeled as No.1–No.24 for easy identification as soon as they arrived. They were required to understand subjective scales for qualitative assessment, as per Table 1, which combined the cycling performance of all workload levels (as shown in Table 5). Thereafter, they were equipped with the KF-2 and a researcher was arranged to record the KF-2 data—(LF/HF)i—of all the tested cyclists in calm status as the baseline LF/HF data, where i stands for 1–24. Then, the participants carried out a familiarization ride to adapt to the test apparatus; this ensured that all the measurement and recording processes would not impose an extra workload for them during the formal test riding. During the familiarization ride, a researcher rode behind the participant ready to help in case problems arose with the apparatus or the bicycle.
Table 5.
Subjective scale for qualitative evaluation the cycling workload.
The specific test steps of the field cycling experiment were arranged as follows:
- (1)
- The required lane width of 0.75 m from the curb face to the inner edge was set as per the test arrangement shown in Table 4 with measuring tapes (the lowest count was in mm).
- (2)
- Tested cyclist No.1 cycled on the pretest road until their speed reached 10 km/h.
- (3)
- Tested cyclist No.1 entered the test road by maintaining the pedaling frequency and riding status to maintain the designated speed.
- (4)
- The recorder took note of tested cyclist No.1’s start time, end time, test lane width, test scenario, and test speed.
- (5)
- The KF-2 data (LF/HF)11 of tested cyclist No.1 were assessed and documented properly in detail after they completed test 1 (width—0.75 m; speed—10 km/h; direction—single-file; road edge—marking + curb) to ensure validity of experimental data.
- (6)
- Test 1 was repeated for the remaining 23 tested cyclists with same test protocol that was used for tested cyclist No.1.
- (7)
- For test 2, the test speed was changed to 15 km/h (width—0.75 m; speed—15 km/h; direction—single-file; road edge—marking + curb) and the same procedure as for test 1 was used (with 10 km/h speed). Tested cyclists No.1–No.24 completed test 2 in accordance with steps 1–6.
- (8)
- The test lane width was increased from 0.75 m to 0.8 m for tests 3, 4, 5, and 6 (width—0.8 m; speed—10, 15, 20, and 25 km/h; direction—single-file; road edge—marking + curb). For each test, steps 1–6 were repeated by tested cyclists No.1–No.24 with the amended characteristics.
- (9)
- Then, the test lane width was increased to 0.9 m for tests 7, 8, 9, and 10 at speeds of 10, 15, 20, and 25 km/h. For each test, steps 1–6 were repeated by tested cyclists No.1–No.24 with the amended width.
- (10)
- The test width was then changed to 1.0 m for tests 11 and 12 (width—1.0 m, speed—20, 15 km/h, direction—single-file, road edge—marking + curb). For each test, steps 1–6 were repeated by tested cyclists No.1–No.24 with the amended characteristics.
- (11)
- The test direction scenario was changed to two cyclists (side by side and two-way cycling) one after another. The test procedure steps 1–10 were repeated with the cyclists in pairs from tested cyclists 1 and 2 to cyclists 23 and 24. The differences here were the required test widths and speeds, which—for both one-way abreast cycling and two-way cycling—were set according to Table 4.
- (12)
- All the tests were repeated by replacing the markings with a barrier and the corresponding scenarios were set as per Table 4. The test processes for this step were similar to those with markings as outlined in step 1.
4. Results and Analysis
4.1. Individual Difference Removal for LF/HF Data
After the cycling experiment, physiological data reflecting cycling workload were obtained under various scenarios. A one-way analysis of variance (ANOVA) was performed to determine the effect of the individual on the real-time (LF/HF)ij. We used 72 different scenarios (two edge types × four speeds × three widths × three direction routes, as per Table 4) that were experienced by all 24 participants. In the data of 24 participants for each specific scenario, we found significant differences among the tested participants (p < 0.05), which may have been due to differences in gender, age, riding frequency, and proficiency. In order to overcome the large variance values among individual cyclists, the calculation formula shown in Equation (1) was used: real-time physiological data (LF/HF)ij with (LF/HF)i, which stands for physiological data (LF/HF) when the cyclist No. i was in a calm condition, was deducted. This calculation was used to modify the HRV measurements.
where
∆HRV: correction of HRV;
: the LF to HF ratio of the i-th cyclist at time j in cycling condition;
: the median of LF to HF ratio of the i-th cyclist in a calm condition.
4.2. Correlation between ΔHRV and Subjective Scale Level
Since the subjective scale levels were the ordinal dependent variables, ordinal regression (PLUM) could predict whether the ΔHRV values had a statistically significant effect on the subjective scale levels. The PLUM analysis carried out using SPSS Statistics 25 demonstrated that the ΔHRV values had a significant effect on the cycling workload subjective scale levels (p < 0.001). An increase in ΔHRV per unit was associated with an increase in the odds of subjective stressful level, with an odds ratio of 1.060 (95% CI, 1.037 to 1.084), Wald χ2(1) = 26.494, p < 0.001. Additionally, for the different subjective levels, since the ΔHRV values of each level did not satisfy the normal distribution, the nonparametric test method with unknown overall distribution (the Kruskal–Wallis test—used for more than two independent groups) was carried out to test the significance of ΔHRV values among different subjective levels. The results suggested that H(2) = 85.77 and p < 0.001, which meant the difference between subjective levels was statistically significant.
The relationship of ΔHRV values between different subjective levels is shown in Figure 7, which clearly indicates that when the subjective scale level increased and the ΔHRV values were increased, the ΔHRV in Equation (1) could be used to express the cycling workload model (where the ΔHRV value represents cycling workload). This proved that cycling workload could effectively express and quantify the safe and comfortable status of a cyclist.
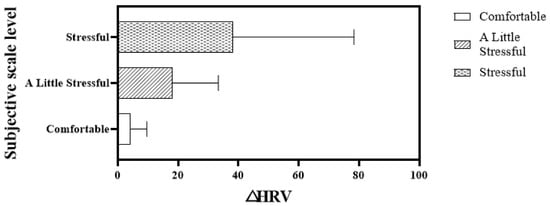
Figure 7.
Distribution of ΔHRV and subjective scale level.
4.3. Classification of Cycling Workload Level
The effective sample size of the test results for ΔHRV and qualitative cycling workload level was found to be 9485 of the total 13,824 samples collected during the field cycling tests. In the pre-processing of the cycling workload data using ANOVA, we found that in most cases, there was no significant difference between genders for the ΔHRV value. After cleaning the data to remove unrealistic or extreme data—possibly caused by extreme conditions of human error or poor contact of electrode buttons due to sweat—we used the 85th percentile of the 24 cyclists’ ΔHRV data to analyze the final results, which meant the data reflected the value below which 85% of the cyclists’ data could be found.
Since the classification and regression tree (CART) algorithm can be used to predict outcomes based on certain predictor variables [51] and has been successfully adopted in driving workload classification research based on the variable of the physiological signal [36], we employed a CART algorithm to classify the valid test data based on a machine learning process. Of the sample size, 80% was randomly selected as the training sample to obtain a CART model while the remaining 20% was adopted as a verification sample for the classification results.
The process started from one root node and eventually traversed all the training data to finally find the split point that minimized the classification error. After the split point was generated, the root node was correspondingly divided into two sub-nodes and the same division is continued until the division error of a leaf node was reduced to less than a certain value. According to the process—and because cycling workload is a continuous process—we combined the corresponding subjective scales and the stopping criteria was defined a minimum change in impurity equal to 0.3. The data-mining processes were conducted via SPSS modeler 18.0. After the CART process, the classification tree diagram was obtained as shown in Figure 8 with four leaf nodes.
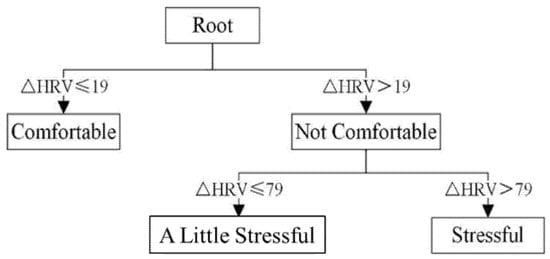
Figure 8.
CART algorithm classification diagram.
Finally, the cycling workload classification thresholds were obtained as shown in Table 6.
Table 6.
CART classification thresholds.
5. Discussion and Conclusions
Cycling is an increasingly popular mode of transportation thanks to its healthy and environmentally friendly effects. However, a high cycling workload caused by an inappropriate design of the geometric elements and facilities of bikeways contributes to the rates and severities of bicycle accidents. Without a quantitative expression method and safe threshold values to determine cycling workload, it is hard to control the workload effectively; furthermore, it is difficult to reduce the concerning social and economic losses caused by bicycle accidents.
In this paper, a cycling workload definition for dynamic cycling was proposed to reflect cyclists’ feelings of safety and comfort while considering their formation mechanism. Based on the concept proposed here for cycling workload, a cycling experience interview survey, and interdisciplinary integration, a corresponding subjective scale was put forward; this scale categorized cycling workload into three levels—comfortable, a little stressful, and stressful. Furthermore, in accordance with the existing literature, the measurement techniques used for workload conditions causing physiological reactions were analyzed; HRV measurements and indicator LF/HF values were finalized to objectively quantify the cycling workload. In addition, a field cycling experiment was arranged to obtain a variety of cycling workload statuses by establishing various cycling widths, speeds, and bikeway edges to reflect typical bikeway characteristic scenarios. A quantification model was built to quantify cycling workload. Finally, the classification thresholds of three cycling workload levels were obtained using a CART algorithm, with the ΔHRV threshold between “a little stressful” and “comfortable” being 19 and that between “a little stressful” and “stressful” being 79.
Our research results, which provide support for the method of measuring cycling workload, comprised a physiological metric of ΔHRV combined with a subjective scale. This method of quantitatively expressing cycling workload can be used for measurement and evaluation of the effects of bikeway characteristics such as lane width and separation facilities. This can contribute to the design of safe and comfortable bikeways and their operational management to reduce the risk of bicycle accidents and provide theoretical and practical support for determining the reasonable technical parameters for bikeway characteristics. Additionally, it can be conducive to the formulation of policies that aim for carbon neutrality; such policies will promote the use of healthy and sustainable bicycle transportation, particularly in areas where bicycle transportation is in great demand for commuting purposes. Moreover, if cycling workload is kept within a comfortable range, then accident risk will be more easily controlled, since high cycling workload—i.e., with ΔHRV values over 79—can result in a higher risk of bicycle accidents, which cause severe life, social, and economic losses.
By utilizing the quantitation method and classification levels for assessing cycling workload that were obtained in this research, the indicator threshold limit values of bikeway characteristics—which ensure cyclists’ safety and comfort (meaning the conditions ensure that cyclists’ ΔHRV values are within a level of safety and comfort)—can be inferred to guide future safety design standards for bikeways. For already-built bikeways, these limit values can be used to assess the safety operation conditions for further improvement. If the characteristics of existing bikeways cannot be improved due to economical or technical difficulties, then safety facilities and signage in the corresponding segment should be adapted to remind cyclists to cycle with caution to mitigate the potential safety risk.
As mentioned in Section 2, the mutual research subject that was used in assessing both driving workload and cycling workload—the human factor—meant that the physiological measurement indicators used in these studies was similar. Direct evidence for this point is that HRV—a physiological assessment technique—can be adopted as a valid safety measurement to evaluate highway geometric design for motor vehicles [36] with the same physiological indicator (LF/HF) representing a driver’s physiological reactions and their safe and comfortable driving status. Nevertheless, due to the different workload types—i.e., driving workloads mainly focus on mental aspects while cycling workloads depend on both mental and physical aspects—the results of classification levels (five for driving workload versus three for cycling workload) and the corresponding thresholds have been proved to be different [36]. We think this is because the relationship curve between driving workload and performance is an inverted ”U” shape [52], whereas cyclists’ performances decrease with workload increase due to their additional and continuous physical pedaling activity. In addition, the comfort and safety evaluation models are also different: the model of driving workload involves speed due to its linear relationship with ΔHRV under driving conditions (as shown in the mentioned study [36]), while there is no specific linear relationship between the cycling speed chosen by cyclists and ΔHRV (as per our experiment results).
This study was conducted using human-powered bicycles because our prior trial experiment showed that there was no specific rule for the physiological signals of e-bike cyclists. We supposed that this was because the workload for e-bike use mainly involves mental workload, making it distinct from human-powered cycling workload; this assumption was in accordance with the premise of existing research that adopted secondary task measurements for e-bike workloads [22]—this provides further proof that the cycling workload should not be regarded as only a mental workload. Hence, for e-bike and human-powered bicycle mixed-traffic conditions—the major traffic type in urban non-motorized vehicle lanes—our quantitative measurement method requires further study and verification before application.
In this study, several bikeway characteristics—such as lane width, bikeway edge, cycling direction—comprised the variety of cycling workload scenarios used to test cyclists. There are many other bikeway characteristics that are relevant to this discussion such as the horizontal curve radius and longitudinal slope and length; the indicator values of these characteristics could be directly connected with workload quantification measurements. The potential for significant correlations between these elements and physiological effects and how they relate to cycling workload can be explored further; such further research will be helpful in directing dedicated bikeway design standards.
In addition, we chose the physiological indicator ΔHRV as the objective cyclist measurement technique. Other objective measures could be used to reflect cyclists’ performance (performance-based measures), such as the lateral position of a cyclist on the cross-section [21,53]. Consequently, the application of other effective measurement approaches and their relationship with cycling workload should also be explored further.
Author Contributions
Conducting the analyses and drafting the manuscript, S.Q.; experiment arrangement and organization, reviewing the draft, R.W.; conceptualizing the study and methodology, supervising the study, reviewing the draft, J.H.; investigation, funding acquisition, provision of resources, L.Y. All authors have read and agreed to the published version of the manuscript.
Funding
This research was supported by the scientific research project of Zhaotong Dayong Expressway Investment & Development Co., Ltd. (YunJiaoKeJiao [2022] No.5) and the traffic scientific research project of the Department of Transport of Shaanxi Province (No. 21-02X).
Institutional Review Board Statement
Not applicable.
Informed Consent Statement
Not applicable.
Data Availability Statement
The data generated in this study are available upon request.
Acknowledgments
The authors would like to thank all the test cyclists for participating in the experiments.
Conflicts of Interest
The authors declare no conflict of interest.
References
- de Hartog, J.; Boogaard, H.; Nijland, H.; Hoek, G. Do the health benefits of cycling outweigh the risks? Environ. Health Perspect. 2010, 118, 1109–1116. [Google Scholar] [CrossRef] [PubMed]
- Chong, S.; Poulos, R.; Olivier, J.; Watson, W.L.; Grzebieta, R. Relative injury severity among vulnerable non-motorised road users: Comparative analysis of injury arising from bicycle–motor vehicle and bicycle–pedestrian collisions. Accid. Anal. Prev. 2010, 42, 290–296. [Google Scholar] [CrossRef] [PubMed]
- Chen, S.; Cui, H.; Tang, M.; Wang, Y.; Zhang, M.; Bai, Y.; Song, B.; Shen, Z.; Gu, D.; Yin, Z.; et al. The injuries and helmet use in bike share programs: A systematic review. J. Community Health 2021, 46, 203–210. [Google Scholar] [CrossRef]
- Babkov. Road Condition and Traffic Safety; Jing, T., Translator; Tongji University: Shanghai, China, 1990. (In Chinese) [Google Scholar]
- Sanders, R.L. Perceived traffic risk for cyclists: The impact of near miss and collision experiences. Accid. Anal. Prev. 2015, 75, 26–34. [Google Scholar] [CrossRef] [PubMed]
- Myhrmann, M.S.; Janstrup, K.H.; Moller, M.; Mabit, S.E. Factors influencing the injury severity of single-bicycle crashes. Accid. Anal. Prev. 2021, 149, 105875. [Google Scholar] [CrossRef] [PubMed]
- Prati, G.; Marín Puchades, V.; De Angelis, M.; Fraboni, F.; Pietrantoni, L. Factors contributing to bicycle–motorised vehicle collisions: A systematic literature review. Transp. Rev. 2017, 38, 184–208. [Google Scholar] [CrossRef]
- de Groot Herwijnen, R. Design Manual for Bicycle Traffic, Record 28; CROW: The Netherlands, 2016; pp. 43–60. [Google Scholar]
- AASHTO Task Force on Geometric Design. Guide for the Development of Bicycle Facilities, 4th ed.; AASHTO: Washington, DC, USA, 2012; pp. 4–15. [Google Scholar]
- Department for Transport. Cycle Infrastructure Design (LTN 1/20); TSO: Oxford, UK, 2020; pp. 38–47.
- Taylor, S.; Giang, C.; Chau, P.; Aumann, P. Cycling Aspects of Austroads Guides; Austroad Ltd.: Sydney, Australia, 2017; pp. 86–92. [Google Scholar]
- Beijing General Municipal Engineering Design & Research Institute Co. Code for Design of Urban Road Engineering; Ministry of Housing and Urban-Rural Development: Beijing, China, 2016; pp. 14–19.
- Su, C.; Yang, Y.; Cheng, C.; Kao, H.; Huang, C.; Tien, J.; Chang, K. Bicycle Lane System Planning and Design Reference Manual, 2nd ed.; Ministry of Transportation and Communications: Taipei, China, 2017; pp. 4-1–4-7.
- National Transport Authority. National Cycle Manual; National Transport Authority: Dublin, Ireland, 2011; pp. 11–20.
- Ul-Abdin, Z.; Rajper, S.Z.; Schotte, K.; De Winne, P.; De Backer, H. Analytical geometric design of bicycle paths. Proc. Inst. Civ. Eng. Transp. 2020, 173, 361–379. [Google Scholar] [CrossRef]
- Vlakveld, W.P.; Twisk, D.; Christoph, M.; Boele, M.; Sikkema, R.; Remy, R.; Schwab, A.L. Speed choice and mental workload of elderly cyclists on e-bikes in simple and complex traffic situations: A field experiment. Accid. Anal. Prev. 2015, 74, 97–106. [Google Scholar] [CrossRef] [PubMed]
- Quesada, J.I.P.; Natividad, M.; Palmer, R.; Psikuta, A.; Annaheim, S.; MichelRossi, R.; Corberán, J.M.; de Anda, R.M.C.O.; Pérez-Soriano, P. Effects of the cycling workload on core and local skin temperatures. Exp. Therm. Fluid Sci. 2016, 77, 91–99. [Google Scholar] [CrossRef]
- Fang, Y. Effects of Cycling Workload and Cadence on Frontal Plane Knee Load. Master’s Theses, University of Tennessee, Knoxville, TN, USA, August 2014. [Google Scholar]
- Cheng, N.; Wu, Z.; Ke, S. Influence of clothing pressure on muscle fatigue during men’s cycling. J. Text. Res. 2019, 40, 130–135. [Google Scholar]
- Chen, J.; Aming, L.; Wang, G. Effect of tight-fitting sportswear of different compression degrees on variation characteristics of sEMG on vastus medialis during cycling motion. China Sport Sci. 2012, 32, 22–31. [Google Scholar]
- Miller, S. Workload Measures; National Advanced Driving Simulator: Iowa City, IA, USA, 2001. [Google Scholar]
- Boele-Vos, M.J.; Commandeur, J.J.F.; Twisk, D.A.M. Effect of physical effort on mental workload of cyclists in real traffic in relation to age and use of pedelecs. Accid. Anal. Prev. 2017, 105, 84–94. [Google Scholar] [CrossRef] [PubMed]
- Hill, S.G.; Iavecchia, H.P.; Byers, J.C.; Bittner, A.C.; Zaklade, A.L.; Christ, R.E. Comparison of four subjective workload rating scales. Hum. Factors 2016, 34, 429–439. [Google Scholar] [CrossRef]
- Muckler, F.A.; Seven, S.A. Selecting performance measures: “objective” versus” subjective” measurement. Hum. Factors 1992, 34, 441–455. [Google Scholar] [CrossRef]
- Charles, R.L.; Nixon, J. Measuring mental workload using physiological measures: A systematic review. Appl. Ergon. 2019, 74, 221–232. [Google Scholar] [CrossRef]
- Tao, D.; Tan, H.; Wang, H.; Zhang, X.; Qu, X.; Zhang, T. A systematic review of physiological measures of mental workload. Int. J. Environ. Res. Public Health 2019, 16, 2716. [Google Scholar] [CrossRef] [PubMed]
- Wierwille, W.W. Physiological measures of aircrew mental workload. Hum. Factors 1979, 21, 575–593. [Google Scholar] [CrossRef]
- Luttmann, A.; Jäger, M.; Laurig, W. Electromyographical indication of muscular fatigue in occupational field studies. Int. J. Ind. Ergonom. 2000, 25, 645–660. [Google Scholar] [CrossRef]
- Mehler, B.; Reimer, B.; Coughlin, J.F.; Dusek, J.A. Impact of incremental increases in cognitive workload on physiological arousal and performance in young adult drivers. Transp. Res. Rec. 2009, 2138, 6–12. [Google Scholar] [CrossRef]
- Fairclough, S.H.; Venables, L. Prediction of subjective states from psychophysiology: A multivariate approach. Biol. Psychol. 2006, 71, 100–110. [Google Scholar] [CrossRef]
- Shakouri, M.; Ikuma, L.H.; Aghazadeh, F.; Nahmens, I. Analysis of the sensitivity of heart rate variability and subjective workload measures in a driving simulator: The case of highway work zones. Int. J. Ind. Ergonom. 2018, 66, 136–145. [Google Scholar] [CrossRef]
- Roscoe, A.H. Assessing pilot workload. Why measure heart rate, HRV and respiration? Biol. Psychol. 1992, 34, 259–287. [Google Scholar] [CrossRef]
- Roscoe, A.H. Heart rate as a psychophysiological measure for in-flight workload assessment. Ergonomics 1993, 36, 1055–1062. [Google Scholar] [CrossRef]
- Pang, B. Classification of Drivers’ Workload through Electrocardiography. Bachelor’s Thesis, Nanyang Technological University, Singapore, 25 May 2016. [Google Scholar]
- Tjolleng, A.; Jung, K.; Hong, W.; Lee, W.; Lee, B.; You, H.; Son, J.; Park, S. Classification of a driver’s cognitive workload levels using artificial neural network on ECG signals. Appl. Ergon. 2017, 59, 326–332. [Google Scholar] [CrossRef] [PubMed]
- Hu, J.; Wang, R. Classification of driving workload affected by highway alignment conditions based on classification and regression tree algorithm. Traffic Inj. Prev. 2018, 19, 214–218. [Google Scholar] [CrossRef] [PubMed]
- Qu, H.; Gao, X.; Pang, L. Classification of mental workload based on multiple features of ECG signals. Inf. Med. Unlocked 2021, 24, 100575. [Google Scholar] [CrossRef]
- Lei, S.; Welke, S.; Roetting, M. A Comparison of Classification for Driver Mental Workload Using ERP and Band Power Parameters. In Proceedings of the 8 Berliner Workshop of Human-Machine-System, Berlin, Germany, 9 October 2009. [Google Scholar]
- Ricks, D.L. A Novel Analysis of Performance Classification and Workload Prediction Using Electroencephalography (EEG) Frequency Data. Master’s Theses, Air University, Montgomery, AL, USA, 26 March 2015. [Google Scholar]
- Zarjam, P.; Epps, J.; Lovell, N.H. Beyond subjective self-rating: EEG signal classification of cognitive workload. IEEE Trans. Auton. Ment. Dev. 2015, 7, 301–310. [Google Scholar] [CrossRef]
- Pang, L.; Guo, L.; Zhang, J.; Wanyan, X.; Qu, H.; Wang, X. Subject-specific mental workload classification using EEG and stochastic configuration network (SCN). Biomed. Signal Process. Control 2021, 68, 102711. [Google Scholar] [CrossRef]
- Bi, X.; Zheng, X.; Yang, H. Optimal selection of resistance mode during different length of time (within 1 min) riding and the relationship of power and heart rate variation characteristic. J. Chengdu Sport Univ. 2017, 43, 73–79. [Google Scholar]
- Li, Y.; Yan, H.; Yu, X.; Gong, G. A comparative analysis on sensitive indices of electrocardiogram to exercise load. Space Med. Med. Eng. 2014, 27, 6. [Google Scholar]
- Malik, M. Heart rate variability: Standards of measurement, physiological interpretation, and clinical use. Circulation 1996, 93, 1043–1065. [Google Scholar] [CrossRef]
- Thayer, R. Activation states as assessed by verbal report and four psychophysiological variables. Psychophysiology 2010, 7, 86–94. [Google Scholar] [CrossRef] [PubMed]
- Li, Z.; Jiao, K.; Chen, M. Analysis on the correlation between simulated driver mental load and heart rate variability. Beijing Biomed. Eng. 2002, 21, 190–193. [Google Scholar]
- Lee, D.H.; Park, K.S. Multivariate analysis of mental and physical load components in sinus arrhythmia scores. Ergonomics 1990, 33, 35–47. [Google Scholar] [CrossRef]
- Li, Y.; Yan, H.; Chen, W. Different characteristic of heart rate variability in mental and physical fatigue states. Space Med. Med. Eng. 2010, 23, 157–162. [Google Scholar]
- Lin, Y.; Liu, Y.; Sun, Y.; Zhu, X.; Heynderickx, I. Model predicting discomfort glare caused by LED road lights. Opt. Express 2014, 22, 18056–18071. [Google Scholar] [CrossRef]
- Gomezvalades, J.M.; Luis, V.; Reina, R.; Sabido, R.; Moreno, F.J. Visual search strategies in expert and novice drivers during the perception of driving scenes. An. Psicol. 2013, 29, 272–279. [Google Scholar]
- Breiman, L.; Friedman, J.H.; Olshen, R.A.; Stone, C.J. Classification and Regression Trees; Chapman & Hall/CRC: Boca Raton, FL, USA, 1984; pp. 10–22. [Google Scholar]
- De Waard, D. The Measurement of Drivers’ Mental Workload. Ph.D. Thesis, University of Groningen, Groningen, The Netherlands, 6 June 1996. [Google Scholar]
- Lee, C.; Shin, H.C.; Kang, S.; Lee, J.B. Measurement of desirable minimum one-way bike lane width. KSCE J. Civ. Eng. 2016, 20, 881–889. [Google Scholar] [CrossRef]
Publisher’s Note: MDPI stays neutral with regard to jurisdictional claims in published maps and institutional affiliations. |
© 2022 by the authors. Licensee MDPI, Basel, Switzerland. This article is an open access article distributed under the terms and conditions of the Creative Commons Attribution (CC BY) license (https://creativecommons.org/licenses/by/4.0/).