Article

Research on Evolution Characteristics of Shale Crack Based on Simultaneous Monitoring of Multi-Parameters

1
Chongqing Institute of Green Intelligent Technology, Chinese Academy of Sciences, Beibei, Chongqing 400714, China
2
Chongqing Environmental Protection Engineering Technology Center for Shale Gas Development, Fuling, Chongqing 408000, China
3
Institute of Mountain Hazards and Environment, Chinese Academy of Sciences, Chengdu 610041, China
4
Graduate School, Chongqing Technology and Business University, Nan’an, Chongqing 400067, China
5
College of Software Engineering, Chengdu University of Information and Technology, Chengdu 610225, China
*
Author to whom correspondence should be addressed.
Appl. Sci. 2022, 12(2), 860; https://doi.org/10.3390/app12020860
Submission received: 29 November 2021 / Revised: 9 January 2022 / Accepted: 11 January 2022 / Published: 14 January 2022
(This article belongs to the Special Issue Applications on Ultrasonic Wave ‖)

Abstract

:
Meso-crack evolution mechanism of shale is a key factor affecting the mechanical properties of shale. In order to explore evolution laws of cracks in shale during loading, a meso-crack monitoring system, loading test equipment and an automatic ultrasonic data acquisition system were set up. On this basis, a set of experimental apparatus simultaneous monitoring multi-parameters of shale micro-crack was designed, and destruction experiments of shale samples with different bedding angles were carried out to find out evolution characteristics of cracks. The results show the following: (1) The designed apparatus can monitor ultrasonic, mechanical and video information simultaneously of crack evolution in the entire process of shale destruction under load to provide information for analyzing acoustic and mechanical characteristic responses of crack propagation at key time nodes. (2) With an increase in load, shale will undergo four stages of destruction: crack initiation, propagation, penetration and overall failure. In the course of these stages, acoustic characteristics and mechanical characteristics are in good agreement, which proves the validity of predicting rock mechanical parameters with acoustic data. (3) During the loading process of shale, the main amplitude of acoustic wave is more sensitive than mechanical parameters to the change of rock cracks. Research results have important theoretical reference value for evaluating wall stability of shale gas horizontal well with ultrasonic data.

1. Introduction

Mechanisms of rock deformation and failure and prediction of rock failure have always been key contents in geotechnical engineering. Many research studies have been conducted in two aspects.
One aspect is monitoring crack evolution during rock failure. For example, Xu Jiang et al. [1] observed evolution laws of cracks in coal sample during shear destruction with a mesoscopic monitoring device developed by themselves. Ge Xiurun et al. [2] described the shape and propagation of cracks during rock destruction by CT scanning. Liu Dongmei et al. [3] accounted for the process of fracture initiation, growth and close in rock with a camera and image processing technology. Zhao Cheng et al. [4] examined deformation and destruction features of rock with pre-fabricated single cracks under uniaxial compression with image analysis and digital image technology developed by themselves. Zhu Zhende et al. [5] extracted length, azimuth angle and area of microcracks by using SEM and region growing algorithm. Zhang Meiying et al. [6] examined initiation and growth of fractures and failure of whitehead, granite and marble by conducting uniaxial compression experiments under SEM. Sun X Z [7] investigated the mechanisms and paths of initiation and growth of 3D fractures in half-disc rock samples with natural fissures by conducting uniaxial compression experiments. After recording the extension of fissures in rock materials under dual-axial compression with a digital camera, Wang et al. [8] divided the rock bridge coalescence patterns into three types and analyzed the effects of fissure angle, rock bridge angle and lateral stress on fracture extension. Wang et al. [9] studies fracture response features of artificial layered rock samples with different bedding angles under uniaxial compression; identified nine types of independent fractures; and analyzed the effect of bedding angles on fracture extension. Wang et al. [10] characterized in situ mesoscopic structure changes of dual-soil mass under triaxial compression quantitatively in real time by industrial CT scanning and found that the deformations caused by slip in rock–soil interface and formation of large pores, etc., have significant control on the extension of fractures. He Qingyuan et al. [11] used acoustic emission technology to study the microcrack rupture of coal samples at different inclination angles. The above research studies have achieved some results but mainly examined the evolution of mesoscopic fractures during rock failure and did not monitor the destruction of rock internal structure effectively.
The other aspect is to detect ultrasonic wave responses relative to internal structure changes during the destruction of a rock. As it is difficult to monitor the internal structure of rocks during destruction directly, this kind of indirect means has the drawn attention of researchers. For example, by monitoring the transmission laws of ultrasonic wave during rock destruction, Zhao Mingjie et al. [12] found a relationship between fracture extension laws and ultrasonic wave features. Cheng Lijun et al. [13] conducted an ultrasonic wave test during the break of shale with an imported RTR-1500 rock triaxial device and obtained a variation pattern of ultrasonic wave velocity during shale destruction. Fu Ronghua et al. [14] tested ultrasonic wave features during sandstone destruction with an RTR-100 testing machine and obtained a relationship between rock dilatancy and S-wave velocity. Liu Xiangjun and Zhu Honglin et al. [15,16] found the transmission laws of ultrasonic wave during destruction of sandstone, shale and dolomite and predicted the stability of rock samples based on the variation features of ultrasonic waves. The above research studies were mostly conducted on testing machines with a sonic module added, but these testing machines are expensive and high in terms of test cost. Some of the research studies were conducted by apparatus composed of an ultrasonic wave test device and mechanical testing machine, but the ultrasonic wave was often picked manually in these experiments and are unable to monitor the rock situation in real time. A lot of elastic waves would be produced during the destruction of rock, and sensitive electronic devices are required in order to monitor these elastic waves. Many researchers have studied features of sounds produced by rock samples under tensile, press and shear conditions. Xie H P et al. [17] conducted uniaxial and indirect tensile tests of layered halite and predicted rock damage based on variations in stress, release of acoustic emission energy and size effect. Simpson et al. [18] reached the finding that shale sample with different bedding angles did not change much in tensile strength but differed widely in damage patterns. Tsuyosh II et al. [19] analyzed the fracture opening situation in the course of a rock straight shear experiment with acoustic emission testing technology. Xiao F K et al. [20] studied the variation laws of AE number, energy, b value and light spectrum during the extension of micro-fissures in a coal sample. Moradian Z A et al. [21] evaluated the damage of rock joints in shear experiment with acoustic emission testing technology. Bunger A P [22] examined acoustic emission behavior of fracture extension in gabbro during a uniaxial tensile experiment. He Qingyuan et al. [23] improved the discrete element method and proposed and incorporated it in the Universal Distinct Element Code (UDEC) to simulate hydraulic fracturing in heterogeneous rocks. Danqi Li et al. [24] developed a novel analytical model coupling crack propagation in the grout annulus to capture load–displacement performance of cable bolts under axial loading. These research studies provide theoretical foundations for the evaluation of deformation mechanisms and stability of host rocks in underground engineering.
Shale gas [25,26,27,28] belongs to unconventional oil and gas resources. With abundant reserves and huge development potentials, the commercial exploitation of shale gas is helpful for eliminating energy shortage. To date, there have been few reports on the method and system of ultrasonic wave monitoring of mesoscopic fissures during shale destruction. In this study, we have developed an integrated unit and system for monitoring sounds and pictures during propagation of mesoscopic fissures in shale to find out the deformation laws of surface, internal structure and rock body of shale during destruction, which is the theoretical foundation for further studies on wall stability of shale gas wells [29,30,31].

2. Experimental Set-Up

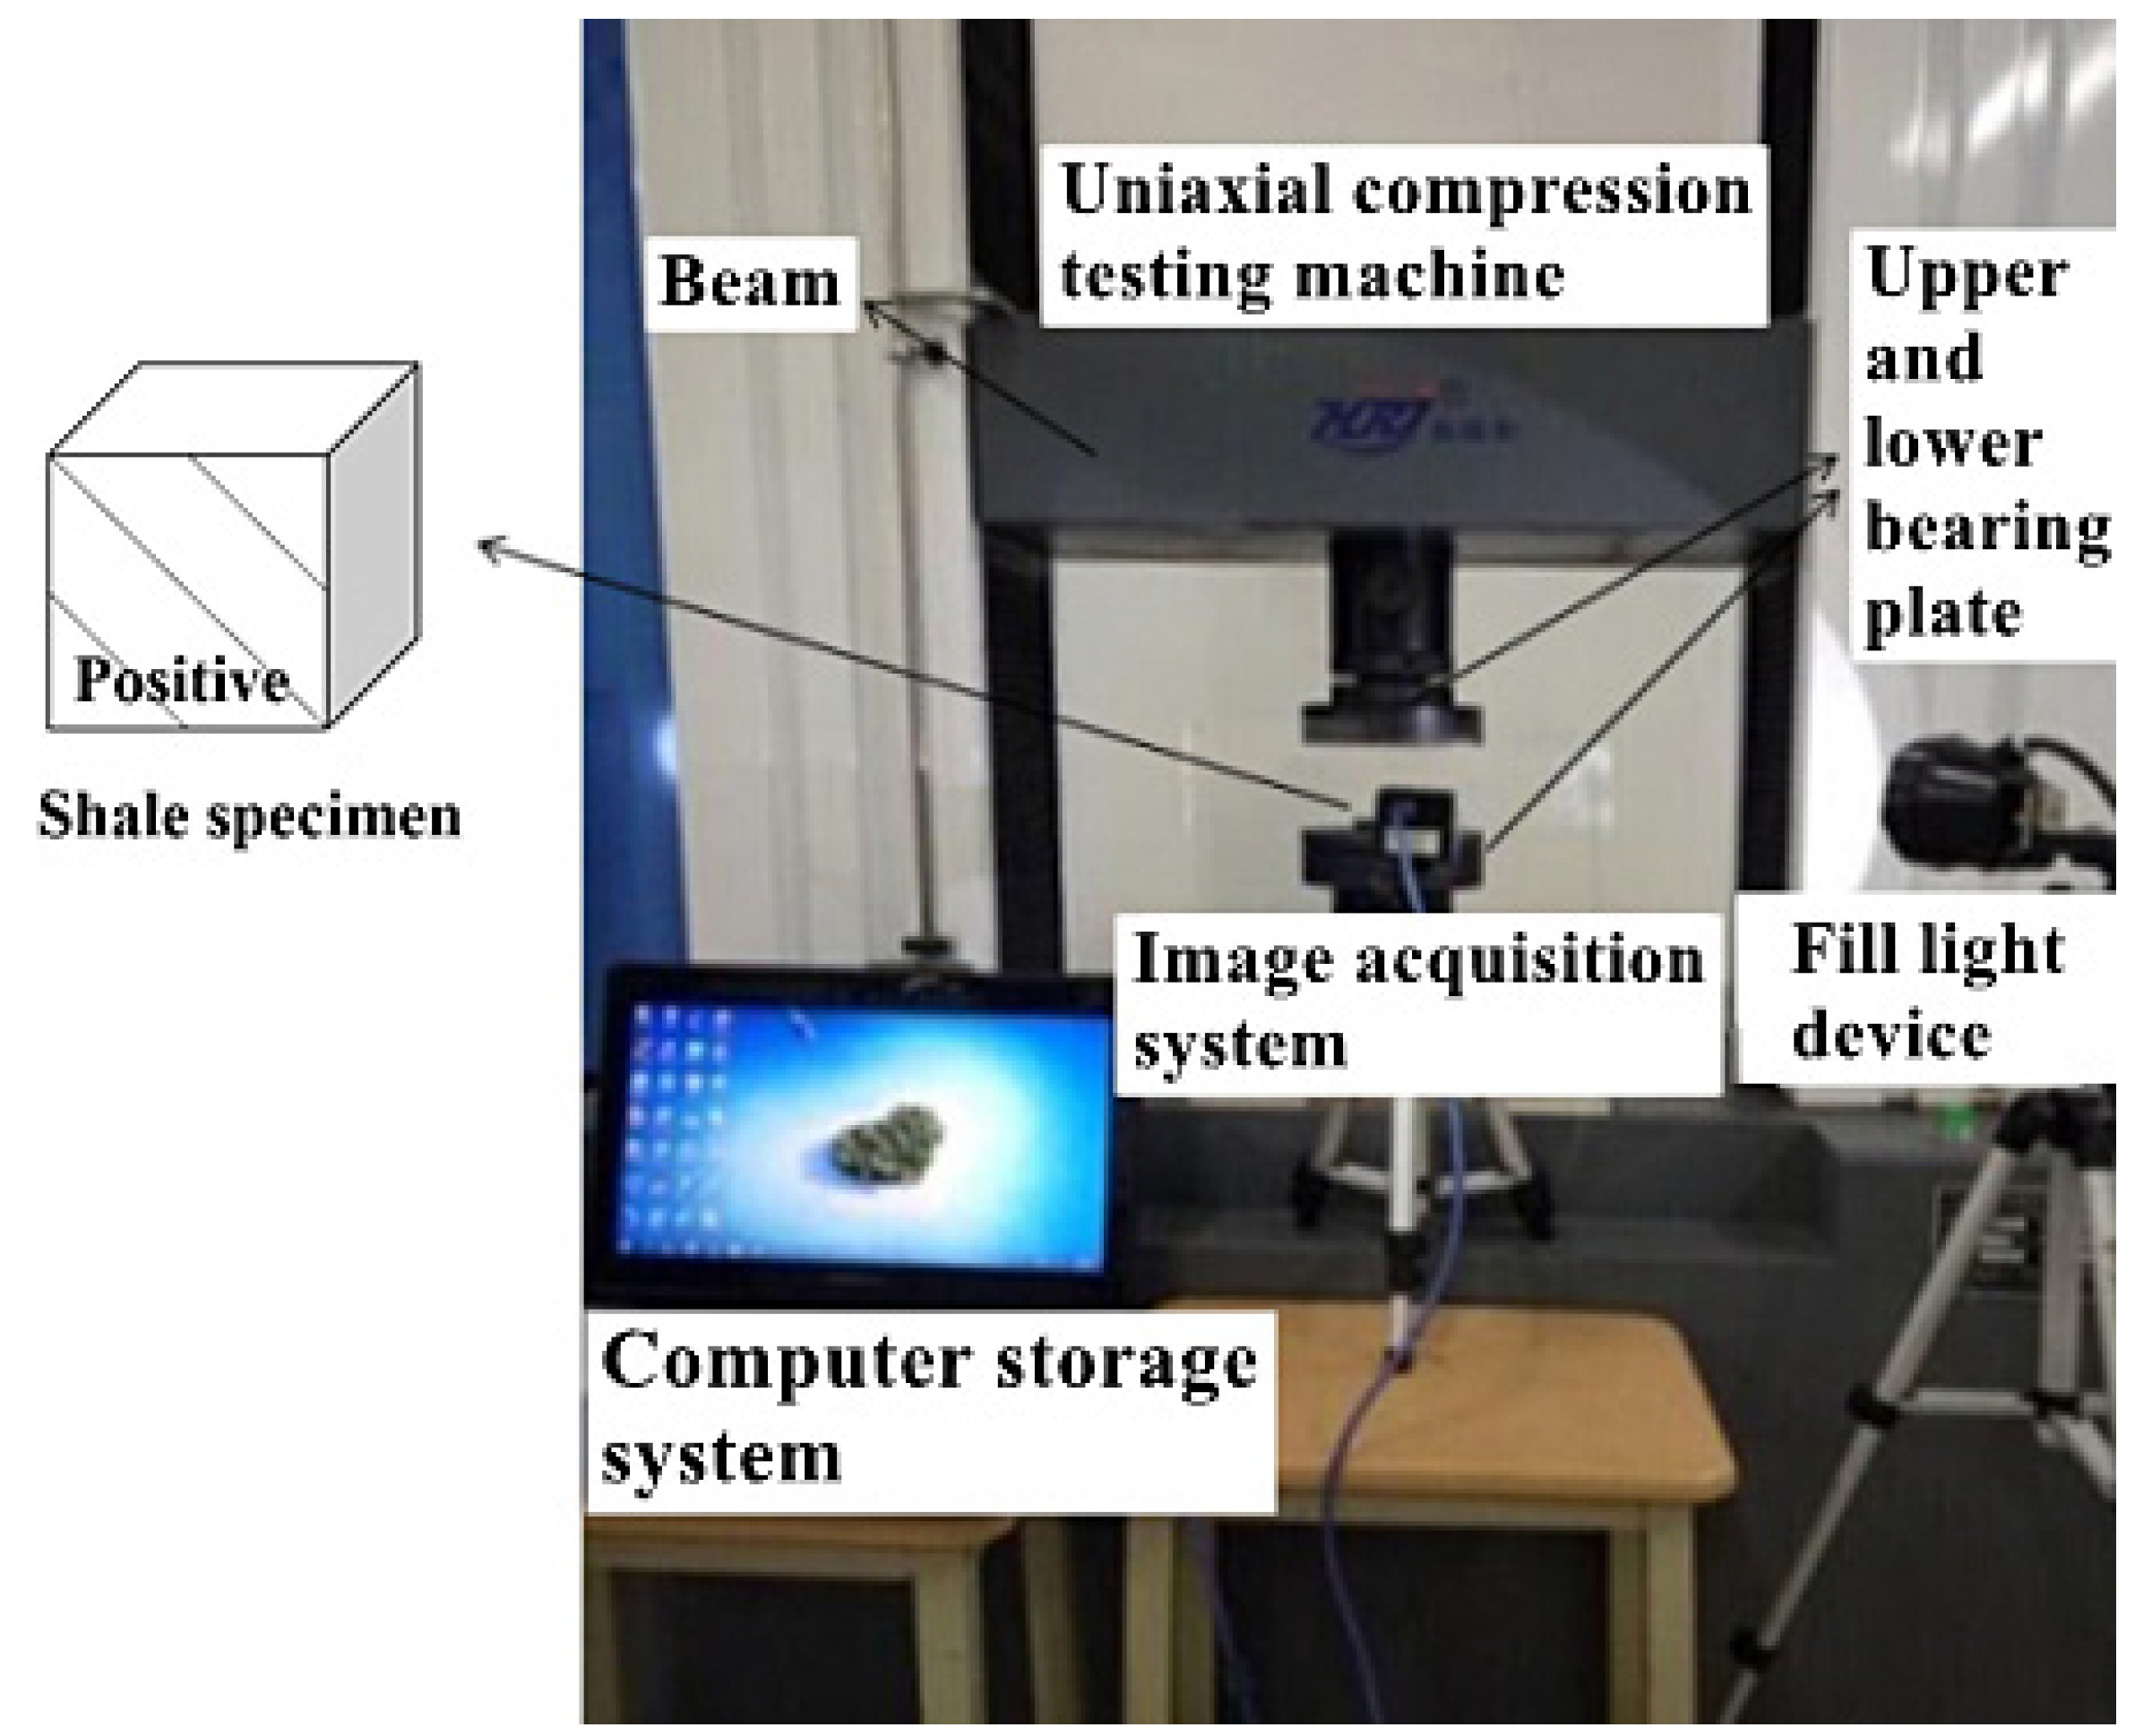
2.1. Loading Experimental Apparatus

Mechanical system refers to the testing machine commonly used in rock physical tests. Experimenters can select testing machines according to purposes and schemes of experiments and then obtain stress and strain data of rock during destruction on the testing machines.

2.2. Monitoring System of Mesoscopic Fracture

This system is composed of a high-speed camera, a tripod, connection wires, fill light instruments and an acquisition system. In the experiment, after the apparatus was connected according to Figure 1, the camera on the tripod was placed in front of the testing machine, facing squarely relative to the rock surface observed. The tripod was moved to adjust the position of the camera, and an LED light was used to project light on the rock’s surface where the evolution of fracture on the rock surface observed is clearly visible and picked by the camera. After the experiment began, the software was switched on to record the process of rock destruction, and video signals were sent to and saved in the computer. After the experiment ended, the recording process was stopped.

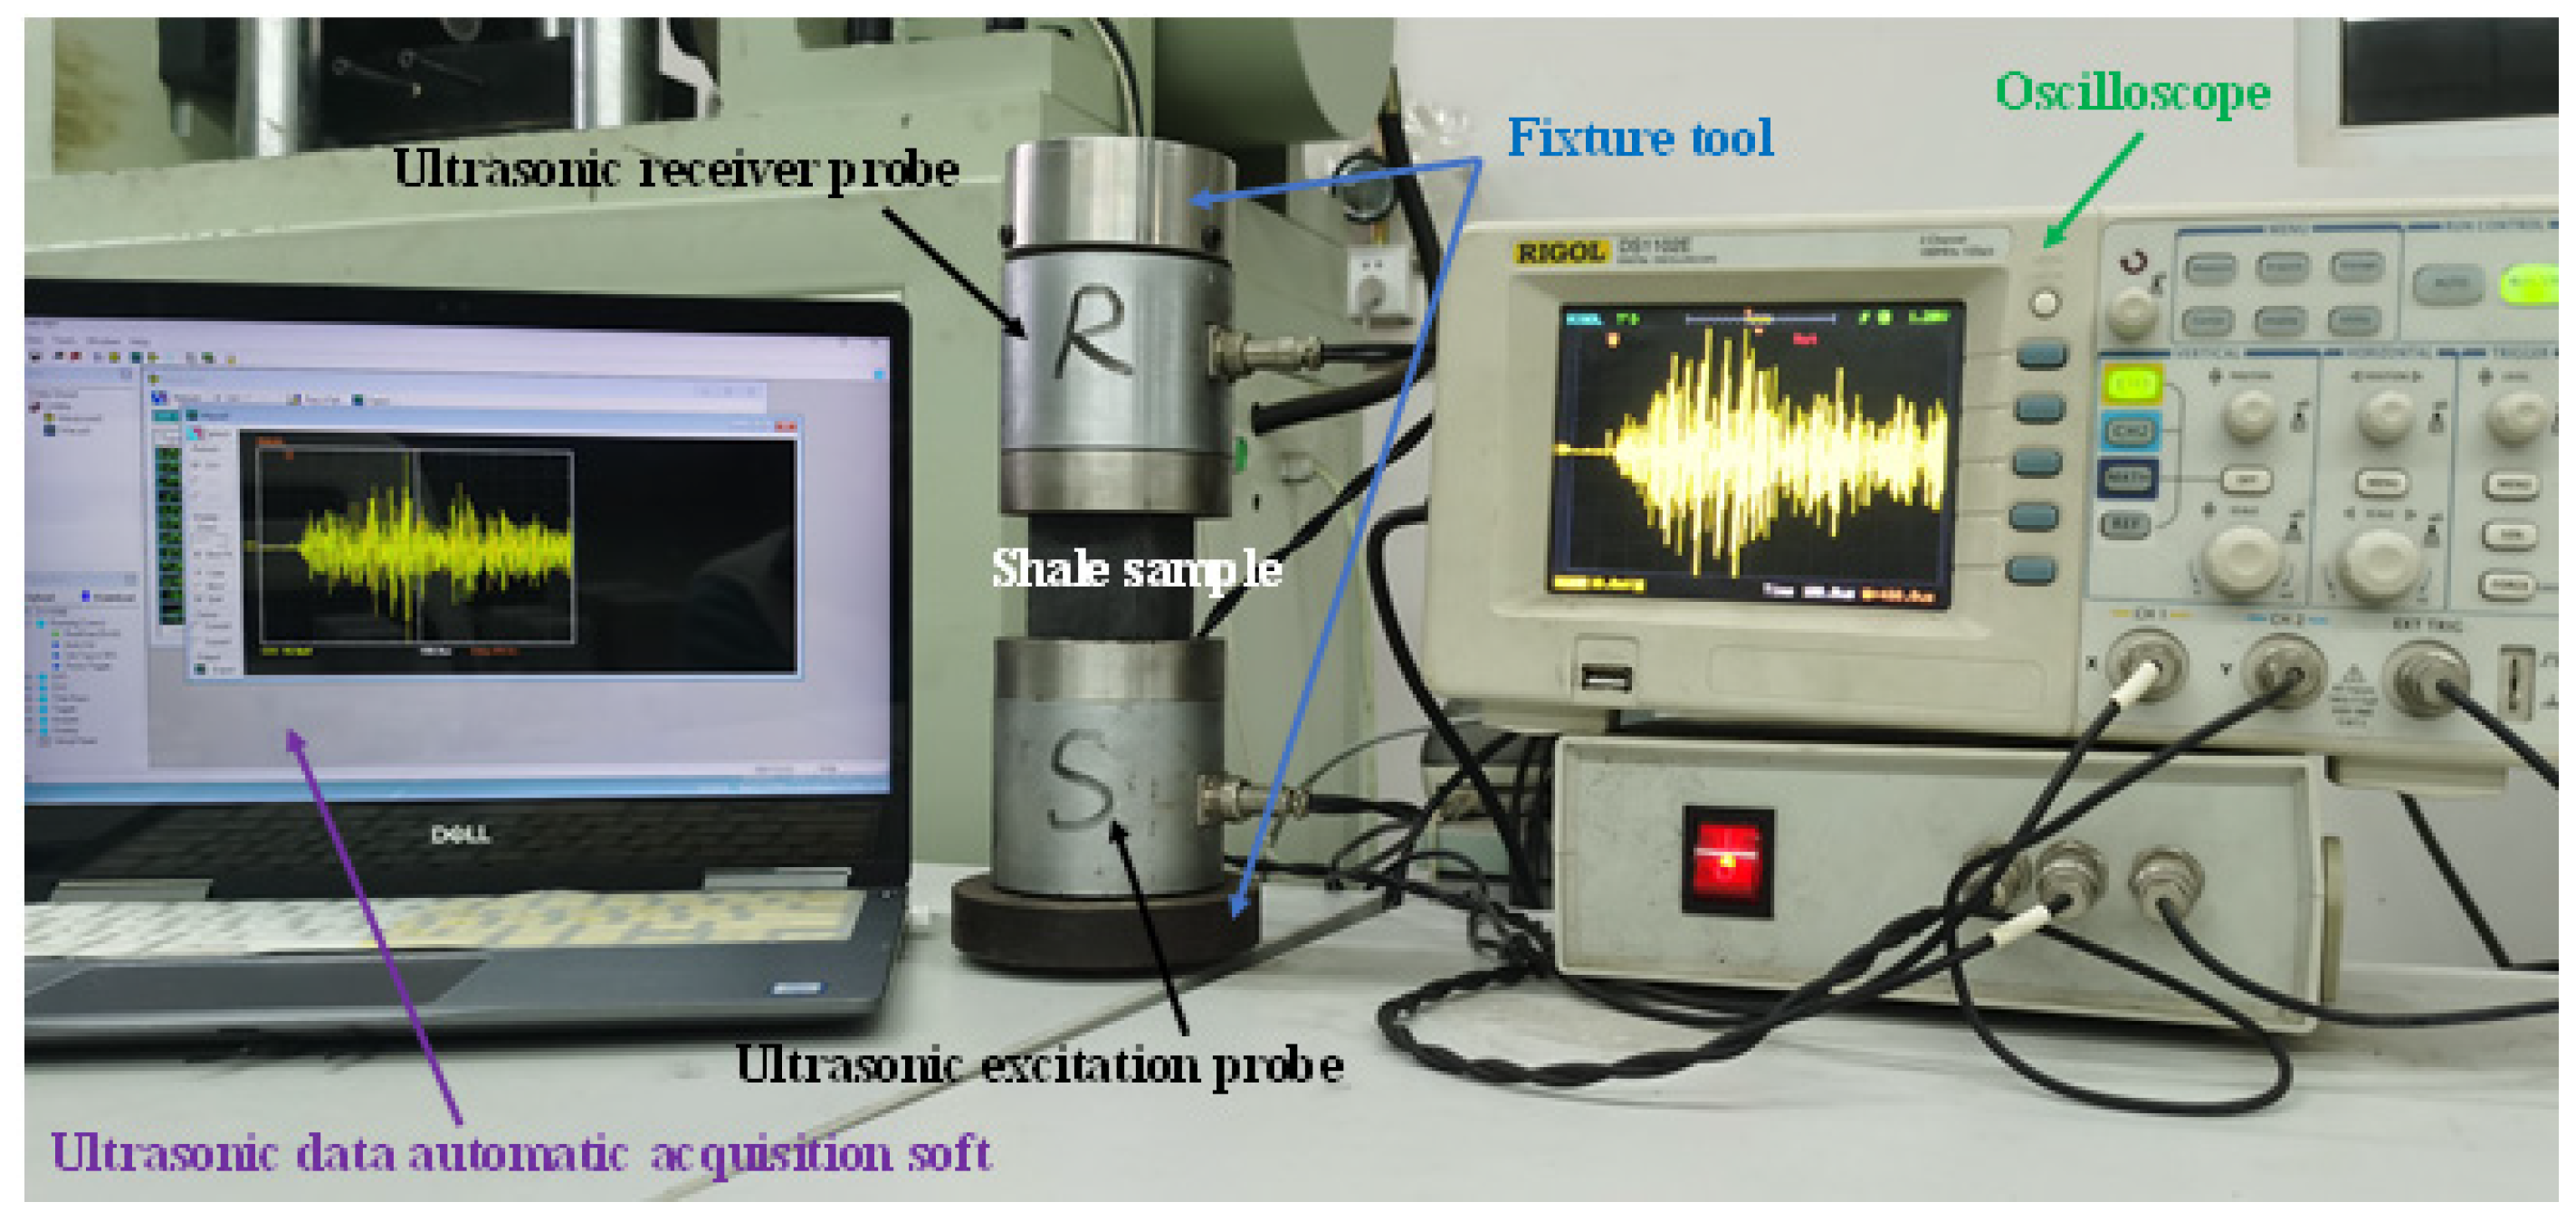
2.3. Ultrasonic Data Acquisition System

This system is composed of an ultrasonic wave probe designed by ourselves and fixture tools and an automatic acquisition software. (Figure 2)

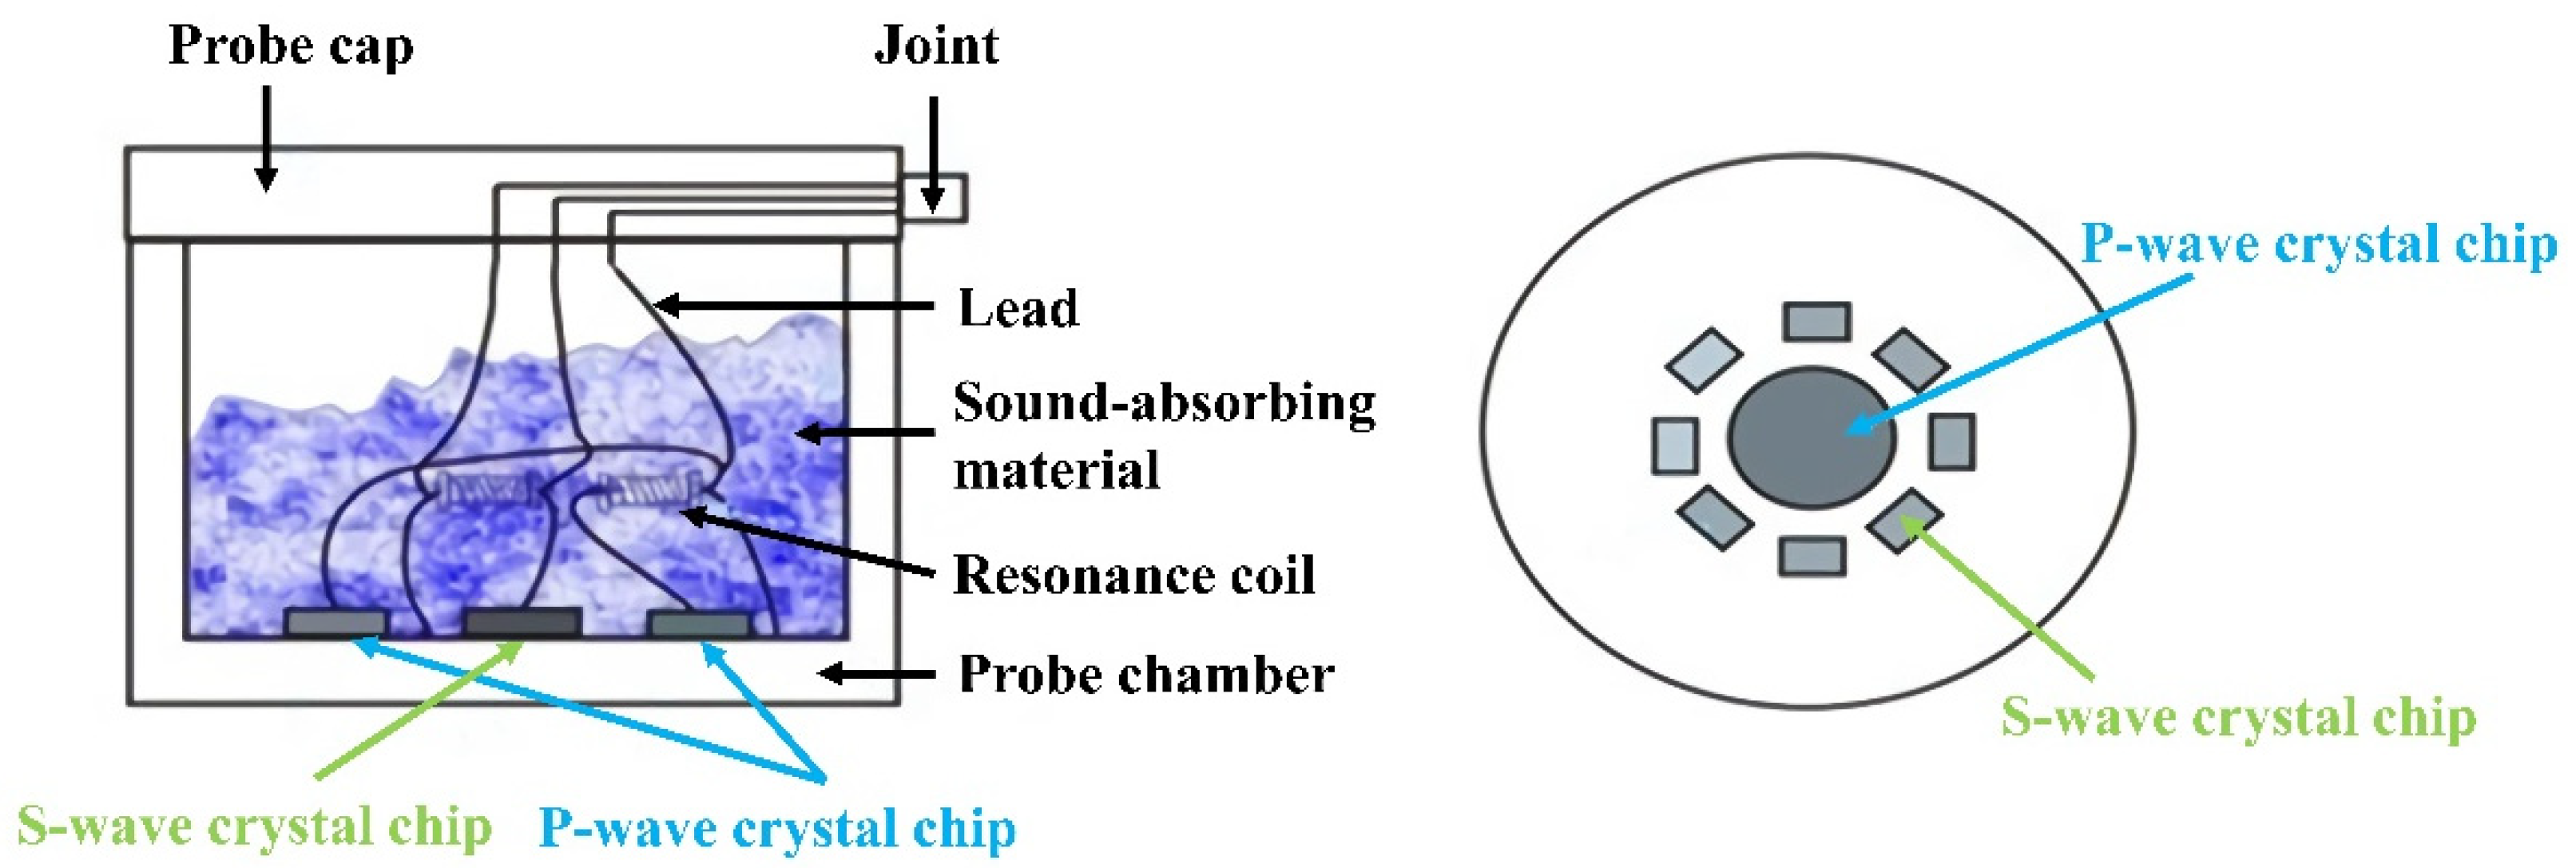
2.3.1. Ultrasonic Wave Probe
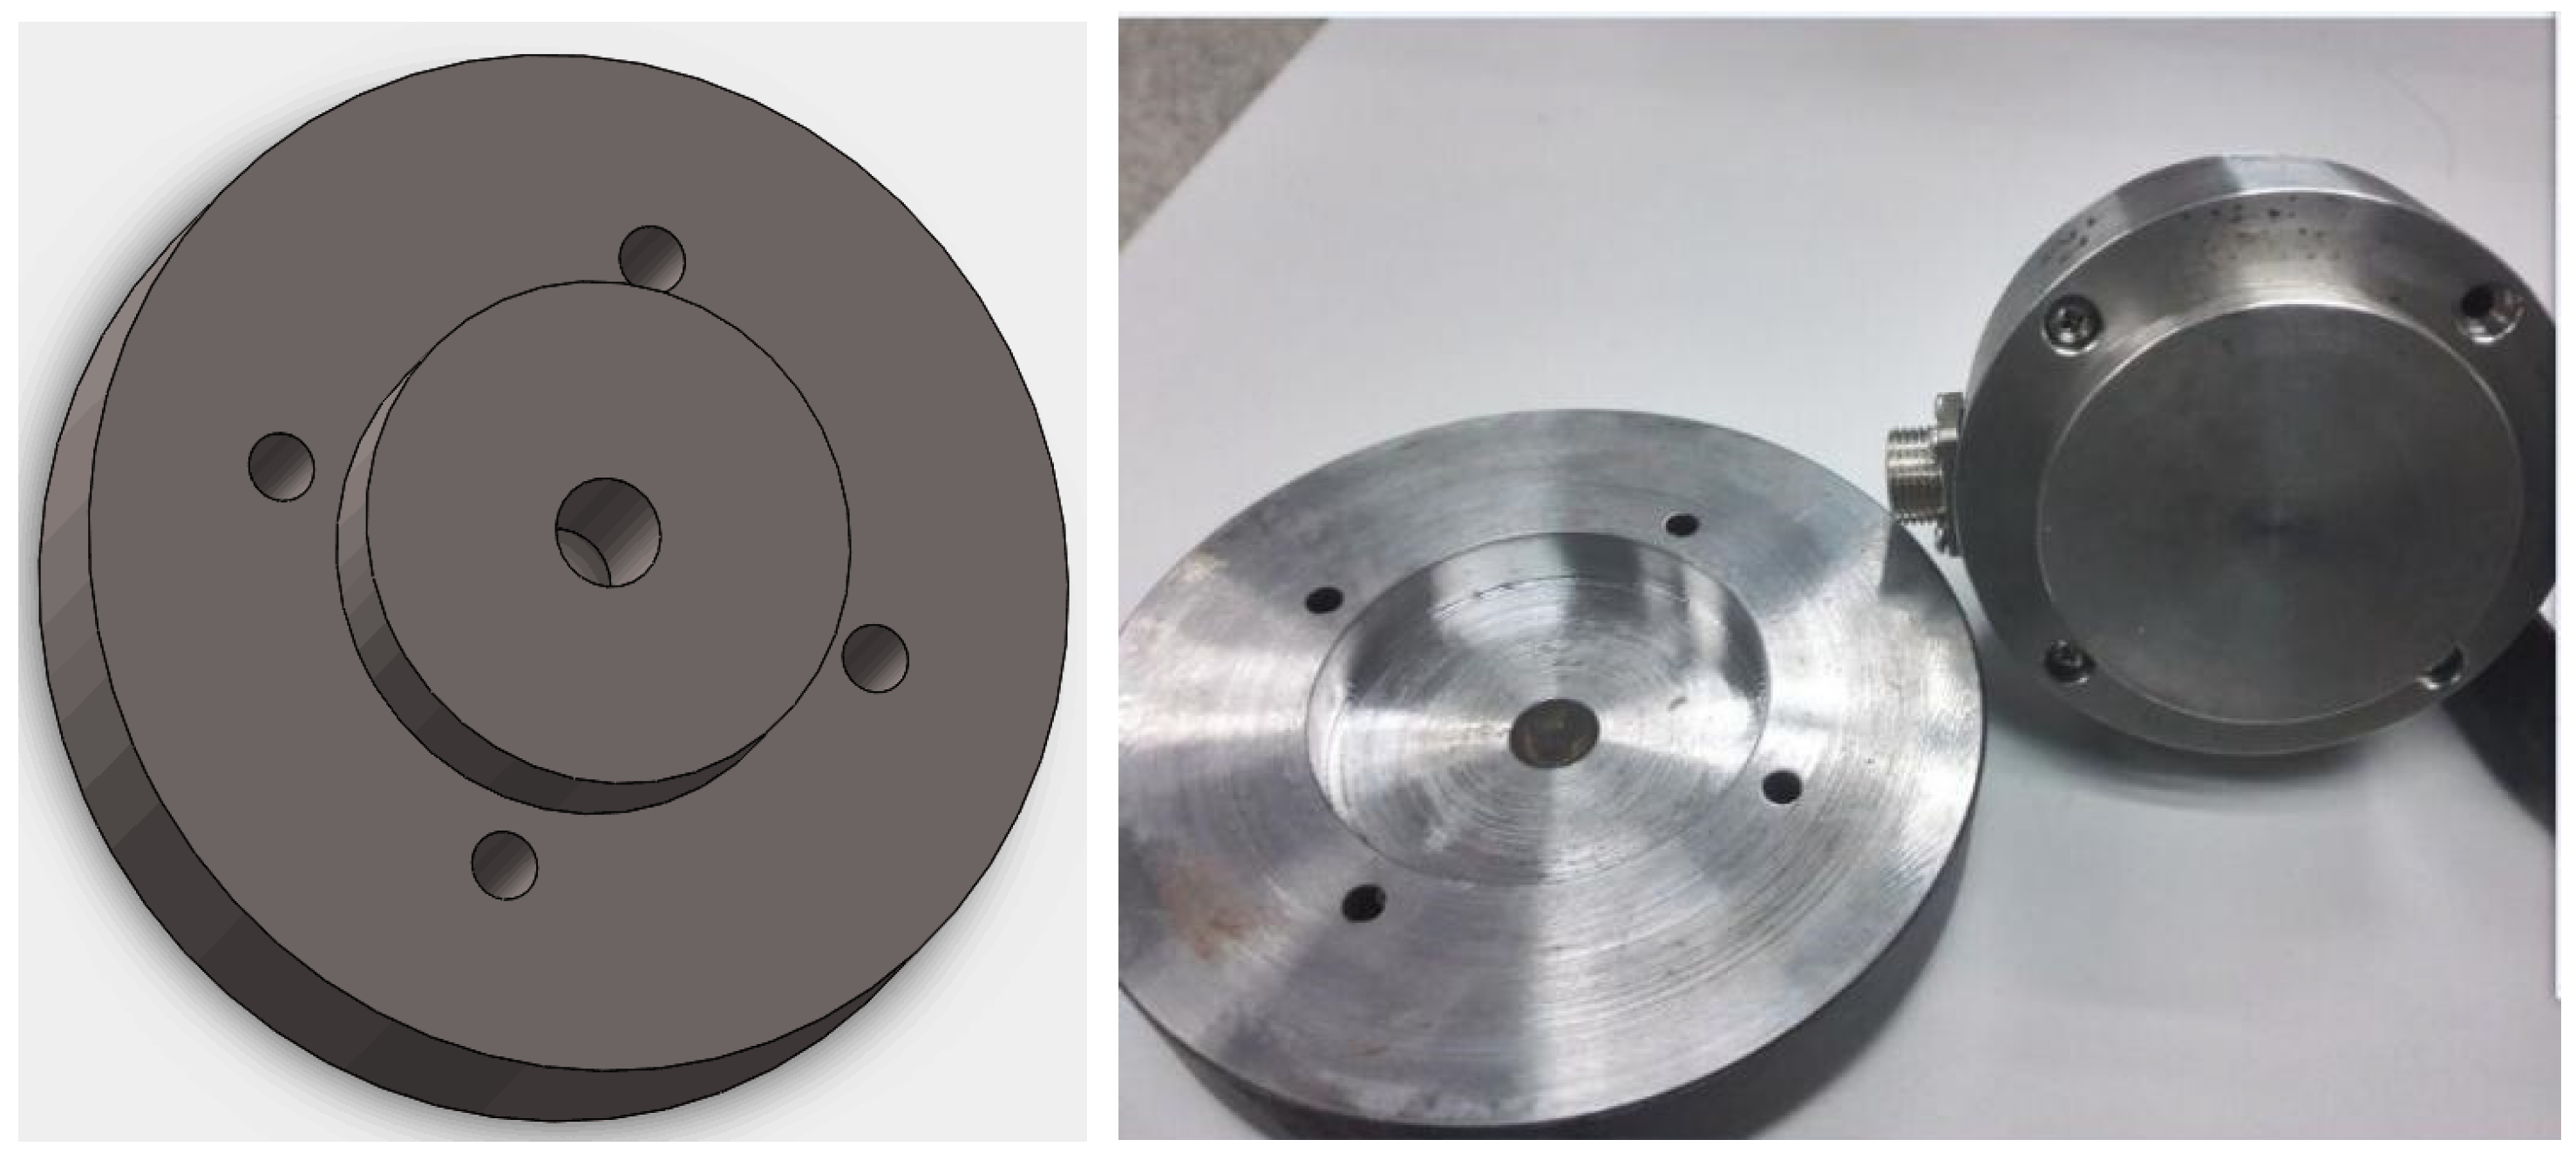
In order to search for transmission laws of ultrasonic wave during the destruction of the rock sample, the load-bearing plates on the testing machine needed to be replaced by multi-frequency ultrasonic wave probes developed by ourselves, and the specific steps are as follows.
The ultrasonic wave probe, an important sensor in the tests of rock physical and acoustic properties, can send ultrasonic wave and receives acoustic signals modulated by rock physical and mechanical properties. The acoustic wave test system is used to detect physical and acoustic properties of rock samples under different stresses; thus, the ultrasonic wave probe must be able to withstand high pressure.
Figure 3 shows the structure of the ultrasonic wave probe. The ultrasonic wave probe is made up of piezoelectric crystal chips, resonance coils, a probe chamber, a probe cap, sound-absorbing material, signal leads and a joint. The ultrasonic wave probe uses the converse piezoelectric effect to send ultrasonic waves and uses direct piezoelectric effects to receive ultrasonic waves. In acoustic tests, the ultrasonic wave probe must withstand high pressures of up to 300 MPa; thus, the probe needed to be thickened, especially the contact between the probe and tested sample. The thickness of the face plate of the probe (the metal plate between the crystal chips and tested sample) was designed as an integer times the wave length of the transmitted ultrasonic wave to augment the energy of the transmitted or received ultrasonic waves.

2.3.2. Fixture Tool

According to the shape of the testing machine and probe, the fixture tool was designed (Figure 4) to connect the ultrasonic wave probe designed by us to the testing machine.

2.3.3. Automatic Acquisition Software

The ultrasonic wave acquisition software picks and pre-treats ultrasonic waveform data from the oscilloscope to provide basic data for acoustic signal analysis. Programmed by VB, the automatic acquisition software has the following functions: equipment connection, pickup of basic wave form, time base information configuration, settings of waveform acquisition scale, pre-treat and display of wave.
On this basis, a system that can monitor mesoscopic fractures in shale samples from mechanical and acoustic perspectives and by video simultaneously was set up (Figure 5).

3. Experimental Method and Principle

3.1. Processing of Acoustic Wave Signals

The predominant amplitude of acoustic wave can better reflect the damage and destruction process of rock than acoustic wave velocity [1]; thus, the acoustic wave parameter used in this study was predominantly amplitude.

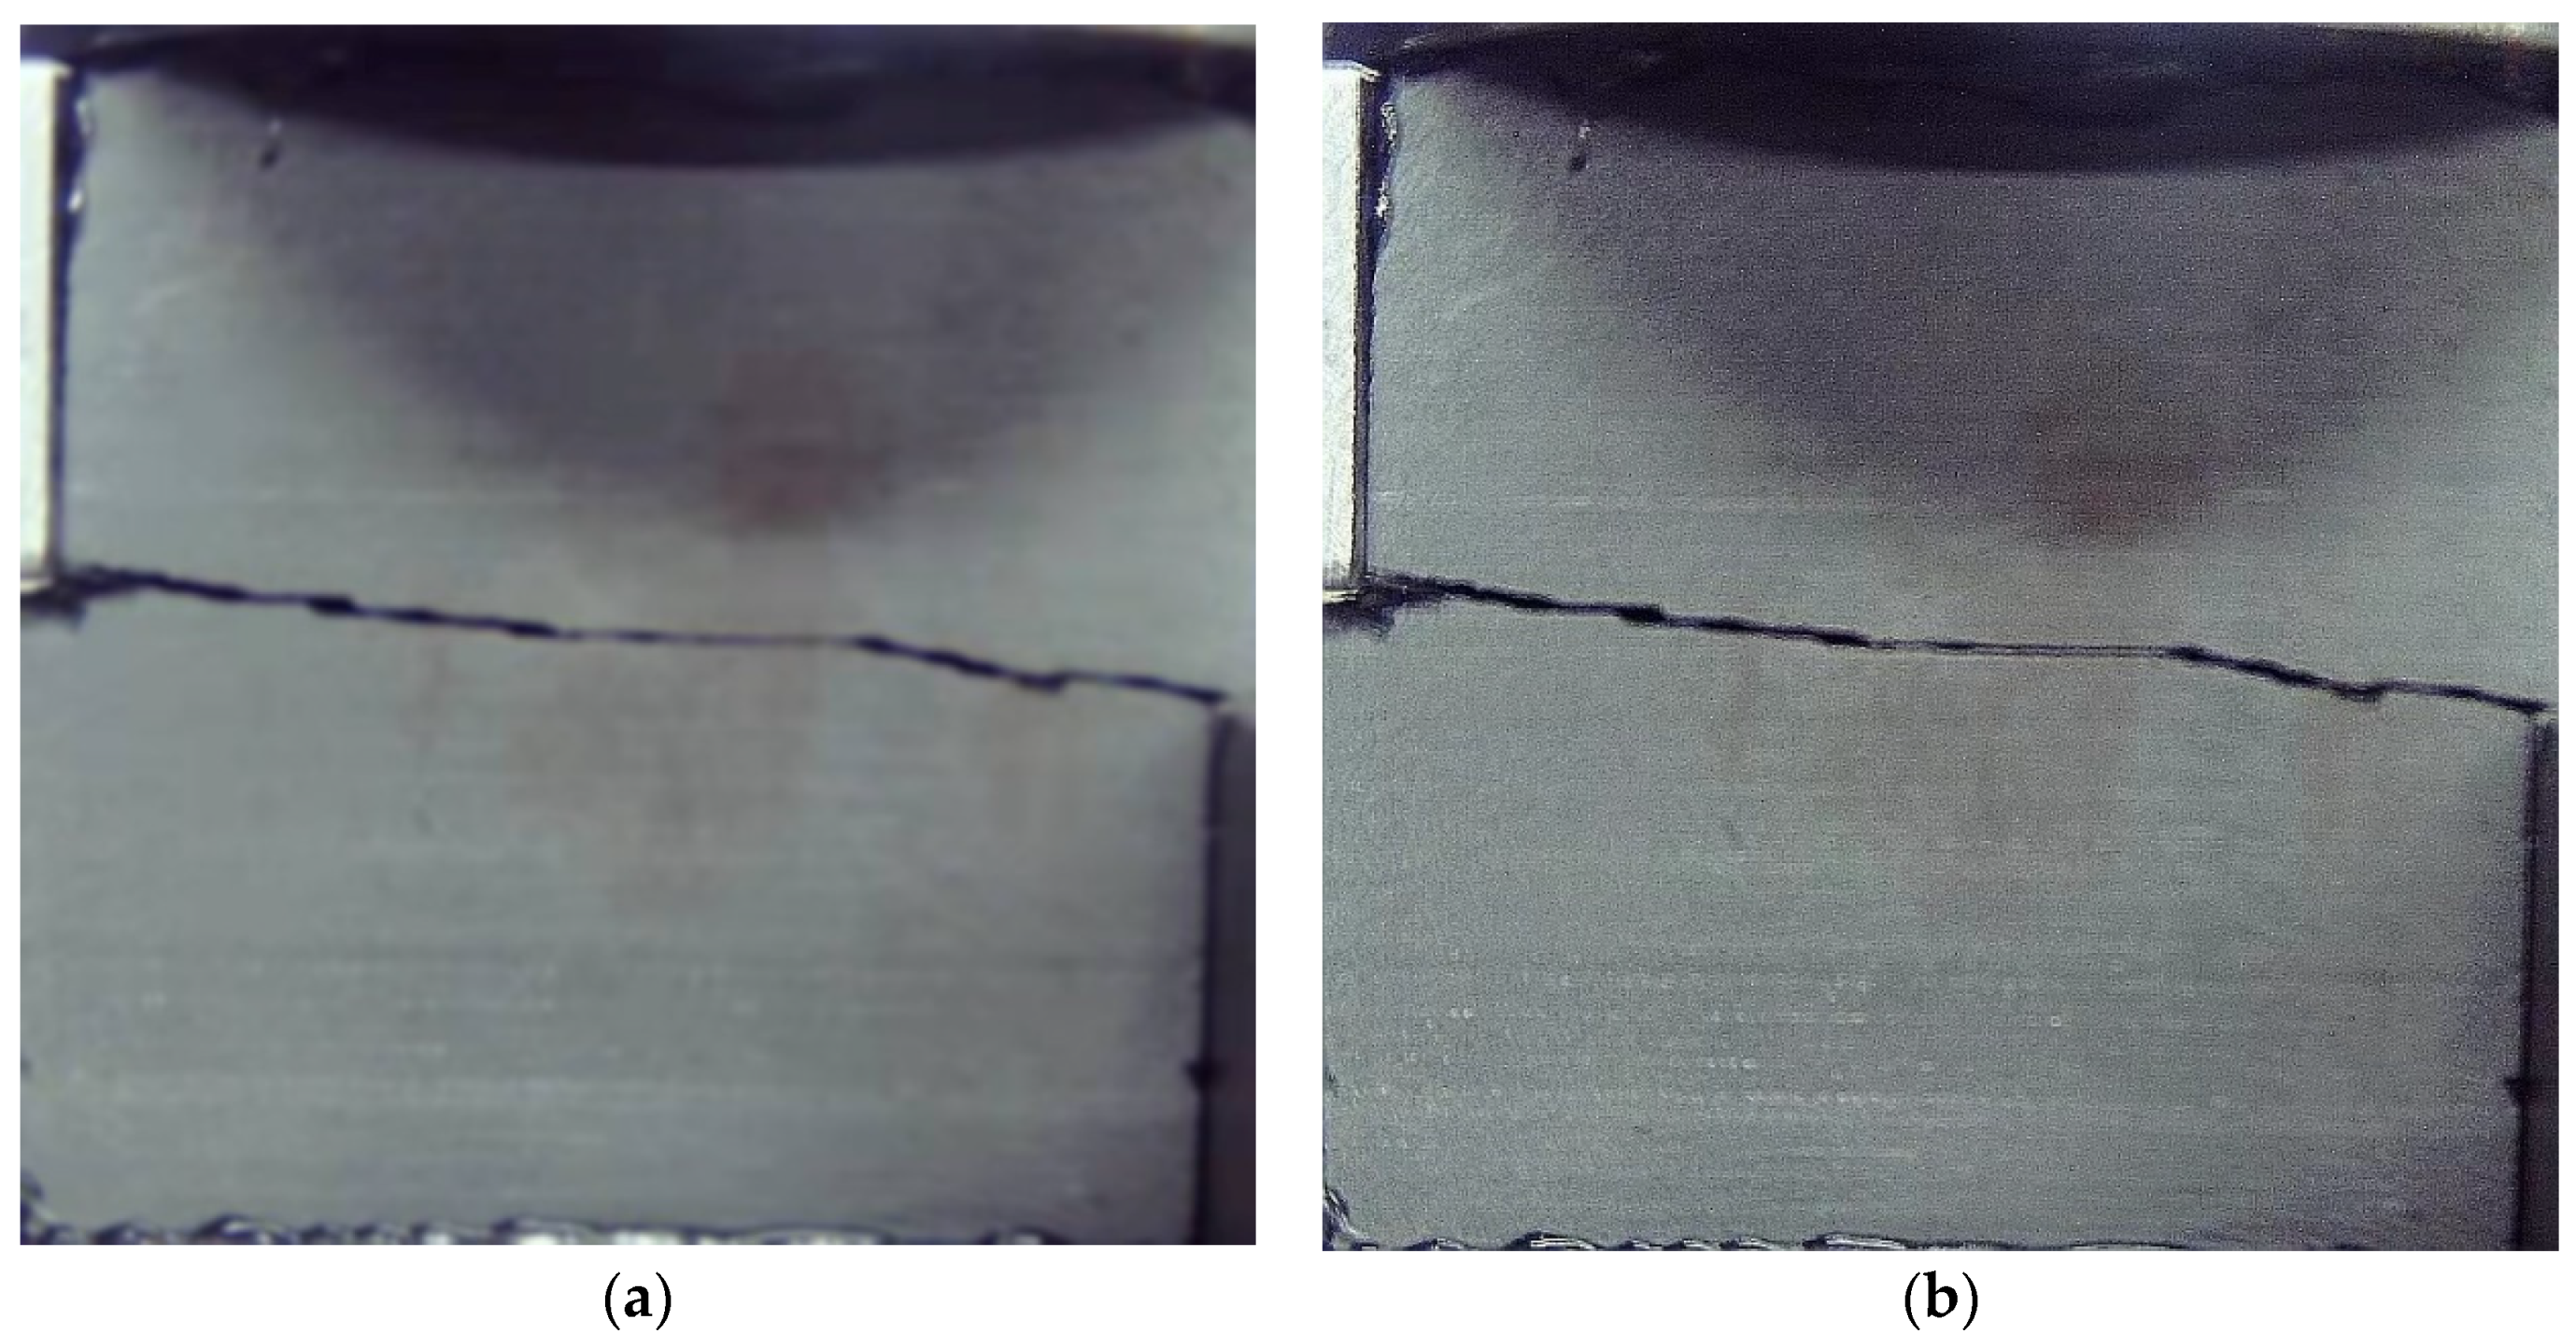
3.2. Processing of Video Signals

For the acoustic-mechanical test on cubic shale samples, in addition to picking up acoustic and mechanical data according to the above method, we needed to process video data recording the course of shale destruction. As all computer times have been synchronized, the time recorded in the video included all time periods of mechanical and acoustic records. In order to present the evolution of shale fractures as complete as possible, the authors used the Corel VideoStudio pro software to extract images of the observed face at 20 frames per second, and then used VB to write digital image batch processing codes to complete pre-processing, segmentation and binarization of the images to obtina acoustic-mechanical data and corresponding static images of fractures.
The specific steps are as follows.

3.2.1. Image Pre-Processing

The static core images obtained from the video contained various kinds of system noises, which would not only bring down image quality but also be harmful for later quantitative analysis. Therefore, the first step of image processing was to attenuate noises and enhance signal to noise ratio by using a filtering algorithm while keeping the details and margin information of the images. Filtering algorithms commonly used include Gaussian filtering, median filtering and mean filtering. In comparison, the median filter will not make the image boundary fuzzy while simultaneously smoothing noise effectively; thus, the outline features of the image can be kept well. Hence, the median filter was adopted in this study to attenuate noises in the original gray images of the shale sample.
As observed from Figure 6a, since the picture is extracted from the video file generated by the camera, the picture is relatively blurred. After filtering, the cracks in the image appear clearer (Figure 6b). At the same time, the gray images after median filtering had a natural transition between the fractures and matrix, smooth boundaries and important feature information in the images were well preserved, laying a solid foundation for the next image segmentation of fractures and background matrix.

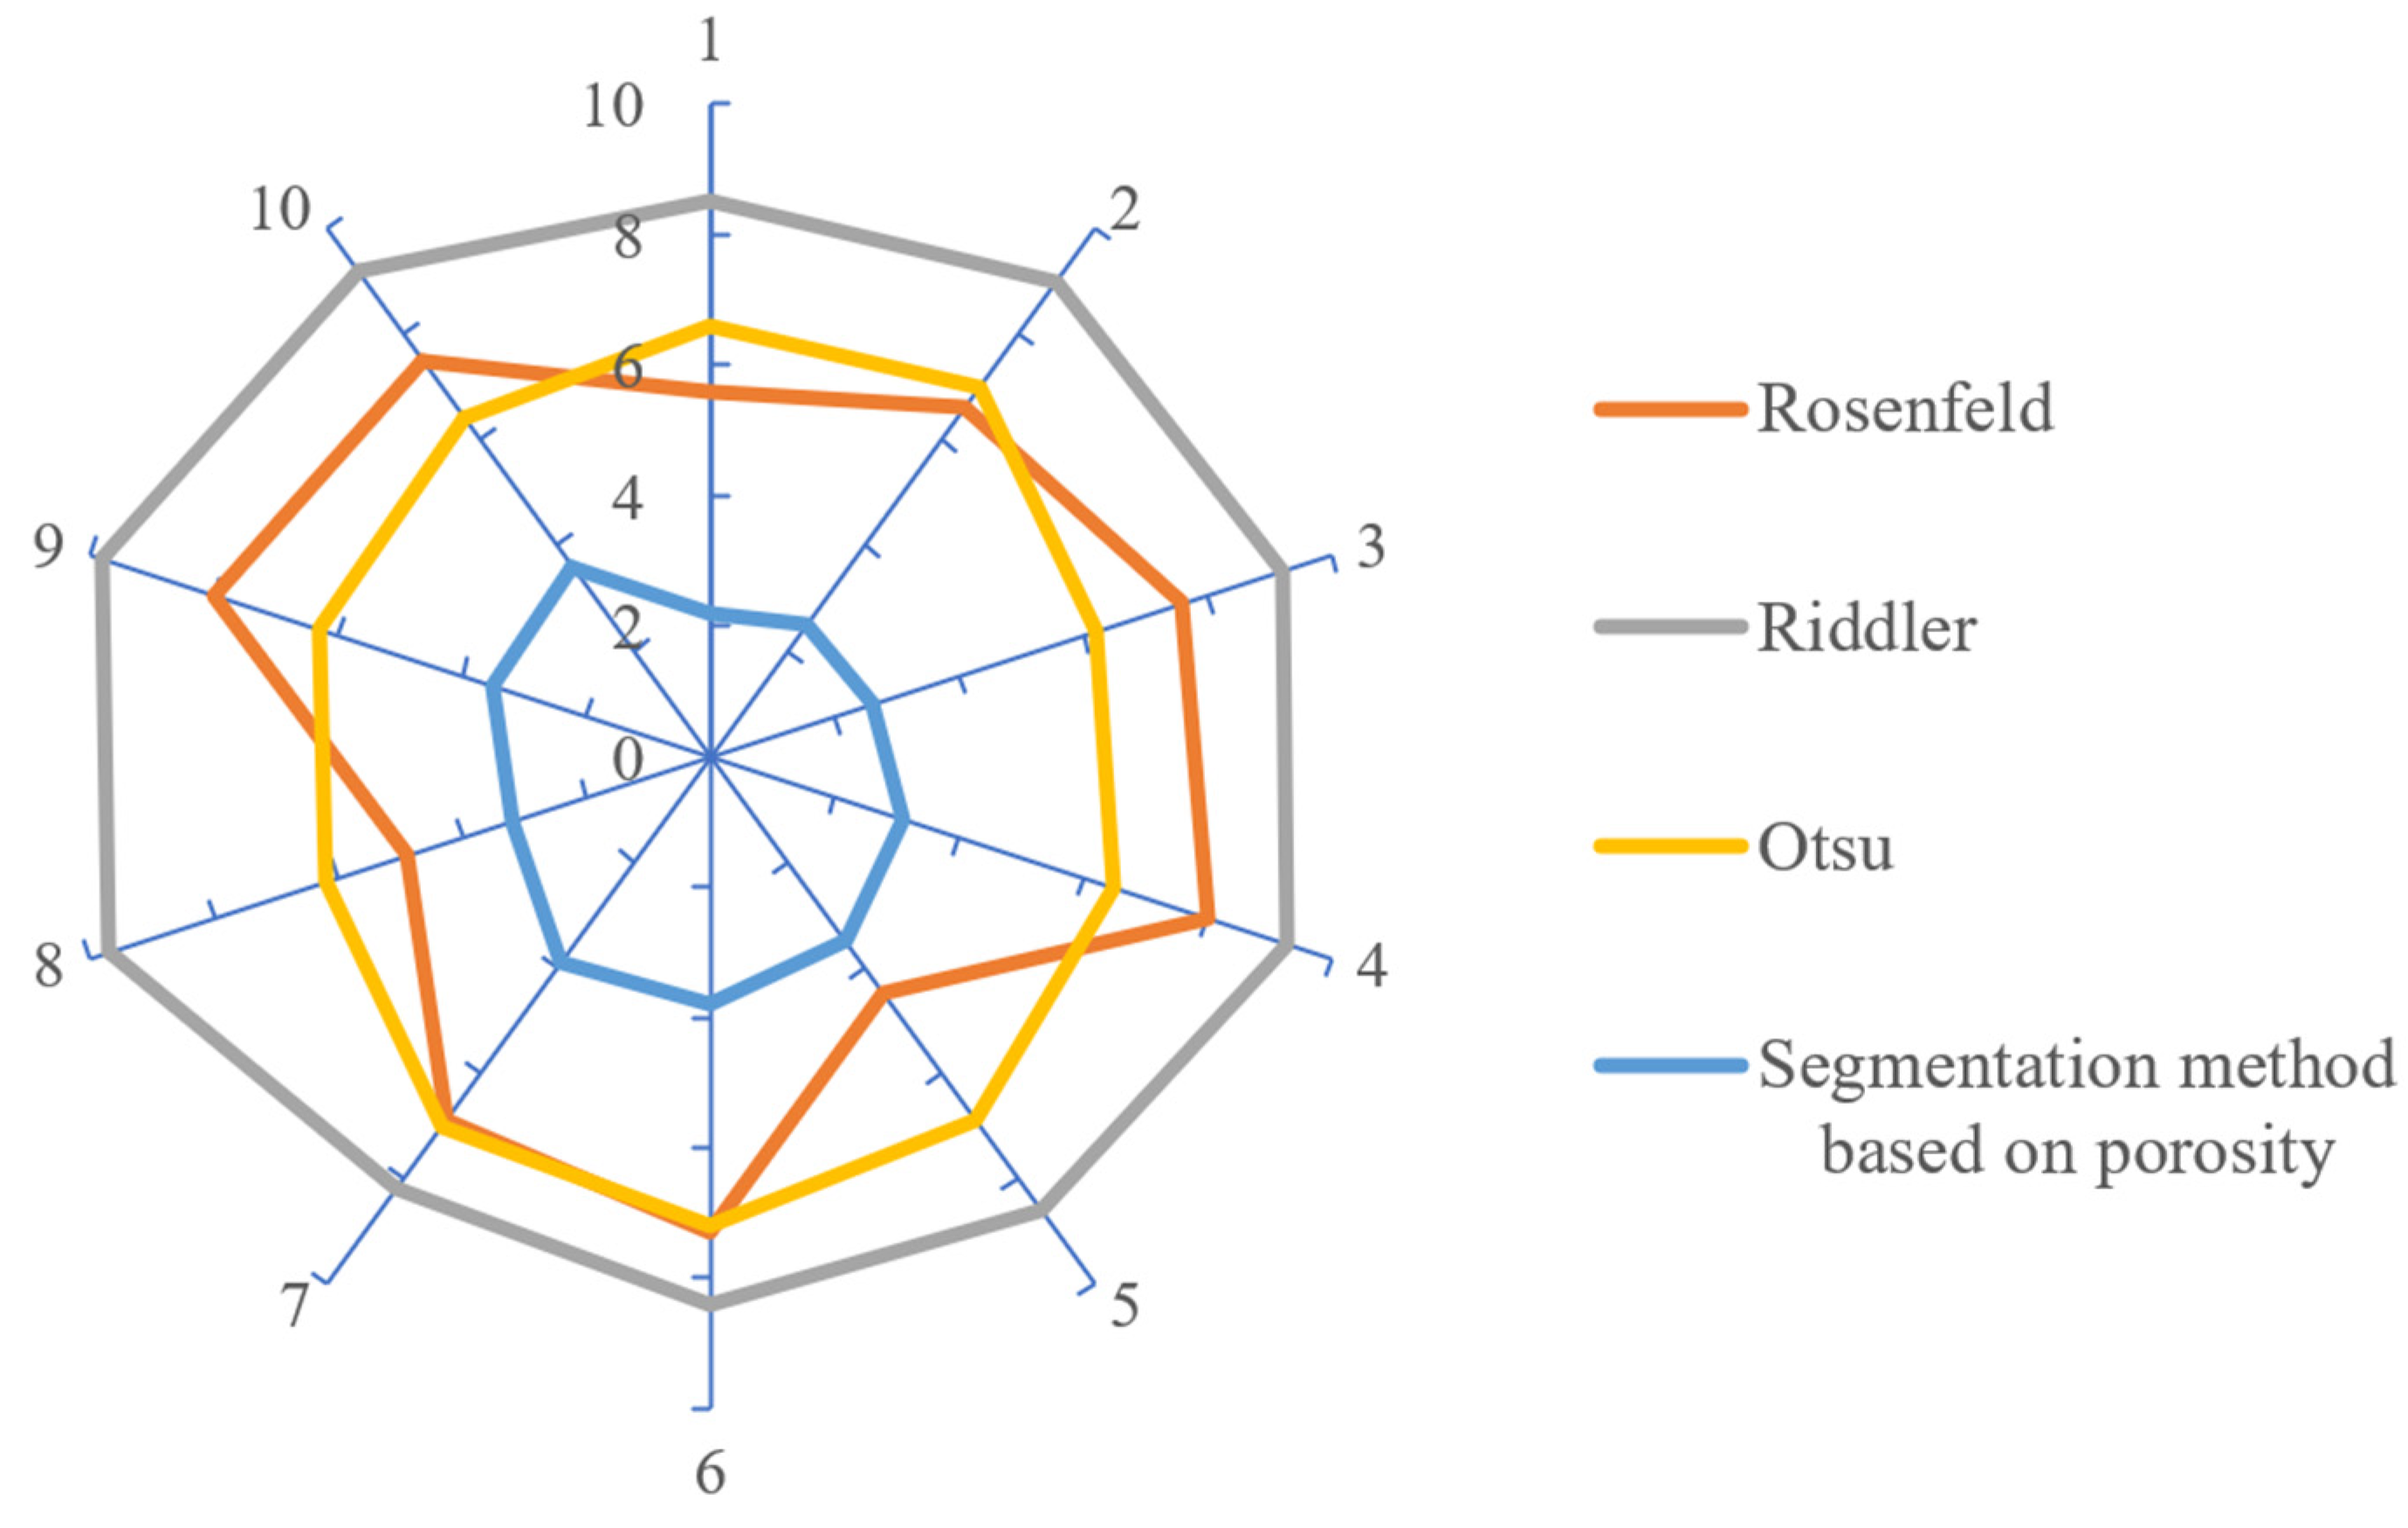
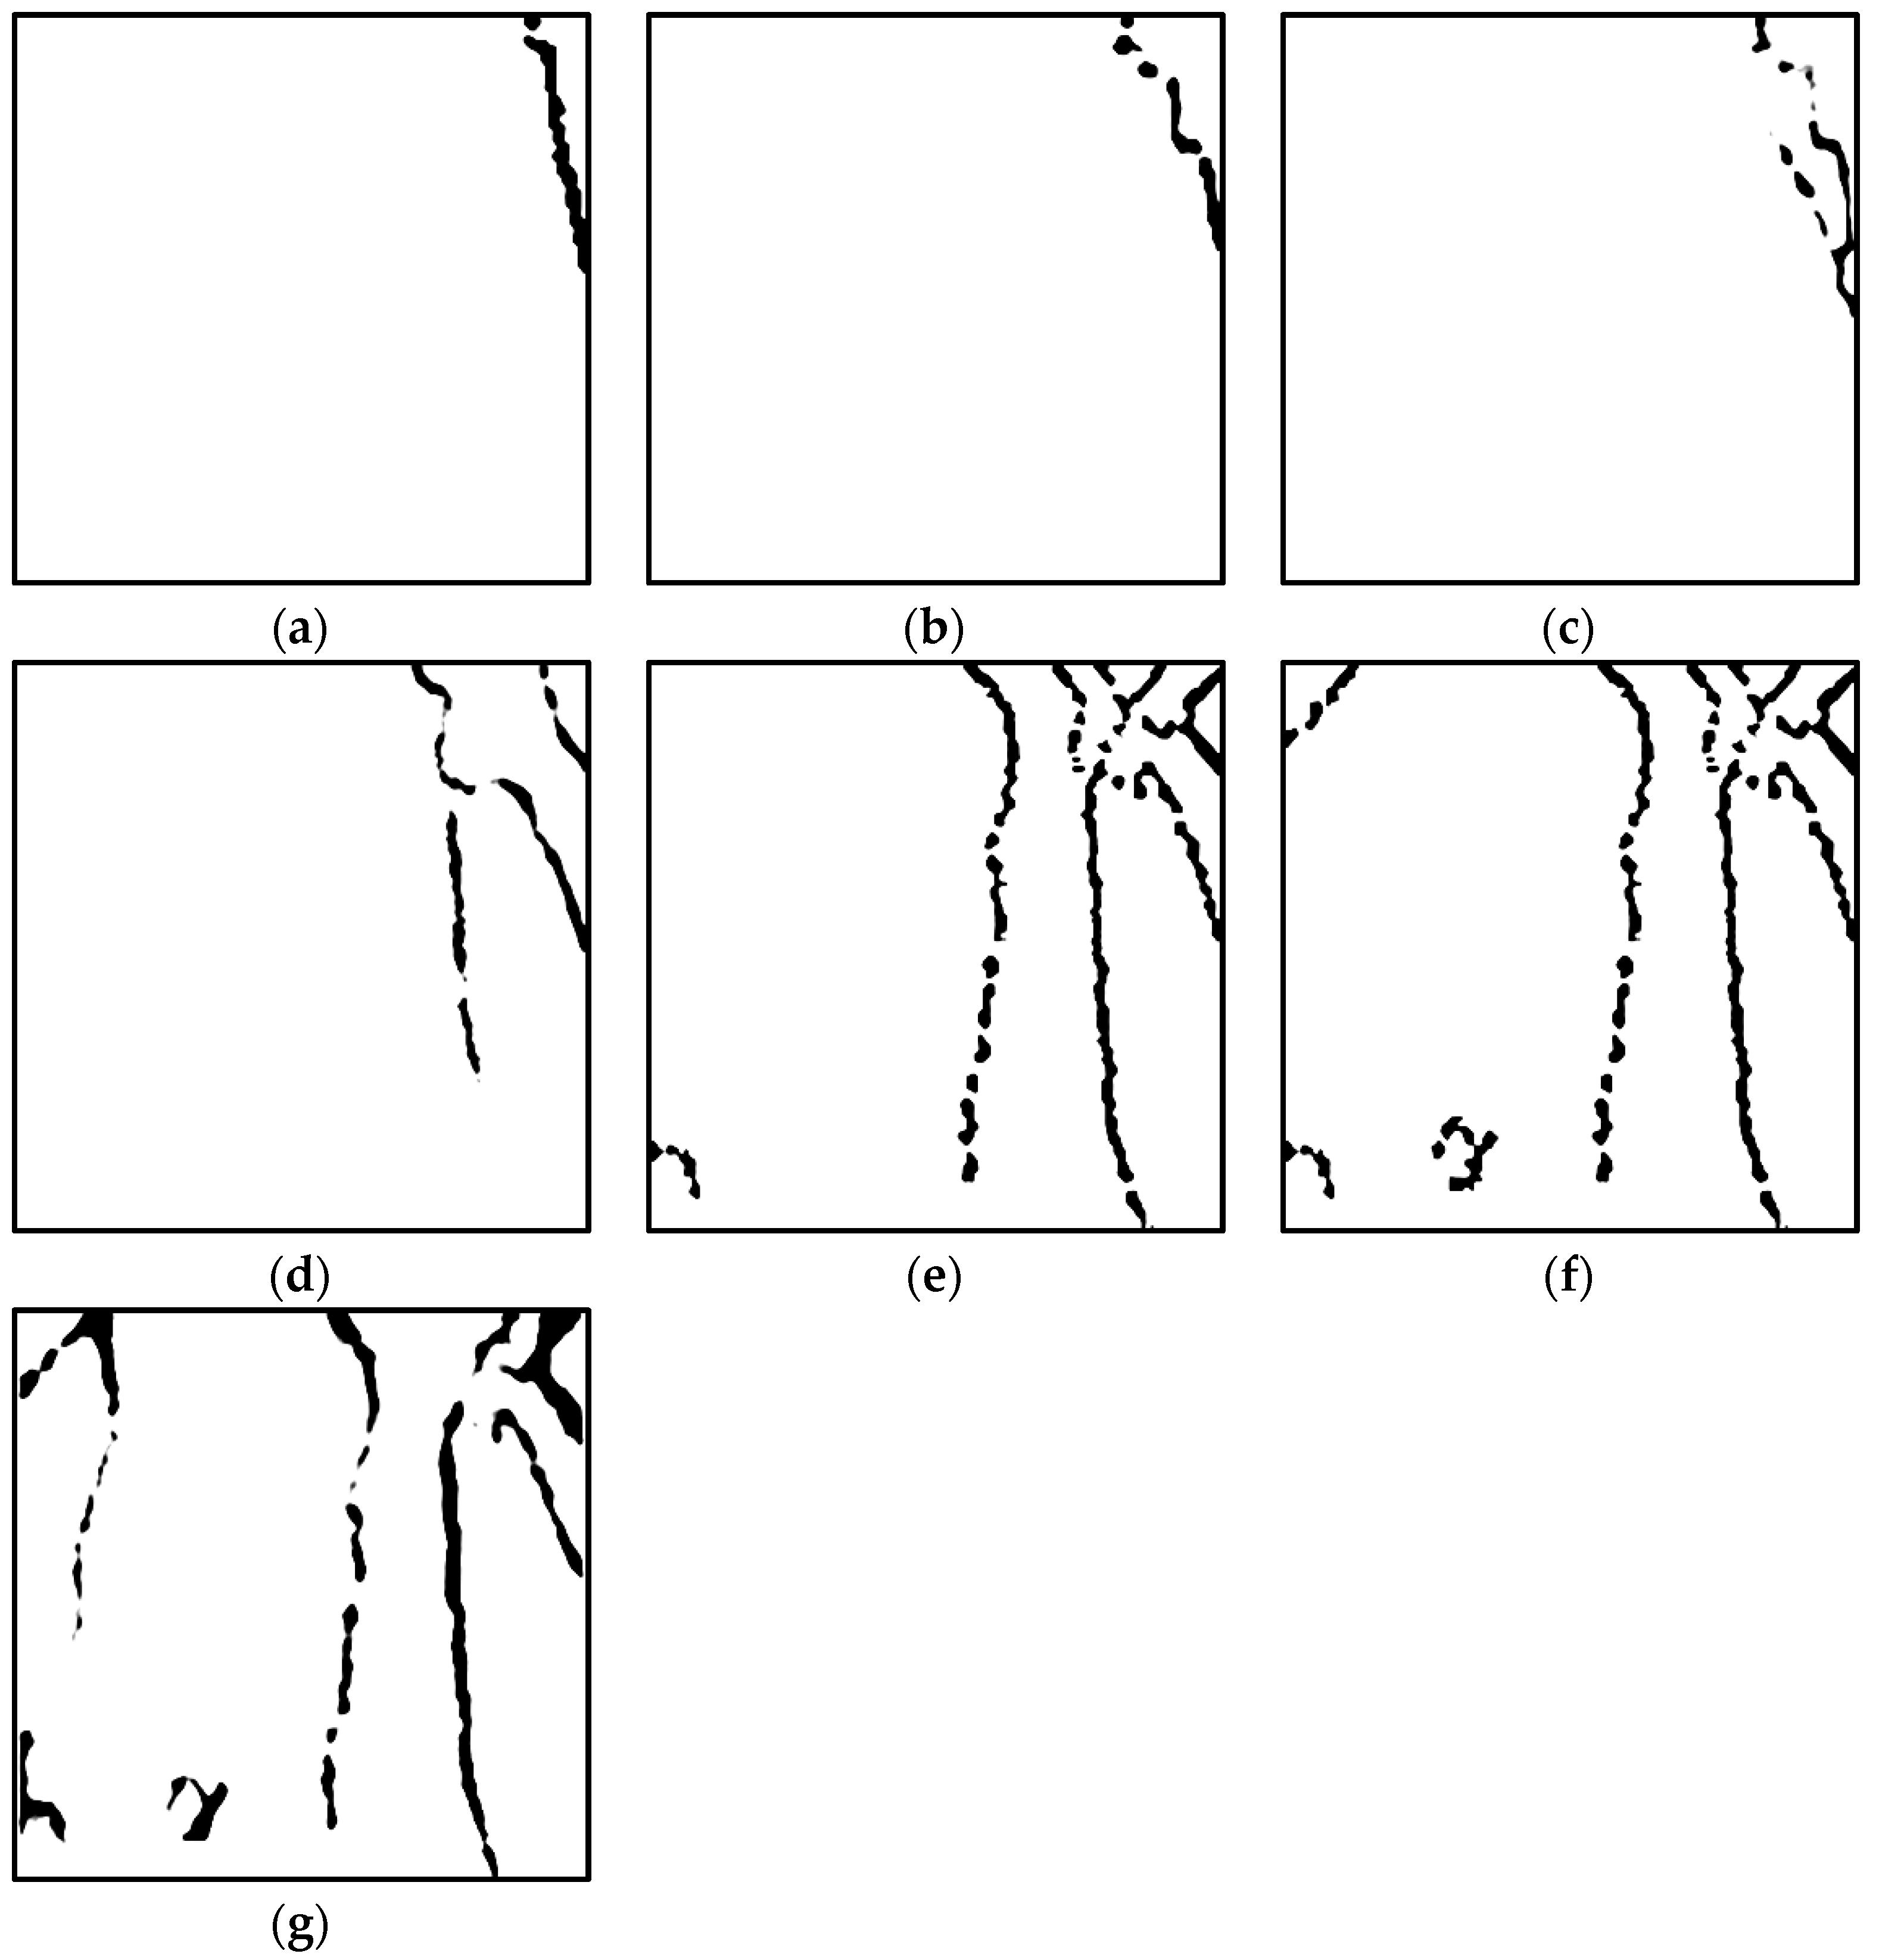
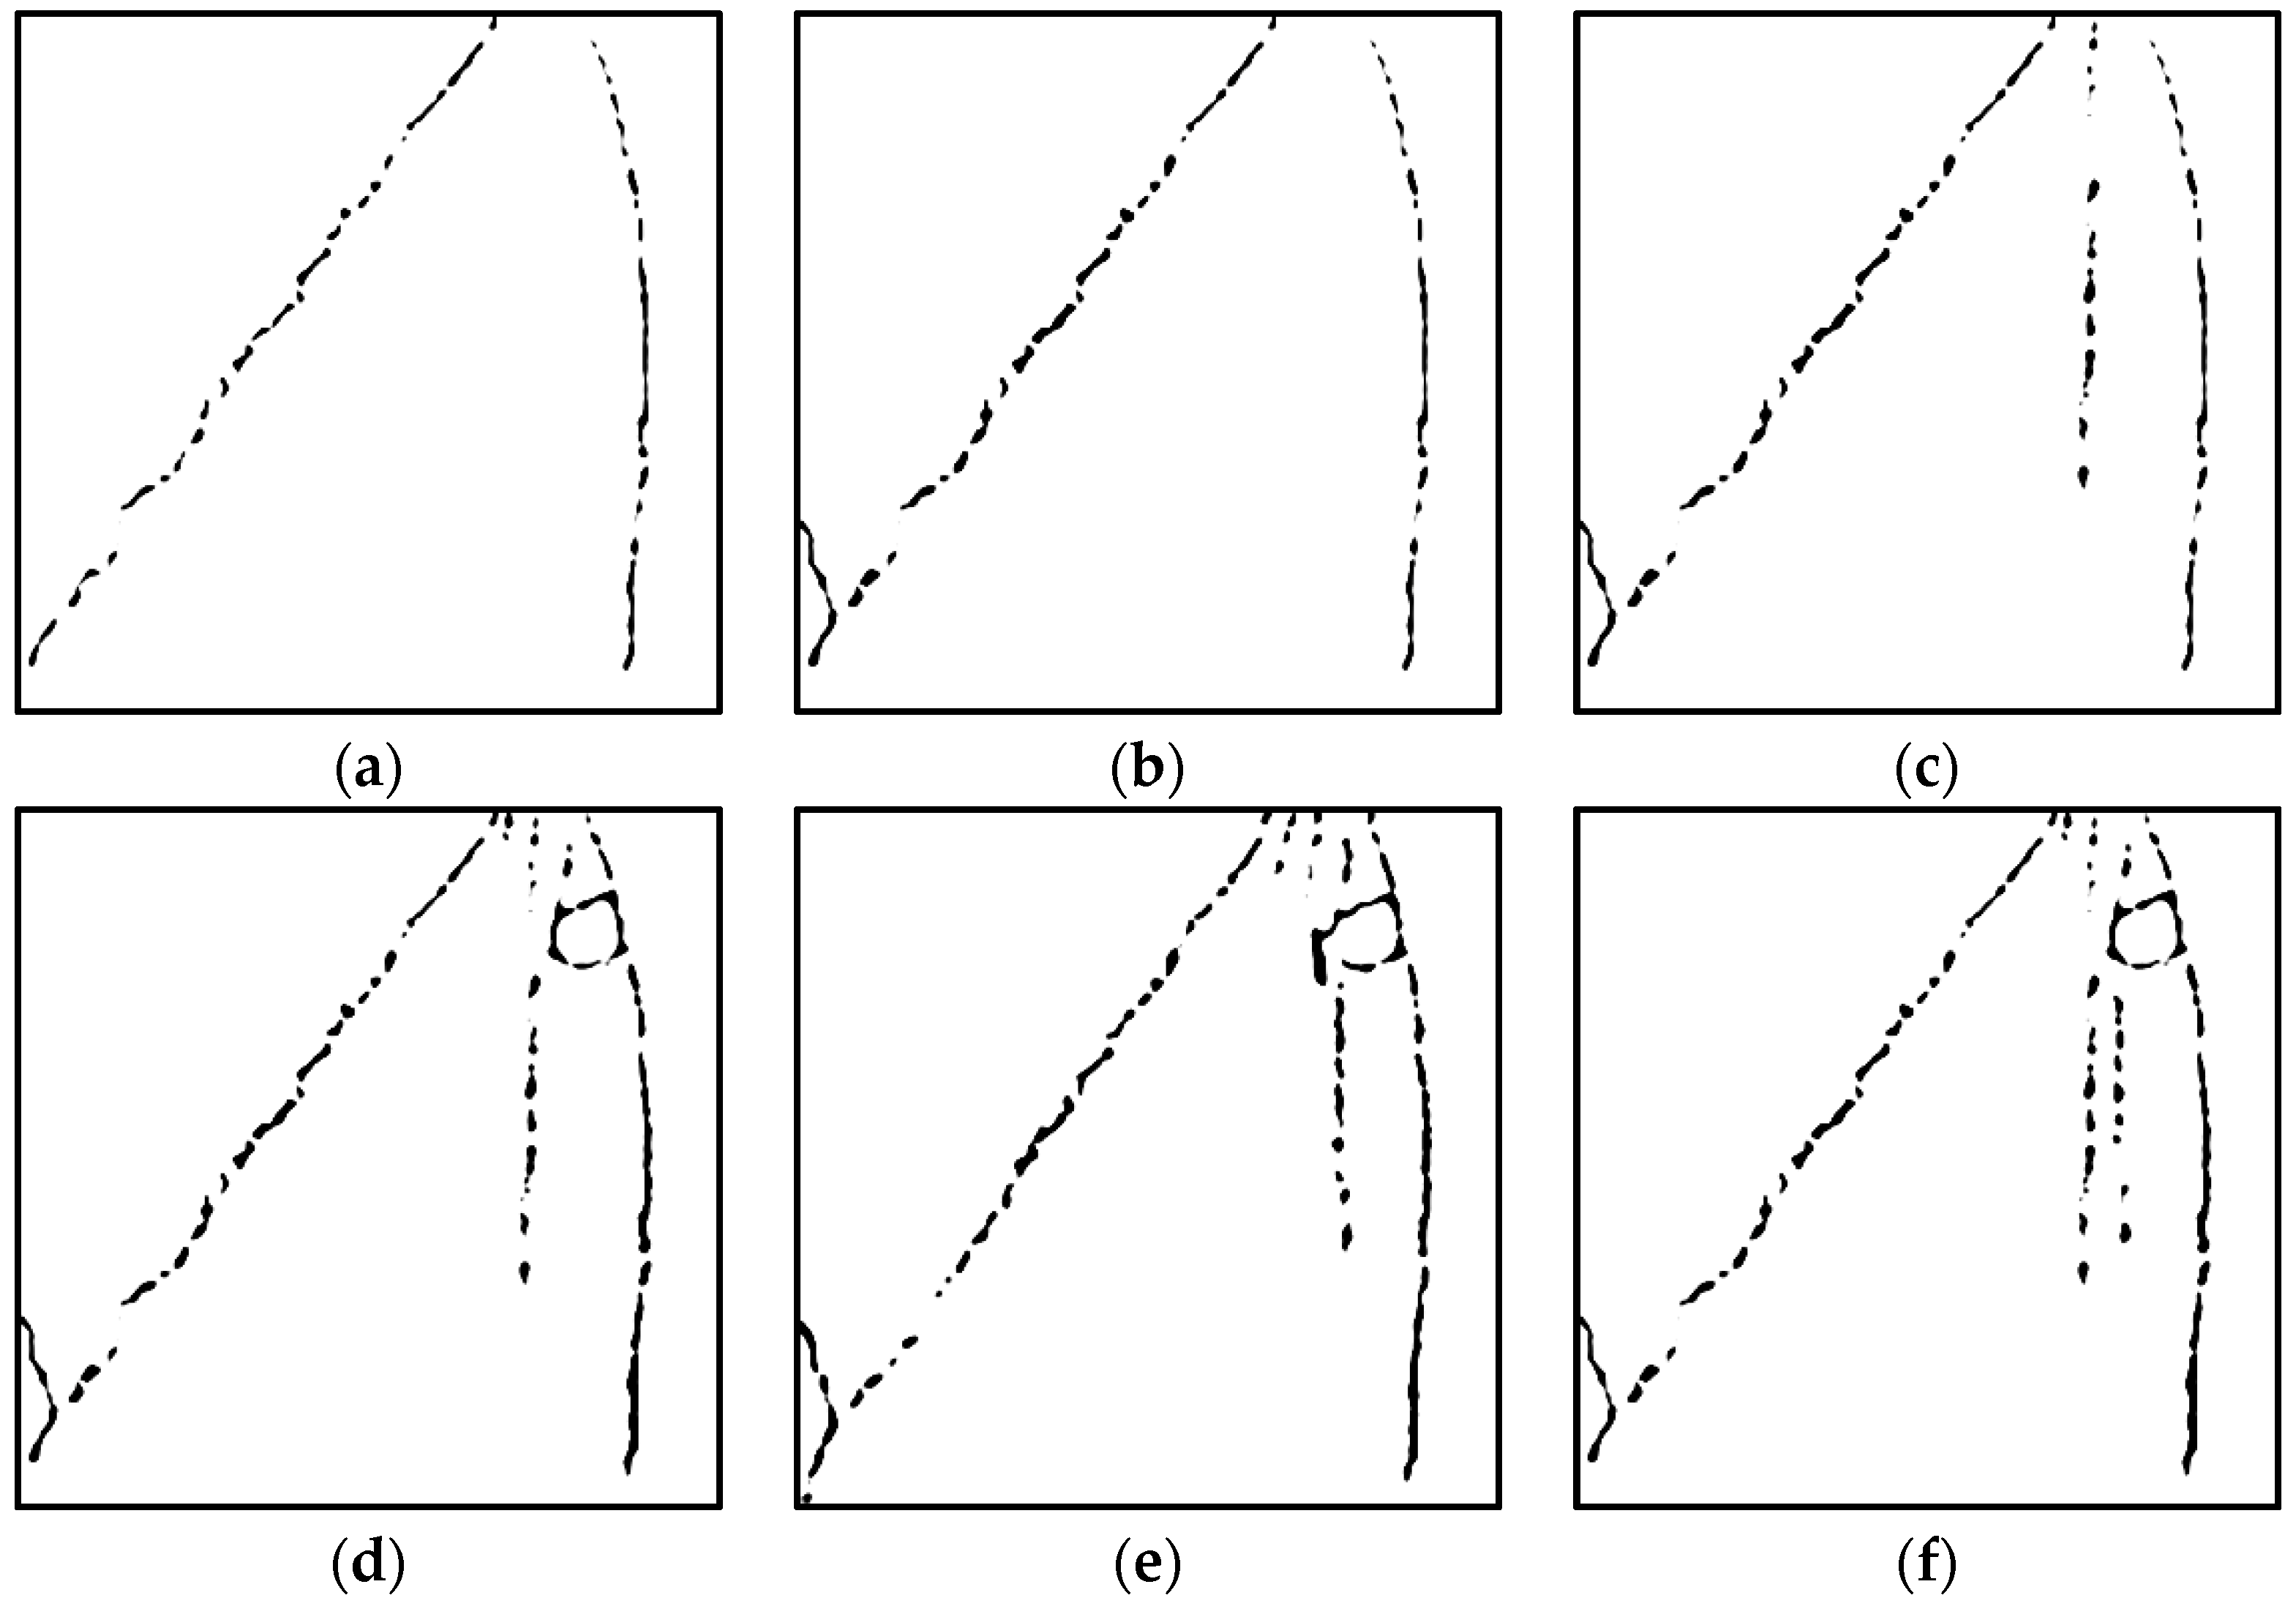
3.2.2. Image Segmentation

The image segmentation method based on threshold value is an effective method commonly used, and its essence is to obtain a segmenting threshold value based on the gray histogram of the image. If the aim of image segmentation is to extract fractures, while the rock matrix is taken as background, the key for image segmentation is the selection of threshold values during binarization. The three conventional methods used to search for an optimum threshold value by analyzing the peak, trough and curvature of gray histogram are Rosenfeld, Riddler iteration and OTSU algorithms. In this study, we worked out the image segmentation method based on porosity.
If visual porosity (refers to the porosity obtained by the experimental test) is given, visual porosity can be taken as a constraint condition to obtain the threshold value for image segmentation to improve the segmentation quality of gray images of the core sample. Assuming that visual porosity of core is ϕ , the preset threshold value of gray scale is k, and the maximum and minimum gray scales of the image are IMAX and IMIN, respectively. The number of volume pixels with gray scale of I is p(i), the volume pixels with gray scales lower than the threshold value represent fracture and the rest volume pixels represent a matrix; then, the calculation formula of optimum threshold value k is described as follows.
f ( k ) = min { f ( k ) = | ϕ i = I M I N k p ( i ) i = I M I N I M A X p ( i ) | }
The image is segmented when k* is found to obtain the final binarization image.
In light of the importance of threshold value selection in image segmentation, in this study, based on the gray images of tested sample, the porosity errors of the results of above four segmentation methods were compared to select one image segmentation method most suitable for binary segmentation of shale porosity.
The porosity of the binary image after segmentation ϕ s i m was obtained by counting the percentage of the white volume pixels (fracture) to the total volume pixels, and the relative error between the ϕ s i m and the visual porosity ϕ l a b was calculated by the following equation.
E r r o r = | ϕ s i m ϕ l a b | ϕ l a b × 100 %
The above four methods were used to segment images of 10 tested rock samples, and the relative errors between ϕ s i m and visual porosity ϕ l a b of the images are shown in Figure 7.
It can be observed from the above figure that all four methods have porosity relative errors of less than 9%, and the fourth method (the method based on porosity) has the lowest relative error. Therefore, the image segmentation method based on porosity was adopted in the binarization process of the shale fracture in this study.

4. Test Results and Analysis

In the process of shale destruction, the expansion and convergence of microcracks and cracks are the root causes of shale damage and destruction. As the propagation process of cracks will be accompanied with changes in acoustic parameters, we came to the idea of establishing the relationship between acoustic parameters and rock stability. This section focuses on the development and destruction mechanism of shale cracks, division of the process of shale destruction and the relationships between acoustic parameters and crack propagation at different stages of shale destruction. The rock mechanical parameters of the shale used in this experiment are shown in Table 1.
Figure 8 and Figure 9 show monoaxial stress–strain curves of the square shale sample with a bedding dip angle a of 90° and static images of crack changes during the destruction of the shale sample. Moreover, the authors also provide the time, stress and strain values corresponding to each crack change in the rock destruction process, as shown in Table 2. As shown in the figures, at the initial stage of loading, the sample was in the crack compression stage. The sample had larger deformations, but no cracks were observed on the surface, and the curve of this stage was convex. With the increase in external loads, the curves of stress–strain and dominant amplitude-strain rose smoothly. When the strain was around 1.27%, the stress–strain curve shows a small fluctuation for the first time, and the dominant amplitude curve has an obvious sudden change. This is because the work performed by the external loads on the rock was mainly stored inside the rock in the form of elastic potential energy, which resulted in the development of the rock to the critical high internal energy, when the rock would change to another new steady state abruptly, and this change corresponded to rock destruction. After elastic energy was released, with internal energy dropped, the rock was in a new stable state. Therefore, the dominant amplitude increased first and then decreased to a new stable value. The reason no failure cracks were observed on the observation surface is the sample failure occurring inside the sample or other observation surfaces. Then, the dominant amplitude and the stress–strain curve still increased with an increase in load. When the strain reached 2.04%, a local crack appeared for the first time in the upper right corner of the observation surface (Figure 9a). At this time, the dominant amplitude also had a sudden change, indicating another release of the stored elastic energy in the sample and corresponding to another rock damage. At this time, the stress–strain curve still rose smoothly, failing to reflect the time of rock damage accurately. After rock damage, the dominant amplitude dropped to a new stable value. Then, the dominant amplitude suddenly increased sharply in a short time. By examining the recorded video, it was found that, in this very short period of time, a wing crack at 45° relative to the axial direction occurred in the observation surface (Figure 9b), and the stress–strain curve still did not show this damage. When the strain reached 2.27%, the stress–strain curve was still smooth, while the dominant amplitude changed suddenly again. Looking at the static map of the observation surface, a crack parallel to the first crack was found at 45° relative to the axial direction, which came up in the upper right corner of the observation surface (Figure 9c). Until the strain reached 2.79%, the stress–strain curve had a small drop again, and the dominant amplitude also had a sudden change. The shearing cracks in the upper right corner of the observation surface began overlapping and connecting (Figure 9d). The original tensile cracks penetrated more beddings, and a tensile crack penetrating the entire sample appeared in the middle of the observation surface. At this time, the rock sample is in the yield stage, and the stress change is not as obvious as the main amplitude of the acoustic wave. When the strain was 3.49%, in addition to the original cracks, a surface crack appeared in the lower left corner on the observation surface (Figure 9e). When the strain was 3.50%, the surface crack on the left side of the observation surface started to expand inward (Figure 9f). These two almost simultaneous failures made cracks on the observation surface penetrate the entire sample (Figure 9g), and the stress–strain curve at this time had a large drop, indicating the failure of the sample. In the process of shale shear failure, the acoustic properties are in good agreement with mechanical properties.
Figure 10 and Figure 11 show uniaxial stress–strain curves of the square shale with bedding and a dip angle of 45° and the static images of the cracks during the rock destruction process. Moreover, the authors also provide time and stress and strain values corresponding to each crack change in the rock destruction process, as shown in Table 3. As shown in the figures, at the initial stage of loading, the shale sample showed obvious feature of crack compression stage, and the stress–strain curve of the sample was convex. During this process, the dominant amplitude increased rapidly at a much faster growth rate than the dominant amplitude of the sample with a bedding inclination angle of 0°. This is because the cracks of this sample were compressed within a small deformation (0–0.5%), and the work performed by the external load quickly inverted into elastic potential energy, making the sample turn to a critical state with higher internal energy. When the axial strain was 0.55%, the energy in the rock was in the first critical state. At this point, the dominant amplitude reached the maximum value, and then the sample had unstable failure and changed suddenly to a new steady state, the dominant amplitude also dropped to a new stable point. However, the stress–strain curve did not reflect this damage process, and no cracks were observed on the observation surface. This may be because the destruction occurred on other surfaces or inside the rock. When the axial strain was 1.33%, the dominant amplitude had another obvious sudden change, and the corresponding stress–strain curve also had a small fluctuation. At this time, the main amplitude of the acoustic wave matches the ‘jitter point’ in the curve shown in the stress–strain curve. However, no cracks were observed on the observation surface, indicating that destruction did not occur on the observation surface. When the axial strain was 1.64%, near the peak strain (1.66%), two main cracks turned up from the same point on the right side of the observation surface (Figure 11a,b): one was a shear crack along the bedding direction, and the other was a tensile crack on the right side of the surface. With the increase in external load, secondary cracks appeared at the end of the shear crack, reaching the boundary of the sample (Figure 11d). Almost at the same time, a tensile crack along the axial stress came up at the initial point of the observation surface. Then, a round surface crack appeared between the two tensile cracks (Figure 11d–f), which was caused by the release of stress on both sides of the tensile cracks. At this point, the sample reflected a sharp drop in stress until destructed completely.
Figure 12 and Figure 13 show uniaxial stress–strain curves of the square shale sample with bedding dip angle a of 0° and static images of cracks during destruction of the sample. The time and stress and strain values corresponding to each crack change in the rock destruction process given by the author are shown in Table 4. As shown in the figures, in the initial stage of loading, the sample showed an obvious crack compression stage, and the stress–strain curve of the sample was concaved upwards. During this process, the dominant amplitude curve showed a small downward concave section and then it rose almost at the same slope value of the stress–strain curve. When the axial strain reached 0.83%, the dominant amplitude increased rapidly, reaching the first peak at the strain of 1.83% and then began to fall. A big chunk sloughed on the right side of the observation surface. At this point, the stress–strain curve was still smooth. At this time, the response of the main amplitude of the acoustic wave to rock caving is more sensitive than that of the mechanics. Until the strain was about 1.27%, the stress–strain curve had a small fluctuation for the first time. This is because the cumulative damage in the observation surface caused a sudden drop in bearing capacity of the sample. Then, a tensile crack along the bedding appeared at the observation surface at the axial strain of 2.02% (Figure 13a), and a secondary crack connecting to the failure surface quickly occurred at the end of the crack. This is because the tensile stress in the destruction process of the shale sample was concentrated locally in weak parts such as pores and beddings. As load increased, the two cracks began to extend from the surface to the inside of the rock and increased in aperture, forming macroscopic cracks (Figure 13b). When the strain was 2.27%, another tensile crack along the bedding turned up on the observation surface (Figure 13c), and then the surface collapsed, with a round surface crack formed (Figure 13c,d). When the strain reached a peak of 2.80%, a larger round piece sloughed, and the two round cracks on the surface started to connect (Figure 13e). Then, the sample lost stability and failed (Figure 13f). In this process, there were many small fluctuations in the stress–strain curve, and finally the stress dropped sharply at the peak strain, and the dominant amplitude only had one large sudden change. It was found from the recorded video that sample failure at this stage was completed in a very short period of time; in other words, in this very short period of time, external forces made the internal energy of the test piece increase rapidly. The accumulated internal energy in the sample did not release at once but was released gradually in multiple destructions. However, the gradually released elastic energy was not enough to offset the internal energy produced by external force; thus, the internal energy stored in the rock sample kept increasing and finally released completely at the peak strain, resulting in the ultimate failure of the sample.

5. Conclusions and Recommendations

(1)
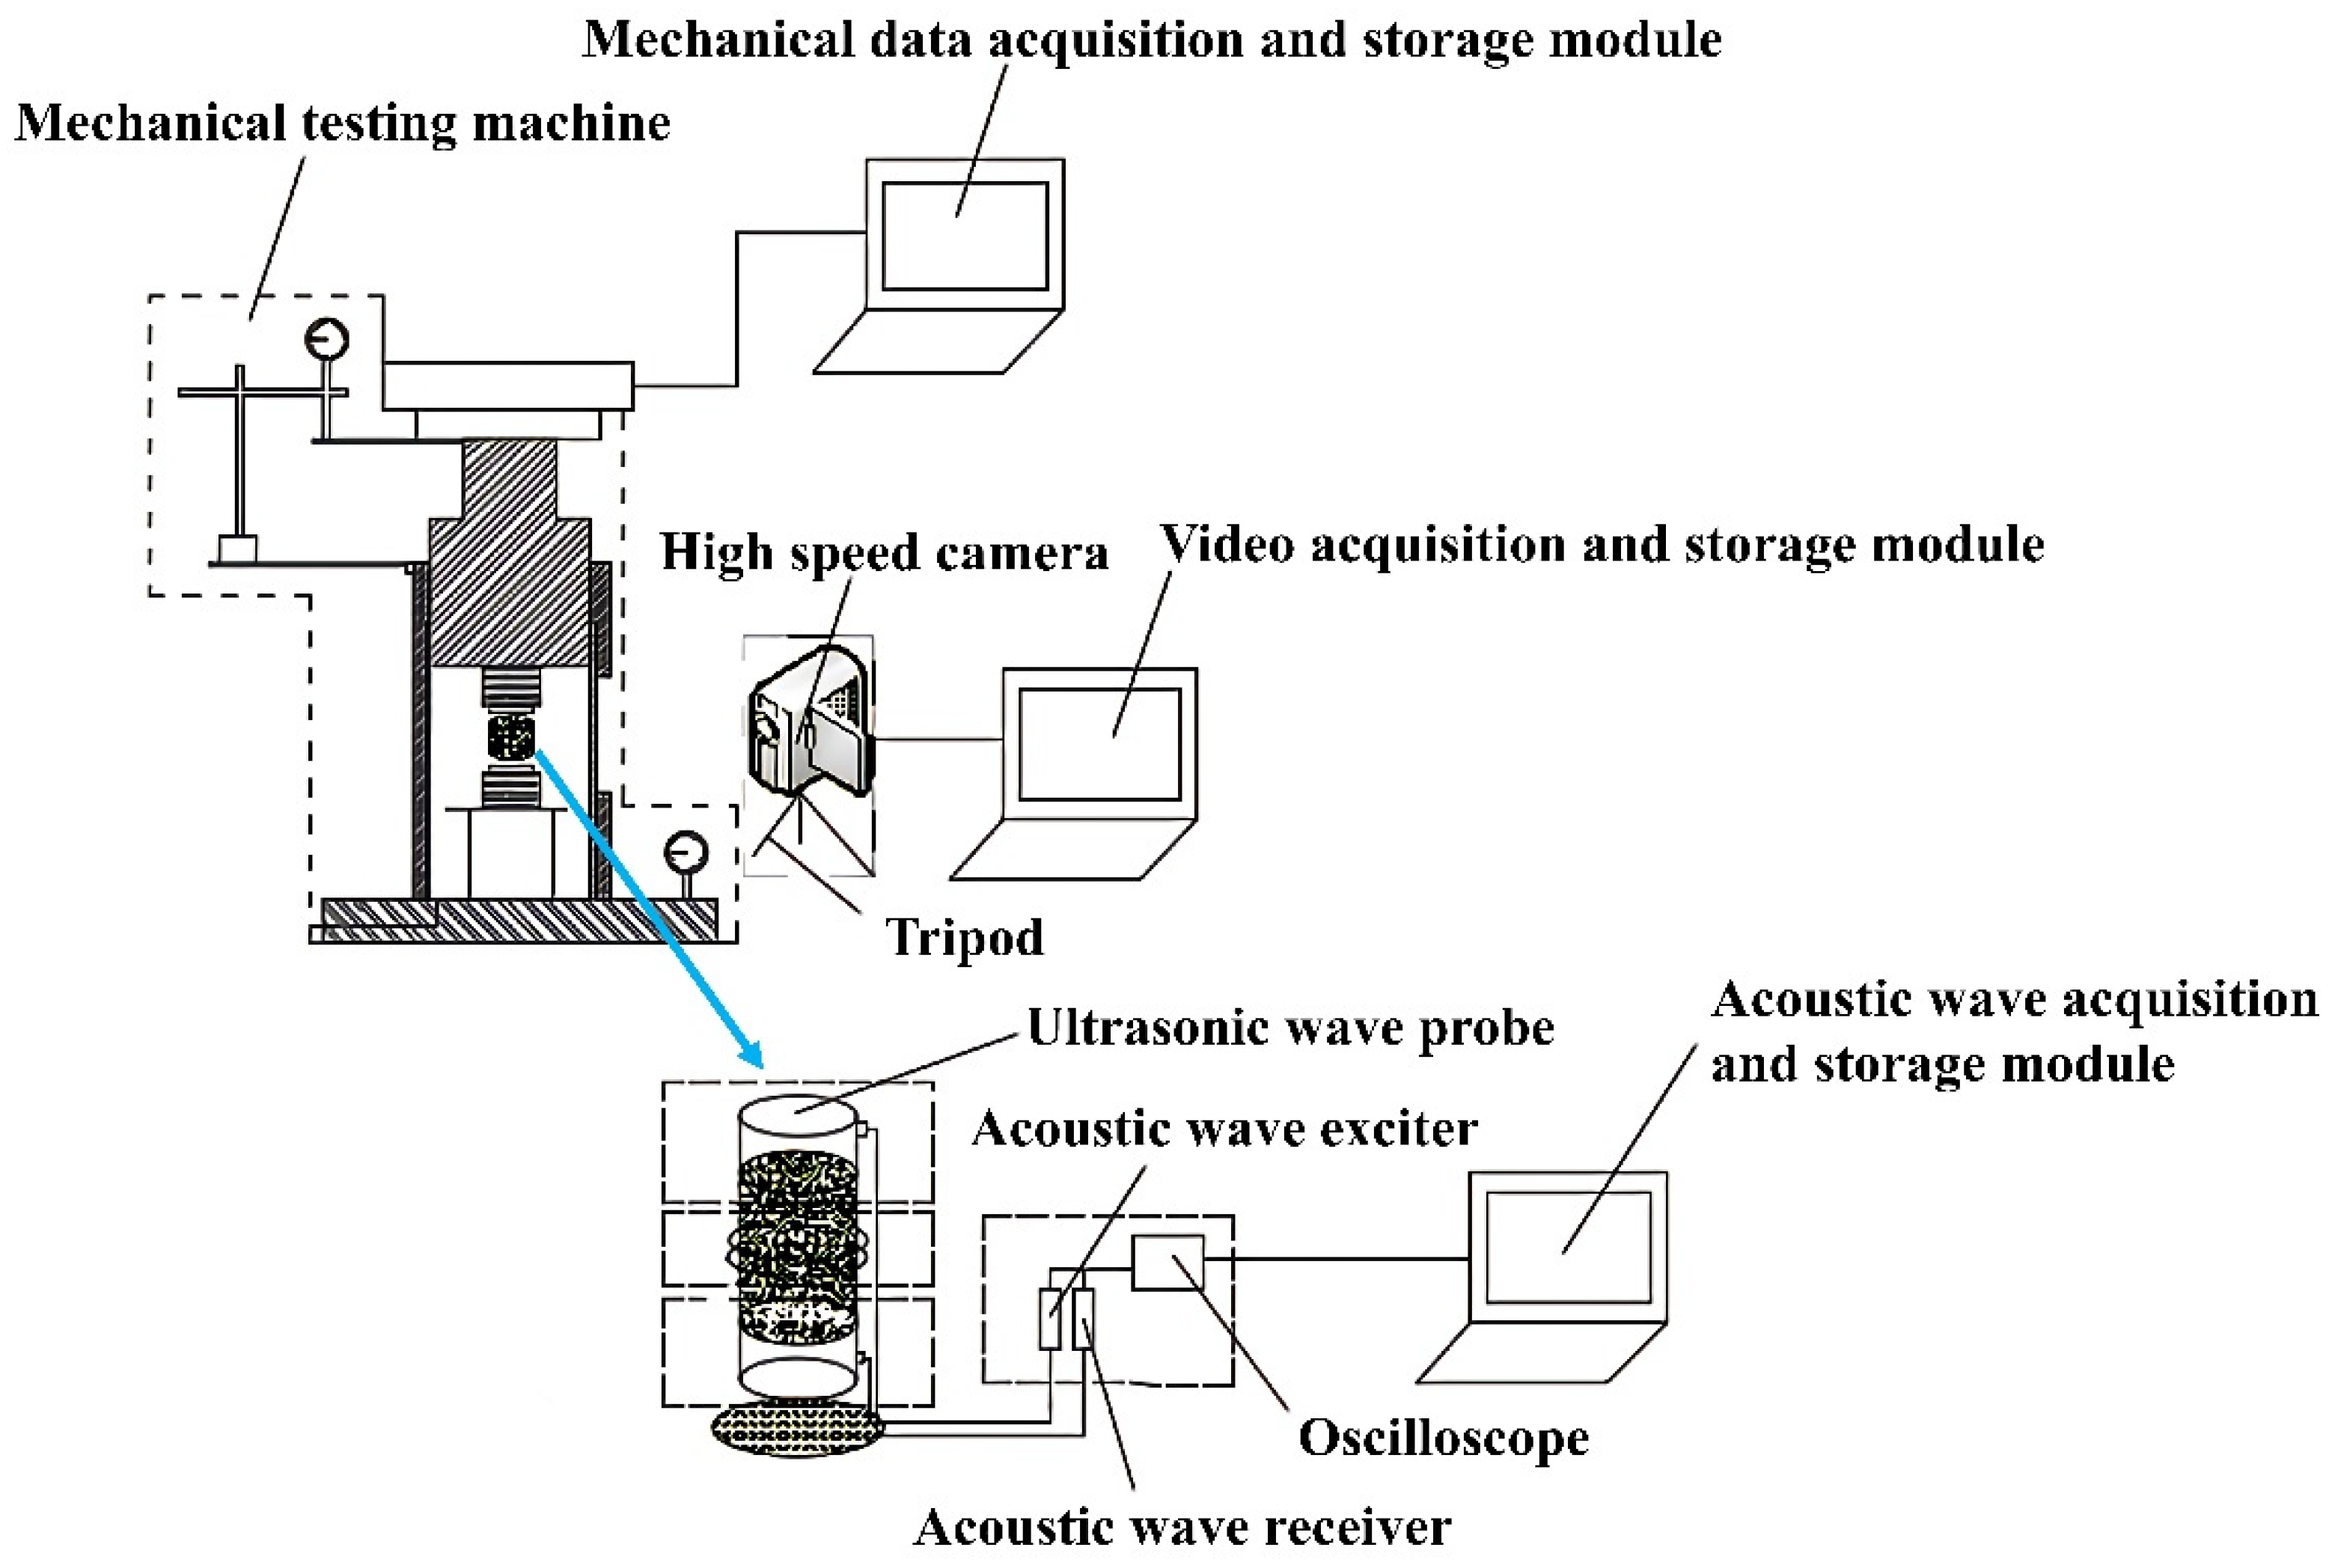
A device testing micro-crack evolution characteristics of shale has been designed to realize simultaneous monitoring of ultrasonic, mechanical and video information in crack evolution processes of shale under load so as to analyze acoustic and mechanical characteristic responses at key points of crack propagation.
(2)
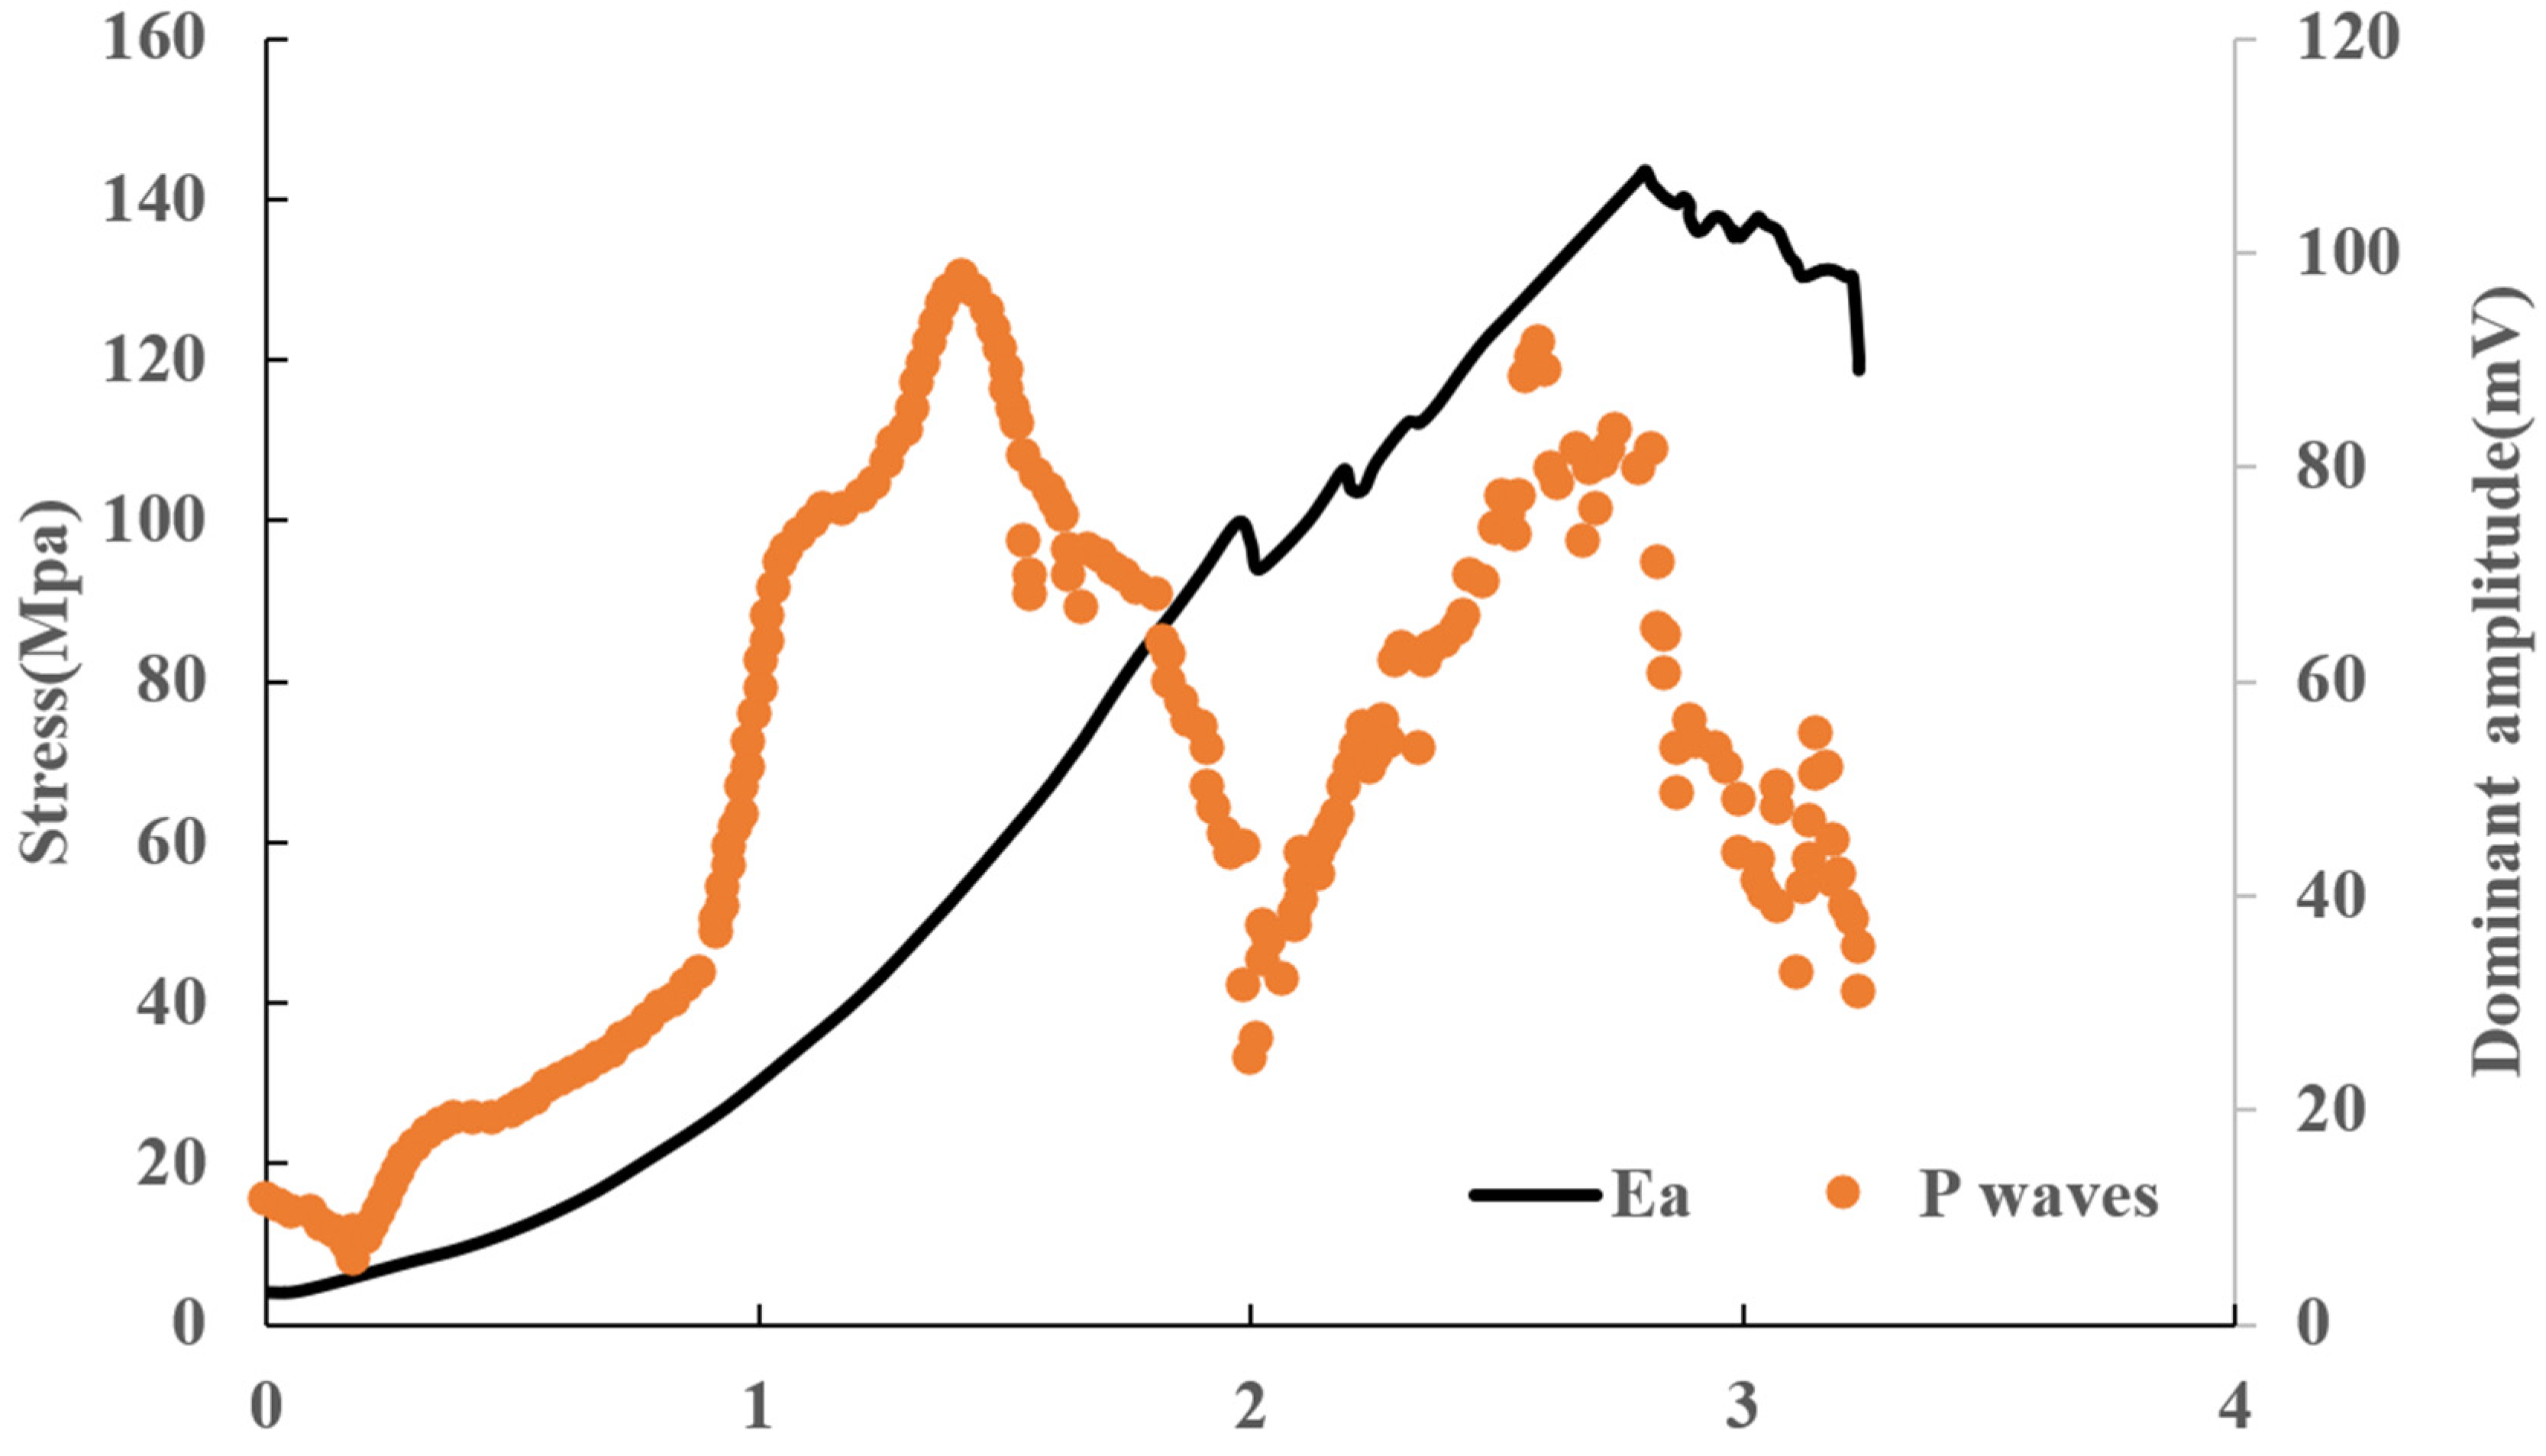
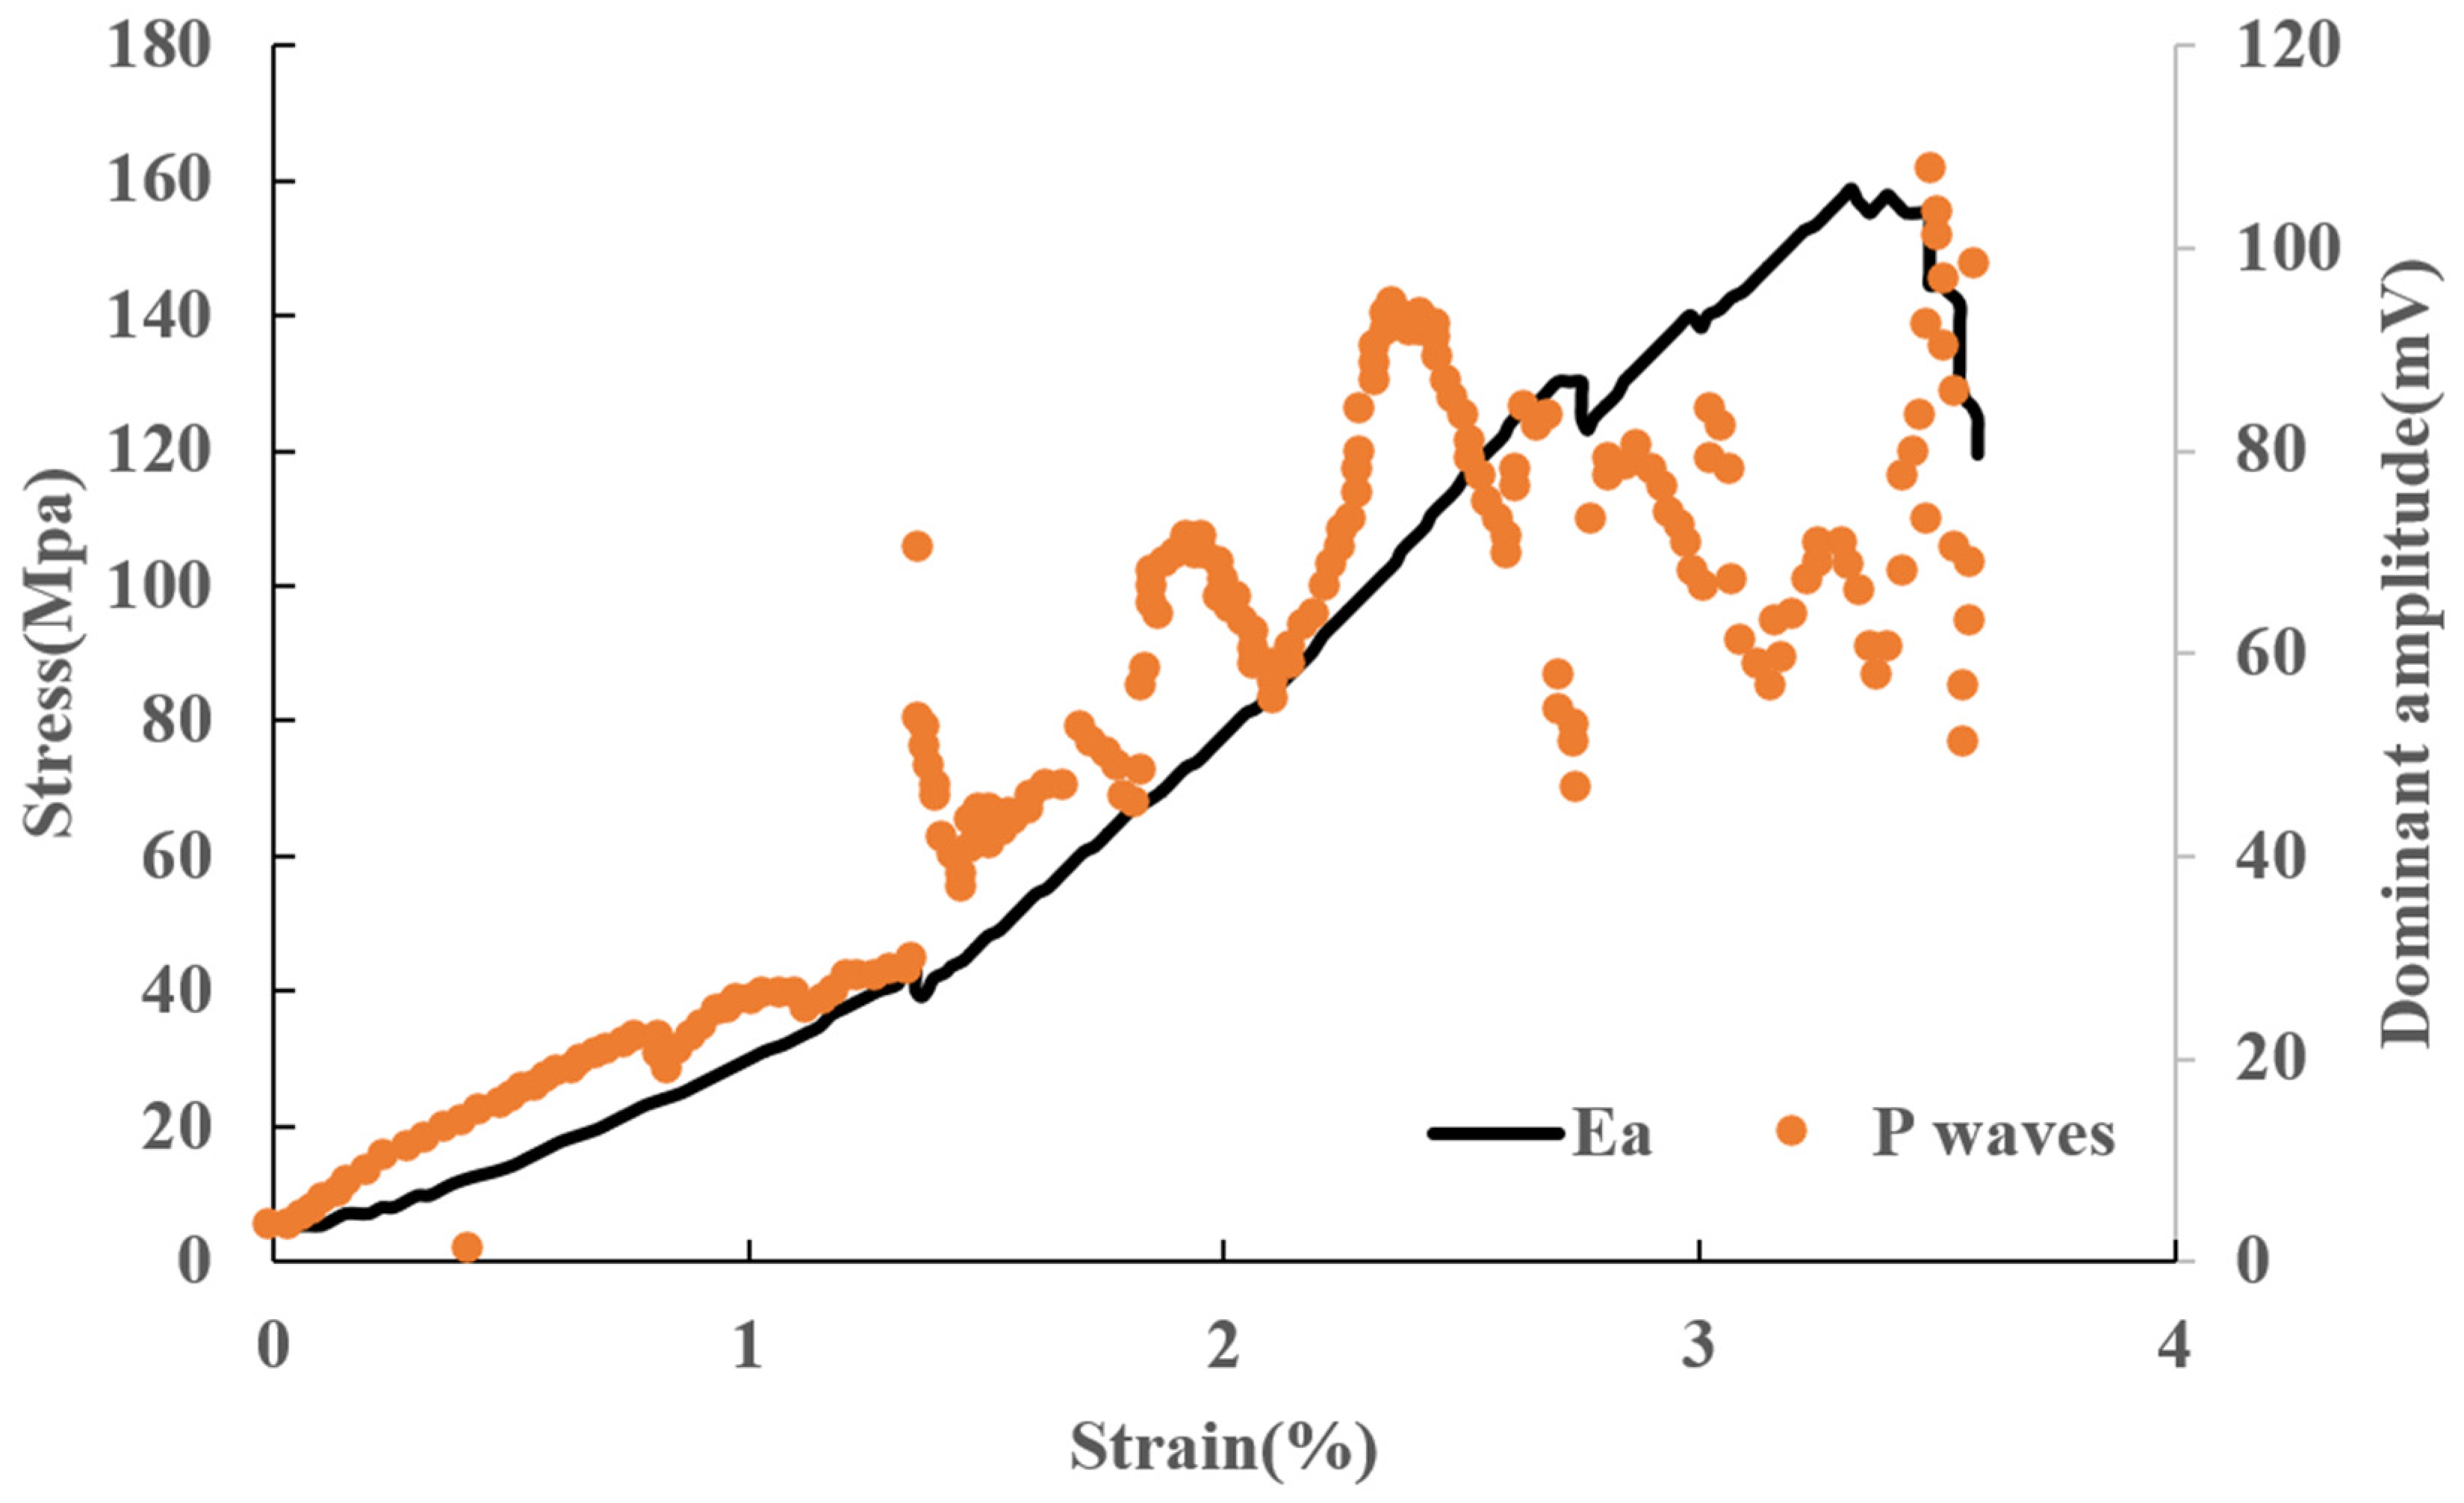
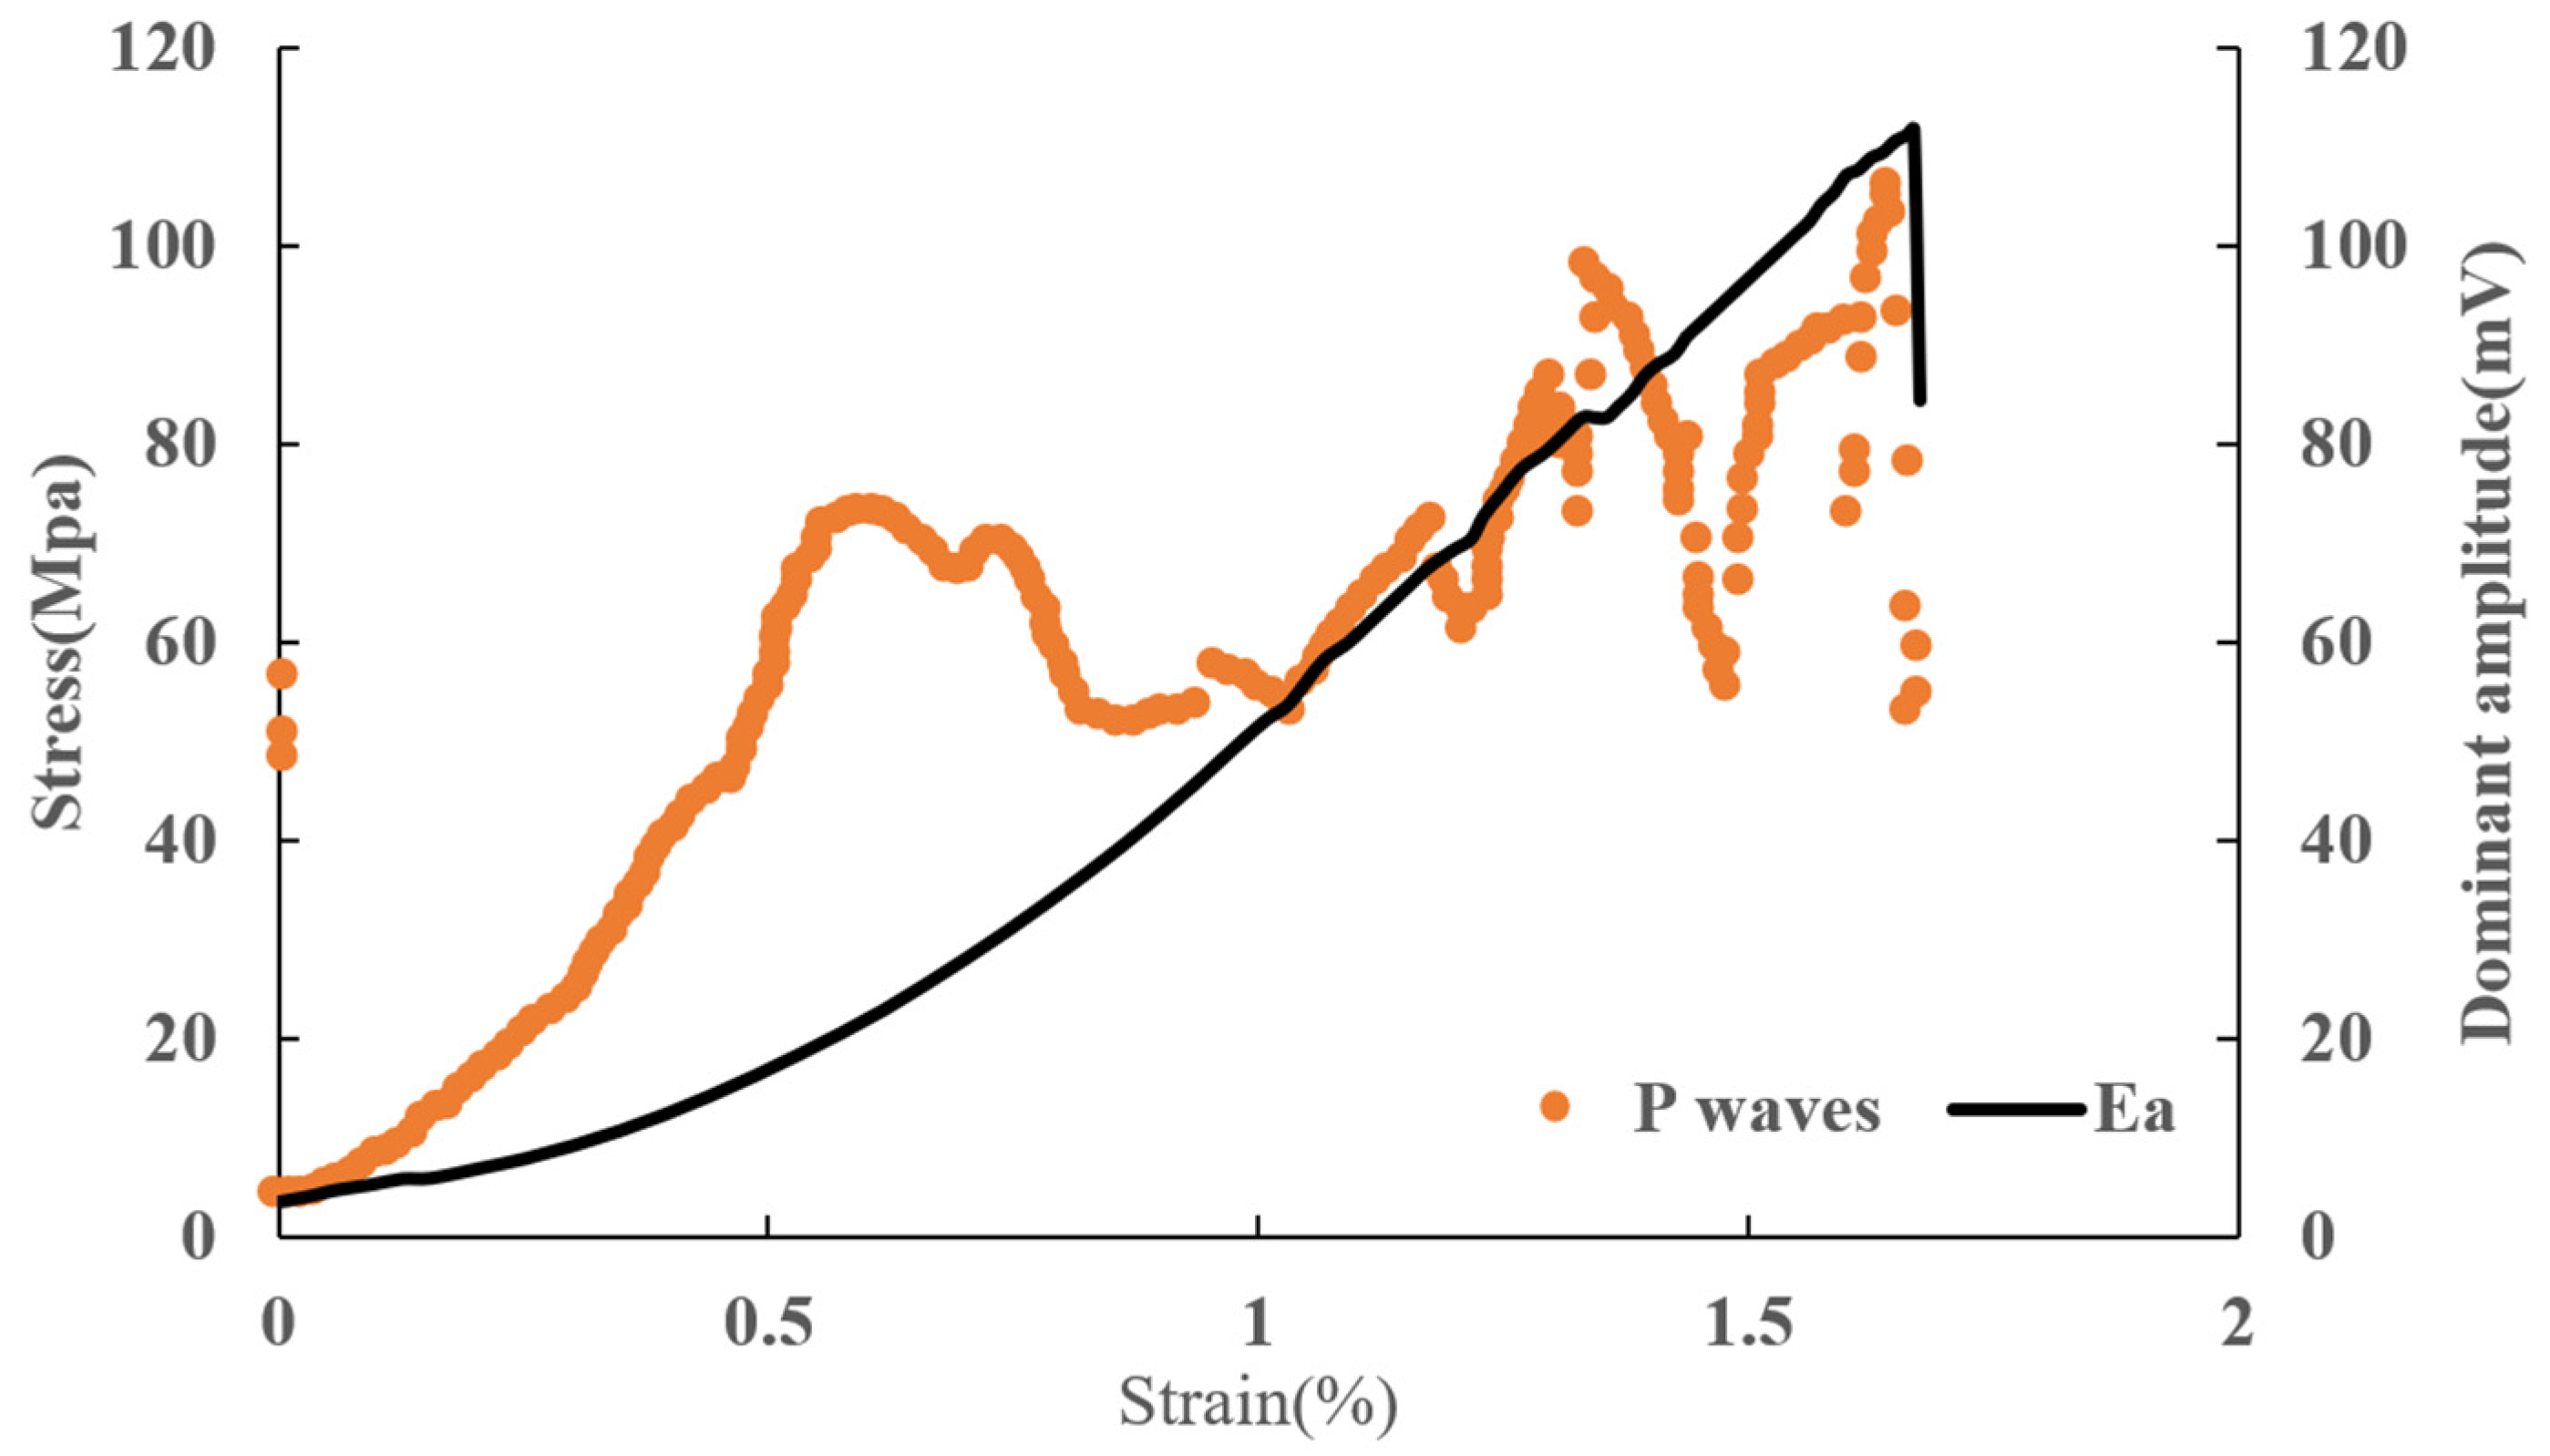
With increases in load, shale undergoes four stages of destruction, crack initiation, propagation, penetration and overall failure. The dominant amplitude curve of acoustic wave matches well with the stress–strain curve in fluctuating points, which indicates that during the process of shale shear failure, acoustic characteristics and mechanical characteristics are in good agreement, proving the validity of predicting rock mechanical parameters with acoustic data.
(3)
Combined with the video monitoring, it was found that at several points when shale crack occurred, the mechanical curve did not change, while acoustic characteristics had big changes. This indicates that during the load process of shale, the dominant amplitude of acoustic waves is more sensitive to rock cracking than mechanical parameters.
(4)
Due to the lighting, the video only monitored one surface of the shale sample. For further studies, test equipment needs to be modified. Adding CT scanning technology is recommended, which will help improve the completeness of the description of crack state changes during loading process of the rock sample.
(5)
This research can provide theoretical foundations for the evaluation of deformation mechanism and stability of host rocks in underground engineering.

Author Contributions

Conceptualization, Q.C.; Data curation, F.X., P.S., Y.Z., Y.L. and D.J.; Project administration, H.Z.; Writing–review & editing, X.G., J.C. and D.L. All authors have read and agreed to the published version of the manuscript.

Funding

The study was funded by Key Laboratory of Mine Geological Hazard Mechanism and Prevention and Control (no. 2018-08), Xigaze City Science and Technology Plan Project (RKZ2020KJ01), Key Laboratory of Rock Mechanics and Geohazards of Zhejiang Province (no. ZJRMG-2019-01), Chongqing Natural Science Foundation project (no. cstc2019jcyj-msxm0749, cstc2021jcyj-msxmX0187), Ecological environment survey and ecological restoration technology demonstration project in the water-level-fluctuating of the Three Gorges Reservoir (no. 5000002021BF40001), The Tibet Autonomous Region Natural Resources Department’s prevention and control capacity system construction project (no. 2020-0890-2).

Institutional Review Board Statement

Not applicable.

Informed Consent Statement

Not applicable.

Data Availability Statement

The data used to support the findings of this study are available from the corresponding author upon request.

Acknowledgments

The study was funded by Key Laboratory of Mine Geological Hazard Mechanism and Prevention and Control (no. 2018-08); Xigaze City Science and Technology Plan Project (RKZ2020KJ01); Key Laboratory of Rock Mechanics and Geohazards of Zhejiang Province (no. ZJRMG-2019-01); Chongqing Natural Science Foundation project (no. cstc2019jcyj-msxm0749, cstc2021jcyj-msxmX0187); Ecological environment survey and ecological restoration technology demonstration project in the water-level-fluctuating of the Three Gorges Reservoir (no. 5000002021BF40001); and the Tibet Autonomous Region Natural Resources Department’s prevention and control capacity system construction project (no. 2020-0890-2). Their support is gratefully acknowledged.

Conflicts of Interest

The authors declare no conflict of interest.

References

  1. Xu, J.; Cheng, L.C.; Tan, H.Y.; Wang, L.; Wu, H. Effects of Original Cracks on Macro-Meso Evolution Law of Coal Shear Failure. Chin. J. Rock Mech. Eng. 2013, 32, 33–40. [Google Scholar]
  2. Ge, X.R. Deformation Control Law of Rock Fatigue Failure, Real-Time X-Ray CT Scan Of Geotechnical Testing, And New Method Of Stability Analysis of Slopes And Dam Foundations. Chin. J. Rock Mech. Eng. 2008, 30, 1–20. [Google Scholar]
  3. Liu, D.M.; Cai, M.F.; Zhou, Y.B.; Chen, Z.Y. Dynamic Monitoring on Developing Process of Rock Cracks. Chin. J. Rock Mech. Eng. 2006, 25, 467–472. [Google Scholar]
  4. Zhao, C.; Tian, J.S.; Matsuda, H.; Zhao, C.F.; Bao, C. Crack Propagation and Damage of Rock Under Uniaxial Compression Based on Global Strain Field Analysis. Chin. J. Rock Mech. Eng. 2015, 34, 763–769. [Google Scholar]
  5. Zhang, M.Y.; Yuan, J.X.; Li, T.J.; Shang, J.L.; Kong, C.J. Mechanism of Deformation and Failure for Rock in Uniaxial Compression Test. Chin. J. Rock Mech. Eng. 1998, 17, 1–8. [Google Scholar]
  6. Zhu, Z.D.; Qu, W.P.; Jiang, Z.J. Quantitative Test Study on Mesostructure of Rock. Chin. J. Rock Mech. Eng. 2007, 26, 1313–1324. [Google Scholar]
  7. Sun, X.Z.; Shen, B.; Li, Y.Y.; Zhang, B.L.; Jiang, N. Laboratory Study of Three-Dimensional Crack Propagation in Rock-Like Material Under Uniaxial Compression. Rock Mech. Rock Eng. 2016, 49, 1–16. [Google Scholar] [CrossRef] [Green Version]
  8. Wang, M.; Wan, W.; Zhao, Y.L. Experimental study on crack propagation and the coalescence of rock-like materials with two preexisting fissures under biaxial compression. Bull. Eng. Geol. Environ. 2020, 79, 3121–3144. [Google Scholar] [CrossRef]
  9. Wang, D.J.; Tang, H.M.; Elsworth, D.; Wang, C. Fracture evolution in artificial bedded rocks containing a structural flaw under uniaxial compression. Eng. Geol. 2019, 250, 130–141. [Google Scholar] [CrossRef]
  10. Wang, Y.; Que, Y.M.; Wang, C.; Li, C.H. Three-dimensional observations of meso-structural changes in bimsoil using X-ray computed tomography (CT) under triaxial compression. Constr. Build. Mater. 2018, 190, 773–786. [Google Scholar] [CrossRef]
  11. He, Q.Y.; Li, Y.C.; Li, D.Q.; Zhang, C.G. Microcrack fracturing of coal specimens under quasi-static combined compression-shear loading. J. Rock Mech. Geotech. Eng. 2020, 12, 1014–1026. [Google Scholar] [CrossRef]
  12. Zhao, M.J.; Wu, D.L. Ultrasonic Velocity and Attenuation of Rock under Uniaxial Loading. Chin. J. Rock Mech. Eng. 1999, 18, 51–55. [Google Scholar]
  13. Pan, L.H.; Cheng, L.J.; Zhang, Y.; Lu, Z.H.; He, P.; Huang, S. Determination of shale brittleness index based on rock stress-strain curve and ultrasonic p-wave velocity (In Chinese). Patent CN104865124B, 27 October 2017. [Google Scholar]
  14. Zhai, X.J.; Fu, R.H. Study on the relationship between rock dilatancy and ultrasonic shear wave rate. J. Southwest Univ. Sci. Technol. 2007, 22, 39–42. [Google Scholar]
  15. Liu, X.J.; Liu, H.; Xu, X.L.; Han, L.; Liang, L.X. Experimental Reasearch on Acoustic Wave Propagation Characteristic of Low Porosity and Permeability Sandstone Under Loading Conditions. Chin. J. Rock Mech. Eng. 2009, 28, 560–567. [Google Scholar]
  16. Zhu, H.L.; Chen, Q.; Xu, X.H.; Liu, H.; Wen, X.Y.; Chen, J.L. Acoustic properties of dolomite under compression and its application to fracture research. Theor. Appl. Mech. 2019, 51, 949–960. [Google Scholar]
  17. Xie, H.P.; Liu, J.F.; Ju, Y.; Li, J.; Xie, L.Z. Fractal property of spatial distribution of acoustic emissions during the failure process of bedded rock salt. Int. J. Rock Mech. Min. Sci. 2011, 48, 1344–1351. [Google Scholar] [CrossRef]
  18. Simpson, N.D.J.; Stroisz, A.; Bauer, A. Failure mechanics of anisotropic shale during Brazilian tests. In Proceedings of the 48th U.S. Rock Mechanics/Geomechanics Symposium, Minneapolis, MN, USA, 18 August 2014; p. 13. [Google Scholar]
  19. Ishida, T.; Kanagawa, T.; Kanaori, Y. Source distribution of acoustic emissions during an in-situ direct shear test: Implications for an analog model of seismogenic faulting in an inhomogeneous rock mass. Eng. Geol. 2010, 110, 66–76. [Google Scholar] [CrossRef] [Green Version]
  20. Xiao, F.; Liu, G.; Zhang, Z.; Shen, Z.; Zhang, F.; Wang, Y. Acoustic emission characteristics and stress release rate of coal samples in different dynamic destruction time. Int. J. Min. Sci. Technol. 2016, 26, 981–988. [Google Scholar] [CrossRef]
  21. Moradian, Z.A.; Ballivy, G.; Rivard, P.; Gravel, C.; Rousseau, B. Evaluating damage during shear tests of rock joints using acoustic emissions. Int. J. Rock Mech. Min. Sci. 2010, 47, 590–598. [Google Scholar] [CrossRef]
  22. Bunger, A.P.; Kear, J.; Dyskin, A.V. Sustained acoustic emissions following tensile crack propagation in a crystal-line rock. Int. J. Fract. 2015, 193, 87–98. [Google Scholar] [CrossRef]
  23. He, Q.Y.; Zhu, L.; Li, Y.C.; Li, D.Q.; Zhang, B.Y. Simulating Hydraulic Fracture Re-orientation in Heterogeneous Rocks with an Improved Discrete Element Method. Rock Mech. Rock Eng. 2021, 54, 2859–2879. [Google Scholar] [CrossRef]
  24. Li, D.Q.; Li, Y.C.; Zhu, W.C. Analytical Modelling of Load-Displacement Performance of Cable Bolts Incorporating Cracking Propagation. Rock Mech. Rock Eng. 2020, 53, 3471–3483. [Google Scholar] [CrossRef]
  25. US Energy Information Agency and Advanced Research Institute. E.I. Technically Recoverable Shale Oil and Shale Gas Resources: An Assessment of 137 Shale Formations in 41 Countries Outside the United States; US Energy Information Agency and Advanced Research Institute: Washington, DC, USA, 2013.
  26. Foster Natural Gas Report Group. Energy Information Administration’s Annual Energy Outlook 2015 Shows the U.S. Will Continue to Reduce Reliance on Foreign Fuels Imports. Foster Nat. Gas Rep. 2015, 1–154. [Google Scholar]
  27. Dong, D.Z.; Zou, C.N.; Li, J.Z.; Wang, S.J.; Li, X.J.; Wang, Y.M.; Huang, J.L. Shale gas resource potential and prospect of exploration and development. Geol. Bull. China 2011, 31, 324–336. [Google Scholar]
  28. Xiao, G.; Bai, Y.H.; Cai, C.Y. Key Technologies Progress of Shale Oil and Gas Development; Wuhan University Press: Wuhan, China, 2015. [Google Scholar]
  29. Zoback, M.D.; Barton, C.A.; Brudy, M.; Castillo, D.A.; Finkbeiner, T.; Grollimund, B.R. Determination of stress orientation and magnitude in deep wells. Int. J. Rock Mech. Min. Sci. 2003, 40, 1049–1076. [Google Scholar] [CrossRef]
  30. Zhao, H.; Chen, M. Real time prediction of borehole instability based on actual drilling data. Acta Pet. Sin. 2011, 32, 324–328. [Google Scholar]
  31. Lee, H.; Ong, S.H.; Azeemuddin, M.; Goodman, H. A wellbore stability model for formations with anisotropic rock strengths. J. Pet. Sci. Eng. 2012, 96, 109–119. [Google Scholar] [CrossRef]
Figure 1. Mesoscopic fracture monitoring device.
Applsci 12 00860 g001
Figure 2. Ultrasonic data acquisition system; ultrasonic wave probe.
Applsci 12 00860 g002
Figure 3. Structure of the ultrasonic wave probe.
Applsci 12 00860 g003
Figure 4. Designed model and picture of the seat for the ultrasonic wave probe.
Applsci 12 00860 g004
Figure 5. Schematics of multi-parameter monitoring system.
Applsci 12 00860 g005
Figure 6. Comparison of images before and after filtering. (a) Before median filtering. (b) After median filtering.
Applsci 12 00860 g006
Figure 7. Selection of image segmentation method.
Applsci 12 00860 g007
Figure 8. Stress–strain-dominant amplitude of the square shale sample (z-0-6).
Applsci 12 00860 g008
Figure 9. Static images of cracks during shale destruction. (a) Crack initiation stage; (bd) crack propagation stage; (e,f) crack penetration stage; (g) overall failure stage.
Applsci 12 00860 g009
Figure 10. Stress–strain-dominant amplitude (z-45-6) of square shale sample.
Applsci 12 00860 g010
Figure 11. Static images of cracks during the shale destruction process. (a) Crack initiation stage; (bd) crack propagation stage; (e) crack penetration stage; (f) overall failure stage.
Applsci 12 00860 g011
Figure 12. Stress–strain-dominant amplitude of the square shale sample (z-90-3).
Applsci 12 00860 g012
Figure 13. Static images of cracks during the shale destruction process. (a) Crack initiation stage; (bd) crack propagation stage; (ef) crack penetration stage; (g) overall failure stage.
Applsci 12 00860 g013
Table 1. Mechanical properties of the shale used in the experiment.
NumDensity
(g/cm−3)
Modulus of Elasticity
(104 Mpa)
Poisson’s RatioCompressive Strength
(MPa)
Z0-62.151.300.18156.83
Z45-62.131.780.13111.85
Z90-32.181.190.24144.49
Crack evolution characteristics during the destabilizing and cracking process of shale samples with different beddings under compressive load.
Table 2. Stress and strain values corresponding to the static crack images.
Crack No.Time (S)Strain Corresponding to the Crack Image (%)Stress Corresponding to the Crack Image (MPa)
a634.642.0480.11
b652.322.1083.46
c705.642.2797.24
d861.602.79125.65
e1072.563.49143.71
f1075.643.50143.37
g1091.643.56127.89
Table 3. Stress and strain values corresponding to the crack static images.
Crack No.Time (S)Strain Corresponding to the Crack Image (%)Stress Corresponding to the Crack Image (MPa)
a1007.321.64111.79
b1007.641.64110.74
c1011.001.65111.23
d1021.641.66111.79
e1022.001.66111.25
f1022.321.67106.20
Table 4. Stress and strain values corresponding to the static crack images.
Crack No.Time (S)Strain Corresponding to the Static Crack Image (%)Stress Corresponding to the Static Crack Image (MPa)
a628.322.0295.01
b682.242.19105.92
c796.962.2797.24
d812.602.65134.73
e820.602.79143.71
f864.962.80144.38
g865.322.81144.49
Publisher’s Note: MDPI stays neutral with regard to jurisdictional claims in published maps and institutional affiliations.

