Featured Application
Through the estimate of the Load Rating Factor of existing railway masonry arches, it is possible to identify and define an order of urgency for those bridges belonging to this structural type which fail to comply with current design codes, or which are most in need of thorough verification. As a result, the algorithm presented can be employed within a framework of risk assessment and prioritization of interventions.
Abstract
Most railway masonry arch bridges were designed according to codes that predate the 1950s; therefore, assessing their load-carrying capacity to comply with current codes is of the utmost importance. Nonetheless, acquiring the necessary information to conduct in-depth analyses is expensive and time consuming. In this article, we propose an expeditious procedure to conservatively assess the Load Rating Factor of masonry arch railway bridges based on a minimal set of information: the span, rise-to-span ratio, and design code. This method consists in applying the Static Theorem to determine the most conservative arch geometry compatible with the original design code; assuming this conservative geometrical configuration, the load rating factor, with respect to a different design load, is estimated. Using this algorithm, a parametric analysis was carried out to evaluate the Load Rating Factor of old arch bridges in respect of the modern freight load of the Trans-European Conventional Rail System, for different spans, rise-to-span ratios, and original design codes. The results are reported in easy-to-use charts, and summarized in simple, practical rules, which can help railway operators to rank their bridges based on capacity deficit.
1. Introduction
Recent bridge failures all over the world [,,], including the collapse of the Morandi bridge in Italy, which caused 43 deaths in 2018 [], turned the spotlight on the state of the existing bridge asset worldwide []. In the wake of such accidents, verifying whether heritage structures have enough load-carrying capacity to comply with current codes has become an urgent need [,,,]. For those structures constructed prior to the most recent codes, which represent the majority of the railway infrastructures in many countries [,,], the old age of the bridges and consequential lack of documentation makes it particularly complicated to acquire information from the infrastructure operators [,,]. In principle, in order to properly understand the state of deterioration and residual capacity of an existing bridge [,,,], an extensive campaign of tests, monitoring, and assessment needs to be conducted [,,,,].
However, the large number of structures typically managed by each operator makes it unfeasible to conduct, in the short term, an in-depth evaluation of every bridge [,,]. Consequently, several national authorities have developed assessment procedures involving multiple levels of complexity: the logic is to assess all bridges with a first-level conservative procedure [,,], which requires minimal knowledge of the structural extent, and then proceed with more refined assessment methods [,] only if a critical situation [] or insufficient load-carrying capacity [,,] is highlighted. Understanding what the original code design demand was, and comparing it with the current code design demand, is therefore a key step in carrying out the first level of verification [,,], particularly for masonry arch railway bridges [,], most of which were designed according to pre-WW2 codes [,,].
As for first level verifications, operators could perform extensive numerical simulations on their stock of bridges to evaluate their load-carrying capacity, as performed in [] for a single masonry arch bridge. Nevertheless, recent developments in numerical simulation, applied to civil engineering, mainly focus on accurately studying complex structural behaviors and actions [,,,,,], rather than on providing expeditious methods of working with limited input data. In the literature, different theories about the safety of masonry arches can be found [], among which are the Mery Method [], the first rational approach to arches [], and Heyman’s Safe Theorem [,]. Yet even the most recent methods for evaluating the capacity of masonry arch bridges [,], including those based on limit analysis [,] and probabilistic approaches [], involve a thorough and comprehensive knowledge of the structural geometry and properties. In particular, all geometric [] and material data [] are required, in most procedures, in order to evaluate the arch capacity, with special consideration of the arch depth and fill properties []. It is, however, difficult to obtain such information without performing expensive inspections and samplings [,]. In addition, despite existing exhaustive numerical studies on the behavior of masonry arch bridges [,], the technical literature does not currently report any ‘fast and frugal’ methods for assessing the reserve capacity of a masonry arch.
In this article, we propose an expeditious procedure to conservatively assess the reserve capacity of masonry arch railway bridges with a minimal set of information, namely the span, rise-to-span ratio and design code, employable within a framework of risk assessment and prioritization of interventions. The method, based on an iterative application of the Static Theorem [,], determines the most conservative arch geometrical configuration compatible with the original design code, through a shape-finding first step [,,,], and thereupon estimates the capacity reserve of bridges designed according to such code with respect to different loads. A parametrical analysis considering current European railway loads, as in [,], and a set of different spans and rise-to-span ratios was carried out, thus demonstrating the feasibility of the method to real railway bridges, and developing easy-to-use charts providing the reserve capacity of arches based on the design code. Since in older design codes dynamic effects were not always accounted for, the analysis was carried out both considering and neglecting the dynamic amplification factors required by most recent codes. The proposed method allows operators to promptly single out those bridges which require immediate attention, without the need of complex analysis. Hence, it provides a useful tool for ranking bridges by their priority for extensive tests, inspections, and formal assessments, as well as for programming maintenance, repair, and reconstruction works.
2. Numerical Methods
In order to assess the reserve capacity of a masonry arch without performing an in-depth analysis, where the ability of a bridge to withstand current codes load requirements is intended, a simple method that requires only few input data was developed.
The main aim of the method is presented in Section 2.1, whilst the numerical procedure, consisting of two analyses, and the numerical algorithm are outlined in Section 2.2 and Section 2.3, respectively. Lastly, indications regarding the load redistribution hypotheses are provided in Section 2.4.
2.1. Aim of the Numerical Method
The main aim of the method is to determine if a minimal reserve capacity can be guaranteed by evaluating the Load Rating Factor [] for a particular railway load, given only the span , rise-to-span ratio , and design loads.
The Load Rating Factor is associated with the load multiplier and provides an estimate of the ratio between capacity and demand .
In general, for an arch which bears the permanent load and the live load q, the total load can be defined as in Equation (1):
where α is the load multiplier. The multiplier allows quantification of the live load increase in comparison to the reference value . For , the live load is the exact reference load, whereas for the live load is greater than the reference load. An evaluation of the critical load multiplier is carried out by increasing the load multiplier α and verifying the arch subjected to the load for each and every increment. When the arch is not verified, it means that the load is excessively high for the given arch, and any further increment of would be pointless. The last, or rather the maximum, load multiplier for which the arch is verified is the critical load multiplier .
In the case of moving loads, the procedure for the evaluation of the critical load multiplier is to be repeated for every position of the load. For instance, given a single load, the load would be applied, in turn, at every coordinate . Instead, given a two-axial load, with each axis at a distance , the position of the two axes would be and . The critical load multiplier of the whole structure would be the minimum of the critical load multipliers found for every position of the load, as in Equation (2).
Finally, the Load Rating Factor can be defined as the minimum of the critical load multipliers , as shown in Equation (3):
2.2. Numerical Procedure to Conservatively Assess the Reserve Capacity in Existing Masonry Arches
For the generic masonry arch geometry presented in Figure 1, the method for the evaluation of the Load Rating Factor consists in two subsequential analyses, summarized hereafter and outlined in Figure 2:
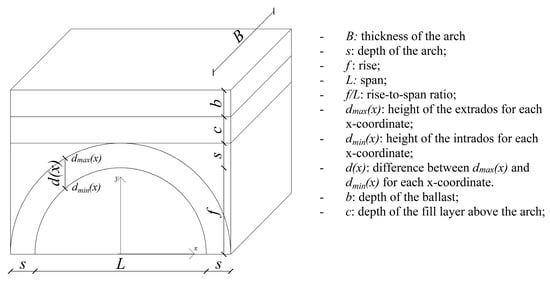
Figure 1.
Geometry of a generic arch.
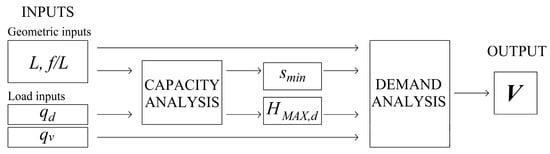
Figure 2.
Scheme of the procedure.
- Capacity analysis—Minimum depth and horizontal thrust definition
Being the span of the arch and rise-to-span ratio the only geometrical information available, a preliminary analysis for the minimum depth and horizontal thrust definition is necessary to univocally define the arch. These data are determined for a given design load, and the arch therefore requires such a depth to be verified (Section 2.2.1) for the given design load . The procedure is conducted as follows:
- 1.a.
- Evaluation of the minimum depth of the arch , for which the arch is verified for the design code, and for which there can be no further load increases, i.e., with the hypothesis of critical load multiplier .
- 1.b.
- Evaluation of the design horizontal thrust as the maximum of all the minimum horizontal forces related to the lines of thrust, for which the equilibrium is satisfied, for every position of the load on the arch of depth defined as the previous bullet point. Since = does not imply that the most restrictive value of is found as well, a certain number of depths > can be stored with their associated values, to define more configurations to employ in the following demand analysis. Small variations of are found when the value of is increased, and the most severe situation should be found for values of directly next to .
- 2.
- Demand analysis—Load Rating Factor definition
Once the capacity analysis is concluded, the demand analysis is to be conducted for each and configuration. For such configurations, the Load Rating Factor is evaluated for the railway line load , for which the reserve capacity should be investigated. The procedure is the following:
- 2.a.
- Evaluation of the critical load multiplier of the line load, for which the arch is verified (Section 2.2.1) and the horizontal thrust does not exceed . In the case of moving loads, the critical load multiplier is evaluated for every position of the load moving on the deck, as indicated in Section 2.1.
- 2.b.
- Assessment of the Load Rating Factor as the minimum load multiplier, or rather the minimum of the multiplier , i.e., ) for moving loads or for stationary loads.
The Load Rating Factor of the whole structure is the minimum of the factors found for every and configuration.
It can be observed that additional inputs, i.e., the density of the materials , the thickness of the arch , and the depths of the ballast and filling layer , are necessary to evaluate the exact critical load multiplier of a single arch configuration. However, for the application of the full method (capacity analysis and demand analysis) to a stock of arches, conservative assumptions can be made on the additional data, e.g., no filling layer , which reduces the size of the input information, yet allows the obtainment of valid estimates of the Load Rating Factor . Indeed, considering that the minimum geometry of the arch is governed by the shape of the bending moment, rather than by its magnitude, assumptions on additional data have a limited effect compared to the definition of the transiting loads. In fact, the shape of the bending moment, induced by the ballast and filling layer, is less critical than the one caused by the transiting load, since the latter is more concentrated. In addition, the aim of the full method is to point out the bridges that require an in-depth analysis, i.e., bridges for which a reserve capacity cannot be guaranteed without performing an in-depth analysis. Conservative assumptions give the smallest arch geometry, thus leading to the most critical design situation to be verified. Finally, the same additional data are considered in both the capacity and demand analyses, further reducing their influence on the final output V.
2.2.1. Verification of the Arch
In order to carry out the reserve capacity assessment shown in the previous paragraph, a verification of the arch based on the Static Theorem is used. This method verifies, for each load condition, whether there exists at least one line of thrust, in equilibrium with the external loads, which is contained within the depth of the arch. This condition is sufficient for equilibrium and provides a lower limit of the load multiplier [].
The arch is considered a masonry arch, given a span and rise-to-span ratio , that bears the permanent load , the reference live load , and the horizontal thrust , applied at heights and , as shown in Figure 3. The developed algorithm also enables the application of horizontal actions, e.g., seismic forces. Nevertheless, since more in-depth analyses are recommended when considering such actions [,], and the purpose of the algorithm is to provide a quick estimate of the capacity of old bridges with respect to the new traffic loads, only vertical forces are considered and represented in Figure 3.
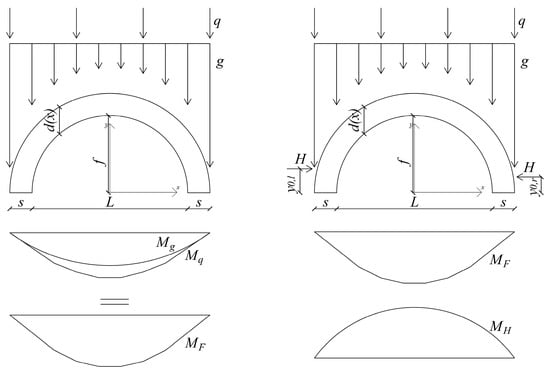
Figure 3.
Applied load and moment distribution on the arch.
The arch will be subjected to a bending moment and a bending moment , associated, respectively, with the loads and , the sum of which gives the total bending moment . Defining as the resisting moment of the arch, the equation that describes the line of thrust can be written as follows:
where and can be calculated as:
The condition for which the arch is verified establishes that, given the external load and , there exists at least one value of for which the line of thrust is contained within the depth of the arch.
2.3. Numerical Algorithm
The procedure is carried out by means of a numerical algorithm. The arch is discretized into blocks, the number of which, i.e., , can be defined by the user to increase accuracy, or decrease computation time. Three main sections (Sections 1–3 of Figure 4) are identified, and possible lines of thrust are defined by varying the values of , , and in Equation (4). The arch is considered to be verified if there is at least one line of thrust crossing the three sections that, for every , is contained in . Figure 4 shows all possible line of thrust that cross the three main sections. Rejected lines of thrust, that are not contained in for every , are depicted in red. In this configuration the arch is assumed to be verified, since at least one line of thrust is accepted (green lines).
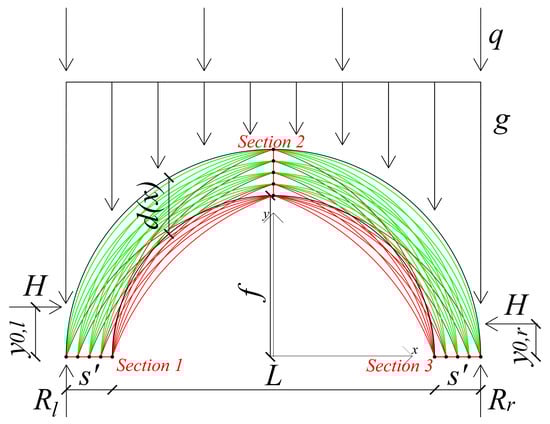
Figure 4.
Accepted (green) and rejected (red) lines of thrust.
For the line of thrust to cross the main sections, one and three, and for the equilibrium at the base sections to be satisfied, the values of the bending moments and , and therefore the values of and , must necessarily be lower than and , respectively.
As a consequence, the algorithm will employ only the values of and shown in Equations (9) and (10):
where and are the vertical reaction forces at the base extremities of the arch, as shown in Figure 4, and is the base horizontal section of the arch, with the arch internal radius . It is important to notice that, as shown in Figure 4, for arches with a rise-to-span ratio , coincides with the depth of the arch .
In addition, for equilibrium conditions, and for the line of thrust to cross the main Section 2, the total bending moment in the midspan must have a value between and .
Therefore, given the hypothesis of Equations (7), (8) and (11), it is necessary to find values of H, and such that:
2.4. Hypotheses on the Load Redistribution
Different hypotheses can be made on the load application, and a simplified redistribution of the load can be employed. In particular, for the analysis conducted within this paper, a uniform transversal load distribution and a longitudinal load distribution on crosspieces were applied. The transversal load was redistributed on a thickness , and the longitudinal load was distributed on three crosspieces with a thickness of and axes at a respective distance of . The longitudinal distribution angle was in the ballast, and in the fill and spandrel, according to Figure 5.
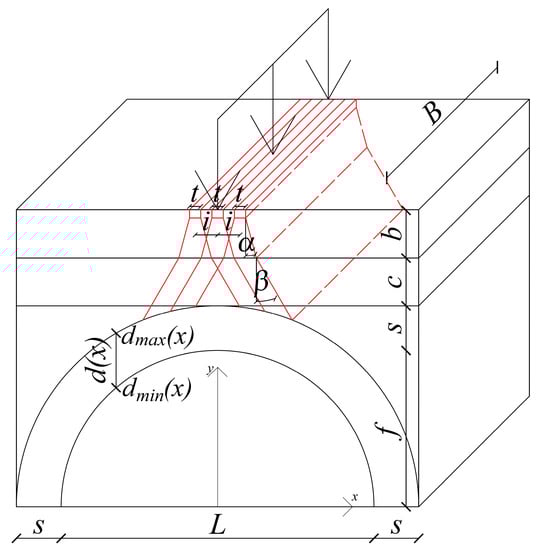
Figure 5.
Load redistribution hypothesis.
The load redistribution model is arbitrary; therefore, more accurate models such as Boussinesq [] can be used at will. With respect to the purpose of this paper, however, more accurate models are beyond the scope of this research.
3. Validation of the Algorithm
Being the presented algorithm an application of the Static Theorem, a comparison between the results obtained using such an analysis and the Kinematic Theorem was carried out [,]. While the Static Theorem aims to find a lower limit of the load multiplier, the Kinematic Theorem’s objective is to find an upper limit of the load multiplier [,,]. The comparison was based on the lines of thrust obtained with the two methods, as well as on the position of the plastic hinges.
Four case studies were analyzed in order to validate the algorithm. In particular:
Case study 1: All sixth arch with a concentrated force applied in the midspan of the arch.
Case study 2: All sixth arch with a concentrated force applied at a distance of from the left intrados springing point.
Case study 3: All sixth arch, without ballast, and the Category D4 line load was applied with the first wheel at a distance of from the left intrados springing point.
Case study 4: All sixth arch, with ballast, and the Category D4 line load was applied with the first wheel at a distance of from the left intrados springing point.
The arches considered in the four case studies are all sixth arches characterized by length of the arch , depth , fill layer depth at the key of the arch , and depth of the ballast layer null () for the first 3 case studies, while the ballast layer was considered to be for the 4th case study. The arch thickness was set as . The unit weights , and were considered for the masonry, ballast, and fill layer respectively. The train-track load was assumed .
The arches were each divided in 40 blocks () and the hypotheses on the load distribution were as stated in Section 2.4.
For validation, it was not necessary to conduct the capacity analysis (Section 2.2) since the depth of the arches was given; therefore, only the demand analysis was conducted.
The lines of thrust obtained with the numerical algorithm are shown in Figure 6, where, for comparison purposes, the positions of the plastic hinges obtained with a software that operates using the Kinematic Theorem (software Ring []) are shown in red.
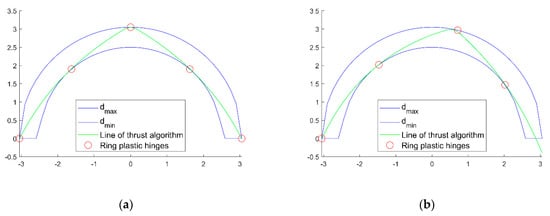
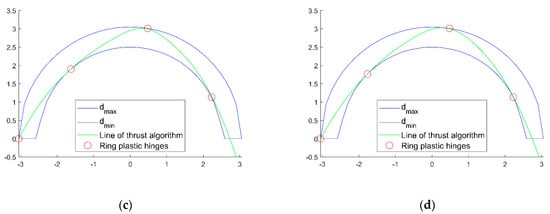
Figure 6.
Lines of thrust obtained with the numerical algorithm for each case study, in comparison with the plastic hinges position obtained with the software Ring: (a) case study 1, (b) case study 2, (c) case study 3, (d) case study 4.
The position of the plastic hinges coincides with good approximation for all the 4 validation case studies. In addition, even though Ring employs a more refined load redistribution rule (Boussinesq []), the results obtained with Ring and with the proposed numerical method are in good agreement, confirming that the accuracy of the implemented redistribution rule is sufficient at this stage.
4. Application to a Stock of Bridges with Current Verification Loads
An application of the developed method is proposed in this section. An extensive parametric analysis was performed to assess the reserve capacity of a stock of masonry arches of the railway system (Figure 7).
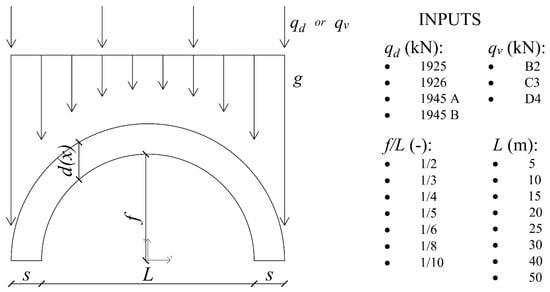
Figure 7.
Inputs of the parametric analysis.
To obtain results on the safe side, conservative assumptions were made on the geometrical quantities, and neither the fill layer above the crown of the arch, nor the ballast, were considered (, ). The arch thickness was set as . The unit weights , , and were considered for the masonry, ballast, and fill layer, respectively, and the train-track load was assumed .
The arches were each discretized in 40 blocks () and the assumptions on the load distribution were the ones described in 2.4.
Arches with eight different spans (between 5 and 50 m) and seven ratios were investigated. Four design codes, from 1925 to 1945, were considered, resulting in different design loads for the existing arches, namely 1925 [], 1926 [], and 1945A and 1945B []. The reserve capacity of the arches was evaluated with respect to three actual loads acting on the infrastructures in accordance with the classification of lines, or sections of lines, as reported in [,]. The B2, C3, and D4 line loads shown in Figure 8 were used in this study. The load configurations employed for all these design and line loads were single or multiple concentrated forces, with the only exception of the 1926 code, which recommends the only use of distributed loads, as shown in Figure 8.
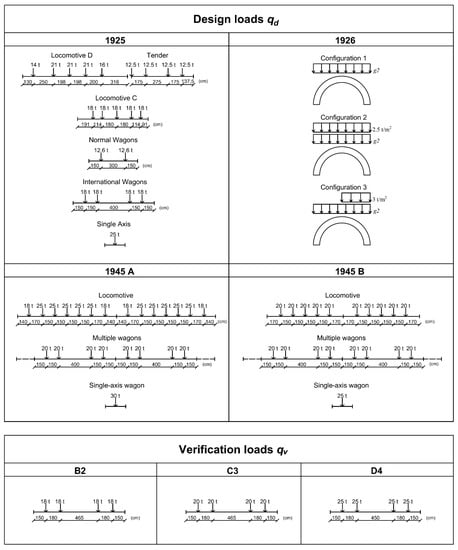
Figure 8.
Design and verification loads used for parametric analysis (load weights in tons or tons per square meter).
In Figure 8 the loads are shown in tons (t) and tons per square meter (t/m2), whereas the interaxle spacing is shown in centimeters (cm).
The stability of the arches is governed by the shape, rather than the magnitude of the bending moment. Therefore, only load configurations consisting of single wagons were considered in the analyses, since they lead to more uneven distributions of the bending moment and thus were judged to be more critical for stability. Nevertheless, the developed method allows for the use of different load layouts, if more extensive parametric analyses are intended.
For exemplificative purposes, the procedure is illustrated for the 1945A design load and the B2 line. Firstly, the design arch depth was sought for each one of the different load configurations associated with the 1945A trains. Three load configurations were employed, consisting of a single load and the loads representing two single train components, namely a locomotive and a wagon. The minimum depth , together with the associated value of horizontal thrust , is reported for arches with in Table 1. The maximum among the of each load configuration was selected to define the arch geometry to be verified, since it represents the minimum design depth to comply with the 1945A code. However, choosing an arch with the minimum depth did not imply that the lowest value of was found as well. For this reason, 15 depths from to , with the associated values, were stored, defining a list of - configurations to be verified. In detail, for each configuration, the B2 load was moved along the span, and for every -th load position the value of was determined. The lowest value of for each load position was taken as the for the specific - configuration. The lowest among the load multipliers of each of the - couples identified the reserve capacity that could be guaranteed for the investigated arch. The results of the analyses for each of the ratios and are shown in Table 1.

Table 1.
Minimum load multipliers for arches designed according to the 1945A code and verified with the B2 load.
The analyses were performed for different spans, and the outcomes are summarized in Table 2 and Figure 9.
Table 2.
Load Rating Factors for arches designed according to the 1945A code and verified with the B2 load.
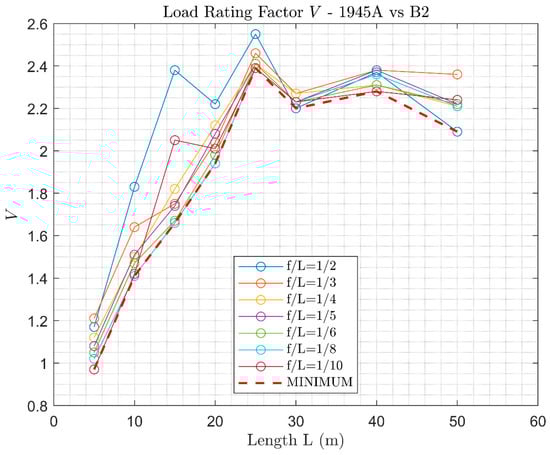
Figure 9.
Reserve capacity of arches designed according to the 1945A code and verified with the B2 load.
Being that the minimum load multiplier precisely describes the Load Rating Factor , the following factors (Table 2) can be obtained for the 1945A design code with respect to the B2 line load.
Similarly, this approach was adopted for the 1925, 1926, and 1945A and 1945B design codes, as well as for the B2, C3, and D4 load lines. The minimum reserve capacity for each combination of design and verification loads are reported in Table 3.
Table 3.
Load Rating Factors for the 1925, 1926, 1945A, and 1945B design loads, and the B2, C3, and D4 lines.
It appears evident that, for arches designed according to the 1926 code, no capacity reserves could be found, since is always less than 1. This result is due to the fact that the 1926 code prescribes the use of distributed loads, which are less critical because they induce a shape of the bending moment that follows the shape of the arch fairly well, and in principle allows for the design of arches with a very small depth.
The same procedure was repeated considering a dynamic amplification factor to increase the applied loads:
The value of the dynamic amplification factor depends on the code, and on the length of the arch, as depicted in Figure 10. In detail, constant values were assumed for the design codes, notably for the 1925 and 1926 loads and for the 1945A and 1945B loads, whilst varied with the length for the line loads B2, C3, and D4. The dynamic amplification factors are higher for the B2 and C3 lines, since they have higher associated design velocities compared to the D4 line.
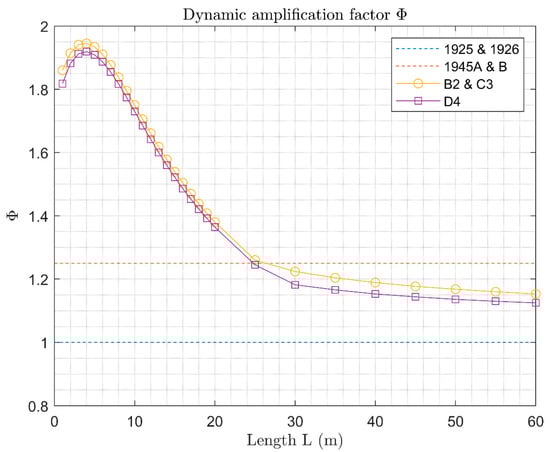
Figure 10.
Dynamic amplification factors applied to different loads.
It is important to notice that for the dynamic amplification factors used in this analysis, it was assumed that, for the 1925 and 1926 design codes, no dynamic amplification was considered at the design stage.
The minimum reserve capacities obtained from the analyses are summarized in Table 4 for each combination of design and verification loads.
Table 4.
Load Rating Factors for the 1925, 1926, 1945A, and 1945B design loads, and the B2, C3, and D4 lines, with dynamic amplification.
5. Discussion of the Results
The results reported in Table 3 and Table 4 are shown in Figure 11, Figure 12, Figure 13, Figure 14, Figure 15 and Figure 16 for a more immediate understanding of the outputs.
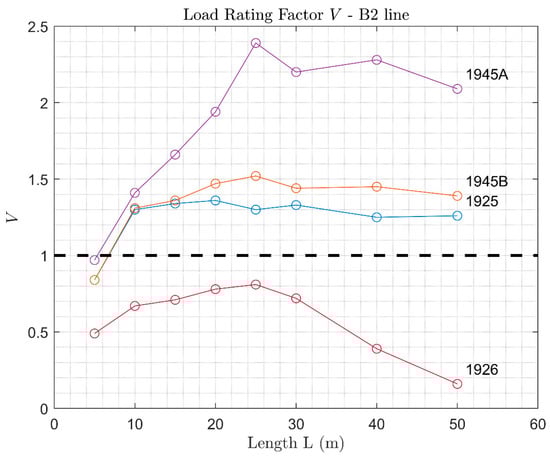
Figure 11.
Load Rating Factor of arches verified with B2 loads.
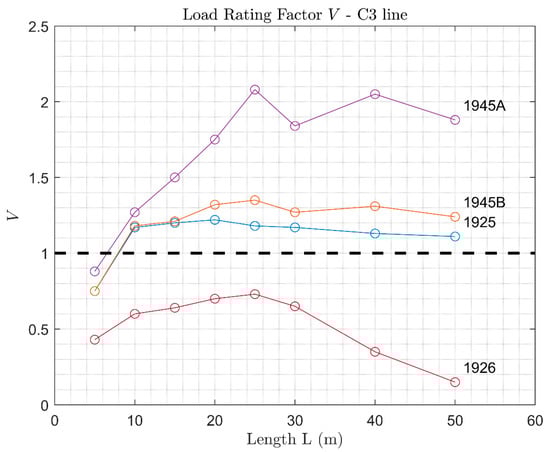
Figure 12.
Load Rating Factor of arches verified with C3 loads.
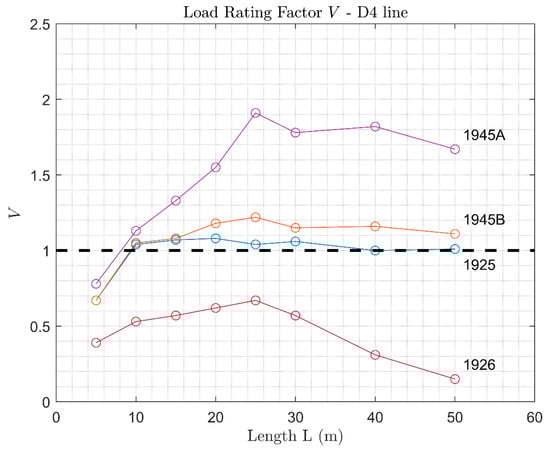
Figure 13.
Load Rating Factor of arches verified with D4 loads.
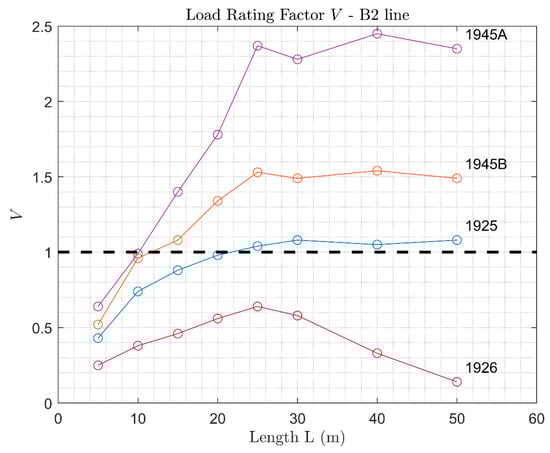
Figure 14.
Load Rating Factor of arches verified with B2 loads, with dynamic amplification.
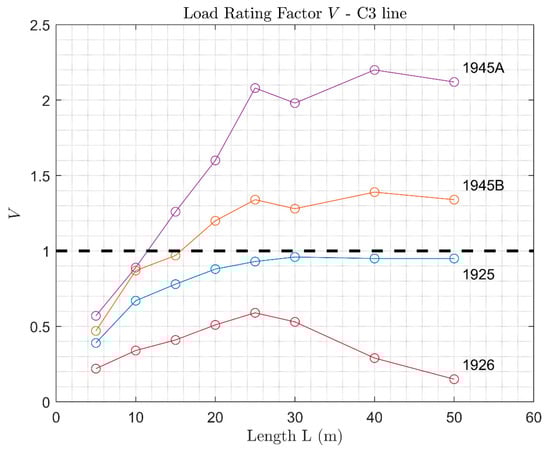
Figure 15.
Load Rating Factor of arches verified with C3 loads, with dynamic amplification.
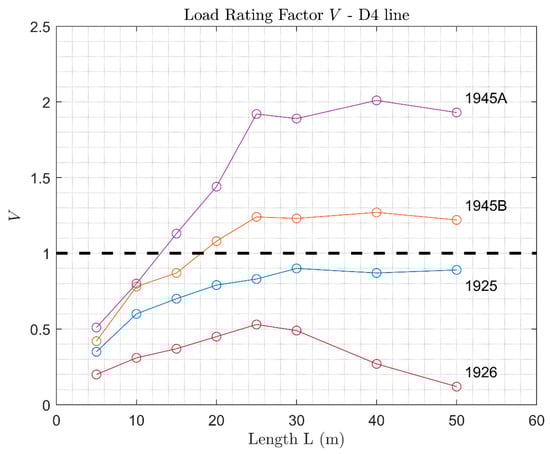
Figure 16.
Load Rating Factor of arches verified with D4 loads, with dynamic amplification.
It emerges that, for very short bridges with spans in the order of 5 m, the Load Rating Factor always results in a value much lower than one.
The analysis also outlines how design loads prior to the World War 2 were less demanding than more recent ones, whereas design loads subsequent to 1945 highlight the presence of a capacity reserve with respect to the current line loads. With reference to the line loads, they are ordered by burdensomeness as well; thereby, the reserve capacity is higher for B2 line loads and lower for D4 line loads.
It appears evident that the reserve capacity for each line is strongly influenced by the design code. Indeed, the 1945A code allows for remarkable capacity reserves, whereas lower Load Rating Factors were found for the 1945B code. In fact, the most severe load in the 1945 code is the single-axis wagon, which in the 1945A design load has a higher value than in 1945B (see Figure 9), resulting in higher , and, as a consequence, a higher capacity.
Reserve capacities similar to 1945B were obtained for 1925 code (Figure 11, Figure 12 and Figure 13), although for the latter almost no capacity reserves were found when considering the dynamic amplification (Figure 14, Figure 15 and Figure 16). Significant capacity deficits were always found for the analysis conducted with the 1926 design code, since distributed loads, such as the ones prescribed in such codes, are less critical, as the Load Rating Factor is a function more of the shape of the bending moment than of its entity. As a consequence, the 1926 code allows for designing arches with depths so low that they are not sufficient to meet the verification loads (B2, C3, and D4). It follows that it cannot be assumed that arches designed according to such a code are automatically verified for the line loads, as the obtained Load Rating Factors are always lower than one.
Furthermore, verification against the 1925 and 1926 codes results in considerably lower capacities when dynamic amplification is considered (Figure 14, Figure 15 and Figure 16). This is due to the fact that the dynamic amplification factor equals one for the 1925 and 1926 codes, i.e., no dynamic amplification was prescribed in the codes, whilst for the verification loads (B2, C3, and D4) it is always higher than one (Figure 10). Hence, the design and remain unchanged, as compared to the analysis without dynamic amplification, but higher verification loads are applied, resulting in more burdensome verifications. When applying the dynamic amplification, the values of the Load Rating Factors for the 1925 design loads are, therefore, lower or just slightly higher than one, even for spans above 5 m.
Based on the results of the parametric analysis, some indications can be gathered for masonry arches designed according to Italian codes. For bridges with spans , or designed according to the 1926 design code, no evidence of capacity reserve was found. With regards to bridges designed according to 1925 code, they resulted in being verified for when dynamic amplification is neglected. Instead, when dynamic amplification is considered, a capacity reserve is found only when the B2 verification line load is used on bridges with spans . As far as the 1945 code is concerned, when dynamic amplification is neglected, only bridges with spans are able to withstand the current loads, whereas when dynamic amplification is accounted for, different results between 1945A and 1945B codes can be observed. In particular, when using the 1945A code, a reserve capacity is found for arches with spans , while for bridges designed according to the 1945B code a capacity reserve is observed for structures with spans , or for spans if the B2 verification line load is used. The minimum spans found for the generic arches, to show a reserve capacity, are summarized in Table 5.
Table 5.
Minimum spans of bridges highlighting Load Rating Factor V > 1.
As a final remark, it is important to note that applying dynamic amplification does not necessarily imply that the reserve capacity decreases. This can be observed by comparing the Load Rating Factor obtained for the 1945 codes with and without dynamic amplification (Figure 17, Figure 18 and Figure 19). The trend shown by the curves can be explained looking at the dynamic amplification factors applied (Figure 10). The dynamic amplification factor for the 1945 design code is equal to , and similar values of the amplification factor are prescribed for 25 m span bridges in the B2, C3, and D4 line loads. Accordingly, for the Load Rating Factor , with and without dynamic amplification, is almost the same (Figure 17, Figure 18 and Figure 19). Instead, the factors for the B2, C3, and D4 line loads, respectively , are higher than for spans , and lower than for spans (Figure 10). In a similar way, for , lower values of the Load Rating Factor are obtained, since the verification load becomes more severe compared to the design loads, whereas for , the verification load becomes less burdensome, resulting in higher values of the Load Rating Factors (Figure 17, Figure 18 and Figure 19).
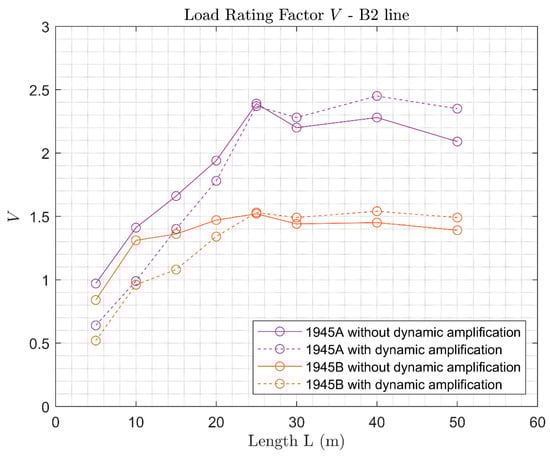
Figure 17.
Load Rating Factor of arches designed according to the 1945 code and verified with B2 loads, both with and without dynamic amplification comparison.
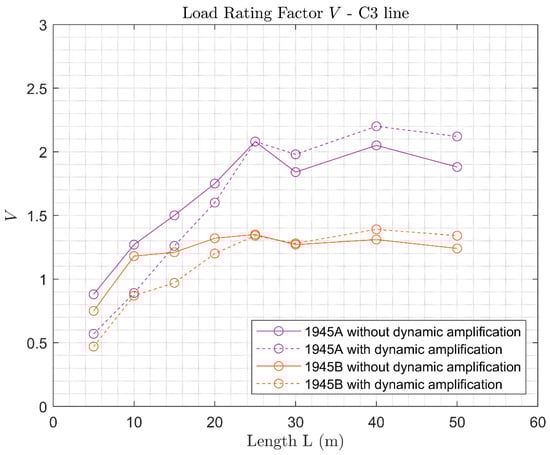
Figure 18.
Load Rating Factor of arches designed according to the 1945 code and verified with C3 loads, both with and without dynamic amplification comparison.
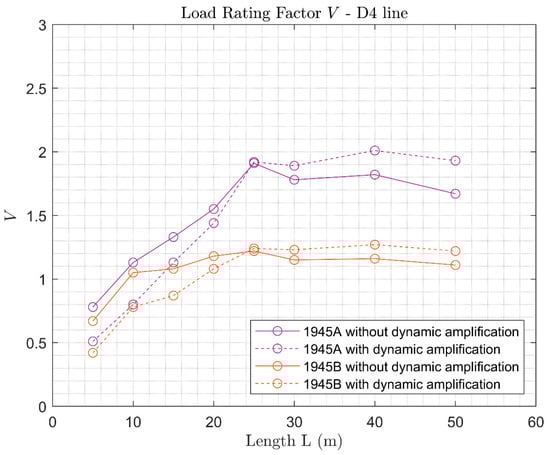
Figure 19.
Load Rating Factor of arches designed according to the 1945 codes and verified with D4 loads, both with and without dynamic amplification comparison.
6. Conclusions
Many bridge operators are currently upgrading their procedures for inspection, maintenance, and monitoring of existing structures towards multilevel approaches. The logic is to start verifying the bridges with simple conservative methods, and then proceed with more refined and expensive procedures, only if the minimal load carrying capacity is not assessed.
In this paper, an easy-to-use method for first-level expeditious assessments of masonry arch railway bridges is proposed. This method provides conservative evaluation of the reserve capacity of existing arches, with respect to the current design load, given only its span, the rise-to-span ratio, and the original design code. The procedure perfectly responds to the need for a straightforward way of assessing the reserve capacity of existing bridges without the need for comprehensive knowledge of the structural properties.
For specific masonry arches designed in compliance with the railway bridges codes in references [,,], the following conclusions can be drawn:
- Arches designed according to the 1926 code are not automatically verified for any of the current European line loads;
- If we neglect dynamic amplification, arches designed according to the 1925 code are verified for any of the current European line loads for spans ;
- If we consider dynamic amplification, arches designed according to the 1925 code are never automatically verified for line loads C3 and D4, while they are verified for B2 line loads, though only for spans ;
- If we neglect dynamic amplification, arches designed according to the 1945 code are verified for any line loads for spans ;
- If we consider dynamic amplification, arches designed according to the 1945 code with load type 1945A, are verified for any line loads for spans ;
- If we consider dynamic amplification, arches designed according to 1945 code with load type 1945B, are verified for line loads C3 and D4, spans , and line load B2 for spans .
The method presented can be extended to any pair of transit load and design code. It therefore provides a simple and immediate estimate of the nominal reserve capacity for any masonry arch bridge, and allows a priori knowledge of whether in-depth analysis might be worthwhile, thus enabling operators to single out those structures requiring immediate interventions or thorough verifications. For agencies managing a large stock of bridges, this conservative evaluation of the Load Rating Factor is a useful tool for classifying bridges based on their capacity deficit. This method provides a priority ranking for tests, inspections, and formal assessment, as well as for programming maintenance, repair, and reconstruction works.
Author Contributions
Conceptualization, D.Z., F.B. and L.P.; methodology, F.B., D.Z. and L.P.; software, L.P. and F.B.; validation, F.B., L.P. and D.Z.; formal analysis, L.P. and F.B.; investigation, F.B. and L.P.; resources, F.B. and L.P.; data curation, L.P. and F.B.; writing—original draft preparation, F.B. and L.P.; writing—review and editing, F.B., L.P. and D.Z.; visualization, L.P. and F.B.; supervision, L.P. and D.Z.; project administration, D.Z.; funding acquisition, D.Z. All authors have read and agreed to the published version of the manuscript.
Funding
This research was funded by RFI—Rete Ferroviaria Italiana, in the frame of the research agreement “Estensione del sistema DOMUS per la Gestione dei Ponti Ferroviari”.
Institutional Review Board Statement
Not applicable.
Informed Consent Statement
Not applicable.
Data Availability Statement
The data that support the findings of this study are available on request from the corresponding author (L.P.). Restrictions apply to the availability of these data, which were used under license for this study.
Acknowledgments
The work presented in this paper was carried out under the research agreement between RFI—Rete Ferroviaria Italiana and the University of Trento. The financial contribution of RFI is acknowledged.
Conflicts of Interest
The authors declare no conflict of interest. The funders had no role in the design of the study; in the collection, analyses, or interpretation of data; in the writing of the manuscript; or in the decision to publish the results.
References
- Fan, Y.; Zhu, J.; Pei, J.; Li, Z.; Wu, Y. Analysis for Yangmingtan Bridge collapse. Eng. Fail. Anal. 2015, 56, 20–27. [Google Scholar] [CrossRef]
- Lichtenstein, A.G. The Silver Bridge Collapse Recounted. J. Perform. Constr. Facil. 1993, 7, 249–261. [Google Scholar] [CrossRef]
- Hao, S. I-35W Bridge Collapse. J. Bridge Eng. 2010, 15, 608–614. [Google Scholar] [CrossRef]
- Calvi, G.M.; Moratti, M.; O’Reilly, G.J.; Scattarreggia, N.; Monteiro, R.; Malomo, D.; Calvi, P.M.; Pinho, R. Once upon a Time in Italy: The Tale of the Morandi Bridge. Struct. Eng. Int. 2018, 29, 198–217. [Google Scholar] [CrossRef]
- The Japan Times, Ltd. Bridge Collapse Costs Genoa Companies €422 Million in Damages: Chamber of Commerce; Ichibancho-Daini-TG Bldg.: Tokyo, Tokyo, 2018. [Google Scholar]
- Walraven, J. Residual shear bearing capacity of existing bridges. FIB Bull. 2010, 57, 129–138. [Google Scholar] [CrossRef]
- Miyamoto, A.; Kawamura, K.; Nakamura, H. Development of a bridge management system for existing bridges. Adv. Eng. Softw. 2001, 32, 821–833. [Google Scholar] [CrossRef] [Green Version]
- Zampieri, P.; Tetougueni, C.D.; Pellegrino, C. Nonlinear seismic analysis of masonry bridges under multiple geometric and material considerations: Application to an existing seven-span arch bridge. Structures 2021, 34, 78–94. [Google Scholar] [CrossRef]
- Šomodíková, M.; Lehký, D.; Doležel, J.; Novák, D. Modeling of degradation processes in concrete: Probabilistic lifetime and load-bearing capacity assessment of existing reinforced concrete bridges. Eng. Struct. 2016, 119, 49–60. [Google Scholar] [CrossRef]
- Teworte, F.; Herbrand, M.; Hegger, J. Structural Assessment of Concrete Bridges in Germany—Shear Resistance under Static and Fatigue Loading. Struct. Eng. Int. 2015, 25, 266–274. [Google Scholar] [CrossRef]
- Brencich, A.; Sabia, D. Experimental identification of a multi-span masonry bridge: The Tanaro Bridge. Constr. Build. Mater. 2008, 22, 2087–2099. [Google Scholar] [CrossRef]
- Ye, C.; Butler, L.; Huseynov, F.; Middleton, C. Evaluating in-service structural behaviour of an operational railway bridge using fibre optic sensing and structural model updating. Eng. Struct. 2021, 247, 113116. [Google Scholar] [CrossRef]
- Casas, J.R.; Gómez, J.D. Load rating of highway bridges by proof-loading. KSCE J. Civ. Eng. 2013, 17, 556–567. [Google Scholar] [CrossRef]
- Gómez, J.D.; Casas, J.R. Assessment of Bridge Capacity through Proof Load Testing. In Life-Cycle Civil Engineering; CRC Press: Boca Raton, FL, USA, 2008; pp. 579–584. ISBN 0429207255. [Google Scholar]
- Navrátil, J.; Drahorád, M.; Ševčík, P. Assessment of Load-Bearing Capacity of Bridges. Solid State Phenom. 2017, 259, 113–118. [Google Scholar] [CrossRef]
- Worden, K.; Cross, E.; Dervilis, N.; Papatheou, E.; Antoniadou, I. Structural Health Monitoring: From Structures to Systems-of-Systems. IFAC-Pap. 2015, 48, 1–17. [Google Scholar] [CrossRef]
- Tonelli, D.; Luchetta, M.; Rossi, F.; Migliorino, P.; Zonta, D. Structural Health Monitoring Based on Acoustic Emissions: Validation on a Prestressed Concrete Bridge Tested to Failure. Sensors 2020, 20, 7272. [Google Scholar] [CrossRef] [PubMed]
- Tonelli, D.; Cappello, C.; Zonta, D. Performance-Based Design of Structural Health Monitoring Systems. In European Workshop on Structural Health Monitoring; Springer: Cham, Switzerland, 2021; pp. 238–247. [Google Scholar] [CrossRef]
- Xu, Y.-L.; Zhang, C.-D.; Zhan, S.; Spencer, B.F. Multi-level damage identification of a bridge structure: A combined numerical and experimental investigation. Eng. Struct. 2018, 156, 53–67. [Google Scholar] [CrossRef]
- Alampalli, S.; Frangopol, D.M.; Grimson, J.; Halling, M.W.; Kosnik, D.E.; Lantsoght, E.O.L.; Yang, D.; Zhou, Y.E. Bridge Load Testing: State-of-the-Practice. J. Bridg. Eng. 2021, 26, 03120002. [Google Scholar] [CrossRef]
- Tecchio, G.; da Porto, F.; Zampieri, P.; Modena, C.; Bettio, C. Static and Seismic Retrofit of Masonry Arch Bridges: Case Studies. In Proceedings of the 6th International Conference on Bridge Maintenance and Safety (IABMAS’12), Stresa, Lake Maggiore, Italy, 8–12 July 2012. [Google Scholar]
- De Santis, S.; DE Felice, G. Overview of Railway Masonry Bridges with a Safety Factor Estimate. Int. J. Arch. Herit. 2013, 8, 452–474. [Google Scholar] [CrossRef]
- Decreto-Legge Convertito Con Modificazioni Dalla, L. 16 Novembre 2018, n. 130 (in S.O. n. 55, Relativo Alla G.U. 19/11/2018, n. 269)–Decreto Genova. Gazzetta Ufficiale n.269 del 19 Novembre 2018. Available online: https://www.normattiva.it/uri-res/N2Ls?urn:nir:stato:decreto.legge:2018;109~art43bis (accessed on 19 December 2021).
- Transportation Officials. Subcommittee on Bridges the Manual for Bridge Evaluation, 3rd ed.; AASHTO: Washington, DC, USA, 2018; ISBN 978-1-56051-683-5. [Google Scholar]
- Committee BD-090, B.D. Australian Standard 5100.7-2004, Bridge Design, Part 7: Rating of Existing Bridges. 2004. Available online: https://www.saiglobal.com/PDFTemp/Previews/OSH/as/as5000/5100/5100.7-2004.pdf (accessed on 19 December 2021).
- Plos, M.; Shu, J.; Zandi, K.; Lundgren, K. A multi-level structural assessment strategy for reinforced concrete bridge deck slabs. Struct. Infrastruct. Eng. 2016, 13, 223–241. [Google Scholar] [CrossRef]
- Bagge, N.; Plos, M.; Popescu, C. A multi-level strategy for successively improved structural analysis of existing concrete bridges: Examination using a prestressed concrete bridge tested to failure. Struct. Infrastruct. Eng. 2018, 15, 27–53. [Google Scholar] [CrossRef] [Green Version]
- Matos, J.C.; Strauss, A.; Guimarães, H.; Zambon, I. An Overview of Performance Indicators for Arch Bridges in Europe. In Proceedings of the 8th International Conference on Arch Bridges (ARCH 2016), Wroclaw, Poland, 5–7 October 2016. [Google Scholar]
- Zonta, D.; Zandonini, R.; Bortot, F. A reliability-based bridge management concept. Struct. Infrastruct. Eng. 2007, 3, 215–235. [Google Scholar] [CrossRef]
- Mirzaei, Z. Overview of Existing Bridge Management Systems Report by the IABMAS Bridge Management Committee. In Proceedings of the 6th International Conference on Bridge Maintenance, Safety and Management (IABMAS 2012), Stresa, Italy, 8–12 July 2012. [Google Scholar]
- Hayward, A.C.G. Train Loads on Bridges 1825 to 2010. Int. J. Hist. Eng. Technol. 2011, 81, 159–191. [Google Scholar] [CrossRef]
- Moreira, V.N.; Fernandes, J.; Matos, J.C.; Oliveira, D.V. Reliability-based assessment of existing masonry arch railway bridges. Constr. Build. Mater. 2016, 115, 544–554. [Google Scholar] [CrossRef]
- Zampieri, P.; Zanini, M.A.; Modena, C. Simplified seismic assessment of multi-span masonry arch bridges. Bull. Earthq. Eng. 2015, 13, 2629–2646. [Google Scholar] [CrossRef]
- Augusthus-Nelson, L.; Swift, G. Experimental investigation of the residual behaviour of damaged masonry arch structures. Structures 2020, 27, 2500–2512. [Google Scholar] [CrossRef]
- Sarhosis, V.; de Santis, S.; de Felice, G. A Review of Experimental Investigations and Assessment Methods for Masonry Arch Bridges. Struct. Infrastruct. Eng. 2016, 12, 1439–1464. [Google Scholar]
- Yazdani, M. Three-dimensional Nonlinear Finite Element Analysis for Load-Carrying Capacity Prediction of a Railway Arch Bridge. Int. J. Civ. Eng. 2021, 19, 823–836. [Google Scholar] [CrossRef]
- Camacho, G.; Ortiz, M. Computational modelling of impact damage in brittle materials. Int. J. Solids Struct. 1996, 33, 2899–2938. [Google Scholar] [CrossRef]
- Possidente, L.; Tondini, N.; Battini, J.-M. Torsional and flexural-torsional buckling of compressed steel members in fire. J. Constr. Steel Res. 2020, 171, 106130. [Google Scholar] [CrossRef]
- Possidente, L.; Tondini, N.; Battini, J.-M. Branch-switching procedure for post-buckling analysis of thin-walled steel members at elevated temperature. Thin-Walled Struct. 2018, 136, 90–98. [Google Scholar] [CrossRef]
- Meghlat, E.-M.; Oudjene, M.; Ait-Aider, H.; Batoz, J.-L. A new approach to model nailed and screwed timber joints using the finite element method. Constr. Build. Mater. 2013, 41, 263–269. [Google Scholar] [CrossRef]
- Rondeaux, J.-F.; Deschuyteneer, A.; Zastavni, D. Assessing geometrically the structural safety of masonry arches. In Building Knowledge, Constructing Histories; CRC Press: Boca Raton, FL, USA, 2018; pp. 1129–1136. ISBN 9780429446719. [Google Scholar]
- Méry, E. Sur l’équilibre Des Voûtes En Berceau. Ann. Des Ponts Et Chaussées 1840, 19, 50–70. [Google Scholar]
- Brencich, A.; Morbiducci, R. Masonry Arches: Historical Rules and Modern Mechanics. Int. J. Arch. Herit. 2007, 1, 165–189. [Google Scholar] [CrossRef]
- Heyman, J. The Masonry Arch; Ellis Horwood Ltd.: Chichester, UK, 1982. [Google Scholar]
- Di Carlo, F.; Coccia, S. Collapse state of elliptical masonry arches after finite displacements of the supports. Eng. Fail. Anal. 2020, 114, 104593. [Google Scholar] [CrossRef]
- Melbourne, C.; Wang, J.; Tomor, A.K. A new masonry arch bridge assessment strategy (SMART). Proc. Inst. Civ. Eng. Bridg. Eng. 2007, 160, 81–87. [Google Scholar] [CrossRef] [Green Version]
- Stockdale, G.; Tiberti, S.; Camilletti, D.; Papa, G.S.; Habieb, A.B.; Bertolesi, E.; Milani, G.; Casolo, S. Kinematic collapse load calculator: Circular arches. SoftwareX 2018, 7, 174–179. [Google Scholar] [CrossRef]
- Cavalagli, N.; Gusella, V.; Severini, L. Lateral loads carrying capacity and minimum thickness of circular and pointed masonry arches. Int. J. Mech. Sci. 2016, 115–116, 645–656. [Google Scholar] [CrossRef]
- Řeřicha, P. Load rating assessment of masonry arch bridges. Trans. Transp. Sci. 2008, 1, 117–124. [Google Scholar] [CrossRef] [Green Version]
- Oliveira, D.V.; Lourenço, P.B.; Lemos, C. Geometric issues and ultimate load capacity of masonry arch bridges from the northwest Iberian Peninsula. Eng. Struct. 2010, 32, 3955–3965. [Google Scholar] [CrossRef] [Green Version]
- Lucchesi, M.; Padovani, C.; Pasquinelli, G.; Zani, N. On the Collapse of Masonry Arches. Meccanica 1997, 32, 327–346. [Google Scholar] [CrossRef]
- Dutta, S.; Ghosh, S. Form-finding of frame-supported tensile membrane structures using stochastic optimisation. Structures 2021, 32, 2211–2221. [Google Scholar] [CrossRef]
- Song, Y.; Zhang, M.; Øiseth, O.; Rønnquist, A. Wind deflection analysis of railway catenary under crosswind based on nonlinear finite element model and wind tunnel test. Mech. Mach. Theory 2021, 168, 104608. [Google Scholar] [CrossRef]
- Comite Europeen de Normalisation, EN 15528:2015 Railway Applications-Line Categories for Managing the Interface between Load Limits of Vehicles and Infrastructure. Brussels. 2015. Available online: https://infostore.saiglobal.com/preview/is/en/2015/i.s.en15528-2015.pdf?sku=1833997 (accessed on 19 December 2021).
- EC Commission Decision of 28 July 2006 Concerning the Technical Specification of Interoperability Relating to the Subsystem Rolling Stock—Freight Wagons of the Trans-European Conventional Rail System (Notified under Document Number C 3345). Off. J. Eur. Union. 2006. Available online: https://www.eumonitor.eu/9353000/1/j4nvk6yhcbpeywk_j9vvik7m1c3gyxp/vi8rm2zngaxd (accessed on 19 December 2021).
- Sinopoli, A.; Corradi, M.; Foce, F. Lower and Upper Bound Theorems for Masonry Arches as Rigid Systems with Unilateral Contacts. In Arch Bridges; CRC Press: Boca Raton, FL, USA, 1998; pp. 99–108. ISBN 9781003078494. [Google Scholar]
- Weigel, T.A.; Ott, K.J.; Hagerty, D.J. Load Redistribution in Frame with Settling Footings. J. Comput. Civ. Eng. 1989, 3, 75–92. [Google Scholar] [CrossRef]
- Aboustait, B.L. Static versus Kinematic Optimal, Load Analysis. In Proceedings of the Seventh Arab Structural Engineering Conference, Kuwait, 24–26 November 1997; Available online: https://www.researchgate.net/profile/Baher-Aboustait/publication/320282855_Static_Versus_Kinamatic_Optimal_Load_Analysis/links/59db61140f7e9b2f587fe8ee/Static-Versus-Kinamatic-Optimal-Load-Analysis.pdf (accessed on 19 December 2021).
- LimitState: Ring Manual; Version 3.2.c.; Limitstate Ltd.: Sheffield, UK, 2020.
- Ferrovie dello Stato. Circolare L.C.6/60107/2711 Del 30.6.1925 Nuovi Sovraccarichi Da Adottarsi per Il Calcolo Dei Ponti in Ferro; Ferrovie dello Stato: Roma, Italy, 1925. [Google Scholar]
- Ferrovie dello Stato. Norme per Il Calcolo Dei Ponti in Muratura; Ferrovie dello Stato: Roma, Italy, 1924. [Google Scholar]
- Ferrovie dello Stato. Circolare L.C.6/2715 Del 15.7.1945 Nuovi Sovraccarichi per Il Calcolo Dei Ponti Metallici; Ferrovie dello Stato: Roma, Italy, 1945. [Google Scholar]
Publisher’s Note: MDPI stays neutral with regard to jurisdictional claims in published maps and institutional affiliations. |
© 2022 by the authors. Licensee MDPI, Basel, Switzerland. This article is an open access article distributed under the terms and conditions of the Creative Commons Attribution (CC BY) license (https://creativecommons.org/licenses/by/4.0/).