
Measurements and Analysis of the Physical Properties of Cereal Seeds Depending on Their Moisture Content to Improve the Accuracy of DEM Simulation


Abstract
:1. Introduction
2. Materials and Methods
3. Results and Discussion
4. Conclusions
Author Contributions
Funding
Institutional Review Board Statement
Informed Consent Statement
Data Availability Statement
Conflicts of Interest
References
- GUS, Central Statistics Poland. 2020. Available online: https://stat.gov.pl/files/gfx/portalinformacyjny/pl/defaultaktualnosci/5515/6/14/1/rocznik_statystyczny_rolnictwa_2020 (accessed on 25 August 2021).
- GUS, Central Statistics Poland. 2018. Available online: https://stat.gov.pl/obszary-tematyczne/roczniki-statystyczne/roczniki-statystyczne/rocznik-statystyczny-rolnictwa-2018,6,12.html (accessed on 25 August 2021).
- Masyitah, M.; Augussabti, A.; Kasimin, S. Tingkat Adopsi Petani Terhadap Benih Unggul Padi Sawah Di Kabupaten Aceh Besar Provinsi Aceh. J. AGRIFO 2019, 4, 1–6. [Google Scholar] [CrossRef]
- Stejskal, V.; Hubert, J.; Kučerová, Z.; Munzbergová, Z.; Lukáš, J.; Žd’árková, E. The influence of the type of storage on pest infestation of stored grain in the Czech Republic. Plant Soil Environ. 2003, 49, 55–62. [Google Scholar] [CrossRef] [Green Version]
- Perez-Garcia, O.A.; Carreira, X.C.; Carral, E.; Fernandez, M.E.; Mariño, R.A. Evaluation of traditional grain store buildings (hórreos) in Galicia (NW Spain): Analysis of outdoor/indoor temperature and humidity relationships. Span. J. Agric. Res. 2010, 8, 925–935. [Google Scholar] [CrossRef]
- Tomkiewicz, D. Construction and operation of corn seed humidity sensor using near-infrared radiation. Agric. Eng. 2009, 6, 309–314. (In Polish) [Google Scholar]
- Horoszkiewicz-Janka, J.; Korbas, M.; Mrówczyński, M. Metodyka integrowanej ochrony pszenicy ozimej i jarej dla producentów. In Methodology of Integrated Protection of Winter Wheat and Spring for Producers; Wydawnictwo IOR: Poznań, Poland, 2013. (In Polish) [Google Scholar]
- Borkowska, B.; Banach, D. Ocena wybranych cech fizykochemicznych pszenicy i żyta z północnego i południowego regionu Polski [Assessment of selected physicochemical properties of wheat and rye from the northern and southern region of Poland]. Rocz. Nauk. Stowarzyszenia Ekon. Rol. I Agrobiz 2018, 20, 18–21. (In Polish) [Google Scholar] [CrossRef]
- Rudziński, R. Zasady przechowywania i magazynowania towarów pochodzenia rolniczego. [Rules for storage and warehousing of goods of agricultural origin] Zeszyty Naukowe Uniwersytetu Przyrodniczo-Humanistycznego w Siedlcach. Adm. I Zarządzanie T. 2011, 15, 113–126. (In Polish) [Google Scholar]
- Horabik, J. Charakterystyka właściwości fizycznych roślinnych materiałów sypkich istotnych w procesach składowania. Acta Agrophys. 2001, 54, 5–121. [Google Scholar]
- Kaliniewicz, Z.; Anders, A.; Markowski, P.; Tylek, P.; Owoc, D. Analysis of the physical properties of spindle seeds for seed sorting operations. Sci. Rep. 2021, 11, 13625. [Google Scholar]
- Andrejko, D. Wpływ wilgotności i wymiarów cząstek na gęstość sypkich surowców roślinnych. Inż. Rol. 2015, 11, 9–17. [Google Scholar]
- Rusinek, R.; Horabik, J. Selected mechanical parameters of rapeseeds. Agric. Eng. 2006, 6, 213–221. (In Polish). Available online: http://yadda.icm.edu.pl/yadda/element/bwmeta1.element.baztech-article-BAR0-0053-0024 (accessed on 30 May 2021).
- Sahin, S.; Sumnu, S.G. Physical Properties of Foods; Springer Science Business Media, LLC. New York: New York, NY, USA, 2006. [Google Scholar]
- Altuntas, E.; Demirtola, H. Effect of moisture content on physical properties of some grain legume seeds. N. Z. J. Crop Hort. 2007, 35, 423–433. [Google Scholar] [CrossRef]
- Izli, N. Effect of moisture on the physical properties of three varieties of kenaf seeds. J. Food Sci. Technol. 2015, 52, 3254–3263. [Google Scholar] [CrossRef] [PubMed] [Green Version]
- Karimi, M.; Kheiralipour, K.; Tabatabaeefar, A.; Khoubakht, G.M.; Naderi, M.; Heidarbeigi, K. Effect of moisture content on physical properties of wheat. Pak. J. Nutr. 2009, 8, 90–95. [Google Scholar] [CrossRef] [Green Version]
- Kalkan, F.; Kara, M. Handling, frictional and technological properties of wheat as affected by moisture content and cultivar. Powder Technol. 2011, 213, 116–122. [Google Scholar] [CrossRef]
- Shelake, P.S.; Yadav, S.; Jadhav, M.L.; Dabhi, M.N. Effect of moisture content on physical and mechanical properties of turmeric (Curcumalonga) rhizome. Curr. J. Appl. Sci. Technol. 2018, 30, 1–7. [Google Scholar] [CrossRef]
- Jadhav, K.L.; Mohnot, P.; Shelake, P.S. Investigation of engineering properties of vegetable seeds required for the design of pneumaticseeder. Int. J. Curr. Microbiol. Appl. Sci. 2017, 6, 1163–1171. [Google Scholar] [CrossRef]
- Salawu, A.T.; Isiaka, M.; Attanda, M.L. Design related physical properties of snake tomato seeds. Acad. Res. Int. 2014, 5, 1–10. [Google Scholar]
- Rajaiah, P.; Mani, I.; Kumar, A.; Lande, S.D.; Singh, A.K. Role of physical and engineering properties of rice (Oryzasativa) cultivars for designing of precision planter. Indian J. Agric. Sci. 2015, 85, 1602–1608. [Google Scholar]
- Rawa, T.; Lipiński, A.; Łazarczyk, A. Eksperymentalne określenie kierunku ustawienia nasion pszenicy w gnieździe kołeczkowego zespołu wysiewającego. Probl. Inż. Rol. 2000, 4, 29–36. (In Polish) [Google Scholar]
- Chodurski, M.; Dębski, H.; Samborski, S.; Teter, A. Numerical strength analysis of the load-bearing frame of a palletizing robot’s universal head. Eksploat.–Maint. Reliab. 2015, 17, 374–378. [Google Scholar] [CrossRef]
- Jachimowicz, J.; Wawrzyniak, A. Zastosowanie MES w zagadnieniach kontaktu elementów maszyn. In Application of FEM in the Issues of Contact of Machine Elements; Prace Instytutu Podstaw Budowy Maszyn/Politechnika Warszawska: Warszawa, Poland, 1999; pp. 69–108. (In Polish) [Google Scholar]
- Gierz, Ł.; Warguła, Ł.; Kukla, M.; Koszela, K.; Zwiachel, T.S. Computer Aided Modeling of Wood Chips Transport by Means of a Belt Conveyor with Use of Discrete Element Method. Appl. Sci. 2020, 10, 9091. [Google Scholar] [CrossRef]
- Bautista, R.C.; Siebenmorgen, T.J. Evaluation of laboratory mills for milling small samples of rice. Appl. Eng. Agric. 2002, 18, 577–583. [Google Scholar] [CrossRef]
- Petingco, M.C.; Casada, M.E.; Maghirang, R.G.; Fasina, O.O.; Chen, Z.; Ambrose, R.P.K. Influence of Particle Shape and Contact Parameters on DEM-Simulated Bulk Density of Wheat. Trans. ASABE 2020, 63, 1657–1672. [Google Scholar] [CrossRef]
- Fathollahzadehl, H.; Mobli, H.; Jafari, A.; Rafiee, S.; Mohammadi, A. Some physical properties of tabarzeh apricot kernel. Pak. J. Nutr. 2008, 7, 645–651. [Google Scholar] [CrossRef]
- Mohsenin, N.N. Physical properties of plant and animal materials. In Characteristics and Mechanical Properties; Gordon and Breach Science Publishers: New York, NY, USA, 1986. [Google Scholar]
- Tylek, P. Measuring selected properties of seeds by computer image processing. Zesz. Probl. Postepow Nauk. Rol. 2009, 423, 335–341. (In Polish) [Google Scholar]
- Grochowicz, J. Maszyny do czyszczenia i sortowania nasion [Machines for cleaning and sorting seeds]. In Wydawnictwo AR Lublin; Wydawnictwo Akademii Rolniczej: Bydgoszcz, Poland, 1994; ISBN 83-901612-9-X. (In Polish) [Google Scholar]
- Kusińska, E. Wpływ przechowywania na właściwości fizyczne ziarna owsa. Acta Agrophys. 2001, 58, 105–114. [Google Scholar]
- Vibrance-Gold–Zaprawy Nasienne. Available online: https://www.syngenta.pl/srodki-ochrony-roslin/zaprawy-nasienne/vibrance-gold-access (accessed on 16 June 2021).
- Zewdu, A.D.; Solomon, W.K. Moisture-dependent physical properties of tef seed. Biosyst. Eng. 2007, 96, 57–63. [Google Scholar] [CrossRef]
- Dursun, E.; Dursun, I. Some physical properties of caper seed. Biosyst. Eng. 2005, 92, 237–245. [Google Scholar] [CrossRef]
- Balasubramanian, D. Physical properties of raw cashew nut. J. Agric. Eng. Res. 2001, 78, 291–297. [Google Scholar] [CrossRef]
- Kaliniewicz, Z.; Markowski, P.; Anders, A.; Jadwisieńczak, B.; Rawa, T.; Szczechowicz, D. Basic physical properties of Norway spruce (Piceaabies (L.) Karst.) seeds. Tech. Sci. 2016, 19, 103–115. [Google Scholar]
- Kaliniewicz, Z.; Tylek, P.; Markowski, P.; Anders, A.; Rawa, T.; Jóźwiak, K.; Fura, S. Correlations between the germination capacity and selected physical properties of Scots pine (Pinus sylvestris, L.) seeds. Baltic Forestry 2013, 19, 201–211. [Google Scholar]
- Gastón, A.L.; Abalone, R.M.; Giner, S.A. Wheat drying kinetics. Diffusivities for sphere and ellipsoid by finite elements. J. Food Eng. 2002, 52, 313–322. [Google Scholar] [CrossRef]
- Rabiej, M. Statystyka z Programem Statistica. In Statisctics in Statistica Software; Helion: Gliwice, Poland, 2012; ISBN 9788324641109. [Google Scholar]
- Stanisz, A. Accessible Course in Statistics Based on the STATISTICA PL Software on Examples from Medicine. In Tome 1. Basic Statistics; StatSoftPolska: Kraków, Poland, 2007. (In Polish) [Google Scholar]
- Kram, B.B. Badania współczynnika tarcia zewnętrznego ziarna zbóż w funkcji wilgotności [Research on the coefficient of external friction of corn grain in humidity function]. Inż. Rol. 2006, 10, 175–182. Available online: http://yadda.icm.edu.pl/baztech/element/bwmeta1.element.baztech-article-BAR0-0051-0095 (accessed on 17 December 2021).
- Kaliniewicz, Z.; Żuk, Z.; Krzysiak, Z. Influence of Steel Plate Roughness on the Frictional Properties of Cereal Kernels. Sustainability 2018, 10, 1003. [Google Scholar] [CrossRef] [Green Version]
- Hebda, T.; Micek, P. Zależności Pomiędzy Właściwościami Geometrycznymi Ziarna Zbóż [Dependences between Geometrical Features of Cereal Grain]. Inż. Rol. 2005, 6, 233–241. (In Polish). Available online: https://yadda.icm.edu.pl/baztech/element/bwmeta1.element.baztech-33138867-224a-40d6-9ab0-09fd574e8be3 (accessed on 17 December 2021).
- Horabik, J.; Molenda, M. Właściwości Fizyczne Sypkich Surowców Spożywczych. In Physical Properties of Granular Food Materials; Acta Agrophysica: Lublin, Poland, 2002; pp. 1–96. (In Polish) [Google Scholar]
- Boac, J.M.; Casada, M.E.; Maghirang, R.G.; Harner, J.P., III. Material and interaction properties of selected grains and oilseeds for modeling discrete particles. Trans. ASABE 2010, 53, 1201–1216. [Google Scholar] [CrossRef] [Green Version]
- Fang, C.; Campbell, G.M. On predicting roller milling performance V: Effect of moisture content on the particle size distribution from first break milling of wheat. J. Cereal Sci. 2003, 37, 31–41. [Google Scholar] [CrossRef] [Green Version]
- Dziki, D.; Różyło, R.; Laskowski, J.; Grundas, S. Evaluation of wheat grain physical properties carried out using an analyser of single seeds. Agric. Eng. 2011, 126, 39–46. (In Polish) [Google Scholar]
- Kaliniewicz, Z. Analysis of frictional properties of cereal seeds. Afr. J. Agric. Res. 2013, 45, 5611–5621. [Google Scholar]
- Markowski, M.; Żuk-Gołaszewska, K.; Kwiatkowski, D. Influence of variety on selected physical and mechanical properties of wheat. Ind. Crops Prod. 2013, 47, 113–117. [Google Scholar] [CrossRef]
- Sologubik, C.A.; Campañone, L.A.; Pagano, A.M.; Gely, M.C. Effect of moisture content on some physical properties of barley. Ind. Crops Prod. 2013, 43, 762–767. [Google Scholar] [CrossRef]
- Hebda, T.; Micek, P. Cechy geometryczne ziarna wybranych odmian zbóż [Geometric features of grain for selected corn varieties]. Inż. Rol. 2007, 11, 187–193. [Google Scholar]
- Kaliniewicz, Z.; Biedulska, J.; Jadwisieńczak, B. Assessment of Cereal Seed Shape with the Use of Sphericity Factors; Technical Sciences/University of Warmia and Mazury in Olsztyn: Olsztyn, Poland, 2015. [Google Scholar]
- Kolankowska, E.; Choszcz, D.J.; Markowski, P. An Analysis of Selected Physical Properties of Ancient Wheat Species. Sustainability 2017, 9, 1970. [Google Scholar] [CrossRef] [Green Version]
- Zhang, S.; Tekeste, M.Z.; Li, Y.; Gaul, A.; Zhu, D.; Liao, J. Scaled-up rice grain modelling for DEM calibration and the validation of hopper flow. Biosyst. Eng. 2020, 194, 196–212. [Google Scholar] [CrossRef]
- Medina, D.A.; Jerves, A.X. A geometry-based algorithm for cloning real grains 2.0. Granul. Matter 2019, 21, 2. [Google Scholar] [CrossRef] [Green Version]


| Seeds | Moisture (%) | Length (mm) | Width (mm) | Thickness (mm) | Weight (mg) | ||||
|---|---|---|---|---|---|---|---|---|---|
| X | SD | X | SD | X | SD | X | SD | ||
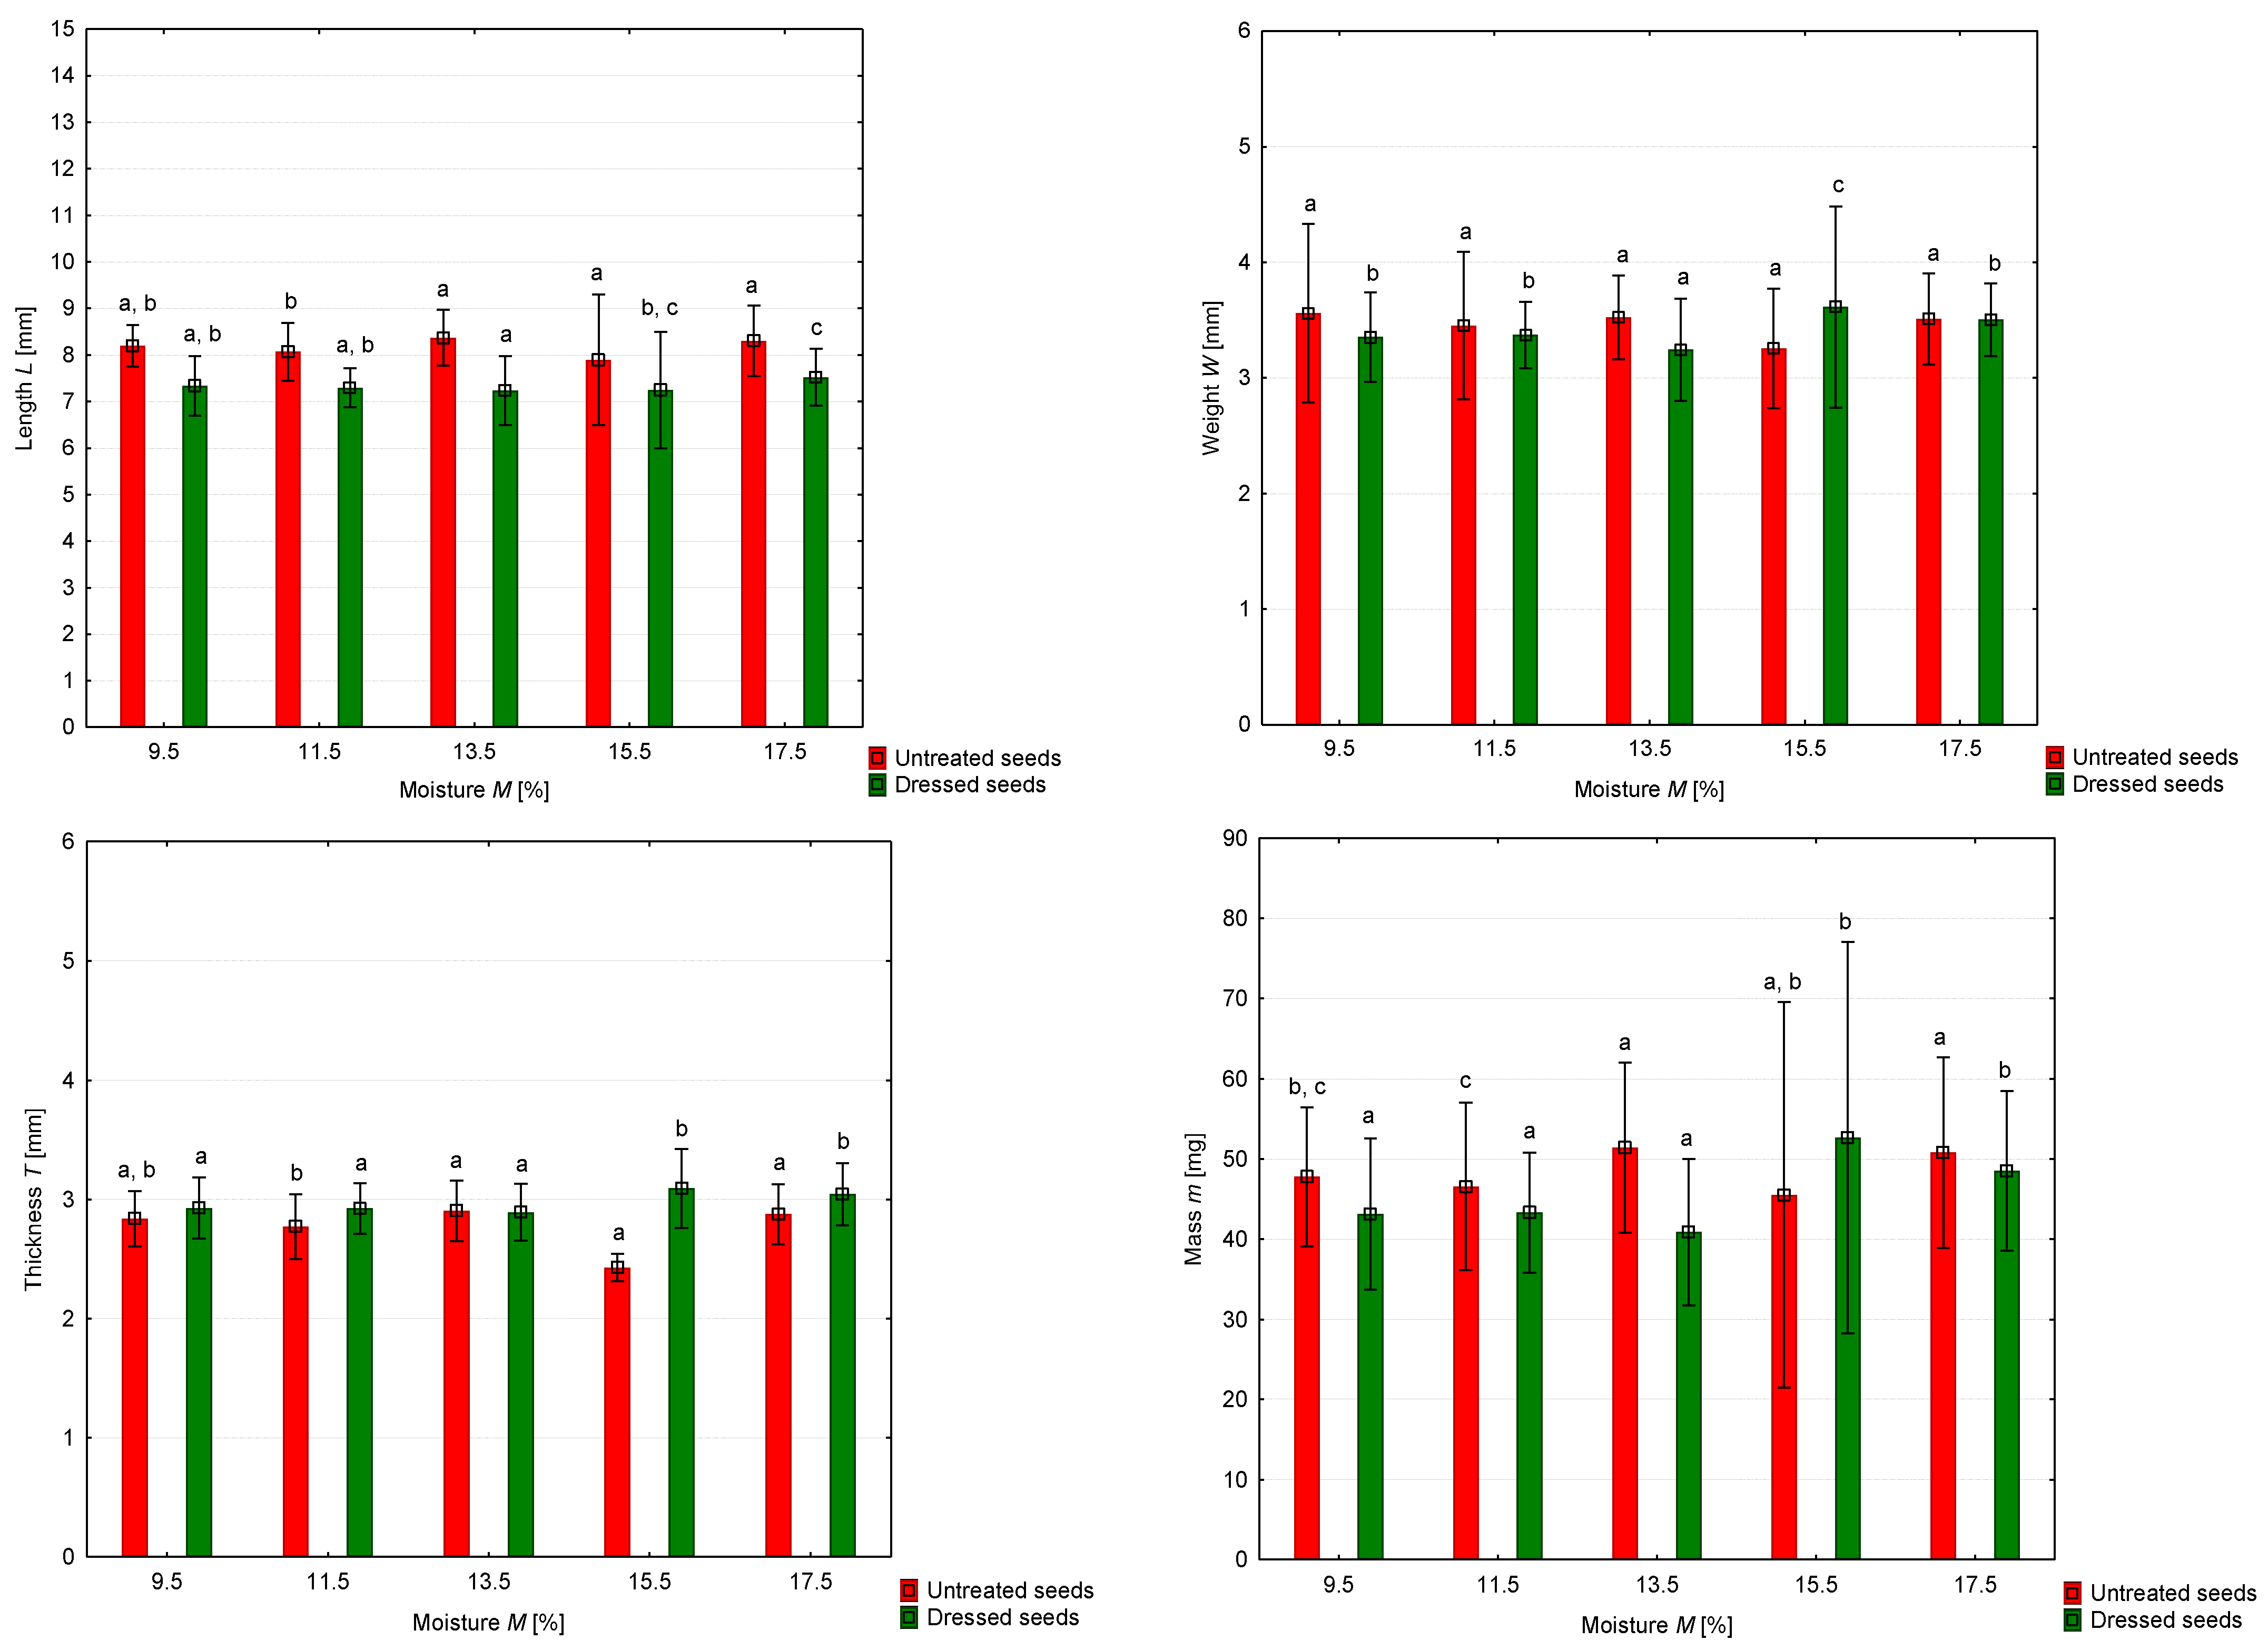
| Untreated | 9.5 | 8.20 a,b | 0.447 | 3.56 a | 0.771 | 2.84 a,b | 0.232 | 47.80 b,c | 8.698 |
| 11.5 | 8.07 b | 0.622 | 3.45 a | 0.638 | 2.77 b | 0.272 | 46.59 c | 10.458 | |
| 13.5 | 8.37 a | 0.602 | 3.52 a | 0.363 | 2.91 a | 0.255 | 51.43 a | 10.643 | |
| 15.5 | 8.30 a | 0.646 | 3.49 a | 0.434 | 2.87 a | 0.254 | 49.89 a,b | 11.338 | |
| 17.5 | 8.31 a | 0.874 | 3.52 a | 0.356 | 2.88 a | 0.258 | 51.63 a | 12.648 | |
| Dressed | 9.5 | 7.33 a,b | 0.640 | 3.35 b | 0.335 | 2.93 a | 0.255 | 43.16 a | 9.428 |
| 11.5 | 7.30 a,b | 0.418 | 3.37 b | 0.288 | 2.93 a | 0.211 | 43.32 a | 7.478 | |
| 13.5 | 7.23 a | 0.744 | 3.24 a | 0.442 | 2.89 a | 0.238 | 40.88 a | 9.166 | |
| 15.5 | 7.46 b,c | 0.576 | 3.48 c | 0.334 | 3.03 b | 0.263 | 48.10 b | 10.561 | |
| 17.5 | 7.58 c | 0.657 | 3.53 c | 0.303 | 3.06 b | 0.260 | 49.07 b | 9.619 | |
| Seeds | Moisture (%) | Length (mm) | Width (mm) | Thickness (mm) | Weight (mg) | ||||
|---|---|---|---|---|---|---|---|---|---|
| X | SD | X | SD | X | SD | X | SD | ||
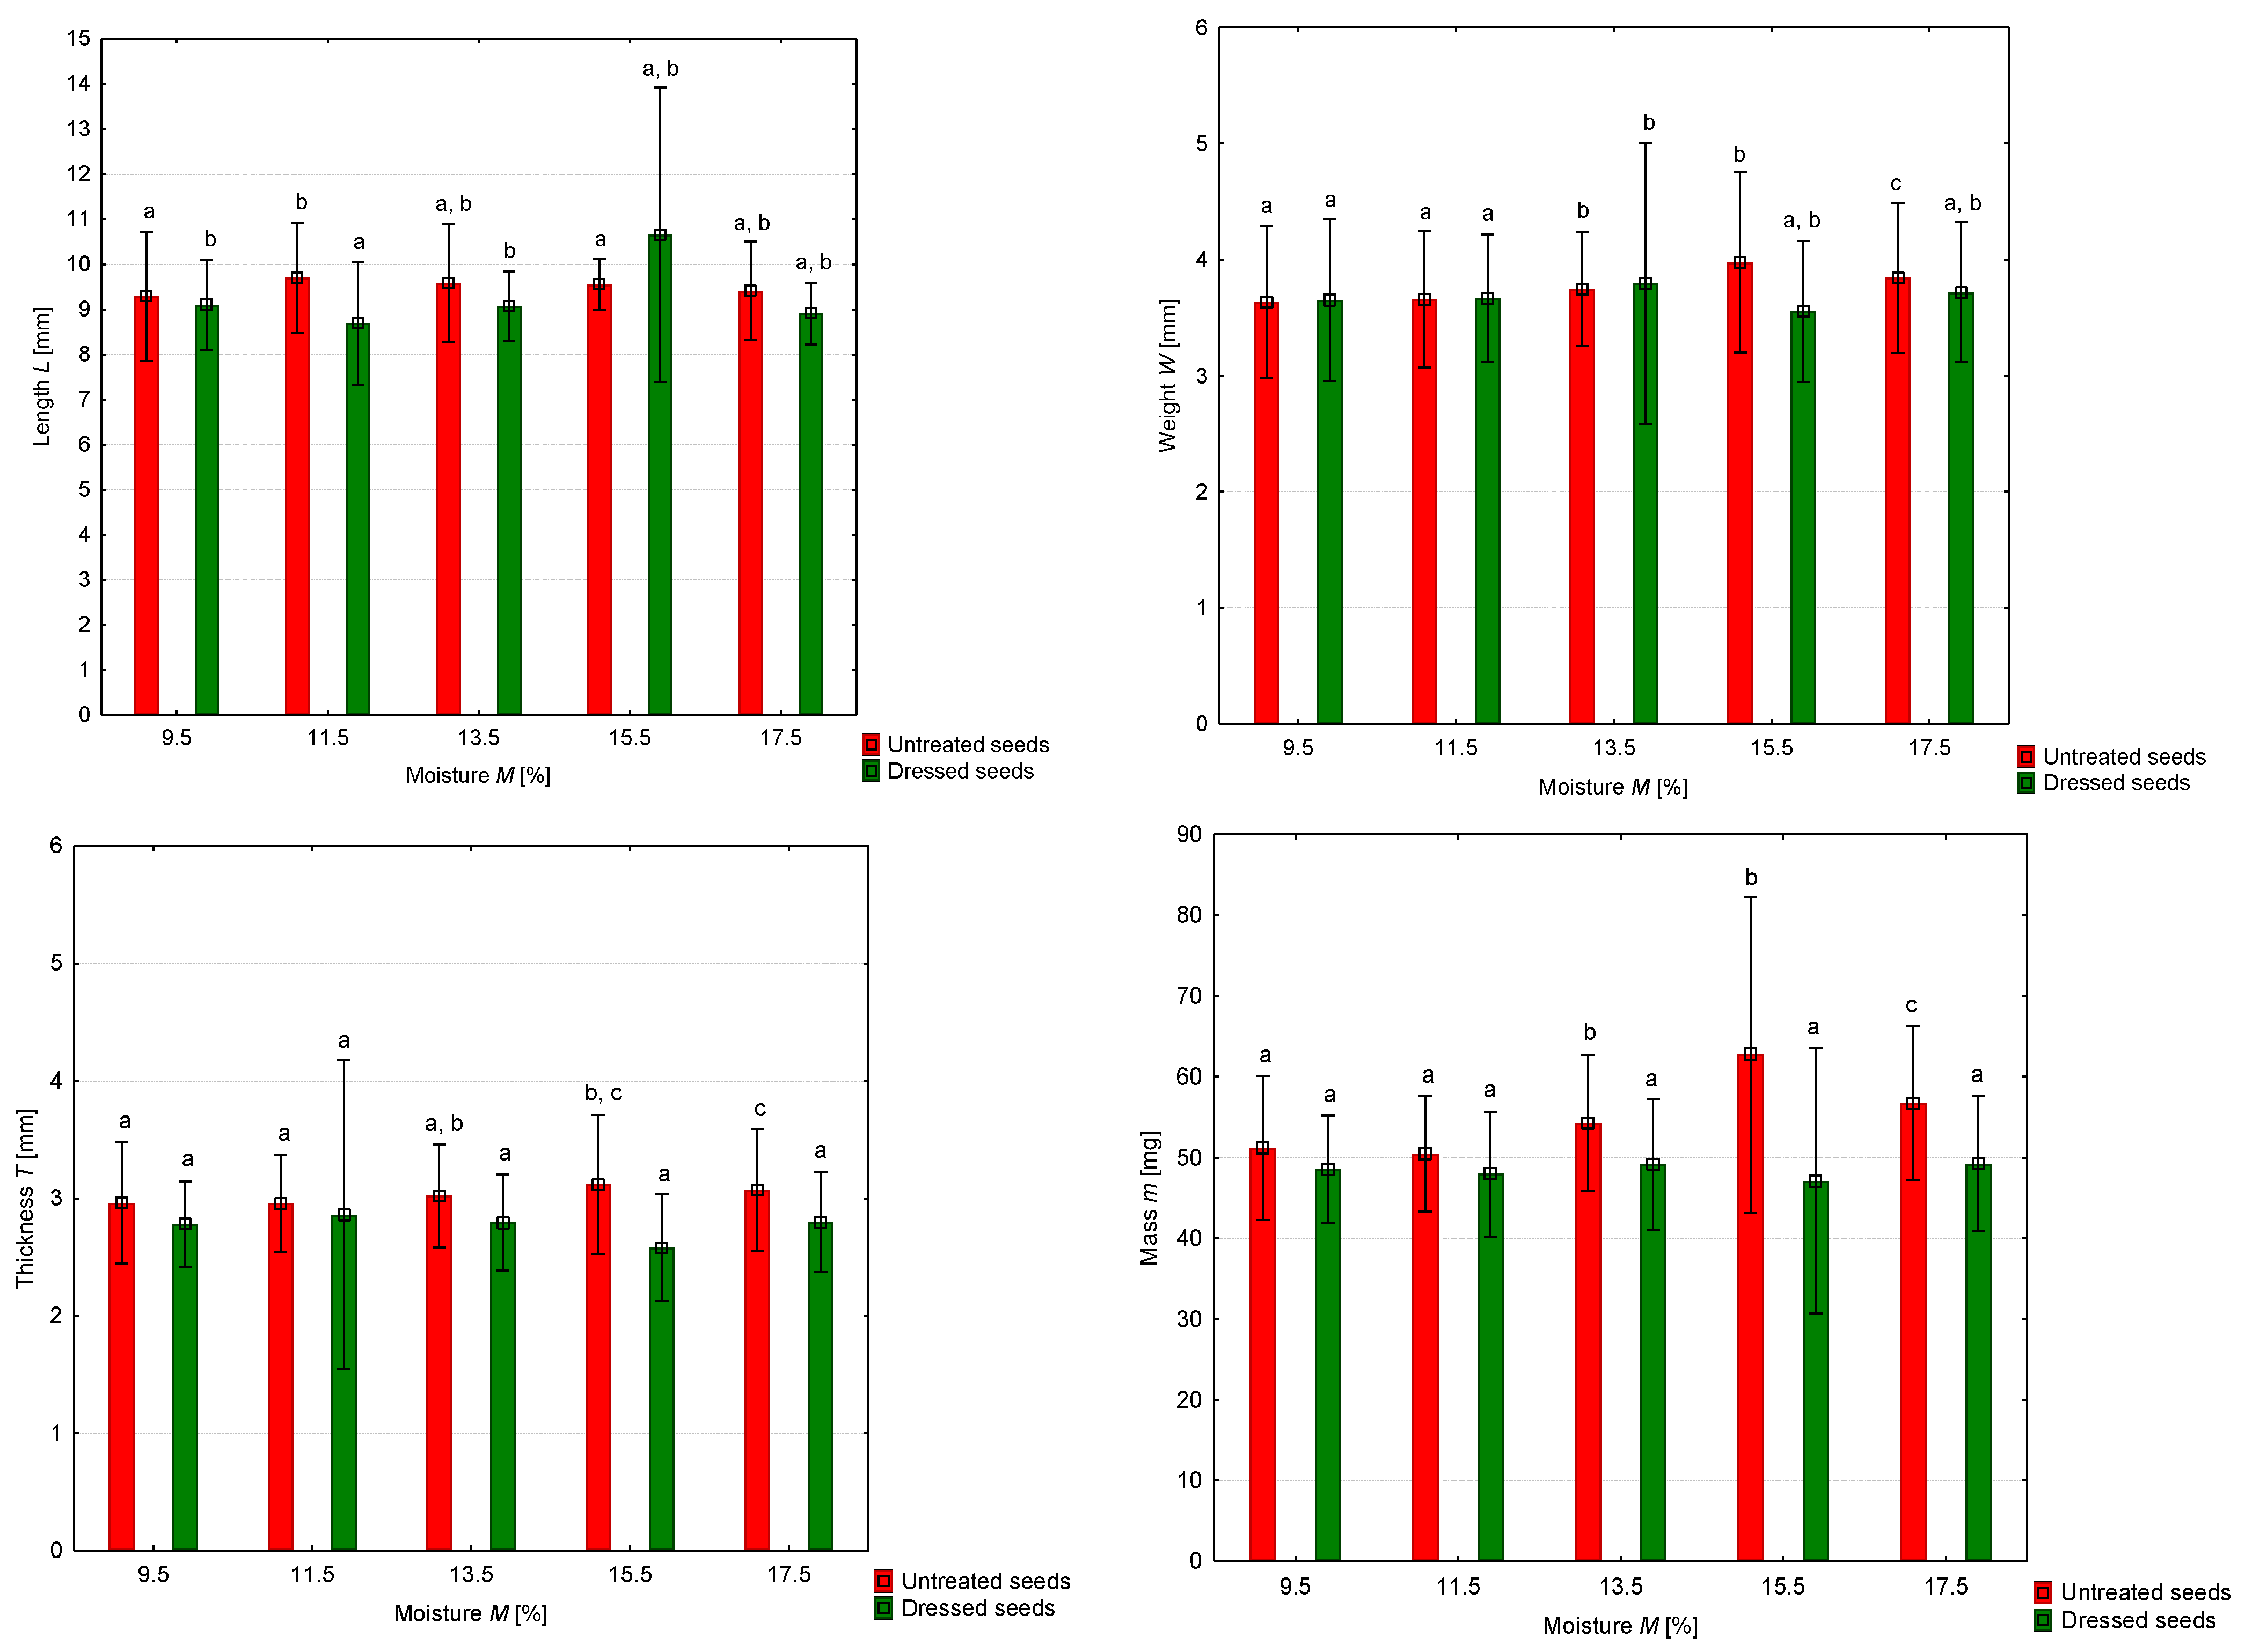
| Untreated | 9.5 | 9.29 a | 1.435 | 3.63 a | 0.327 | 2.96 a | 0.257 | 51.19 a | 8.904 |
| 11.5 | 9.71 b | 1.215 | 3.66 a | 0.294 | 2.96 a | 0.208 | 50.47 a | 7.151 | |
| 13.5 | 9.58 a,b | 1.317 | 3.74 b | 0.245 | 3.02 a,b | 0.220 | 54.27 b | 8.423 | |
| 15.5 | 9.28 a | 0.976 | 3.77 b | 0.272 | 3.04 b,c | 0.262 | 55.10 b | 8.886 | |
| 17.5 | 9.54 a,b | 1.192 | 3.92 c | 0.353 | 3.10 c | 0.253 | 58.50 c | 9.963 | |
| Dressed | 9.5 | 9.10 b | 0.991 | 3.65 a | 0.349 | 2.78 a | 0.181 | 48.53 a | 6.687 |
| 11.5 | 8.69 a | 1.368 | 3.66 a | 0.275 | 2.86 a | 0.657 | 47.99 a | 7.758 | |
| 13.5 | 9.07 b | 0.770 | 3.80 b | 0.606 | 2.79 a | 0.204 | 49.15 a | 8.074 | |
| 15.5 | 8.89 a,b | 0.815 | 3.71 a,b | 0.324 | 2.81 a | 0.223 | 49.00 a | 8.246 | |
| 17.5 | 8.96 a,b | 0.665 | 3.72 a,b | 0.279 | 2.79 a | 0.204 | 49.44 a | 8.683 | |
| Seeds | Moisture (%) | Length (mm) | Width (mm) | Thickness (mm) | Weight (mg) | ||||
|---|---|---|---|---|---|---|---|---|---|
| X | SD | X | SD | X | SD | X | SD | ||
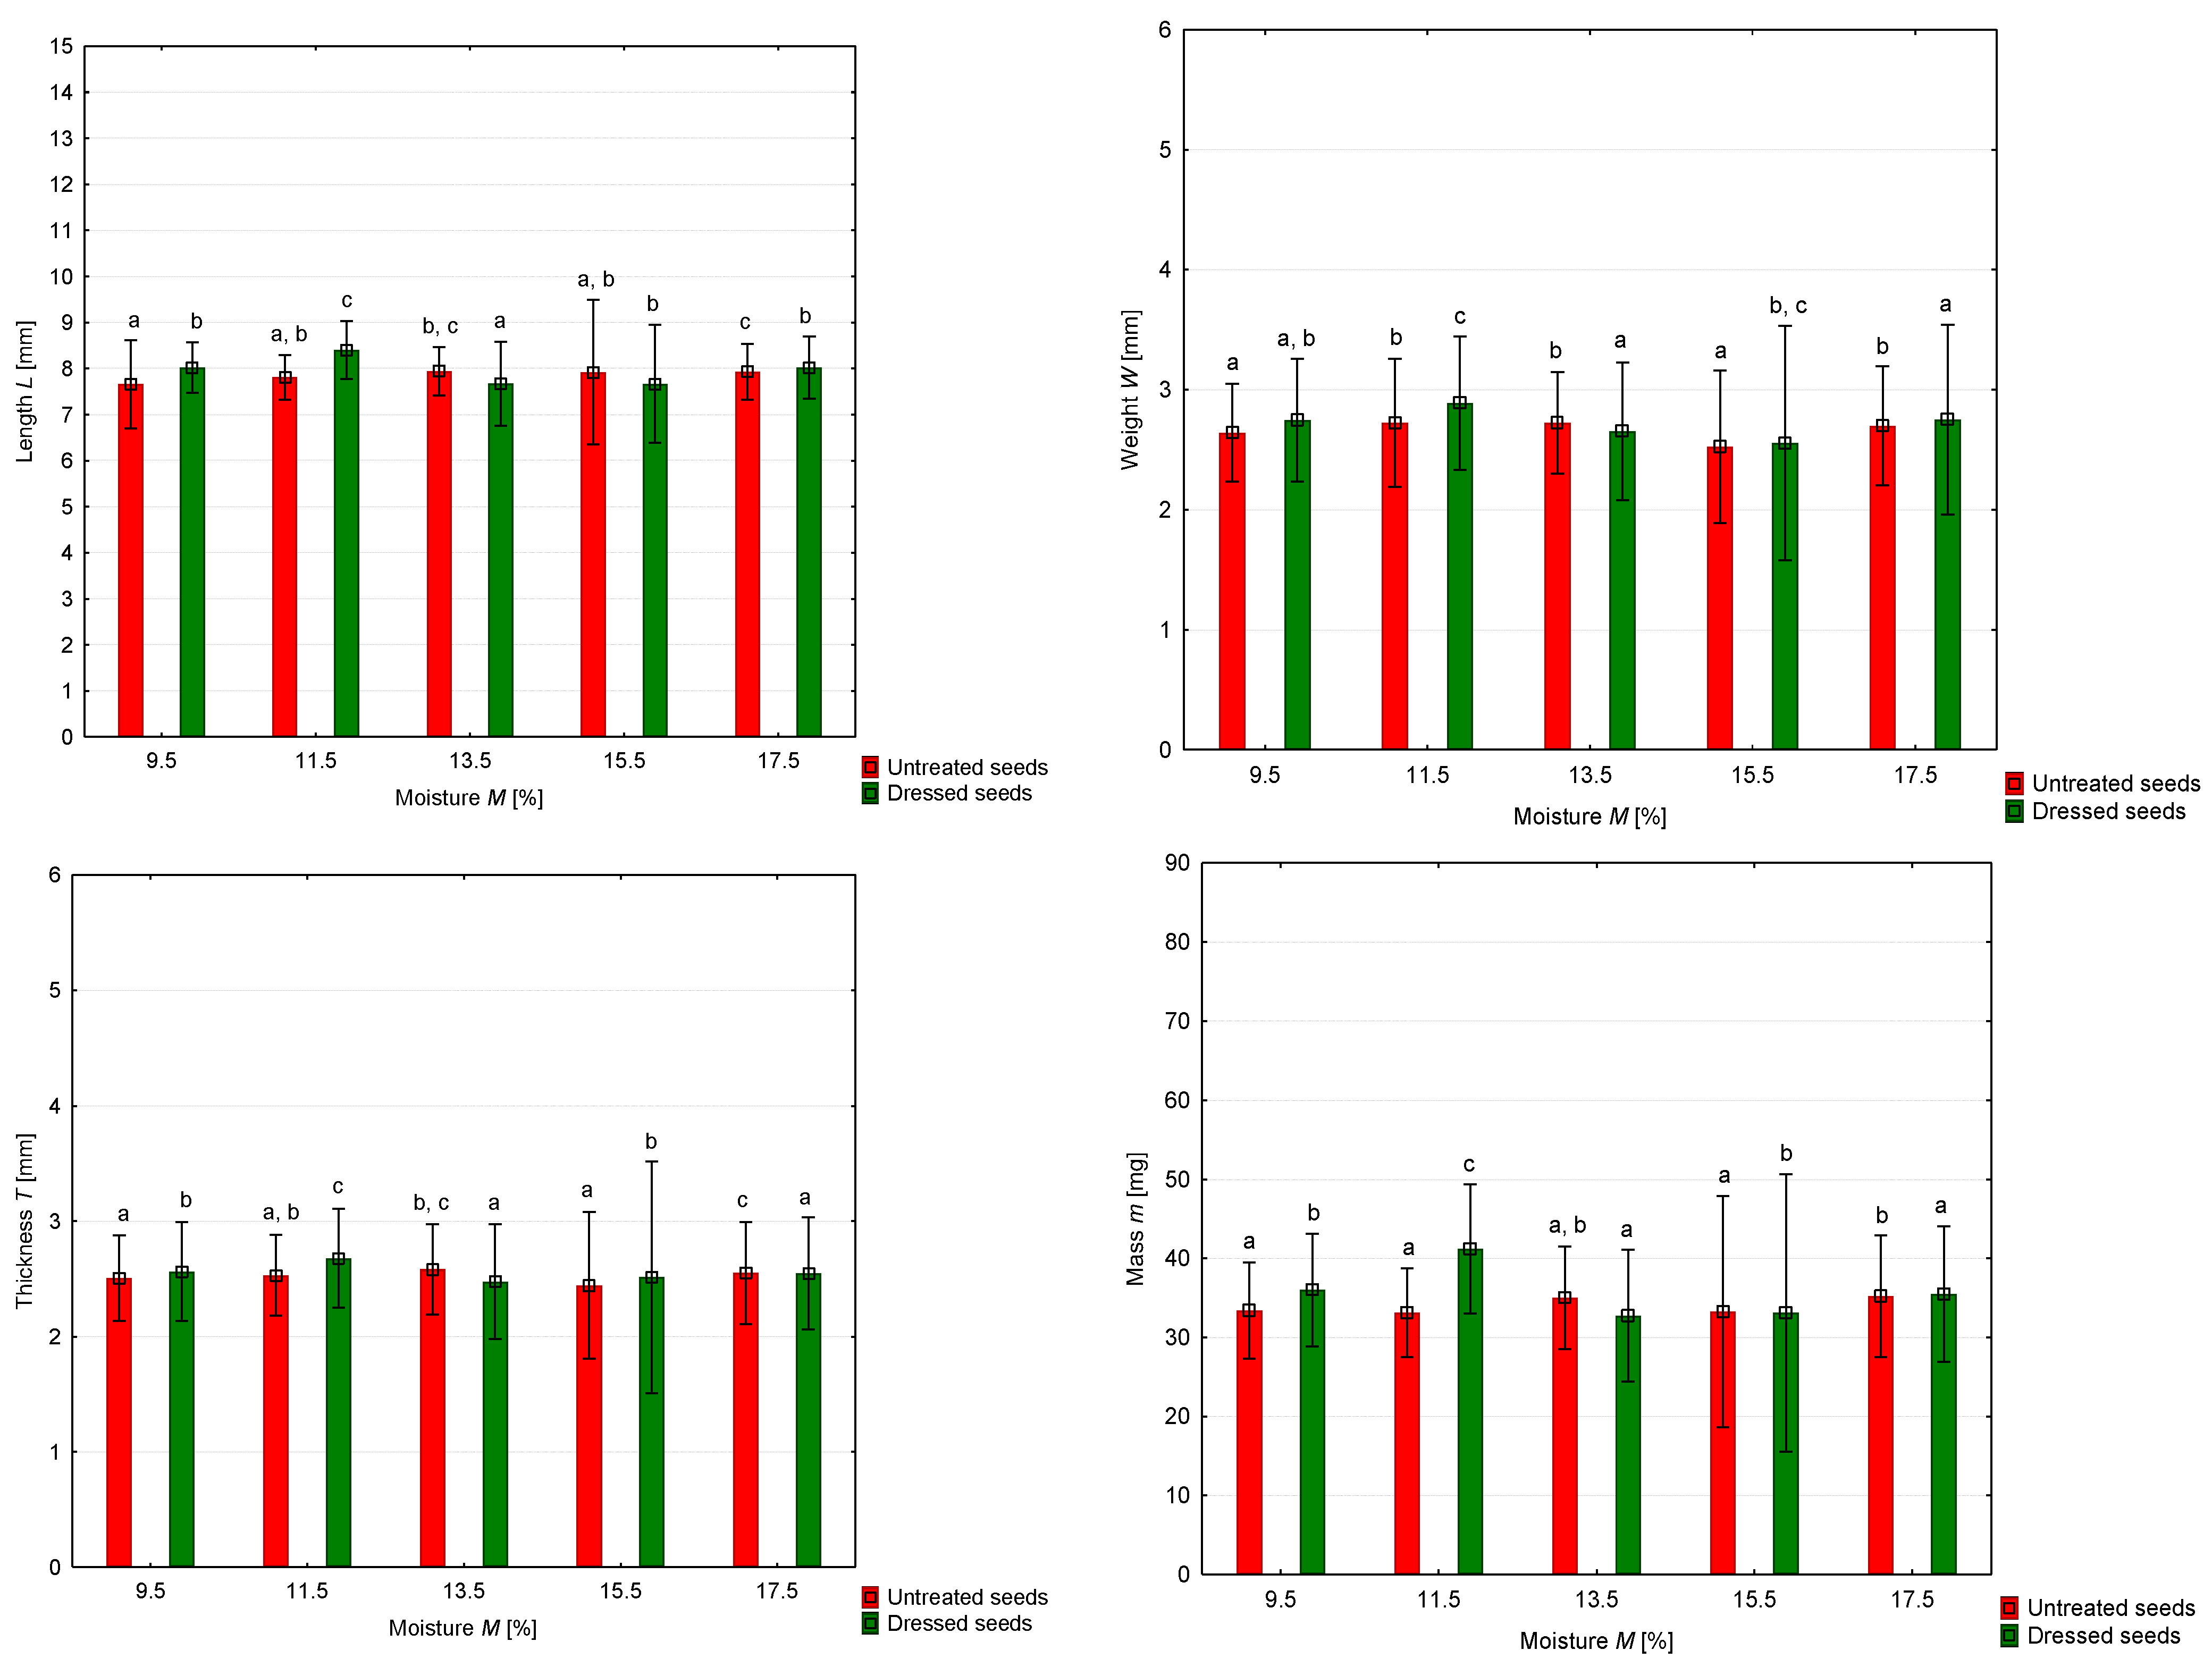
| Untreated | 9.5 | 7.66 a | 0.959 | 2.64 a | 0.203 | 2.51 a | 0.186 | 33.39 a | 6.074 |
| 11.5 | 7.81 a,b | 0.481 | 2.72 b | 0.267 | 2.53 a,b | 0.175 | 33.15 a | 5.637 | |
| 13.5 | 7.94 b,c | 0.525 | 2.72 b | 0.211 | 2.58 b,c | 0.196 | 35.03 a,b | 6.505 | |
| 15.5 | 7.82 a,b | 0.537 | 2.66 a | 0.239 | 2.51 a | 0.212 | 33.88 a | 7.378 | |
| 17.5 | 8.05 c | 0.661 | 2.73 b | 0.253 | 2.60 c | 0.225 | 36.48 b | 7.918 | |
| Dressed | 9.5 | 8.02 b | 0.549 | 2.75 a,b | 0.256 | 2.56 b | 0.215 | 35.99 b | 7.142 |
| 11.5 | 8.40 c | 0.628 | 2.89 c | 0.279 | 2.68 c | 0.215 | 41.21 c | 8.185 | |
| 13.5 | 7.67 a | 0.912 | 2.65 a | 0.288 | 2.48 a | 0.249 | 32.74 a | 8.330 | |
| 15.5 | 8.11 b | 0.610 | 2.83 b,c | 0.440 | 2.62 b | 0.205 | 37.42 b | 6.999 | |
| 17.5 | 7.93 b | 0.737 | 2.67 a | 0.324 | 2.48 a | 0.263 | 33.46 a | 9.653 | |
| Seeds | Wz (%) | Dg (mm) | R (%) | Φ (%) | mD (g·m−1) |
|---|---|---|---|---|---|
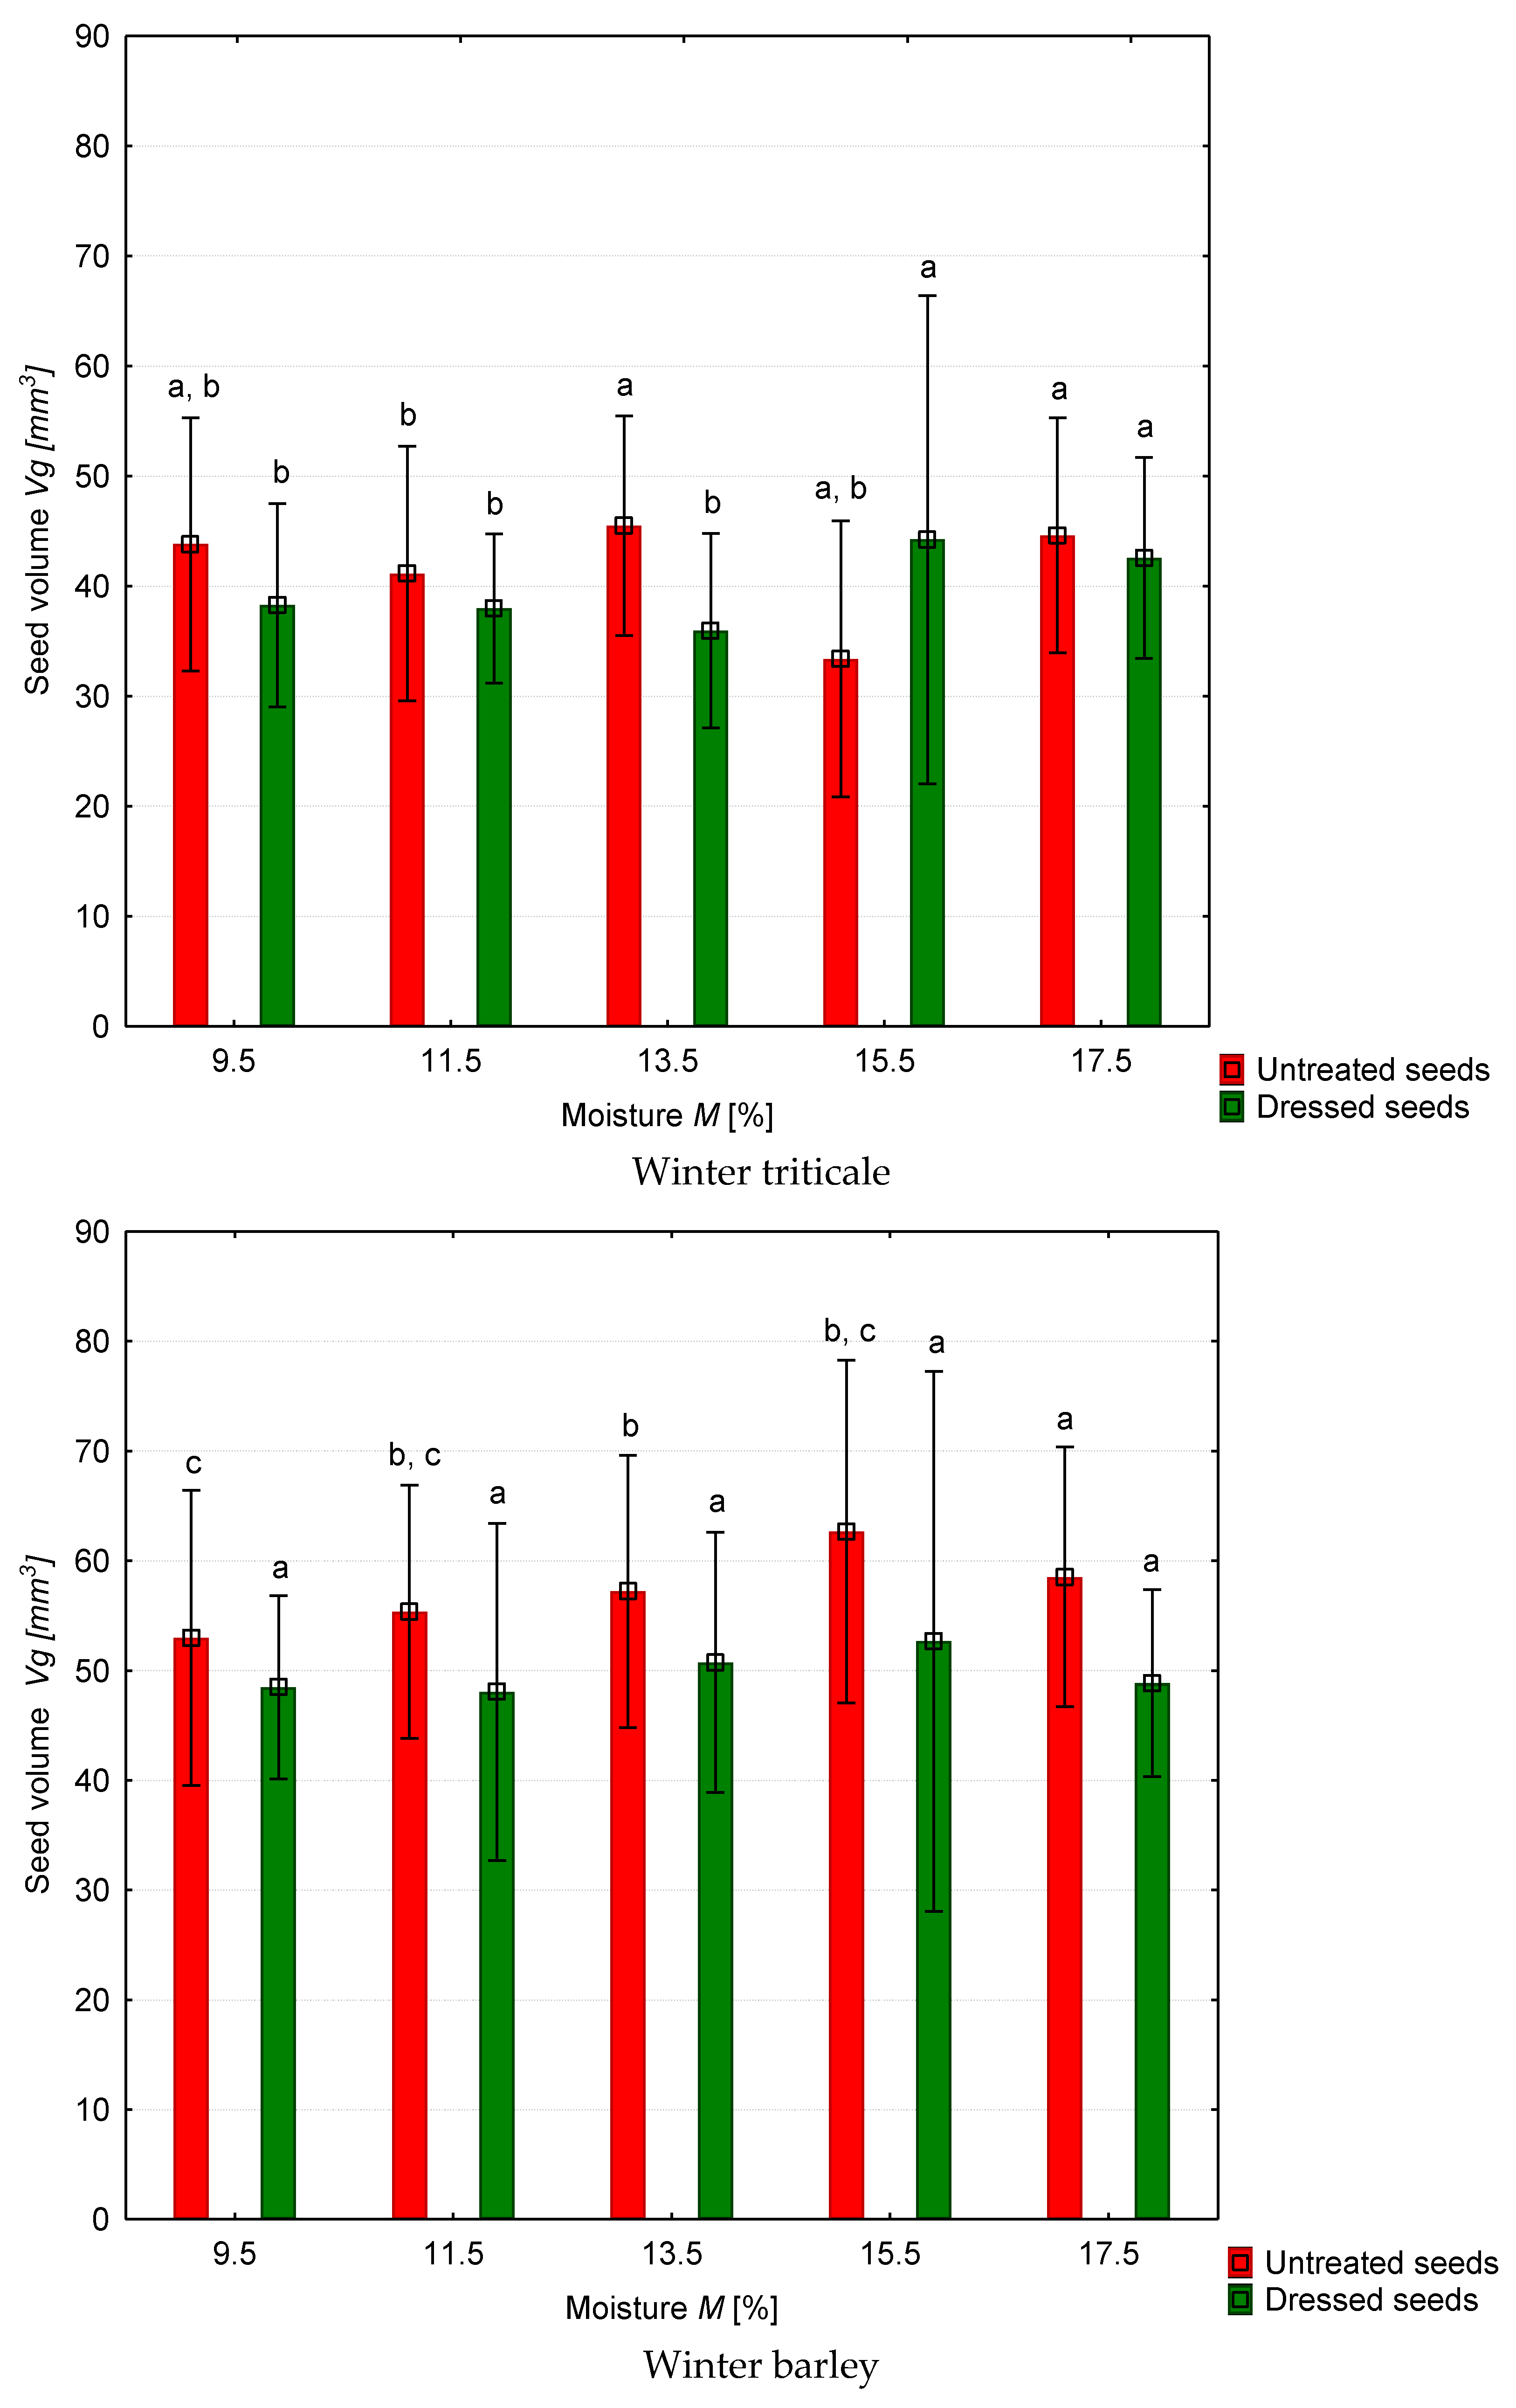
| Untreated winter triticale | 9.5 | 4.35 a,b | 43.41 a | 53.02 a | 10.94 b |
| 11.5 | 4.25 b | 42.83 a | 52.70 a | 10.85 b | |
| 13.5 | 4.41 a | 42.14 a | 52.67 a | 11.56 a | |
| 15.5 | 4.36 a | 42.14 a | 52.58 a | 11.33 a, b | |
| 17.5 | 4.38 a | 42.59 a | 52.88 a | 11.64 a | |
| Dressed winter triticale | 9.5 | 4.16 b | 45.85 a,b | 56.77 a | 10.28 b |
| 11.5 | 4.16 b | 46.24 a,b | 56.99 a | 10.36 b | |
| 13.5 | 4.07 b | 45.11 b | 56.45 a | 9.97 b | |
| 15.5 | 4.28 a | 46.61 a | 57.41 a | 11.12 a | |
| 17.5 | 4.34 a | 46.76 a | 57.38 a | 11.22 a | |
| Untreated winter barley | 9.5 | 4.63 c | 40.29 a,b | 50.69 a | 11.02 b |
| 11.5 | 4.71 b,c | 38.15 c | 48.91 b | 10.70 b | |
| 13.5 | 4.76 b | 39.59 b,c | 50.13 a,b | 11.36 a | |
| 15.5 | 4.73 b | 40.96 a, b | 51.26 a | 11.59 a,b | |
| 17.5 | 4.87 a | 41.57 a | 51.43 a | 11.96 a | |
| Dressed winter barley | 9.5 | 4.51 a,b | 41.46 a | 50.41 b | 10.76 b |
| 11.5 | 4.46 b | 51.12 a | 55.56 a | 10.89 b | |
| 13.5 | 4.57 a | 42.07 a | 50.73 b | 10.70 b | |
| 15.5 | 4.52 a,b | 42.00 a | 51.02 b | 10.79 a | |
| 17.5 | 4.52 a,b | 41.64 a | 50.61 b | 10.86 a | |
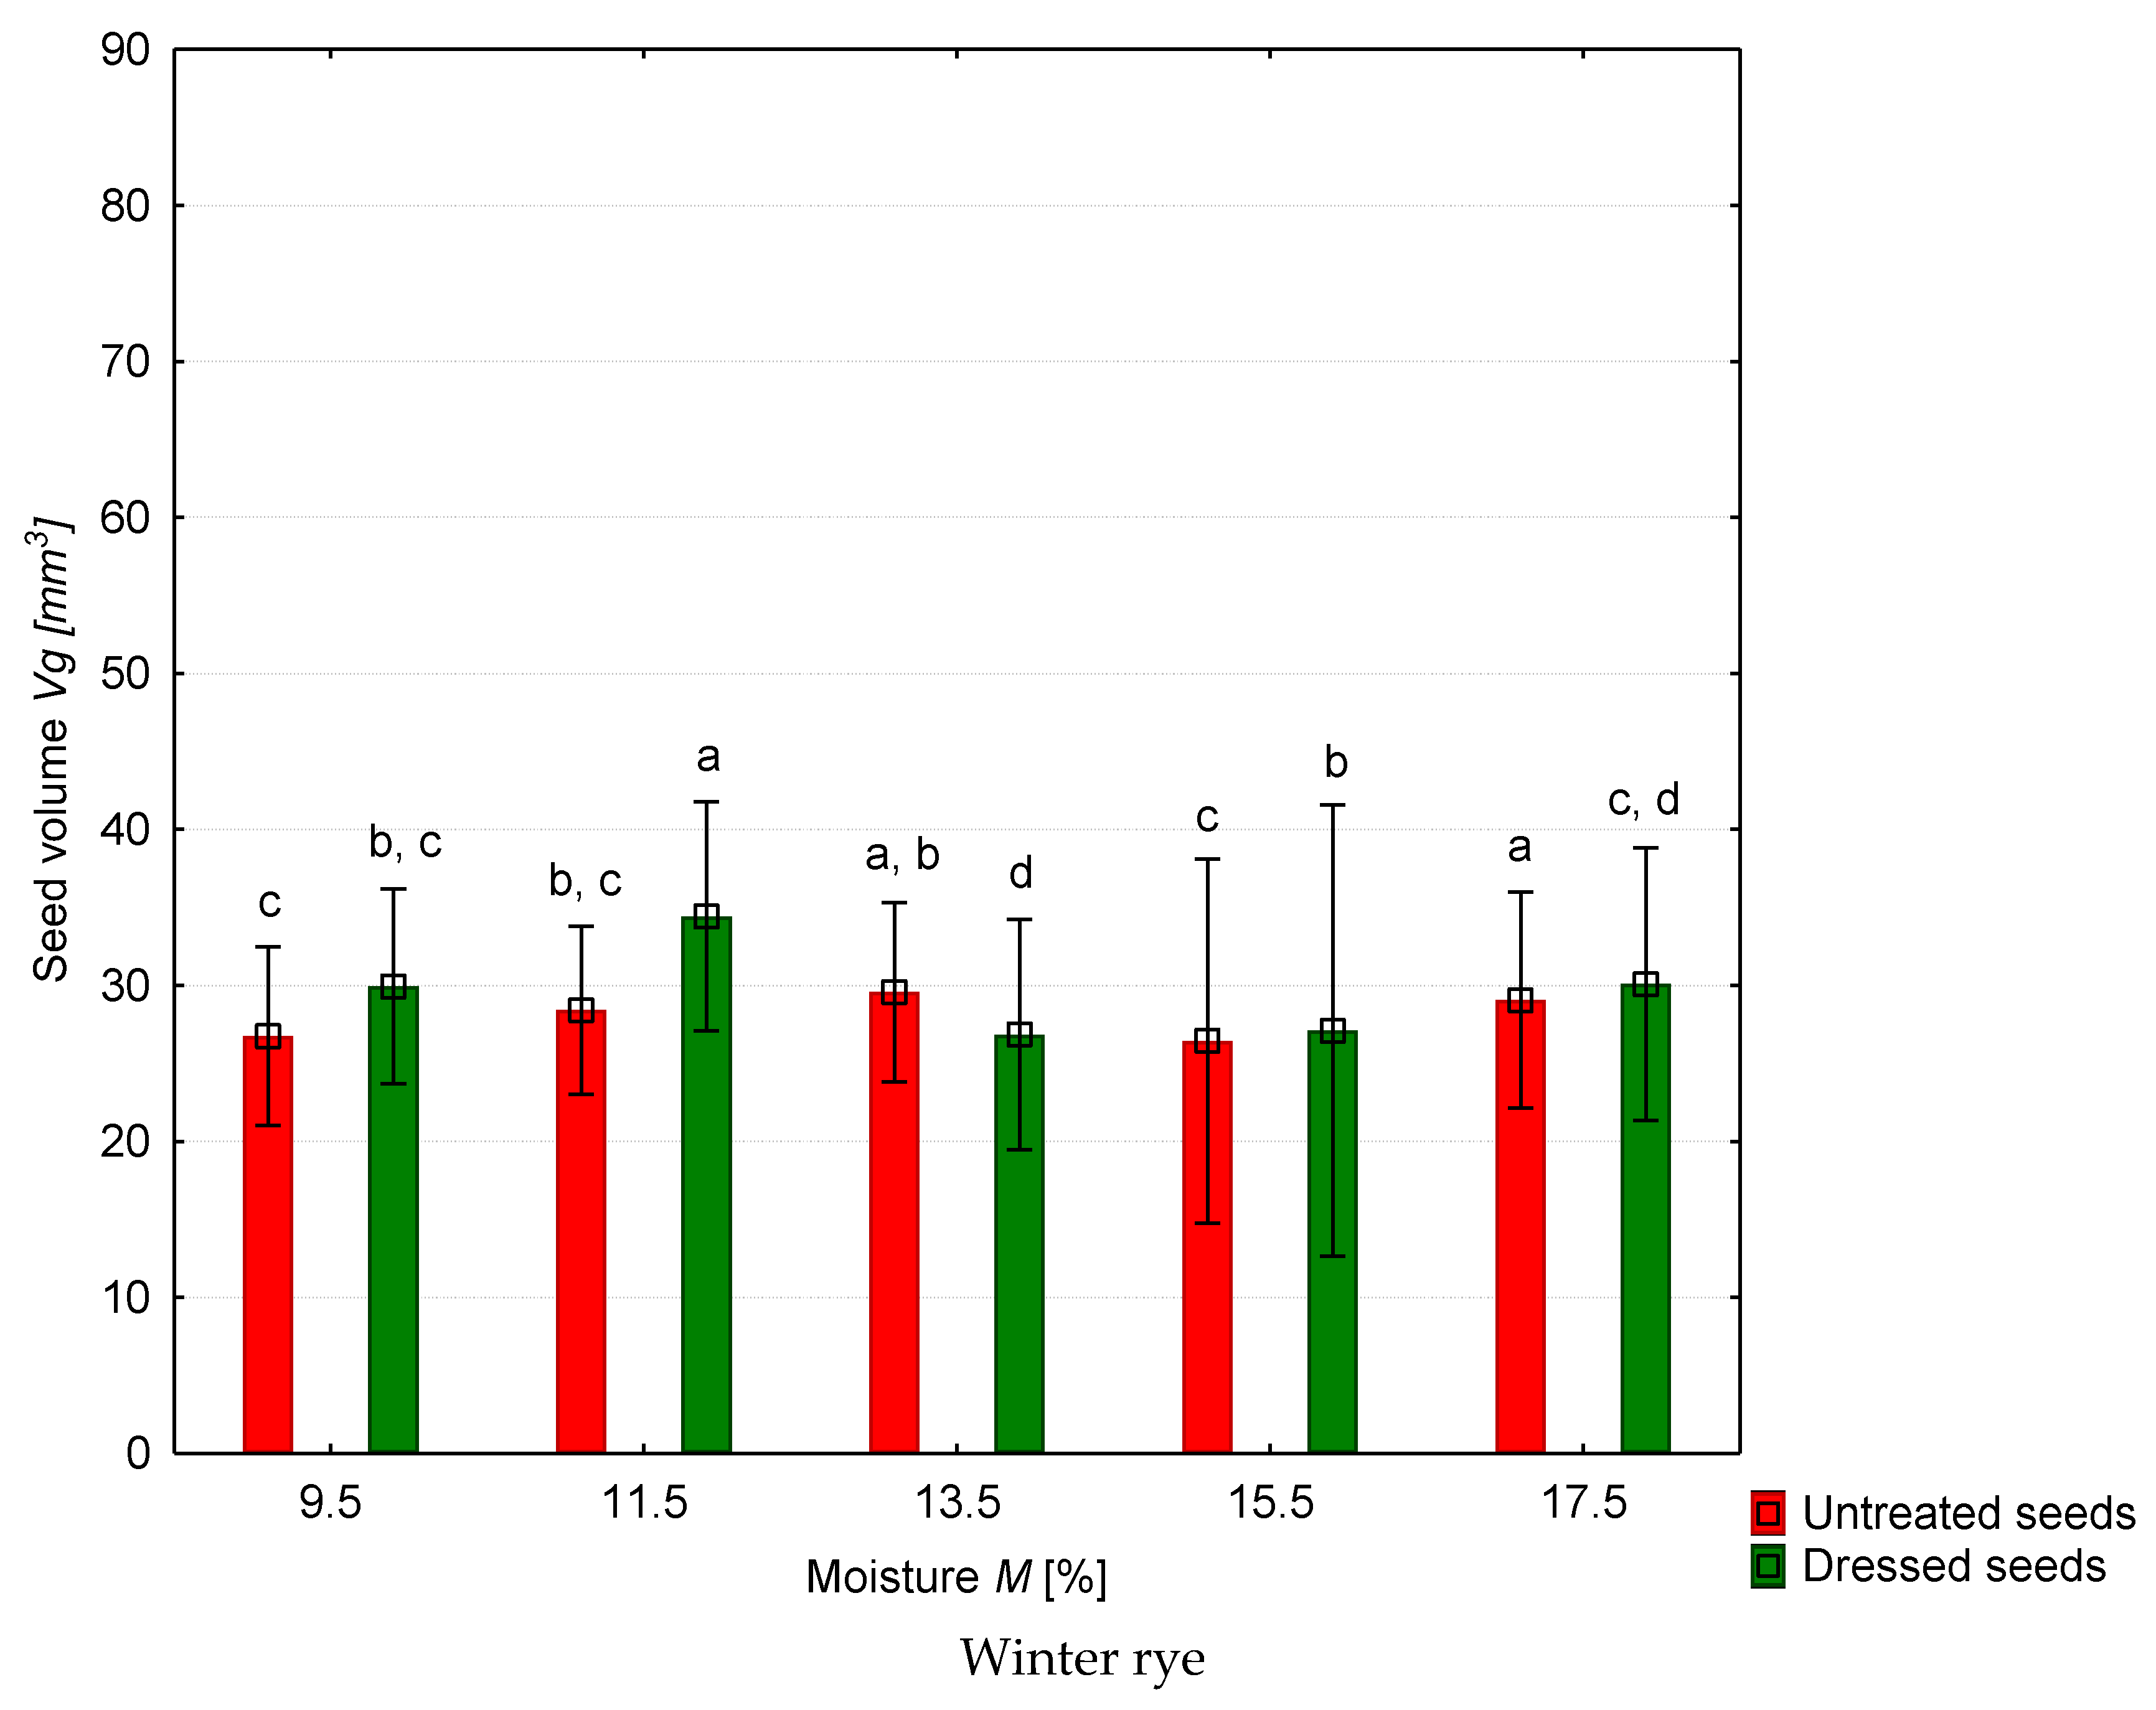
| Untreated winter rye | 9.5 | 3.69 c | 36.28 a | 49.38 a | 9.04 a, b |
| 11.5 | 3.77 a,b | 34.94 a | 48.37 a | 8.74 b | |
| 13.5 | 3.82 a | 34.33 a | 48.15 a | 9.10 a,b | |
| 15.5 | 3.73 b,c | 34.08 a | 47.78 a | 8.98 b | |
| 17.5 | 3.85 a | 33.99 a | 47.86 a | 9.39 a | |
| Dressed winter rye | 9.5 | 3.83 b | 34.29 a | 47.83 a,b | 9.31 b |
| 11.5 | 4.02 a | 34.46 a | 47.90 a,b | 10.18 a | |
| 13.5 | 3.68 c | 36.34 a | 49.09 a | 8.81 c | |
| 15.5 | 3.91 b | 34.97 a | 48.27 a, b | 9.51 b | |
| 17.5 | 3.74 c | 33.64 a | 47.21 b | 8.79 c |
Publisher’s Note: MDPI stays neutral with regard to jurisdictional claims in published maps and institutional affiliations. |
© 2022 by the authors. Licensee MDPI, Basel, Switzerland. This article is an open access article distributed under the terms and conditions of the Creative Commons Attribution (CC BY) license (https://creativecommons.org/licenses/by/4.0/).
Share and Cite
Gierz, Ł.; Kolankowska, E.; Markowski, P.; Koszela, K. Measurements and Analysis of the Physical Properties of Cereal Seeds Depending on Their Moisture Content to Improve the Accuracy of DEM Simulation. Appl. Sci. 2022, 12, 549. https://doi.org/10.3390/app12020549
Gierz Ł, Kolankowska E, Markowski P, Koszela K. Measurements and Analysis of the Physical Properties of Cereal Seeds Depending on Their Moisture Content to Improve the Accuracy of DEM Simulation. Applied Sciences. 2022; 12(2):549. https://doi.org/10.3390/app12020549
Chicago/Turabian StyleGierz, Łukasz, Ewelina Kolankowska, Piotr Markowski, and Krzysztof Koszela. 2022. "Measurements and Analysis of the Physical Properties of Cereal Seeds Depending on Their Moisture Content to Improve the Accuracy of DEM Simulation" Applied Sciences 12, no. 2: 549. https://doi.org/10.3390/app12020549
APA StyleGierz, Ł., Kolankowska, E., Markowski, P., & Koszela, K. (2022). Measurements and Analysis of the Physical Properties of Cereal Seeds Depending on Their Moisture Content to Improve the Accuracy of DEM Simulation. Applied Sciences, 12(2), 549. https://doi.org/10.3390/app12020549