Article

Optimization of the Sowing Unit of a Piezoelectrical Sensor Chamber with the Use of Grain Motion Modeling by Means of the Discrete Element Method. Case Study: Rape Seed

1
Institute of Machine Design, Faculty of Mechanical Engineering, Poznan University of Technology, ul. Piotrowo 3, 60-965 Poznan, Poland
2
Department of Machines and Technical Systems, Faculty of Mechanical Engineering, Bydgoszcz University of Science and Technology, Al. Prof. S. Kaliskiego 7, 85-796 Bydgoszcz, Poland
3
Faculty of Chemical Technology, Poznan University of Technology, 60-965 Poznan, Poland
4
Department of Dairy and Process Engineering, Food Sciences and Nutrition, Poznan University of Life Sciences, Wojska Polskiego 31, 60-624 Poznan, Poland
5
Department of Biosystems Engineering, Poznan University of Life Sciences, Wojska Polskiego 50, 60-625 Poznan, Poland
*
Author to whom correspondence should be addressed.
Appl. Sci. 2022, 12(3), 1594; https://doi.org/10.3390/app12031594
Submission received: 8 January 2022 / Revised: 25 January 2022 / Accepted: 31 January 2022 / Published: 2 February 2022

Abstract

:
Nowadays, in the face of continuous technological progress and environmental requirements, all manufacturing processes and machines need to be optimized in order to achieve the highest possible efficiency. Agricultural machines such as seed drills and cultivation units are no exception. Their efficiency depends on the amount of sowing material to be used and the patency of seed transport tubes or colters. Most available control systems for seed drills are optical ones whose operation is not effective when working close to the ground due to large dusting. Thus, there is still a need to provide seed drills with sensors to be equipped with control systems suitable for use under conditions of massive dusting that would shorten the time of reaction to clogging and be affordable for every farmer. This study presents an analysis of grain motion in the sowing system and an analysis of the operation efficiency of an original piezoelectric sensor with patent application. The novelty of this work is reflected in the new design of a specially designed piezoelectric sensor in the sowing unit, for which an analysis of indication errors was carried out. A seed arrangement of this type has not been described so far. An analysis of the influence of the seed tube tilt angle and the type of its exit hole end on the coordinates of the grain point of collision with the sensor surface and erroneous indications of the amount of sown grains identified by the piezoelectric sensor is presented. Low values of the sensor indication errors (up to 10%), particularly for small tilt angles (0° and 5°) confirm its high grain detection efficiency, comparable with other sensors used in sowing systems, e.g., photoelectric, fiber or infrared sensors and confirm its suitability for commercial application. The results presented in this work broaden the knowledge on the use of sensors in seeding systems and provide the basis for the development of precise systems with piezoelectric sensors.

1. Introduction

Technological progress poses numerous challenges for researchers and constructors. Constant pursuit of manufacturing efficiency improvement methods involves application of better agrotechnical soil cultivation and sowing procedures. Crop yield can be increased by use of higher processing speeds [1], or machines with high working width, at least 4–6 m, or even up to 9–12 m with a system of folding frames [2,3,4]. High performance seed drills and soil tilling and sowing machines are most commonly applied in sowing [5]. They use integrated soil cultivation [6], application of which involves control of the piping system and colter clogging [7] as well as monitoring the amount of seeds to be sowed which is of key importance in precision farming systems [8,9,10].
The elements of standard seed drills with mechanical or pneumatic dosing systems such as seed delivery tubes or colters are not commonly equipped with electronic systems for control of seed delivery tube clogging or for the amount of grains. Modern machines consistent with farming standards 4.0 are equipped with modern control units with sensors [11]. Application of computer technologies in combination with modern sensors enhances productivity, has a positive impact on the natural environment, and reduces the costs of manufacturing [12].
Sensors such as ‘seed eye’ are now available on the growing market for agricultural machines. They are offered with seed drills by the Väderstad-Verken AB Company [13] and the newest sensors ‘Pro-Seeder D30’ of Italian MC Electronics [14]. These, however, are optical sensors whose seed tubes and colters operate inefficiently near the ground where there is a significant amount of dust. In such difficult conditions impact sensors are found to be more efficient. A PVDF sensor which is already applied in harvesters as a crop loss indicator is one of such solutions [15]. Entire systems with piezoelectrical sensors are installed inside the distribution head of pneumatic seed drills [16] and behind the output connection pipe, in the upper part of the seed delivery tubes [17]. The piezoelectrical sensor is also used for assessment of the sensor force where the seeds hit a stiff surface [18]. There are also control methods for seed sowing quantity based on weighing [19], however, due to vibrations that occur on seed drills these methods have not been developed. Recently, sowing with simultaneous fertilizing has been introduced, though here again powdered fertilizer easily settles on the sensors decreasing their sensitivity [20,21]. A dispenser in the form of a grooved shaft is often used for simultaneous wheat sowing and mineral fertilizing (granular fertilizer) [22,23]. It is recommended to apply a self-calibration system for each of them to maintain sowing precision [24]. Self-calibration systems need to be equipped with sensors and the impact sensors sustain their functions under difficult dust conditions.
Thus, there is still a need to build seed drill control systems with sensors able to operate close to the ground (dust resistant) and characterized by shorter reaction time to indication of clogging to be available for all, even small or medium, farms. Between the available sensors (PVDF and PZT), it was found that in the tested impact plate ceramic PZT sensors were characterized by better properties [25].
The goal of this work is to optimize structural features of a patent applied (P.438435) piezoelectric sensor to enable the counting of grains in the seed unit through an analysis of the grain motion and their collisions with the sensor surface. This solution was also distinguished in the IENA2021 Fair that was held on the 4–7 November 2021, Germany, by a special award—Korea Invention Promotion Association. (P.438435-impact system for control of granular mixture flow in the form of a casing attached to the end of the seed delivery tube or in a colter containing an impact plate fixed by a ceramic piezoelectric converter PZT) The research problem was formulated as a question: What values of the structural features (shape, length, width, tilt angle) and grain motion parameters (seed motion rate) will provide the sensor with the biggest efficiency in grain counting? Maximum efficiency of the sensor can be achieved when each grain present in the chamber hits the sensor surface only once. To achieve the goals, analytic and experimental procedures of grain motion were carried out in a sowing unit in terms of the grain contact with the sensor surface including determination of the optimization conditions of its structural features.
LIDER project, this study is part of the involved construction of a system with the use of alternative technology for detection of grains in seed tubes by means of piezoelectric impact sensors mounted directly at the ends of the seed tubes or in colters. Unlike optical sensors, sensors of this type are entirely dust resistant and therefore, they can be fixed to the elements that contact the soil where high dusting occurs. Early detection of seed delivery tube clogging allows the reduction of crop loss caused by breaks in seeding and shortens the system reaction time.
Simulation methods are being increasingly used for the design of agricultural machines and their control systems as they exhibit good consistence with the results of laboratory tests [26]. FEM (finite element method) and DEM (discrete element method) are the most commonly used. FEM is used for tests [27], and for tests of joints between the machine elements [28]. DEM is used in simulation of the transport process [29], milling [30], crushing, sieving, and many more processes that use granular material. According to the results of analyses and the literature, the DEM method is an effective tool to be used for simulation of granular materials [31] and is the most suitable for optimization of a piezoelectric sensor chamber.

2. Materials and Methods

In this study an analysis of the accuracy of measurements of a piezoelectric sensor and a grain movement analysis in the sowing unit were conducted. The research consists of four parts: (1) theoretical discussion of the grain movement in a system with a piezoelectric sensor, (2) experimental tests on a specially developed test stand for measurement of the number of grains detected by the sensor and determination of the point of collision with the sensor and the length of grain flight after collision for different tilt angles of sowing tubes and different shapes of exit holes, which will support the sensor system optimization, (3) the simulation verification of the system using DEM, (4) an analysis of the results involving determination of the relative error as an accuracy measure of the sensor performance and a correlation analysis. A diagram of the study framework is presented in Figure 1.

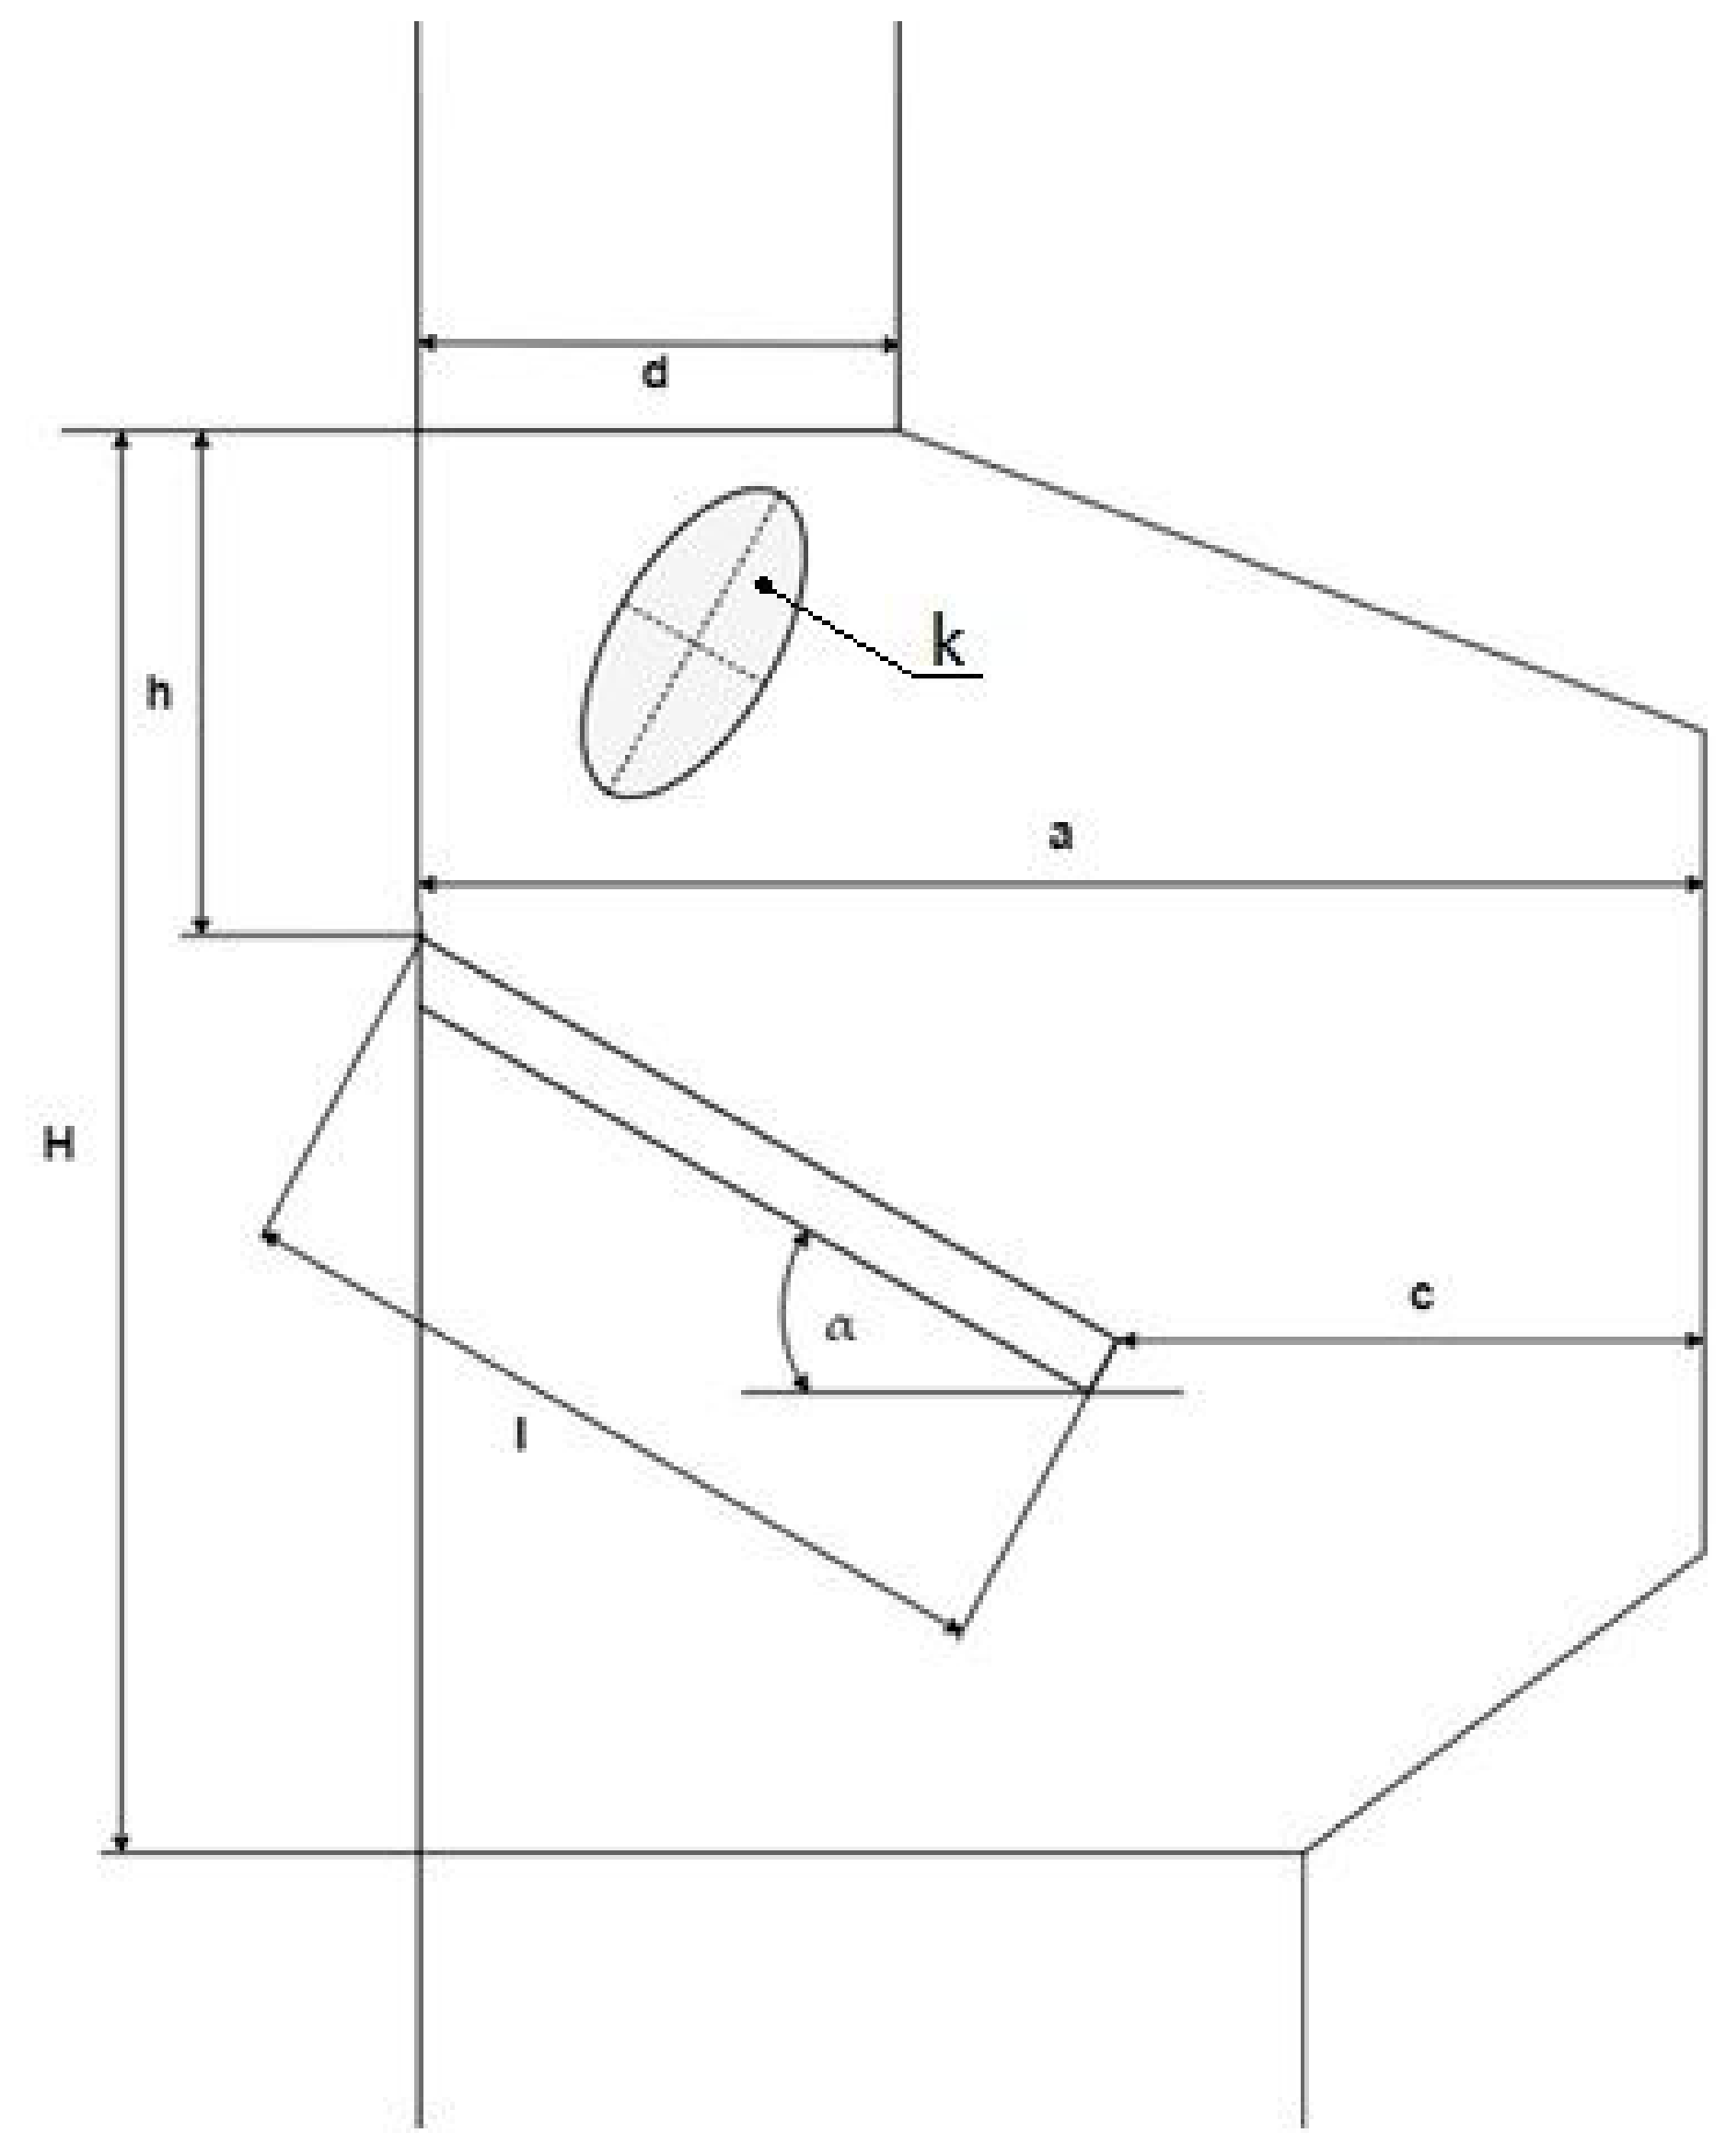
2.1. Model of Grain Motion in the System of a Piezoelectric Sensor

Sowing crops and cultivated plants requires appropriate dosing of grains to be positioned in rows, which ensures utilization of an optimal amount of grains at an appropriate distance between them (appropriate grain distribution in the soil). For this purpose, it is necessary to control the material feeding into the colter. A control chamber with a piezoelectric sensor PZT (ceramic) was proposed to count the grains. By means of the chamber, grains that fall down a delivery tube are counted. Figure 2 shows the scheme of the control chamber equipped with a PZT (ceramic) piezoelectric sensor. Selection of an appropriate shape and dimensions as well as the distance between the sensor and its chamber walls is of key importance in the presented solution. They need to be matched so that a falling seed will contact the sensor surface only once. It is important to provide grains with a suitable tilt angle as this conditions the grain motion direction and the impact range. A small impact range causes a double hit against the sensor surface which results in a double count of the same grain and the control system indication error. In terms of usability, this is not a desired situation, and it would disrupt the regularity of the control system performance.
To optimize the structural features of the sensor chamber and its dimensions it is necessary to take into account the grain motion in the chamber and its characteristic extreme situations. Dimensions of the sensor and the chamber must be correlated with each other in such a way that after exiting the output tube a grain hits the sensor only once.
Grain movement was considered for a flat sensor in the form of a plate (Figure 2).
Grain motion can be divided into four stages:
  • Motion in the seed delivery tube,
  • Motion after leaving the seed delivery tube until hitting against the seed drill surface,
  • Impact with the sensor surface, with partial energy loss,
  • Grain motion after collision with velocity vk, different (smaller due to impact) from its velocity before a collision with the sensor.
An equation of grain motion in a chamber results from Newton’s law of dynamics. Grain can be transported gravitationally or pneumatically in the form of a grain–air mixture. Gravitational transport, that is, falling under the impact of G gravitation force and Magnus M [32] force was considered first. It should be assumed that a falling grain performs translational motion and a rotational motion around its own axis. During collision with the sensor surface a grain is affected by the force of contact FC with normal component N (connected with the impact pressure and damping) and tangential component T resulting from grain sliding friction (Figure 3). The equation of grain translational motion is expressed by:
m d v d t = G + F c + M
and rotational motion:
I d ω d t = M ω + M T
where: m—grain mass, v —translational motion velocity, G —gravitational force, F c —force resulting from the seed contact with the sensor surface, M —Magnus force, I—inertia moment, ω —speed angular velocity, M ω —torque, M T —rolling resistance moment.
Both the force of contact and the moment of rolling resistance against the surface occur when a particle hits a surface or another particle. In the remaining cases they are equal to 0.
Gravitational force is defined as follows:
G = m g
Contact force F c is defined as a resultant of the surface reaction forces upon impact N c and tangential forces T c [32]:
F c = i = 1 n N c + T c
When modeling contacts, i.e., an impact between two bodies, a few available models of normal and tangential forces can be used [33]. Normal force N c that occurs during the impact can be determined according to Hertz theory [32,33], whereas determination of tangential forces T c was carried out using a model proposed by Mindlin and Deresiewicz [34] for stick-slip behavior during contact. Both normal forces N c and tangential forces T c are the effect of stiffness components N s i and T s i and damping N T i or as T T i , hence contact force can be expressed as:
F c = i = 1 n N c + T c = i = 1 n N s i + N T i + T s i + T T i
Normal force results from two forces—elastic force N s i and damping force T T i :
N c = N s i + N T i
Elastic force according to Hertz theory [32,33] is defined by dependency:
N s i = 4 3 E * R * h o 3 2
1 E * = 1 υ 1 2 E 1 + 1 υ 2 2 E 2 E * = E 1 E 2 E 1 1 υ 2 2 + E 2 1 υ 1 2
1 R * = 2 R R * = R 2
h o = d R
where: E*—reduced Young modulus (Equation (8)), R*—effective radius of contact with a flat surface (Equation (9)), ho—particle overlap (Equation (10)), E1, E2—Young moduli of two bodies at contact, υ 1 , υ 2 —Poisson coefficient of bodies at contact, R—radius of grain curvature at the contact point, d—length between the grain gravity center and the contact surface.
The damping force dependent on the restitution coefficient is expressed as:
N T i = 2 c n H m * 4 3 E * R * 1 2 h o 1 4 v n r e l
where: cnH—damping coefficient of normal forces in Hertz theory, m*—effective mass (relative), v n r e l —relative velocity of normal component.
The damping coefficient of normal forces in Hertz theory is connected with the linear damping coefficient cn according to equation:
c n H = 5 2 c n
whereas cn is determined based on the value of the restitution coefficient ε. The restitution coefficient and damping coefficient are connected by the following dependency:
ε = exp c n 1 c n 2 π arctan 2 c n 1 c n 2 1 2 c n 2 i f 0 c n < 1 2 exp c n 1 c n 2 arctan 2 c n 1 c n 2 2 c n 2 1 i f 1 2 c n 1 exp c n c n 2 1 ln c n + c n 2 1 c n c n 2 1 i f c n > 1
The relative mass for contact with a flat surface is equal to:
1 m * = 1 m m * = m
The tangential force at the contact point is made up of a tangential elastic force and a tangential damping force:
T c = T s i + T T i
The tangential elastic force is given by an equation according to Mindlin–Deresiewicz theory and based on the Coulomb linear friction coefficient [34]:
T s i = μ N c 1 ζ 3 2 s τ s τ
whereas:
ζ = 1 min s τ , s τ , max s τ , max
s τ , max = μ 1 υ 1 2 υ 1 + 1 υ 2 2 υ 2 1 h o
where: μ—linear coefficient of friction, sτ—tangential component of relative displacement, sτ,max—maximum relative displacement.
The tangential component of damping expressed by dependency:
T T i = c t 6 μ m * F n s τ , max ζ 1 4 v t r e l
c t = ln ε ln 2 ε + π 2
where: ct—tangential coefficient of damping, v t r e l —tangential component of relative velocity.
Due to the likelihood of grain rotation around its axis, the path of falling is under the influence of the Magnus force [32]. According to Kutty–Joukowski theorem, the Magnus force for seed in non-viscous air flow will be [32]:
M = 1 8 ρ v r 2 π d p 2 C M ω r × v r ω r v r
The torque of mass M for rotational motion Mw is determined from equation [35]:
M ω = x j x i F c
Considering that upon contact, friction involved in grain rotation around its axis is likely to occur it can be written:
M T = μ r r N c ω ω
where: μr—coefficient of rolling friction, ω —vector of angular velocity, r —rolling radius.

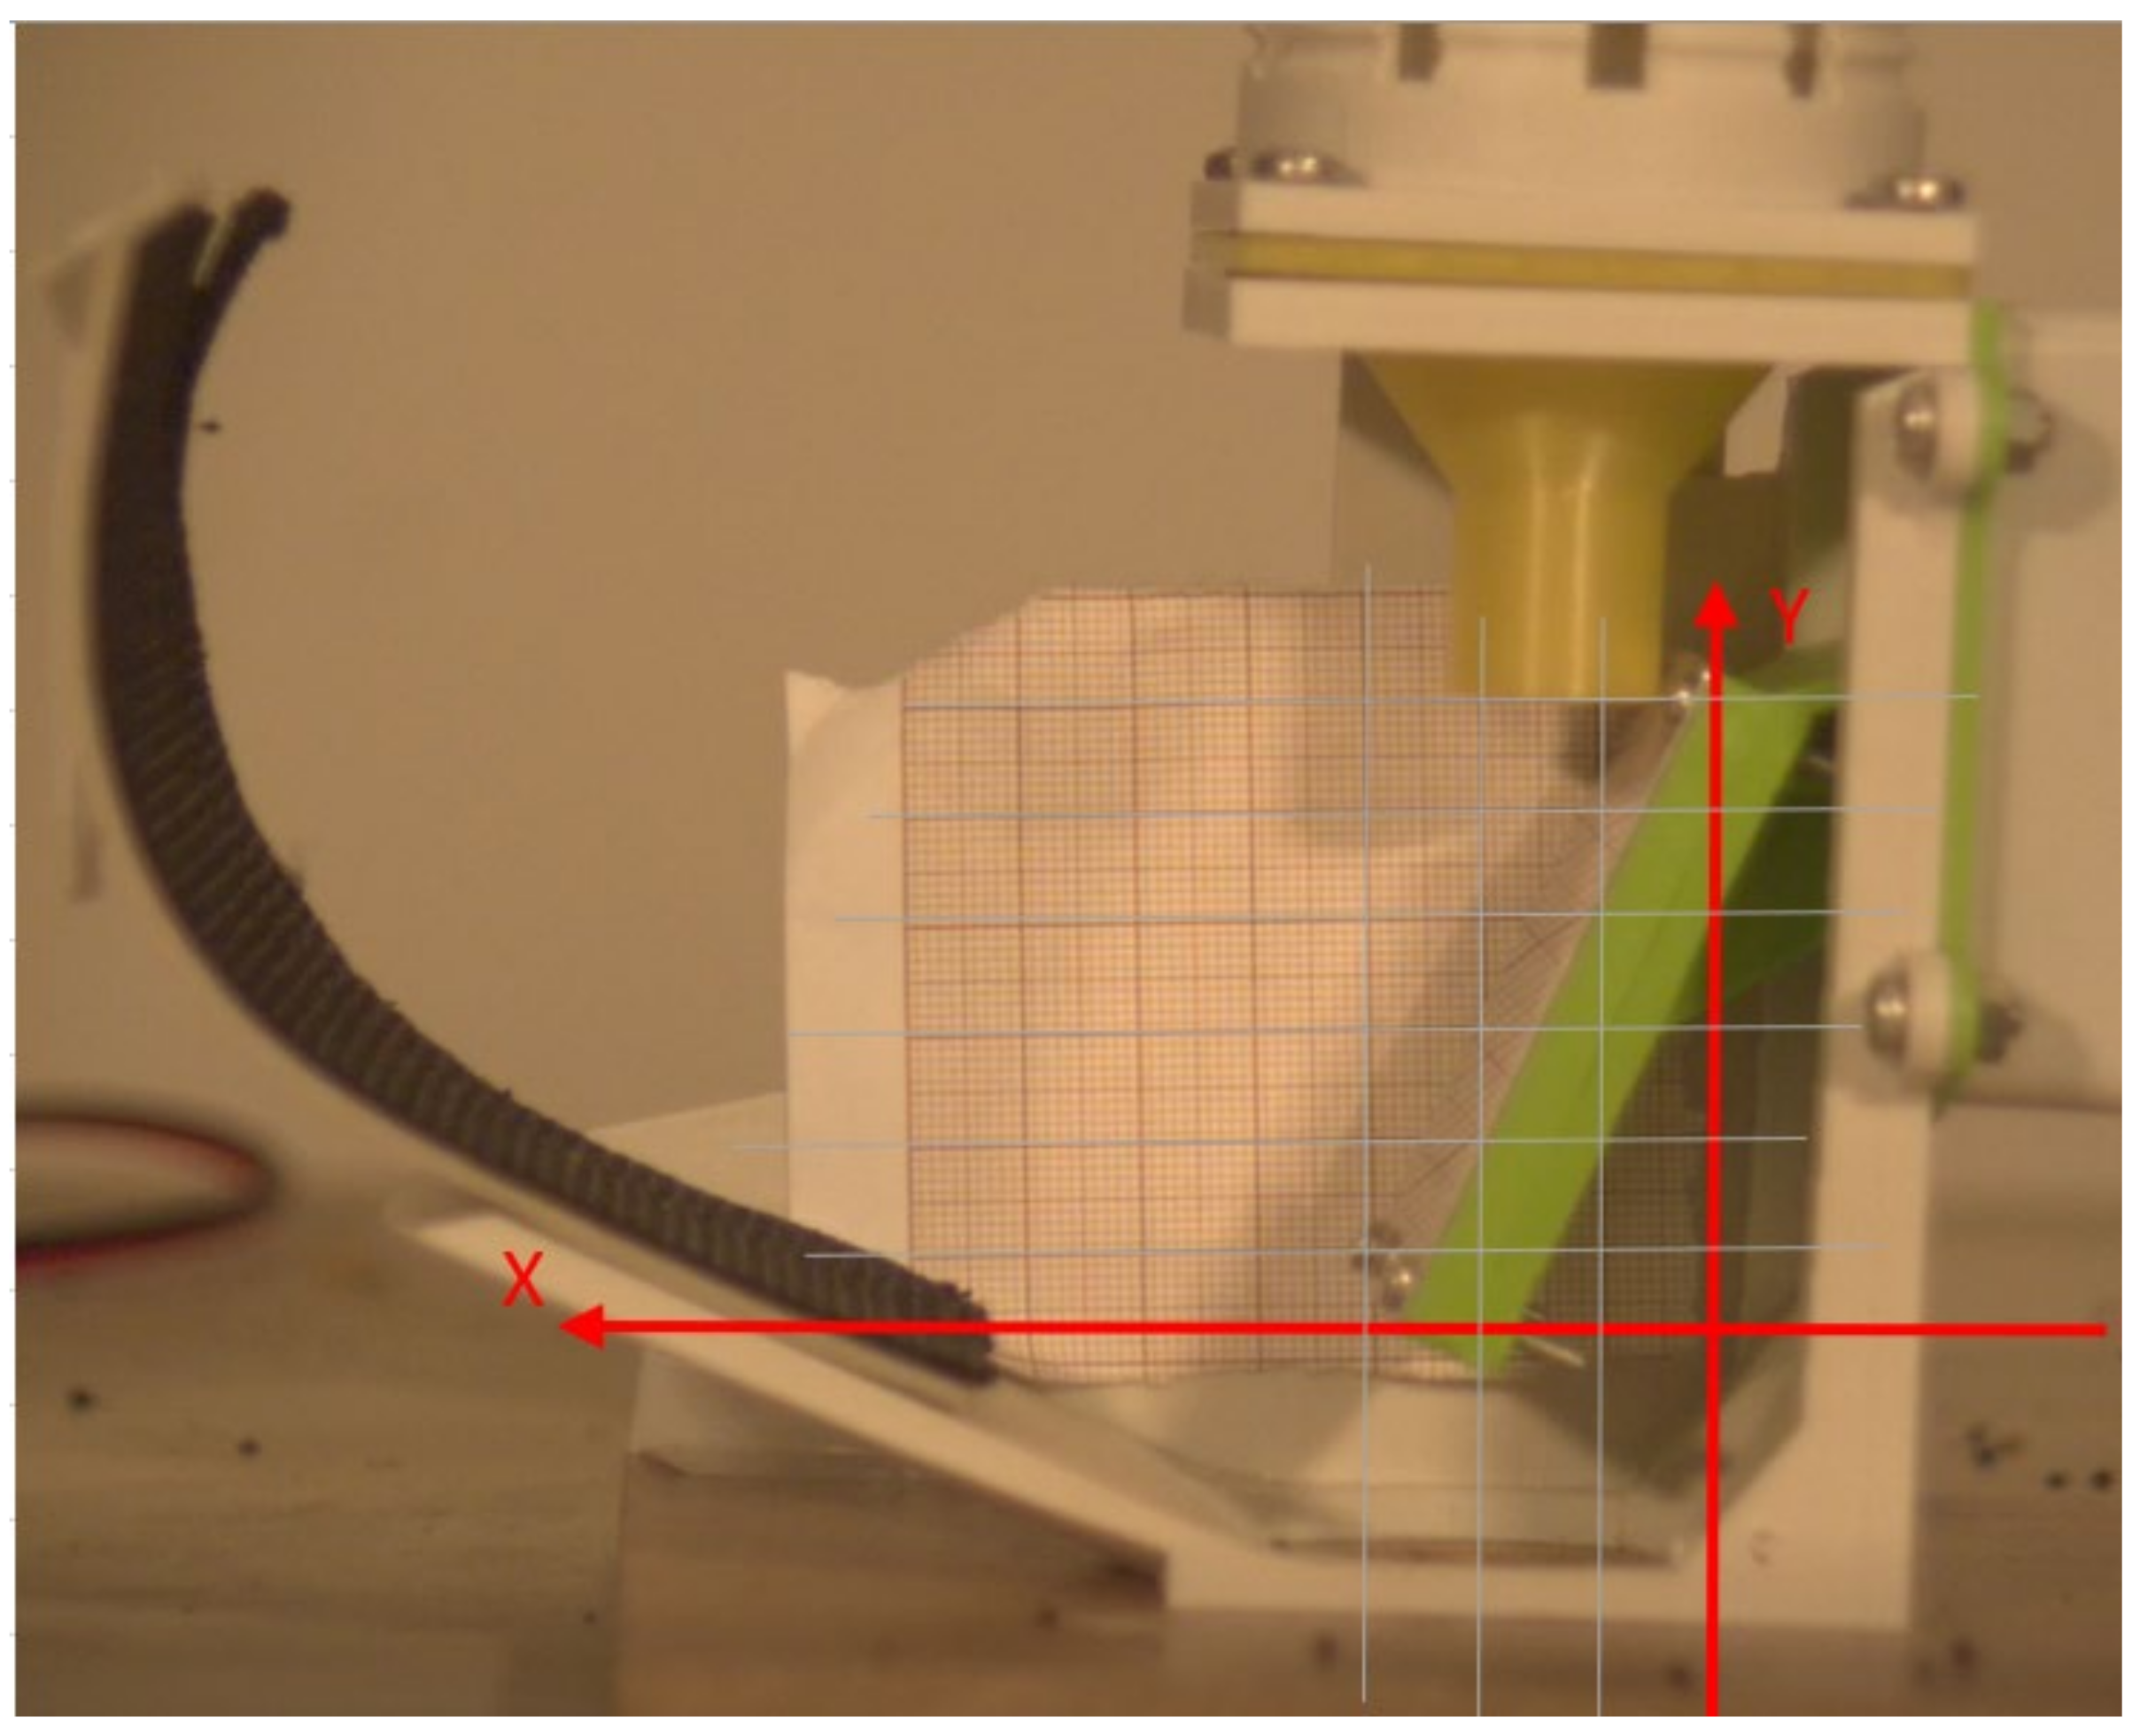
2.2. Experimental Tests

Experimental tests involved the determination of the point of grain collision with the surface of a piezoelectric sensor developed for the needs of sowing and the identification of the number of erroneous indications based on the number of grain collisions with the sensor surface. The experiment was conducted with the use of Kite winter rape seeds of 9.0% humidity and medium size 2.02 ± 0.14 mm. The seeds came from Seed Center Top Farms Nasiona-Zakład in Runowo, Wielkopolskie Voivodeship.
An original test station was constructed to provide real conditions of the control system operation (Figure 4) which consisted of the following elements:
  • seed dosing unit (rotational plate with 23 holes) powered by an electric motor with the use of a belt transmission with adjustable speed,
  • Chronos 1.4. video camera
  • screen with a scale in the form of graph paper,
  • vertical-telescopic seed delivery tube (tube for seed drill S107, PMR Meprozet, Miedzyrzecz Podlaski, Poland,
  • two led lamps with stabilizing systems, 400 W each,
  • laboratory table.
During the experiment the grains were fed from a height of 65 cm, with a frequency similar to real rape sowing parameters, that is 18 psc./s. Grains were fed through a rotational plate with 23 holes into a telescope seed delivery tube. Next, coordinates of the collision point were measured in the X and Y axes for each grain as well as the length after collision with sensor X0 in axis X. The measurement distance in the Y axis was assumed to be 0 for a grain after collision. In the experimental tests, 4 different tilt angles of the grain transport tube were analyzed: 0°, 5°, 10°, 15°, presented in Figure 5, diversifying in this way the angle of grain falling on the sensor, in order to assess the impact of the tube tilt angle on the efficiency of the piezoelectric sensor and the number of its indication errors. Additionally, two different configurations of the exit hole end with internal diameter 15 mm were used: straight end (yellow), and diagonal end (red), cut at an angle of 45° (Figure 6). Measurements of coordinates were performed for 20 grains in each configuration.
Coordinates of the grain collision point were measured based on graphic data obtained using a fast frame camera Chronos 1.4, which is characterized by a high range of image display frequency. This video camera has a built-in, 1.3-megapixel image converter, which records the transmission speed up to 1057 kb/s for 1280 × 1024 resolution or even up to 38,500 kb/s for lower resolution. A lens of the recording camera was placed at a distance of 70 cm from the research object (piezoelectric sensor chamber), as according to the distance specification this provides the highest image sharpness. In effect, MP4 format recordings were obtained for which the registered data speed was app. 9400 kb/s for image resolution 640 × 360. When using video devices, continuity (frequency) of the image display is important—the more frames per second the better the image. According to the European tv standard, the correct range of image frequency is 24 fps. To provide repeatability of results for the analyzed trajectories of the grain flight, the same image frequency parameters were used, that is, 58 fps. Based on an analysis of the seed motion images, a few frames depicting the grain collision point were chosen and the distance of X and Y was measured on a graph paper placed behind the sensor, according to Figure 7, and the frames depicted the grain maximum distance after a collision.

2.3. Simulation Tests with the Use of the Finite Element Method

Simulation tests involved determination of the coordinates of the collision point, trajectory of particles, the distance after collision, and the identification of the wrong indications of the piezoelectric sensor counting grains on the basis of the number of collisions with the sensor surface. The simulation model was consistent with a real grain transport tube represented in the test station (Figure 4). The image of a model for the two considered exit hole configurations (straight and diagonal) is shown in Figure 8 (consistent with real configurations presented in Figure 6). The simulation was carried out using RockyDEM software for rape grains with parameters presented in Table 1. Rape grains were assumed to be identical, in the form of a spere with 2.2 mm diameter.
Figure 7. Axes of the coordinate system during determination of the grain point of collision with the sensor and the distance after the impact for the vertical tube (tilt 0°).
Applsci 12 01594 g007
Based on similar tests carried out by other authors [33,36,37], the Hertzian Spring Dashpot model was accepted for normal force, the Mindlin–Deresiewicz model for tangential force, and the linear model for adhesion forces. Due to the grain single contact with the sensor during the collision, rolling resistance was neglected. Table 2 shows the values of the particle–particle and particle–surface contact parameters used in the simulation tests using parameters provided by the literature [38,39]. The simulation lasted 5 s, and the output frequency was 0.1 s.

2.4. Analysis of Results

An average (Equation (24)) and standard deviation (Equation (25)) were calculated in RockyDEM software for each configuration of the seed delivery tube tilt and for the exit hole shape from experimental tests and simulation results.
X ¯ = X i n
s = i = 1 n X i X ¯ 2 n 1
where: X ¯ —mean value, Xi—values of the i-th measurement, n—number of measurements.
Pearson correlation analysis was carried out to investigate the impact of the exit hole tilt on coordinates of the collision point and the grain flight length after collision with the sensor, assuming the significance level to be 0.1.
To evaluate the sensor for commercial applicability a relative error of the sensor indications was defined according to the following formula [40,41]:
δ = Δ x x 100 % = x x 0 x 100 %
where: Δx—absolute measurement error, x—exact value, x0—measured value.

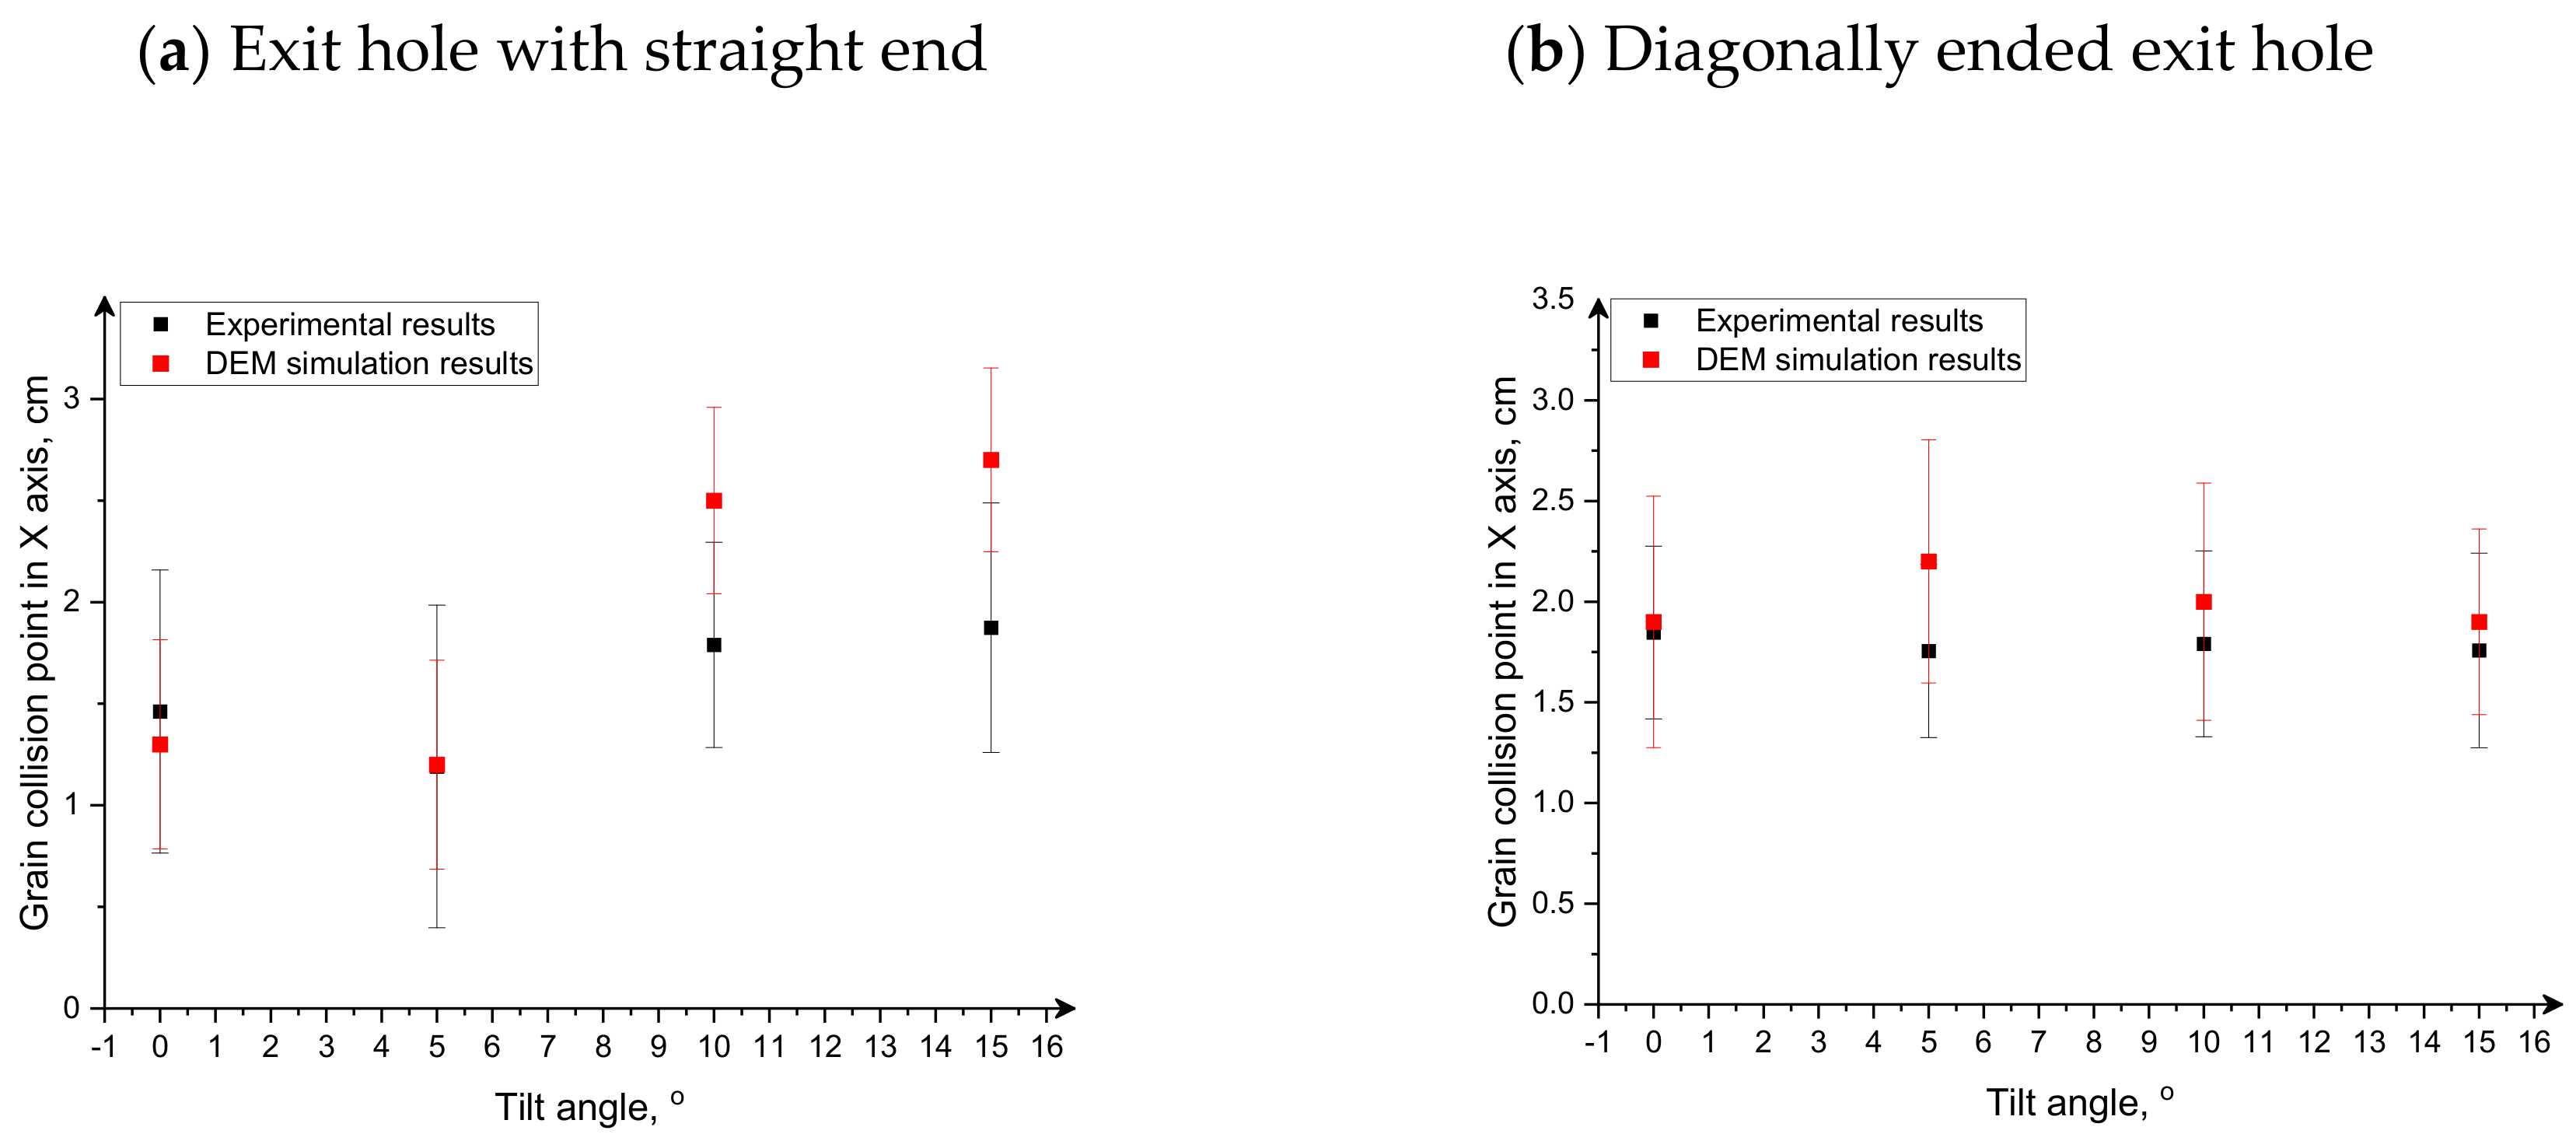
3. Results and Discussion

The tests involved determining the coordinates of the collision point with the sensor surface and the relative error of the sensor detection indications for grains fed into the seed delivery tube. Based on the results, changes in the values of the collision point coordinates and grain flight length along with the tilt angle were observed which is presented in Figure 8, Figure 9 and Figure 10. Experimental tests of straight and diagonal exit ends provided high values of the correlation coefficient for collision points X and Y and grain flight length X0 (Table 3), though not all values were statistically significant which could have been caused by a small sample size (four values of tilt angle). An analysis of correlation showed that for the straight exit hole the coordinate of the grain collision with the sensor in axis X and grain flight length were positively correlated with the tilt angle, whereas the collision point coordinate in axis Y was negatively correlated (Table 3). In the case of a diagonal opening, coordinates of the collision point in axis X and Y were negatively correlated, whereas the flight length was correlated positively with the tilt angle (Table 3). Similar correlations between the variables were obtained for the straight exit hole from a simulation analysis in RockyDEM (Table 4). For the diagonal exit end, the results of a correlation analysis in DEM simulation differed from those obtained from the experiment. Contrary to experimental tests, there were negative correlations (though statistically insignificant), between the collision point coordinates on axis Y and the grain flight length after the impact (Table 4).
Comparing the values of the collision point coordinates and the coordinate of the grain flight finish provided by DEM simulations and experimental tests for different exit ends and tilt angles it should be said that the results are similar, however, some differences occurred which is reflected by the non-overlapping ranges of the values of the coordinates presented in Figure 9, Figure 10 and Figure 11. These differences can be the effect of simplifications of the models used in the simulation software, calculation errors, and the uncertainty of the simulation input data. In this case differences in the collision points and grain flight length in experimental and simulation tests are caused mostly by initial assumptions and input data regarding the feed material [42]. A constant grain diameter equal to 2.2 mm was assumed and the rape grain shape was assumed to be an ideal sphere. In reality, rape grains differ in terms of size (diameters in the range 1.8–2.2 mm) and shape as sometimes they do not make ideal spheres. Seeds of biological materials are characterized by significant shape diversity within one species and a wide range of values for one feature, as found in previous studies [43,44]. Diversity of the grain shapes has a significant influence on the grain flight destination point because the grain shape includes, among others the following: angle of impact with the sensor surface which affects the length of flying as well as inertia moments that cause rotation of the grain around its own axis upon collision. Moreover, the impact parameters are affected by the coefficients of restitution, rolling, and dynamic friction accepted in the simulation which in reality are not constant for rape grains, and in this case a constant value was accepted for each grain in the simulation. As proven in [45], the coefficient of restitution, depending on the grain size, allows the grain speed after the impact to be determined which in turn has a large influence on the grain flight range.
Figure 12 and Figure 13 show the results of analysis of the wrong indications of the piezoelectric sensor depending on the dosing tube tilt angle and the exit hole end shape obtained from the experimental and simulation tests using DEM. Both in computer simulation and in experimental tests the largest error of the sensor indication was found for a tilt angle equal to 15°, whereas the smallest one for a tilt angle equal to 0°. It is also noticeable that the sensor indication error increases along with the tilt angle increase in the straight system which is confirmed by the results of a correlation analysis (Table 3 and Table 4). No distinct tendency was observed for the diagonal system in the experimental tests which in turn appeared in the simulation tests (Table 3 and Table 4 and Figure 12 and Figure 13). For a straight system, the simulation and experimental tests show a similar tendency of the indication error to increase along with an increase in tilt angle. Based on the results, it can be said that tilt in the range of 0–5° will provide the grain with single impact against the sensor surface, thereby the least number of wrong indications of all the analyzed configurations. Due to the lower values of error, it would be better to use an exit hole with a straight end. Low values of the sensor indication errors (up to 10%), particularly for small tilt angles (0° and 5°) prove its high grain detection efficiency, comparable with other sensors used in sowing systems e.g., photoelectric [46], fiber [47], or infrared sensors [48]. The whole chamber of a piezoelectric sensor and the end of the exit tube were carried out by fast prototyping methods (3D printing), which again were found to be the best solution in construction of prototype units and elements [49,50].
An advantage of the presented grain detection system with a piezoelectric sensor in the sowing unit is the resistance of its indications to dust while sowing, which may occur when using photoelectric sensors, whereas the accuracy is comparable or higher (the piezoelectric sensor accuracy range in this study for all tilt angles is 70–95% compared to that of the photoelectric sensor described in [46] which is 47–63%). In addition, in this type of sensor the accuracy is independent of the temperature increase, which is observed for fiber sensors [46].
The results show that, the DEM simulation can be a good tool for simulating performance of the sowing system with piezoelectric sensors even with simplifying assumptions. The proposed methodology with an original test stand, a design solution for the sowing unit, and a piezoelectric sensor, as well the results confirming high accuracy of the sensor could be used as a basis for further development of sensors for sowing units and for their design improvement and accuracy, which will significantly improve the efficiency of sowing.

4. Conclusions

This study presents an analysis of grain motion in the sowing system and an analysis of piezoelectric sensor operation efficiency according to an original solution with application to the Patent Office of the RP (P.438435). An analysis of the influence of the seed tube tilt and the exit hole end type on the coordinates of the grain point of collision with the sensor and the indication errors in the amount of sown seeds detected by the piezoelectric sensor was carried out. The results show that the tilt angle has an influence on the coordinates of the grain point of collision with the piezoelectric sensor and its indication errors. Based on the analysis it was found that the seed delivery tube tilt within 0–5° and with application of an exit hole with a straight end reduces the number of wrong indications. Initially, it was assumed that application of an exit hole with a diagonal end would provide lower values of erroneous indications, whereas the results of both laboratory and simulation tests did not confirm this thesis. Low values of the sensor’s erroneous indications (up to 10%), especially for small tilt angles (0° and 5°) prove its high grain detection efficiency comparable with other sensors used in seed drills such as: photoelectric, fiber or infrared sensors and confirm its commercial applicability in rape seeders. Further research is planned for non-spherical seeds to confirm that the chamber proposed for a piezoelectric sensor can be used both for medium size grains such as wheat or rye-wheat and thick grains such as: lupin or peas. Further research should focus on refining a design of the piezoelectric sensor chamber, taking into account the distances of the grain collisions from the sensor surface. Differences in the coordinates of grain collision and post collision flight length and the sensor indication errors along with the inclination of the seed tubes, showing that the grain reflection angle has a significant impact on indication errors, imply that it is worth analyzing the use of sensors of various geometrical forms, e.g., spherical, in further research. Additionally, tests of the influence of vibration, simulating the real conditions during sowing, should be done.

Author Contributions

Conceptualization, Ł.G.; methodology, Ł.G. and W.K.; software, Ł.G. and W.K.; validation, Ł.G. and W.K.; formal analysis, Ł.G. and W.K.; investigation, Ł.G. and T.Z.; resources, Ł.G., M.R. and T.Z.; data curation, Ł.G. and W.K.; writing—original draft preparation, Ł.G., W.K., and A.M.; writing—review and editing, Ł.G., W.K., K.P., and M.R.; visualization, Ł.G., W.K., and A.M.; supervision, Ł.G. and K.P.; project administration, M.R. and K.K.; funding acquisition, Ł.G. All authors have read and agreed to the published version of the manuscript.

Funding

The research was supported by the National Centre for Research and Development under the LIDER VIII programme, project No. LIDER/24/0137/L-8/16/NCBIR/2017.

Institutional Review Board Statement

Not applicable.

Informed Consent Statement

Not applicable.

Data Availability Statement

Data is contained within the article.

Conflicts of Interest

The authors declare no conflict of interest.

References

  1. Gursoy, S.; Ozaslan, C. Evaluating the performance of rotary and tine inter-row cultivators at different working speeds. J. Agric. Sci. Technol. 2021, 23, 1255–1267. Available online: https://jast.modares.ac.ir/article-23-49882-en.html (accessed on 27 December 2021).
  2. Hu, Y.; Wang, X.; He, J. American Society of Agricultural and Biological Engineers; ASABE: Reno, NV, USA, 2009; Volume 24, p. 97204. [Google Scholar] [CrossRef]
  3. Gierz, Ł.; Wiktorowski, J.; Koszela, K.; Przybył, K. Extendable Frame for Cultivation Equipment P. 432535, January 2020. (waiting to be published).
  4. Gierz, Ł.; Kęska, W.; Gierz, S.Z. Folding Beam PL219776, November 2014.
  5. Bulgakov, V.; Ivanovs, S.; Adamchuk, V.; Antoshchenkov, R. Investigations of the Dynamics of a Four-Element Machine-and-Tractor Aggregate. Acta Technol. Agric. 2019, 22, 146–151. [Google Scholar] [CrossRef] [Green Version]
  6. Wojciechowski, T.; Mazur, A.; Przybylak, A.; Piechowiak, J. Effect of Unitary Soil Tillage Energy on Soil Aggregate Structure and Erosion Vulnerability. J. Ecol. Eng. 2020, 21, 180–185. [Google Scholar] [CrossRef]
  7. Gaoming, X.; Ruiyin, H.; Xun, L.; Yijun, Z.; Long, S.; Tao, L. Design and Evaluation of a Half-Precision Sowing and Fertilizing Combined Machine. J. Comput. Theor. Nanosci. 2016, 13, 8081–8087. [Google Scholar] [CrossRef]
  8. Jin, X.-B.; Yu, X.-H.; Wang, X.-Y.; Bai, Y.-T.; Su, T.-L.; Kong, J.-L. Deep Learning Predictor for Sustainable Precision Agriculture Based on Internet of Things System. Sustainability 2020, 12, 1433. [Google Scholar] [CrossRef] [Green Version]
  9. Torky, M.; Hassanein, A.E. Integrating blockchain and the internet of things in precision agriculture: Analysis, opportunities, and challenges. Comput. Electron. Agric. 2020, 178, 105476. [Google Scholar] [CrossRef]
  10. Puri, V.; Nayyar, A.; Raja, L. Agriculture drones: A modern breakthrough in precision agriculture. J. Stat. Manag. Syst. 2017, 20, 507–518. [Google Scholar] [CrossRef]
  11. Peppes, N.; Daskalakis, E.; Alexakis, T.; Adamopoulou, E.; Demestichas, K. Performance of Machine Learning-Based Multi-Model Voting Ensemble Methods for Network Threat Detection in Agriculture 4.0. Sensors 2021, 21, 7475. [Google Scholar] [CrossRef]
  12. Ferrández-Pastor, F.J.; García-Chamizo, J.M.; Nieto-Hidalgo, M.; Pascual, J.M.M.; Mora-Martínez, J. Developing Ubiquitous Sensor Network Platform Using Internet of Things: Application in Precision Agriculture. Sensors 2016, 16, 1141. [Google Scholar] [CrossRef] [Green Version]
  13. New Possibilities with the SeedEye Sensor. Available online: https://www.vaderstad.com/pl/o-nas/aktualnoci-i-prasa/archiwum-wiadomoci/2015/international/nowe-moliwoci-z-sensorem-seedeye/ (accessed on 15 March 2017).
  14. The PRO-SEEDER Counter Photocell Seed Sensor. Available online: https://www.mcelettronica.it/en/product/pro-seeder-seed-counter-sensor/ (accessed on 30 November 2021).
  15. Wu, Y.; Li, X.; Mao, E.; Du, Y.; Yang, F. Design and development of monitoring device for corn grain cleaning loss based on piezoelectric effect. Comput. Electron. Agric. 2020, 179, 105793. [Google Scholar] [CrossRef]
  16. Gierz, L.; Sadej, M. Corrector for Grainy Material Distribution PL230492 (B1), November 2018.
  17. Zu Hoberge, S.M.; Hilleringmann, U.; Jochheim, C.; Liebich, M. Piezoelectric sensor array with evaluation electronic for counting grains in seed drills. In Proceedings of the IEEE Africon ’11, Victoria Falls, Zambia, 13–15 September 2011; p. 12358610. [Google Scholar] [CrossRef]
  18. Kęska, W.; Marcinkiewicz, J.; Gierz, Ł.; Staszak, Ż.; Selech, J.; Koszela, K. Simulation Verification of the Contact Parameter Influence on the Forces’ Course of Cereal Grain Impact against a Stiff Surface. Appl. Sci. 2021, 11, 466. [Google Scholar] [CrossRef]
  19. Zheng, Y.; Liu, Q. Review of techniques for the mass flow rate measurement of pneumatically conveyed solids. Measurement 2011, 44, 589–604. [Google Scholar] [CrossRef]
  20. Swisher, D.W.; Borgelt, S.C.; Sudduth, K.A. Optical Sensor for Granular Fertilizer Flow Rate Measurement. Trans. Am. Soc. Agric. Eng. 2002, 45, 881–888. [Google Scholar] [CrossRef]
  21. Okopnik, D.L.; Falate, R. Usage of the DFRobot RB-DFR-49 Infrared Sensor to detect maize seed passage on a conveyor belt. Comput. Electron. Agric. 2014, 102, 106–111. [Google Scholar] [CrossRef]
  22. Dabbaghi, A.; Massah, J.; Alizadeh, M. Effect of rotational speed and length of the fluted-roll seed metering device on the performance of pre-germinated paddy seeder unit. Int. J. Nat. Eng. Sci. 2010, 4, 7–11. [Google Scholar]
  23. Maleki, M.R.; Jafari, J.F.; Raufat, M.H.; Mouazen, A.M.; Baerdemaeker, J.D. Evaluation of Seed Distribution Uniformity of a Multi-flight Auger as a Grain Drill Metering Device. Biosyst. Eng. 2006, 94, 535–543. [Google Scholar] [CrossRef]
  24. Yu, H.; Ding, Y.; Liu, Z.; Fu, X.; Dou, X.; Yang, C. Development and Evaluation of a Calibrating System for the Application Rate Control of a Seed-Fertilizer Drill Machine with Fluted Rollers. Appl. Sci. 2019, 9, 5434. [Google Scholar] [CrossRef] [Green Version]
  25. Satvik, M.; Kusagur, G.; Arunkumar, T.C. Manjunath, Modelling of smart intelligent material with PZT & PVDF sensor/actuators to control the active vibrations of flexible aluminium mechanical cantilever beams using proportional integral derivative (PID) techniques. Mater. Today Proc. 2020, 37, 2075–2082. [Google Scholar] [CrossRef]
  26. Szczepaniak, J.; Pawłowski, T. Modern methods of agricultural machine designing and veryfication [Współczesna metodyka projektowania i weryfikacji konstrukcji maszyn rolniczych]. Agric. Eng. 2015, 14, 267–275. Available online: https://ir.ptir.org/artykuly/pl/74/IR(74)_1260_pl.pdf (accessed on 27 December 2021). (In Polish).
  27. Chodurski, M.; Dębski, H.; Samborski, S.; Teter, A. Numerical strength analysis of the load-bearing frame of a palletizing robot’s universal head. Eksploat. Maint. Reliab. 2015, 17, 374–378. [Google Scholar] [CrossRef]
  28. Jachimowicz, J.; Wawrzyniak, A. Zastosowanie MES w zagadnieniach kontaktu elementów maszyn. In Application of FEM in the Issues of Contact of Machine Elements; Prace Instytutu Podstaw Budowy Maszyn/Politechnika Warszawska: Warszawa, Poland, 1999; pp. 69–108. (In Polish) [Google Scholar]
  29. Gierz, Ł.; Warguła, Ł.; Kukla, M.; Koszela, K.; Zwiachel, T.S. Computer Aided Modeling of Wood Chips Transport by Means of a Belt Conveyor with Use of Discrete Element Method. Appl. Sci. 2020, 10, 9091. [Google Scholar] [CrossRef]
  30. Bautista, R.C.; Siebenmorgen, T.J. Evaluation of laboratory mills for milling small samples of rice. Appl. Eng. Agric. 2002, 18, 577–583. [Google Scholar] [CrossRef]
  31. Petingco, M.C.; Casada, M.E.; Maghirang, R.G.; Fasina, O.O.; Chen, Z.; Ambrose, R.P.K. Influence of Particle Shape and Contact Parameters on DEM-Simulated Bulk Density of Wheat. Trans. ASABE 2020, 63, 1657–1672. [Google Scholar] [CrossRef]
  32. Ren, B.; Zhong, W.; Jin, B.; Shao, Y.; Yuan, Z. Numerical Simulation on the Mixing Behavior of Corn-Shaped Particles in a Spouted Bed. Powder Technol. 2013, 234, 58–66. [Google Scholar] [CrossRef]
  33. Wojtkowski, M.; Pecen, J.; Horabik, J.; Molenda, M. Rapeseed Impact against a Flat Surface: Physical Testing and DEM Simulation with Two Contact Models. Powder Technol. 2010, 198, 61–68. [Google Scholar] [CrossRef]
  34. Mindlin, R.D.; Deresiewicz, H. Elastic Spheres in Contact under Varying Oblique Force. Trans. ASME J. Appl. Mech. 1953, 20, 327–344. [Google Scholar] [CrossRef]
  35. Luo, X.; Zhao, L.; Zhang, M.; Dong, H. DEM Study on the Effects of Pellet Characteristics on Particle Flow in Rectangular Hopper. Powder Technol. 2020, 373, 476–487. [Google Scholar] [CrossRef]
  36. Horabik, J.; Molenda, M. Parameters and Contact Models for DEM Simulations of Agricultural Granular Materials: A Review. Biosyst. Eng. 2016, 147, 206–225. [Google Scholar] [CrossRef]
  37. Horabik, J.; Beczek, M.; Mazur, R.; Parafiniuk, P.; Ryżak, M.; Molenda, M. Determination of the Restitution Coefficient of Seeds and Coefficients of Visco-Elastic Hertz Contact Models for DEM Simulations. Biosyst. Eng. 2017, 161, 106–119. [Google Scholar] [CrossRef]
  38. Li, B.; Liu, J.; Ma, H.-J. Analysis on the population collision process of seeder based on linear viscoelastic model. Open Cybern. Syst. J. 2015, 9, 1223–1227. [Google Scholar] [CrossRef] [Green Version]
  39. Rusinek, R.; Horabik, J. Selected mechanical parameters of rape seeds. Agric. Eng. 2006, 6, 213–221. Available online: http://yadda.icm.edu.pl/yadda/element/bwmeta1.element.baztech-article-BAR0-0053-0024 (accessed on 27 December 2021).
  40. Makange, N.R.; Ji, C.; Nyalala, I.; Sunusi, I.I.; Opiyo, S. Prediction of precise subsoiling based on analytical method, discrete element simulation and experimental data from soil bin. Sci. Rep. 2021, 11, 11082. [Google Scholar] [CrossRef] [PubMed]
  41. Kat, C.-J.; Els, P.S. Validation metric based on relative error. Math. Comput. Model. Dyn. Syst. 2012, 18, 487–520. [Google Scholar] [CrossRef] [Green Version]
  42. Michałek, T. Method of assessing the reliability of numerical simulations of viscous and thermal flows. In Metoda Oceny Wiarygodności Symulacji Numerycznych Przepływów Lepkich i Termicznych; Doctoral dissertation; PAN: Warszawa, Poland, 2005. (In Polish) [Google Scholar]
  43. Kruszelnicka, W. Study of Selected Physical-Mechanical Properties of Corn Grains Important from the Point of View of Mechanical Processing Systems Designing. Materials 2021, 14, 1467. [Google Scholar] [CrossRef]
  44. Soyoye, B.O.; Ademosun, O.C.; Agbetoye, L.A.S. Determination of Some Physical and Mechanical Properties of Soybean and Maize in Relation to Planter Design. Agric. Eng. Int. CIGR J. 2018, 20, 81–89. [Google Scholar]
  45. Sandeep, C.S.; Luo, L.; Senetakis, K. Effect of Grain Size and Surface Roughness on the Normal Coefficient of Restitution of Single Grains. Materials 2020, 13, 814. [Google Scholar] [CrossRef] [Green Version]
  46. Liu, W.; Hu, J.; Zhao, X.; Pan, H.; Lakhiar, I.A.; Wang, W.; Zhao, J. Development and Experimental Analysis of a Seeding Quantity Sensor for the Precision Seeding of Small Seeds. Sensors 2019, 19, 5191. [Google Scholar] [CrossRef] [Green Version]
  47. Hajahmed, O.; Tola, E.; Kheiralla, A.F.; Algaadi, K. On-the-go assessment of seed metering unit performance using an opto-electrionic sensor. In Proceedings of the Annual Conference of Postgraduate Studies and Scientific Research, Khartoum, Sudan, 17–20 February 2012. [Google Scholar]
  48. Zhang, X.; Zhang, J.; Xie, S.; Liu, H. Seeder detection system of rapeseed based on infrared emitting diode. J. Agric. Mech. Res. 2012, 4, 156–159. [Google Scholar]
  49. Godec, D.; Cano, S.; Holzer, C.; Gonzalez-Gutierrez, J. Optimization of the 3D Printing Parameters for Tensile Properties of Specimens Produced by Fused Filament Fabrication of 17-4PH Stainless Steel. Materials 2020, 13, 774. [Google Scholar] [CrossRef] [Green Version]
  50. Gonzalez-Gutierrez, J.; Cano, S.; Schuschnigg, S.; Kukla, C.; Sapkota, J.; Holzer, C. Additive Manufacturing of Metallic and Ceramic Components by the Material Extrusion of Highly-Filled Polymers: A Review and Future Perspectives. Materials 2018, 11, 840. [Google Scholar] [CrossRef] [Green Version]
Figure 1. The framework of the conducted research.
Applsci 12 01594 g001
Figure 2. Scheme of a piezoelectric sensor chamber, d—grain exit hole diameter, h—distance between the highest point of the sensor mounting place, H—height of the chamber with sensor, l—length of piezoelectric sensor, c—length between the most protruding point of the sensor and the casing wall, α—tilt angle with the horizontal, a—width of the chamber with sensor, k-seed.
Applsci 12 01594 g002
Figure 3. Scheme of forces affecting grains upon impact with the sensor surface, N–normal force, T–tangential force, G–gravitation force, α–tilt angle of sensor surface, x–the distance the grain collides with the sensor, l–the sensor length.
Applsci 12 01594 g003
Figure 4. Scheme of a laboratory station for tests of the piezoelectric sensor PZT (ceramic): 1. Casing of sensor enabling adjustment of the seed delivery tube tilt angle, 2. Seed dispenser- in the form of a plate with holes, 3. Telescope seed delivery tube (length 65 cm), 4. Fast video camera, 5. Dedicated lighting 2 psc. LED lamp with a stabilization system).
Applsci 12 01594 g004
Figure 5. Scheme of the transport tube tilt (seed delivery tube) and its end at angles: 0°, 5°, 10°, 15°: 1—sensor housing, 2—piezoelectric sensor, 3—exit hole.
Applsci 12 01594 g005
Figure 6. Tested configurations of the exit hole: (a) straight system, (b) diagonal system: 1—sensor housing, 2—piezoelectric sensor, 3—exit hole.
Applsci 12 01594 g006
Figure 8. Geometry of simulation using the discrete element method: (a) straight system, (b) diagonal system.
Applsci 12 01594 g008
Figure 9. Grain collision point measured in axis X for different tilt angles—experimental and simulation results.
Applsci 12 01594 g009
Figure 10. Grain collision point measured in Y axis for different tilt angles—experimental and simulation results.
Applsci 12 01594 g010
Figure 11. Final position of grain X0 after collision for different tilt angles during experimental and simulation tests.
Applsci 12 01594 g011
Figure 12. Relative error of piezoelectric sensor indication depending on its tilt angle in experimental tests.
Applsci 12 01594 g012
Figure 13. Relative error of piezoelectric sensor indication depending on its tilt angle in simulation tests.
Applsci 12 01594 g013
Table 1. Physical properties of rape seeds.
Model Applsci 12 01594 i001
Diameter [mm]2.2
Mass of one thousand seeds [g]3.5
Density [kg/m3]631
Young’s modulus [MPa]700
Poisson coefficient0.3
Mass flow [kg/h]10
Table 2. Rape grain contact parameters used in the simulation.
ParameterParticle-ParticleParticle-Surface
Restitution coefficient0.50.6
Tangential friction coefficient0.60.8
Dynamic friction coefficient0.20.2
Table 3. Analysis results of correlation between tilt angle of the exit hole and the grain collision point coordinates and sensor indication error in experimental tests.
Type of Exit HoleFactorXYX0Relative Error
Straight exit holePearson Corr.0.755−0.7860.7520.867
p-value0.2450.2140.2480.133
Diagonal exit holePearson Corr.−0.701−0.958 *0.933 *0.058
p-value0.2990.0420.0670.942
* statistically significant correlation for p < 0.1.
Table 4. Analysis results of correlation between tilt angle of the exit hole and coordinates of the grain collision point and the sensor indication error in simulation tests.
Type of Exit HoleFactorXYX0Relative Error
Straigth exit holePearson Corr.0.905 *−0.8730.6851.000 *
p-value0.0950.1270.315-
Diagonal exit holePearson Corr.−0.183−0.667−0.8940.944 *
p-value0.8170.3330.1060.056
* statistically significant correlation for p < 0.1.
Publisher’s Note: MDPI stays neutral with regard to jurisdictional claims in published maps and institutional affiliations.

