1. Introduction
Facing the challenges to keep global warming below 1.5 °C by 2050, the so-called German “Climate Cabinet” negotiated a climate package that added sufficient new substance to existing agreements to get the opportunity to address the United Nations General Assembly in lieu of the UN Climate Action Summit in September 2019. Publicly challenged for its ambition and doubtful impact, the package finally passed in late 2019 under several conditions, including increasing the proposed CO
2-levy starting in January 2021 to 25 EUR per ton of CO
2-equivalents (CO
2-eq.) emitted [
1,
2,
3].
Simultaneously, the UN Summit led to pledges by the business and financial sector, as well as regional and country players, to reach net-zero carbon (reducing carbon emissions and levelling residual carbon emissions through compensation) by 2050. A third of the global banking sector pledged to work to achieve the Paris Agreement goals, and companies with a capitalisation of 2 trillion euros united to commit to manage their companies to achieve climate targets [
4,
5].
In awareness of the relevance of both the climate package and the UN Climate Action Summit and their likely impact on the industrial sector, along with the frequent referrals by politics on the alleged position and situation of industry towards both the climate package requirements and decarbonisation, the Institute for Energy Efficiency in Production (EEP) chose to tailor its October/November 2019 data collection for the Energy Efficiency Index of German Industry (EEI), to capture the actual opinion of the German manufacturing industry on these issues [
6] at the height of the discussion and public attention, and ahead of the United Nations World Climate Conference COP25 in Madrid. In this paper, which builds and extends on a conference paper presented at the ECEEE Industrial Efficiency 2020: Decarbonise Industry! Conference [
7], we focus on the EEIs outcomes in relation to decarbonisation.
The importance of decarbonisation of manufacturing industries has been highlighted by scholars for several years [
8,
9]. Decarbonising industries is a complex societal problem and studies on this issue have been accumulating in recent years.
Labanca et al. [
10] distinguish between three approaches to the study of industrial decarbonisation, namely energy system analysis (1), policy studies (2), and (3) sustainability transition research.
Energy system analysis (1) is about providing a technical understanding of what is feasible and technically required to achieve certain predefined goals and relating this to the sociotechnical context and policy requirements [
10]. Scenario studies [
11], technology potential studies [
12], and studies on barriers or drivers for energy efficiency measures [
13] are typical of this approach.
Policy studies (2) are devoted to developing and examining policy processes and instruments [
10,
14]. Characteristic for this field are, for example, studies on energy efficiency programmes [
15] or policy pathways to net-zero emissions industries [
16].
On the other hand, sustainability transition research (3) draws attention to conceptualising, explaining, and governing sociotechnical transitions towards sustainability [
10,
17]. In contrast to energy system analysis, sustainability research expands its perspective beyond technology diffusion to behavioural, institutional cultural changes. Typical for this strand of research is the assumption that decarbonisation is not a mere question of the availability of technology or individual choices. For Sovacool [
18] (p. 372), for example, culture and its institutions are the “most surreptitious, yet powerful” barriers to renewable energy and energy efficiency. Similarly, König [
19] emphasises the institutional and cultural context of decision-making in industrial organisations, whereas Rhodin and Thollander [
20] underline the importance of corporate culture for the efficacy of measures within industrial enterprises.
Against this background, our study aims to contribute to the recent sustainability transition research. Labanca et al. [
10] (p. 1) argue that current research approaches on decarbonisation are oftentimes too narrow, mostly because they rely on the assumption that energy supply and demand can be addressed exogenously and separately. Similarly, we assume that the aspirations industrial organisations have and the actions they take must not be considered as independent from their broader cultural and societal context.
To create a better understanding as to why the decarbonisation of the industrial sector is of particular relevance in avoiding climate change, it is helpful to observe Germany’s energy consumption and emission statistics. The share of industrial energy consumption (28.0%) is about as high as in the building sector (26.5%) and less than in the transport sector (30.6%) [
21]. The industrial sector accounted for 18.4% of energy-related greenhouse gas emissions (GHG) in Germany, in 2019 [
22]. Furthermore, considering process-related emissions, which make up about a third of industries’ overall greenhouse gas emissions, the percentage share rises to 23.1% of Germany’s GHG emissions, which is the second highest after the energy sector (31.9%) and more than the GHG emissions of the transport (20.2%) or buildings sector (15.2%) [
23]. Unlike the latter two, the industrial sector decides on optimisations and investments on a daily basis, whereas the timespan of action for buildings and transport can be decades (i.e., heating systems, buildings, tractors, trucks, and ships). Furthermore, nearly everything leading to emissions in all sectors (except livestock) has been in a factory at one point; for instance, entrepreneurs decide upon how products are designed and produced, where the raw materials come from, and how products, components, and equipment perform and can be recycled—therefore, the industrial sector, in the long run, is the key to making net decarbonisation feasible by 2050.
Thus, this study focuses on the question of how manufacturing companies in Germany react to the increasing societal pressure for decarbonisation. Doing this, we analyse the situation from the companies’ perspectives, in particular, by exploring what measures (if any) companies (plan to) undertake to tackle their carbon footprint and by when.
The findings of this study are of particular relevance to policymakers, as they underline that urgent policy action is needed to facilitate the pace of decarbonisation aspired by responding companies. It further presents valuable insights to companies, regarding where they are situated in contrast to their peers, as well as to facilitators and service providers, as these obtain a clearer view regarding the kind of support that might be needed by what type of company and when, and also to the general public that gains a better understanding of the actions, ambitions, needs, and complexities of the industrial sector.
The study showcases the differences across the various types of companies that call for approaches, other than “one size serves all” ones. By taking an all-round view on the findings, this study also uncovers a series of issues that call for further attention to support companies, service providers, and policymakers in successfully decarbonising the industrial sector in Germany and subsequently—due to also reducing the product carbon footprints of the produce of industry—the other sectors.
2. Methodology
This study builds on data gathered in the framework of the Energy Efficiency Index of German Industry (EEI). Introduced in 2013, in reaction to the lack of “targeted energy efficiency analysis” and “presented as an index for industry as a whole and especially the manufacturing sector” [
24], EEI’s methodology leans on the general approach of the German monthly economic indicator, the ifo-Index [
24], and focuses on opinions, experiences, expectations, and intentions of entrepreneurs from across 27 sectors and different company sizes.
In 2017, around 540,000 manufacturing companies (178,000 of them in the 27 most relevant subsectors) employed 10.25 million people and created a revenue of almost 3.07 trillion euros [
25] (p. 524). The data set examined in this paper contains answers of 915 companies and was gathered in October/November 2019—briefly after the September 2019 United Nations Climate Action Summit and the announcement of the German climate package.
Focussing on current issues at each of the semi-annual data collections, the 2nd data collection of the EEI in 2019 looked, in particular, at the position of the German manufacturing industry in respect to the German climate package and decarbonisation [
6]. Among 28 questions in total, companies were asked to indicate the number of employees, energy consumption, revenue, and sector (with their largest share of revenue), to allow an analysis and cross-referencing of these parameters with current-topic question results. However, energy consumption and revenue in particular are considered confidential and were not provided by a significant number of respondents, explaining the different number of observations in the analysis to come.
The data collection was carried out using a mixed methods design, combining telephone and online surveys.
Table 1 provides an overview of the sample by company size, as defined by the European Commission [
26]. For the EEI samples, we purposely aim for an approximately even distribution across company sizes rather than following the actual size distribution of manufacturing companies in Germany [
25] (p. 526), to allow us to make statements for all company sizes.
An even distribution across the relevant 27 manufacturing sectors (that represent 178,000 companies) was desired, but difficult to achieve. Therefore, several so-called core industries, from which at least 25 companies should participate, were defined in context of the telephone survey. These include sectors, such as mechanical engineering and automotive, which are considered to be very important for German industry. The sectoral analyses in this paper only feature sectors with, overall, at least 20 participating companies providing answers to the respective questions. Micro sectors’ (with a total population (N) smaller than 10, N < 10) results are taken note of (‘**’), when more than 50% of the sector participated in this study; similarly, the results of small sectors (N < 100) are taken note of (‘*’) when at least 15% of the sector participated. The sectors are coded according to NACE, the
‘Nomenclature générale des activités économiques dans les Communautés Européennes’ (General Industrial Classification of Economic Activities within the European Communities), whose use is mandatory in the European Union and is in compliance with the global ISIC system (United Nations’ International standard industrial classification of all economic activities) [
27,
28,
29].
Responding companies are asked to indicate whether their responses are on behalf of their overall company or one specific site. Of the overall 915 observations, 686 refer to one specific site and 199 refer to multiple sites.
Table 2 gives an indication of what percentage of the total number of companies in a sector participated. In very small sectors, such as the “crude petroleum and natural gas” sector (06), the percentage may appear to exceed 100%. In this case, 3 out of 7 responses refer to multiple sites while 4 refer to one specific site, leading to the assumption that all 4 companies in the sector responded—one by site and the other 3 by company.
As we assume that the position and intended action of companies towards the calls to decarbonise differ, depending on the energy intensity of a company, we computed the energy intensity for each company, where possible, and clustered these into five intensity classes. It could be argued that energy intensity is an inadequate measure as it cannot take into account the added value, and, therefore, the cost share of energy in relation to total costs should be applied instead. In theory, this would make sense. However, gaining access to this type of data would, in practice, be quite difficult to accomplish.
The energy intensity is calculated as the ratio between the energy used and the revenue of a company. The variable “energy use” contains information on the overall energy demand of a company (converted) in megawatthours (MWh), while the variable “revenue” provides information on the revenue of a company during the previous financial year in million euros. The results of this operation cover a wide range, which counts 688 cases and extends from 0.0001 to 10,000 watthours (Wh) consumed per euro of revenue (Wh/EUR) for this sample.
In order to classify the variable “energy intensity”, corresponding values have been grouped into five classes, as illustrated in
Table 3. The lower (higher) the class of variable energy intensity, the higher (lower) the energy productivity level of an industry. Energy efficiency is a key measure to increase energy productivity. Since only ten of the energy intensity observations fall into the fifth class, there are not enough cases (n ≥ 20) to include this class in the analysis conducted on the EEP 2019 survey data. For this reason, the analysis in this paper will feature just four energy intensity classes.
3. Results
3.1. How Do Companies React to the Rising Societal Pressure and Emerging Policies?
German industry, as many others, suffered from a shortage of skilled personnel ahead of the COVID-19 pandemic, meaning the demand for them exceeds the supply, allowing, in most cases, young graduates, to choose where to start working. A McKinsey study has identified that sustainability has become a more important factor than salary or job security, and that similarly, according to a YouGov online poll, 68% deem sustainability action by their employer as important [
30].
Unsurprisingly, companies increasingly state sustainability as a significant element of their corporate strategy to address this (e.g., Daimler and Henkel), but what does this mean? Is it a marketing activity, which, if uncovered, would have a negative impact on image and sales (i.e., ‘greenwashing’)? Or are there real intentions to take action? According to a member of the board of the Federal German Working Group for Environmentally Conscious Management (Baum), “family-run SMEs[’] and start-ups[’] environmental efforts are often more authentic than [..] Dax corporations[’], because the owner family acts sustainably with an inner conviction” [
30].
Those large companies, however, that pledged at the UN summit, have a longer history of corporate culture that is positive towards climate change measures and are often companies that customers recognise well, i.e., good corporate social responsibility matters a lot to their marketing strategy [
4].
Many other companies made announcements or teamed up, such as the “entrepreneurs for future”, comprised of over 2500 German SMEs that want to position themselves and make use of the arising chances as early movers, as well as “Leaders for Climate Action”, that bring together a number of known brands [
31].
Since the companies were surveyed, this momentum has steadily increased despite the COVID-19 pandemic, and several voices comment that industry is progressing quicker than policy makers. During the negotiations to form a new German Federal Government and ahead of COP26 in Glasgow, for instance, 69 of the largest German companies called the negotiating political parties for more concrete measures [
32].
3.2. What Measures Do Companies Take to Tackle Their Carbon Footprint?
Whilst pledges are already a reaction, they only work and do not backfire when real action follows. We therefore identified a number of practical measures that could be undertaken to reduce the carbon footprint of a company and their products.
3.2.1. What Measures Do Companies Take to Reduce the Footprint of Their Company, Products and Supply Chain?
The “reduction of energy consumption through energy efficiency measures”, as well as the “self-generation of renewable energies”, can be considered as feasible internal measures, whilst the “purchase of renewable energies”, “compensation measures”, and a “CO2 optimisation of the supply chain” are external measures. To allow responders to name additional measures, the option “others” was provided, as were “not known” or “no action”. With just a 1% share of “others”, it can be assumed that the range of options provided covered all the relevant answer options. As the measures provided are not excluding each other, the choice of multiple measures was provided to the 858 companies responding to this question, who on average selected two of them. The total number of choices made by the companies (n) is denoted as n’.
The majority of measures chosen to reduce the carbon footprint are internal actions.
Across all companies, 54% of the measures reported are
internal actions, with 33% energy efficiency measures, and 21% self-generation of renewables. Looking at this from a
company size perspective (cf.
Figure 1a), the range of internal measures varies from 57% in large companies to 49% in micro companies, due to a larger share of efficiency measures in medium-sized and large companies (35%) in comparison to the smaller company sizes (32% and 30%). The higher emphasis on efficiency measures may be due to larger companies’ increased means for dedicated personnel dealing with energy efficiency and related topics.
From a viewpoint of
energy intensity, internal measures vary from 53% to 56%, with a gradual increase from non- (53%) to energy intensive companies (56%). With a share of 37%, the energy efficiency measures of energy intensive companies significantly outrank those of the other intensities (33%), potentially as a result of the energy management system obligation for (energy intensive) companies seeking to qualify for levy reliefs. Another reading is that energy intensive companies in particular have an interest in driving down their high energy costs, making up a much higher share of overall costs than in other companies and, hence, being in the focus of continuous optimisations of the cost structure. Similar to the company size review, the share for self-generation is fairly constant at around 20% across all energy intensity classes (cf.
Figure 1b).
Reviewing the responses by sector, the situation differs completely and offers a large spread for internal measures, ranging from 42% (“manufacture of pharmaceutical products”) to 66% (“beverage production”), underlining the different situations across the manufacturing sectors and the subsequent need for something other than “one-size-fits-all” policies.
The share of neither energy efficiency measures, nor self-generation follow this pattern in a linear or parallel way. On the contrary, it fluctuates largely from 24% (“other vehicle construction” and “production of textiles”) to 43% (“manufacture of other goods”) for energy efficiency measures. Even though only 13 companies of the “coke and refined petroleum” sector responded, they represent 15% of 84 companies in this small sector [
25] (p. 524), and, therefore, their 42% should be noted. This allows us to confirm the hypothesis previously made on energy intensity: the levy relief affects the cost of energy, but not the amount of emissions, which in the “coke and refinery” sector stems mainly from non-electric sources. For self-generation of renewables, shares fluctuate from 12% for that very sector (noting the 11% of the 5 responding “coal mining sector” companies that represent 71% of the sector [
25] (p. 524))—confirming the assumption regarding the source of energy—and the “manufacture of furniture” to 33% (“beverage production”). For the latter, as well as the “production of textiles”’ sector (30%), the share of companies deciding to generate their own renewable energy is about a third higher than in the other ones that, with one exception (“printed products”), do not exceed 23% (cf.
Figure 1c).
How do companies differ when it comes to external forms of intervention to reduce their carbon footprint?
Looking at the external forms of intervention to reduce the carbon footprint, the purchase of renewable energy (18%) outranks the CO2 optimisation of the supply chain (13%) and compensation measures (10%). No measures are undertaken by just 3% of the companies in that sample.
Figure 1a illustrates just marginal deviations, when looking at the purchase of green energy and compensation measures from a
company size viewpoint. This said, for compensation measures, micro companies lead the board (12%), leaving medium sized companies (8%) behind. The data indicates that the measured CO
2 optimisation of the supply chain does not depend so much on company size; deviating only marginally, it is chosen more often by small and medium-sized (14%) than by large (12%) and micro companies (11%). The degree of inaction is largest with micro companies (6%) but hardly visible for small companies (2%), indicating that, amongst smaller companies, the micro ones may need the most support regarding the reduction of their footprint (cf.
Figure 1a).
The self-generation of renewables is fairly similar when looking at
energy intensity that only the energy intensive companies generate to a slightly lesser degree than the others. Only small differences occur looking at the degree to which compensation measures are chosen; for non-energy intensive and moderately energy intensive companies (11%) it is slightly greater than for less energy intensive and energy intensive companies (9%). For non- and less energy intensive companies, comparatively low costs and corporate social responsibility considerations may be motivators; for energy intensive companies it may be difficult to reduce their carbon footprint by optimising their supply chains, as it is in the nature of energy intensive companies that the majority of emissions occur on site. Therefore, it is not surprising that this share increases by 50%, with decreasing energy intensity from 10% to 15% (cf.
Figure 1b).
Again, the variability is higher when looking at the
sectors. However, the purchase of renewable energy only fluctuates between 15% and 22%, with two outliers, “manufacture of glass and ceramics” (10%) and “manufacture of other goods” (26%). Compensation measures, however, significantly vary from 5% (“food products” and “other goods”) to 19% (“other vehicle construction”, followed by “other mining and quarrying”, i.e., extraction of stone and earth, and the “non-metallic mineral products” sector, i.e., glassware and ceramics)—“coal mining” would rank first at 22%, again pointing to more energy intensive sectors with difficulties to decarbonise through other means. Externalisation of decarbonisation efforts to the supply chain also deviates significantly: from 5% (“printing and media reproduction” and “other goods”, followed by again “glassware and ceramics”, “beverage production”, as well as “extraction of stone and earth”) to 19% (“pharmaceutical products”, followed by “food products”). Here, however, there is a broad “midfield” ranging from 8% to 15%. It is striking that there are a few sectors with nearly twice the average percentage of inaction, all between 6% (“rubber and plastics”), and 11% (“furniture”), with “pharmaceutical products” in-between. All of these are sectors, for which reducing the footprint is challenging as either the share of non-electric energy is much higher, or emissions are released due to the nature of the process (cf.
Figure 1c).
3.2.2. Do Companies Take Energy and Resource Consumption, and CO2 Footprint into Account When Developing New Products?
Energy and resource consumption, as well as the CO2 footprint of new products (in their production and use), largely determine the long-term energy and resource needs and emissions for the industrial sector. Beyond this, they also largely impact on the footprint of the sector or location in which these products are used, as well as the transport, housing, and energy sector. Therefore, it is crucial to explore how the manufacturing sector deals with this responsibility.
Nearly half of the 856 companies (45%) responding to this question indicated that they consider these factors in shaping their production process. Of the 36% taking into account the full product life cycle, only a third also looks into the production process, and only a quarter does so vice versa. Intuition would have suggested that those who look into the life cycle do, to a large extent, consider the production itself as well. This identifies a potential weak point in the wording of the question, where some of the 36% of companies may have considered the options as mutually exclusive and others may have not, which can find support in a low rate of 12% of companies providing 2 answers and calls for further analysis. That said, only 15% considered neither option.
Looking at the
company size (cf.
Figure 2a), a significant share of large and small companies exceed (49/50%) the average of 45% of companies taking production into consideration, whilst the opposite is the case for micro companies (38%), possibly due to the limitations they face with the machinery they possess and have in use longer than larger companies because of investment costs. The same applies in relation to not considering either factor (18%), with 13% and 10% for small and large companies. In relation to the overall lifetime of products, the situation switches around with micro companies being ahead of the average (39%)—potentially due to the nature and complexity of the product, e.g., a gasket versus goods whose use leads to energy consumption but is equally possible due to a decision by principle by the owner of micro companies.
Among all except the
energy intensive companies (35%), a consideration of energy, resources, and CO
2 footprint takes place in nearly half of the companies (48–49%), whereas the not and less energy intensive companies (39%) consider the product life cycle only moderately more often than moderately and energy intensive companies (35%). The share of companies not taking account of the associated energy and resource consumption, as well as the CO
2 footprint when developing new products increases nearly threefold from not energy intensive (9%) to energy intensive companies (24%), again pointing to process and technical limitations in doing so (cf.
Figure 2b).
“Beverage” and “paper and paper products”
sectors, (58%), as well as “printed matter and reproduction of media” (57%) and “other goods” sectors (54%) well exceed the average in relation to a consideration of the production process of newly designed products, whereas “textiles” (32%), “pharmaceutics”, and “glassware and ceramics” sectors (36%) fall significantly short. The entire life cycle, however, plays an above average role in the “textiles” (52%) and “pharmaceutics” sectors (45%), both sectors whose product portfolio is typically worn or consumed rather than used in an emitting manner. The life-time performance is of least relevance in the “other goods” sector (cf.
Figure 2c).
The share of companies taking no consideration is by far the highest in the “glassware and ceramics” sector (25%)—understandable as, once the product exists, it rarely emits anything and can often easily be recycled. On the other hand, the lowest share of companies not considering the performance can be found in the “beverage” and “textiles” sectors (4%), followed by the “chemical” (7%) and “paper and paper products” sectors (8%) (cf.
Figure 2c).
Having assessed the consideration of environmentally relevant factors in shaping new products in principle, it is important to establish which one is assigned with the highest priority.
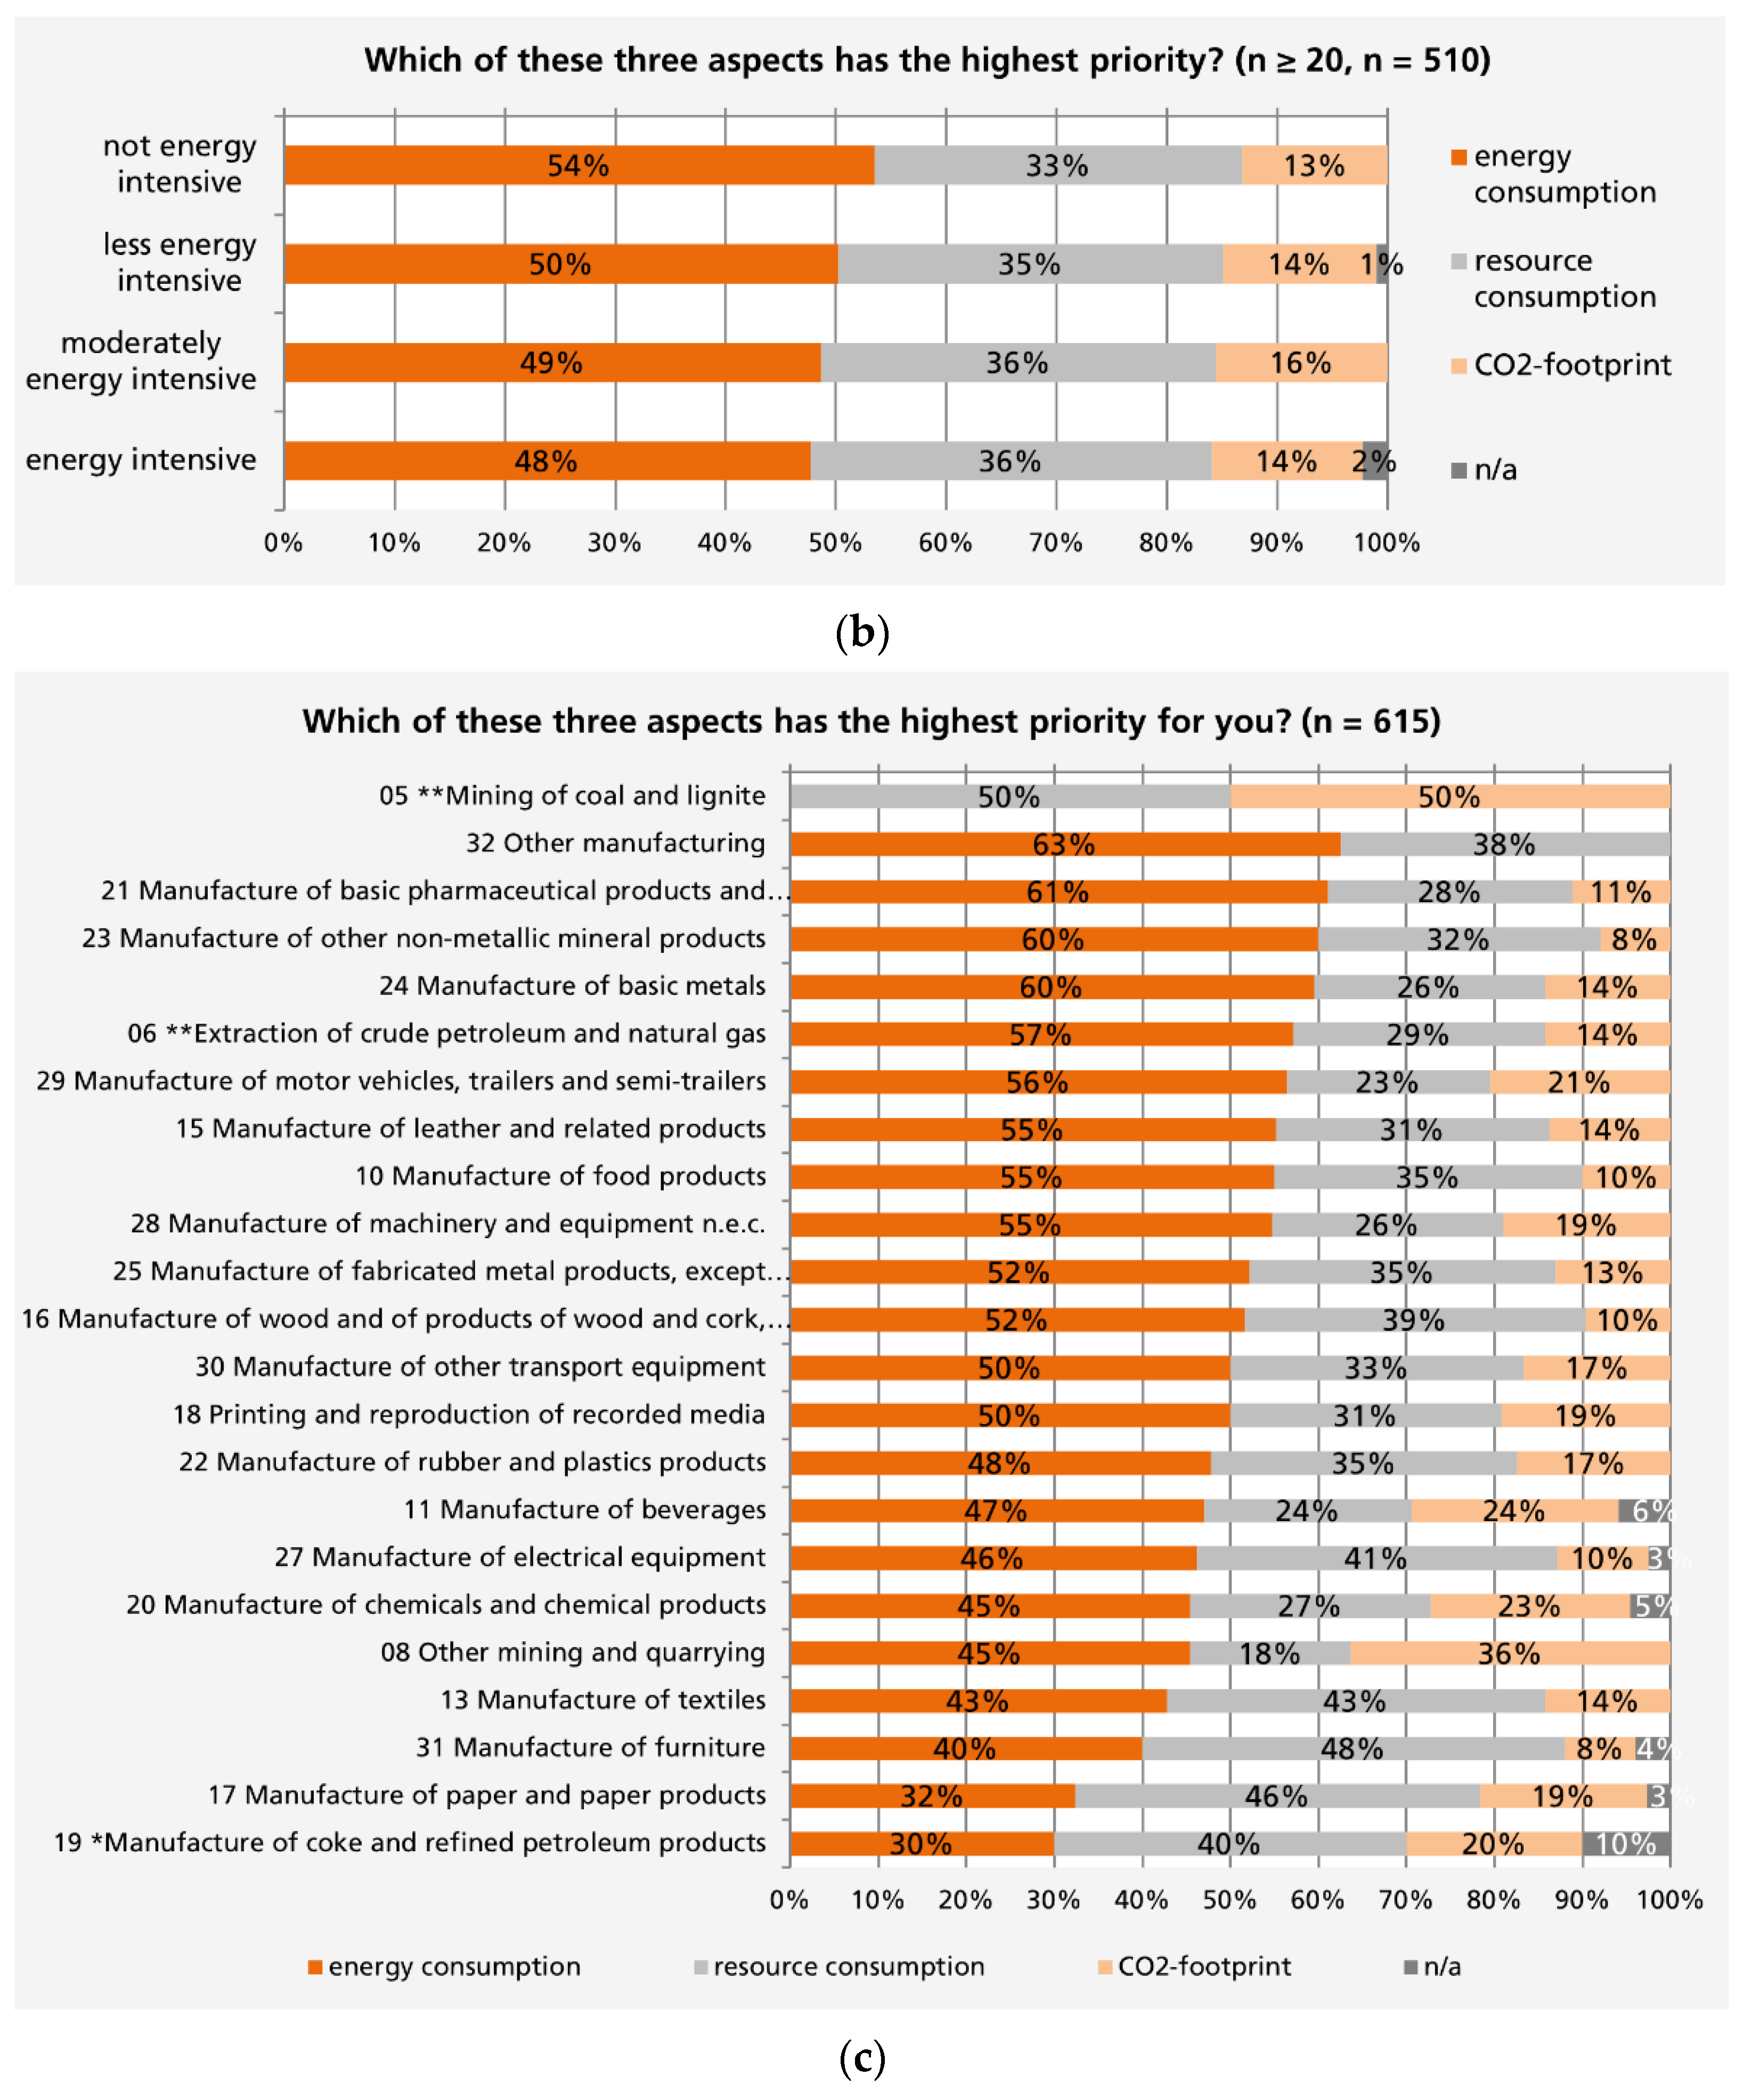
3.2.3. If Considered, Which of the Three Aspects Has the Highest Priority?
Half the companies follow the path of efficiency first, as an energy consumption reduction subsequently leads to a smaller carbon footprint. Resource consumption has the highest priority for a third of the companies, whereas the footprint itself is the leading factor in only 16% of the cases, perhaps as saving costs is the primary driver so far.
Among micro companies (56%), the priority of energy consumption reduction is highest, whereas it is the lowest for small companies (45%). Resource consumption, however, plays a significant role in small companies (39%) and a much smaller one in large companies (26%)—possibly, as many small companies manufacture products with a higher likelihood of scrap and waste, whereas large(r) companies often “just” combine the specific parts they have ordered from their supply chain. As large companies are more visible and often—if also energy intensive—falling into the European emission trading system (EU ETS) [
33], the share of companies prioritising the CO
2 footprint is highest in that group (21%), and, for the same, reason lowest for micro companies (9%) (cf.
Figure 3a).
For non-energy intensive companies, energy consumption has the highest priority (54%). This decreases with increasing
energy intensity to 48%, whilst the priority of resource consumption increases with increasing energy intensity from 33% to 36%—for the more energy intensive companies it may be easier to reduce the amount of resources than the amount of energy needed for a new product, as significant reductions in energy demand would require a complete redesign of the way they are manufacturing their product, i.e., the transformation in the steel industry towards hydrogen instead of coke as agent. The priority of the carbon footprint is similarly low across intensities, deviating from 13% (not energy intensive) to 16% (moderately energy intensive), possibly as both energy and resource consumption directly impact on the CO
2 footprint and promise to reduce costs, whilst primarily looking at the footprint does not necessarily do so (e.g., switching to green energy) (cf.
Figure 3b).
In respect to
sectors, energy consumption plays the biggest role, by far, in the “glassware and ceramics” and “metal production and processing” sectors (60%), and is least often regarded as the highest priority by the “paper and paper products” sector (32%), followed by the “furniture” sector (40%), where, in return, resource consumption (46/48%) is most often of the highest relevance, and least often in the “extraction of stone and earth” sector (18%). All this is understandable due to the nature of the products manufactured in these sectors. The carbon footprint is by far most often named aspect of the highest relevance in the aforementioned sector (36%), followed by the “chemical” sector (23%)—possibly as both cannot do much about resource and energy consumption without a larger transformation—and least often in the “glassware and ceramics” and “furniture” sectors (8%), followed by the “wood/wood products” sector (10%) (cf.
Figure 3c).
3.3. How Do German Manufacturers React to the Increasing Societal Pressure for Decarbonisation?
Having gained a better understanding of the measures intended and those put in place to reduce companies’ carbon footprint, and about their priorities regarding the development of new products and manufacturing processes for them, the big question remaining is how far companies are actually willing to go.
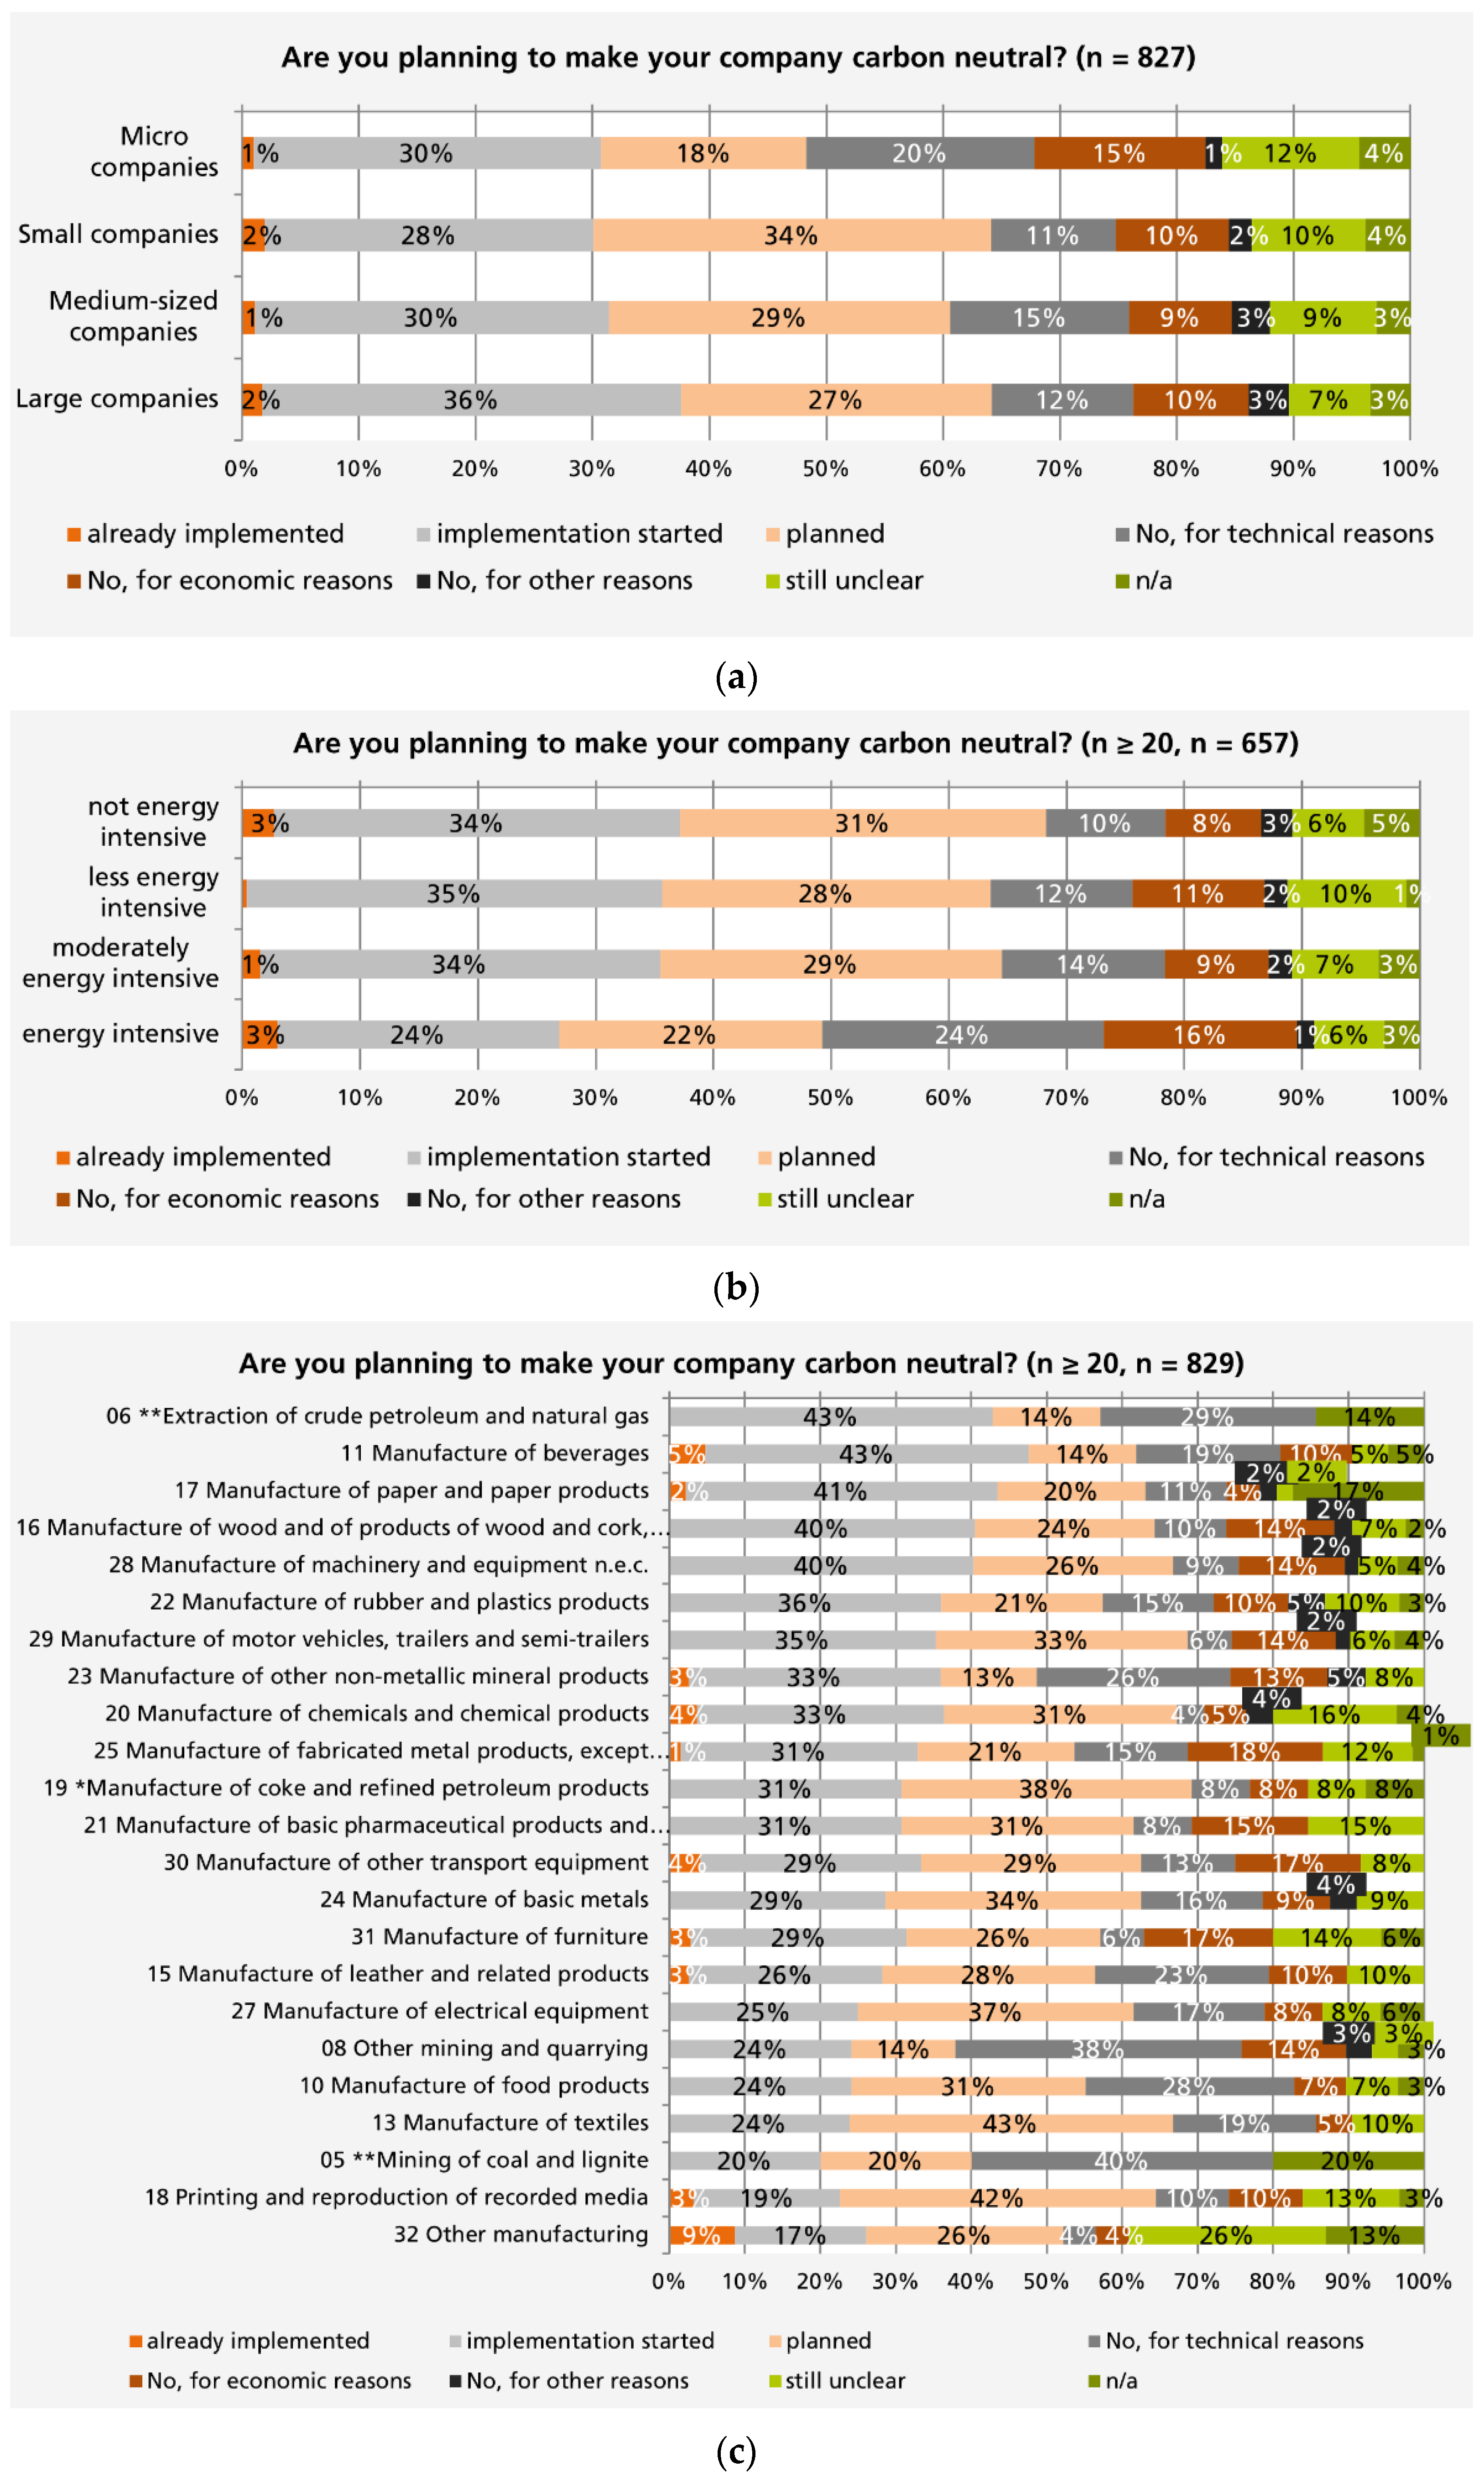
Are Companies Planning to Become Net Carbon Neutral?
In addition to the small number of big companies that pledged to become net carbon neutral, there is a large proportion of the sample that has similar intentions. Nearly 60% of companies either plan (27%), have started (31%), or concluded (1%) the implementation to reach the state of net-zero carbon. The prefix “net” is of particular importance, as the ability to fully decarbonise is limited to a few cases, such as forestry’s, but, at present, impossible for most manufacturing sectors. A total of 28% of companies therefore state that they are not pursuing that road, due to technical (15%), economic (11%), or other reasons (2%). Once carbon has a price across all sectors and company sizes, and is not, as at present, only affecting larger and simultaneously energy-intensive companies via the EU ETS, the share of economic reasons may shrink. Depending on the level of the carbon price, a point may be reached at which process redesigns become an option. The price levels at which process redesigns become an option, however, remain to be further researched.
From a
company size perspective, the ambition to fully decarbonise is higher than average in large (65%) and small (64%) companies, and significantly below average for micro companies (49%), possibly because these may have the greatest difficulties in assessing how to do it (without changing the better part of their machinery). This assumption is underlined by looking more closely at the fairly similar share of companies who have started the implementation across all sectors; here, only the large companies are ahead by 6% points. When it comes to planned action, small companies are greatly above average (34%) and micro companies are significantly below average (18%). It is those companies that have the highest rate of unknowns (12%), in contrast to large companies (7%) that have largely made their decision. Economic reasons are, as alluded to above, a larger issue for micro companies (15%), as are technical reasons (20%), keeping them at a distance from becoming net carbon neutral. To some extent, the latter also applies to above average- to medium-sized companies (15%) (cf.
Figure 4a).
For
energy intensity, the share of companies aiming towards carbon neutrality is unsurprisingly highest amongst the non-energy intensive companies (68%), with moderately (65%) and less energy intensive companies (64%) close behind. As expected, energy intensive companies less often strive towards
net carbon neutrality; however, nearly the majority (49%) does strive towards this goal. Looking more closely at the data, provides a similar picture: energy intensive companies (24%) lag 10% points behind in implementing measures towards carbon neutrality, and 6–9% points in planned action (22%). Technical reasons keep energy intensive companies away from carbon neutrality, 2.4 times more often (24%) than non-energy intensive companies (10%), confirming the assumption made earlier when looking at the development of new products. Similarly, economic reasons are the prohibitive factor for 16% of energy intensive companies, which is twice as many as for non-energy intensive companies (8%), understandable due to the great transformation and costs involved in many cases. The share of undecided companies is highest among less energy intensive companies (10%), and on a lower level for the other intensity classes (6–7%) (cf.
Figure 4b).
The highest share of companies aiming to decarbonise can be found in the “motor vehicles”
sector (69%), followed by the “chemical”, “mechanical engineering”, and “textiles” sectors (67%), and another eight sectors above average, leaving the “extraction of stone and earths” far below (38%), followed by the “glass and ceramics” (49%) and “other manufacturing” (52%) sectors. This, as previously assumed, is due to their limited ability to decarbonise. We face nearly the inverted picture, looking at those who choose not to fully decarbonise, the only difference being that “other manufacturing” presents the lowest share of companies not decarbonising (9%). Simultaneously having the highest share of “still unclear” by a factor of two (25%), reflects the prefix (“other”) of this apparently very inhomogeneous sector. Looking at the numbers with closer attention to progress, the “beverages” (43%), “paper and paper product” (41%), as well as the “wood and wood products” and “mechanical engineering” (40% each) sectors are ahead of all the others, whereas “other manufacturing” (17%) and “printing and media reproduction” (19%) fall behind. The latter, however, nearly leads the board (42%) when considering planned action, together with the “textiles” (43%) and “electrical equipment” (37%) sectors, whilst “glassware and ceramics” (13%) and “extraction of stone and earths” (14%) are falling short, together with the “beverages” (14%) sector. Economic reasons provide the biggest challenge to companies in the “fabricated metals”, “furniture”, and “other vehicles” sectors (18/17%). In line with the previous assessments, technical reasons are most often the reason for the “extraction of stone and earths” sector (38%) to not plan for carbon neutrality, followed by the “food products” (28%), “glassware and ceramics” (26%), and “leather” (23%) sectors, who have all in common that changing the way their goods are manufactured is either not yet possible or requires a bigger changeover in processes and equipment (cf.
Figure 4c).
3.4. Decarbonisation: Yes! But When?
With the carbon countdown running and frequent statements that faster action is required, some companies’ announcements of a 2050 target date, or 2040 (after coal-fired power plants have closed in 2038), appear to fall out of time and may allow us to distinguish between ambitious and marketing pledges, following the statement made by Bosch, mid-2019, that becoming net carbon neutral by 2020 “can be done. Here and Now” [
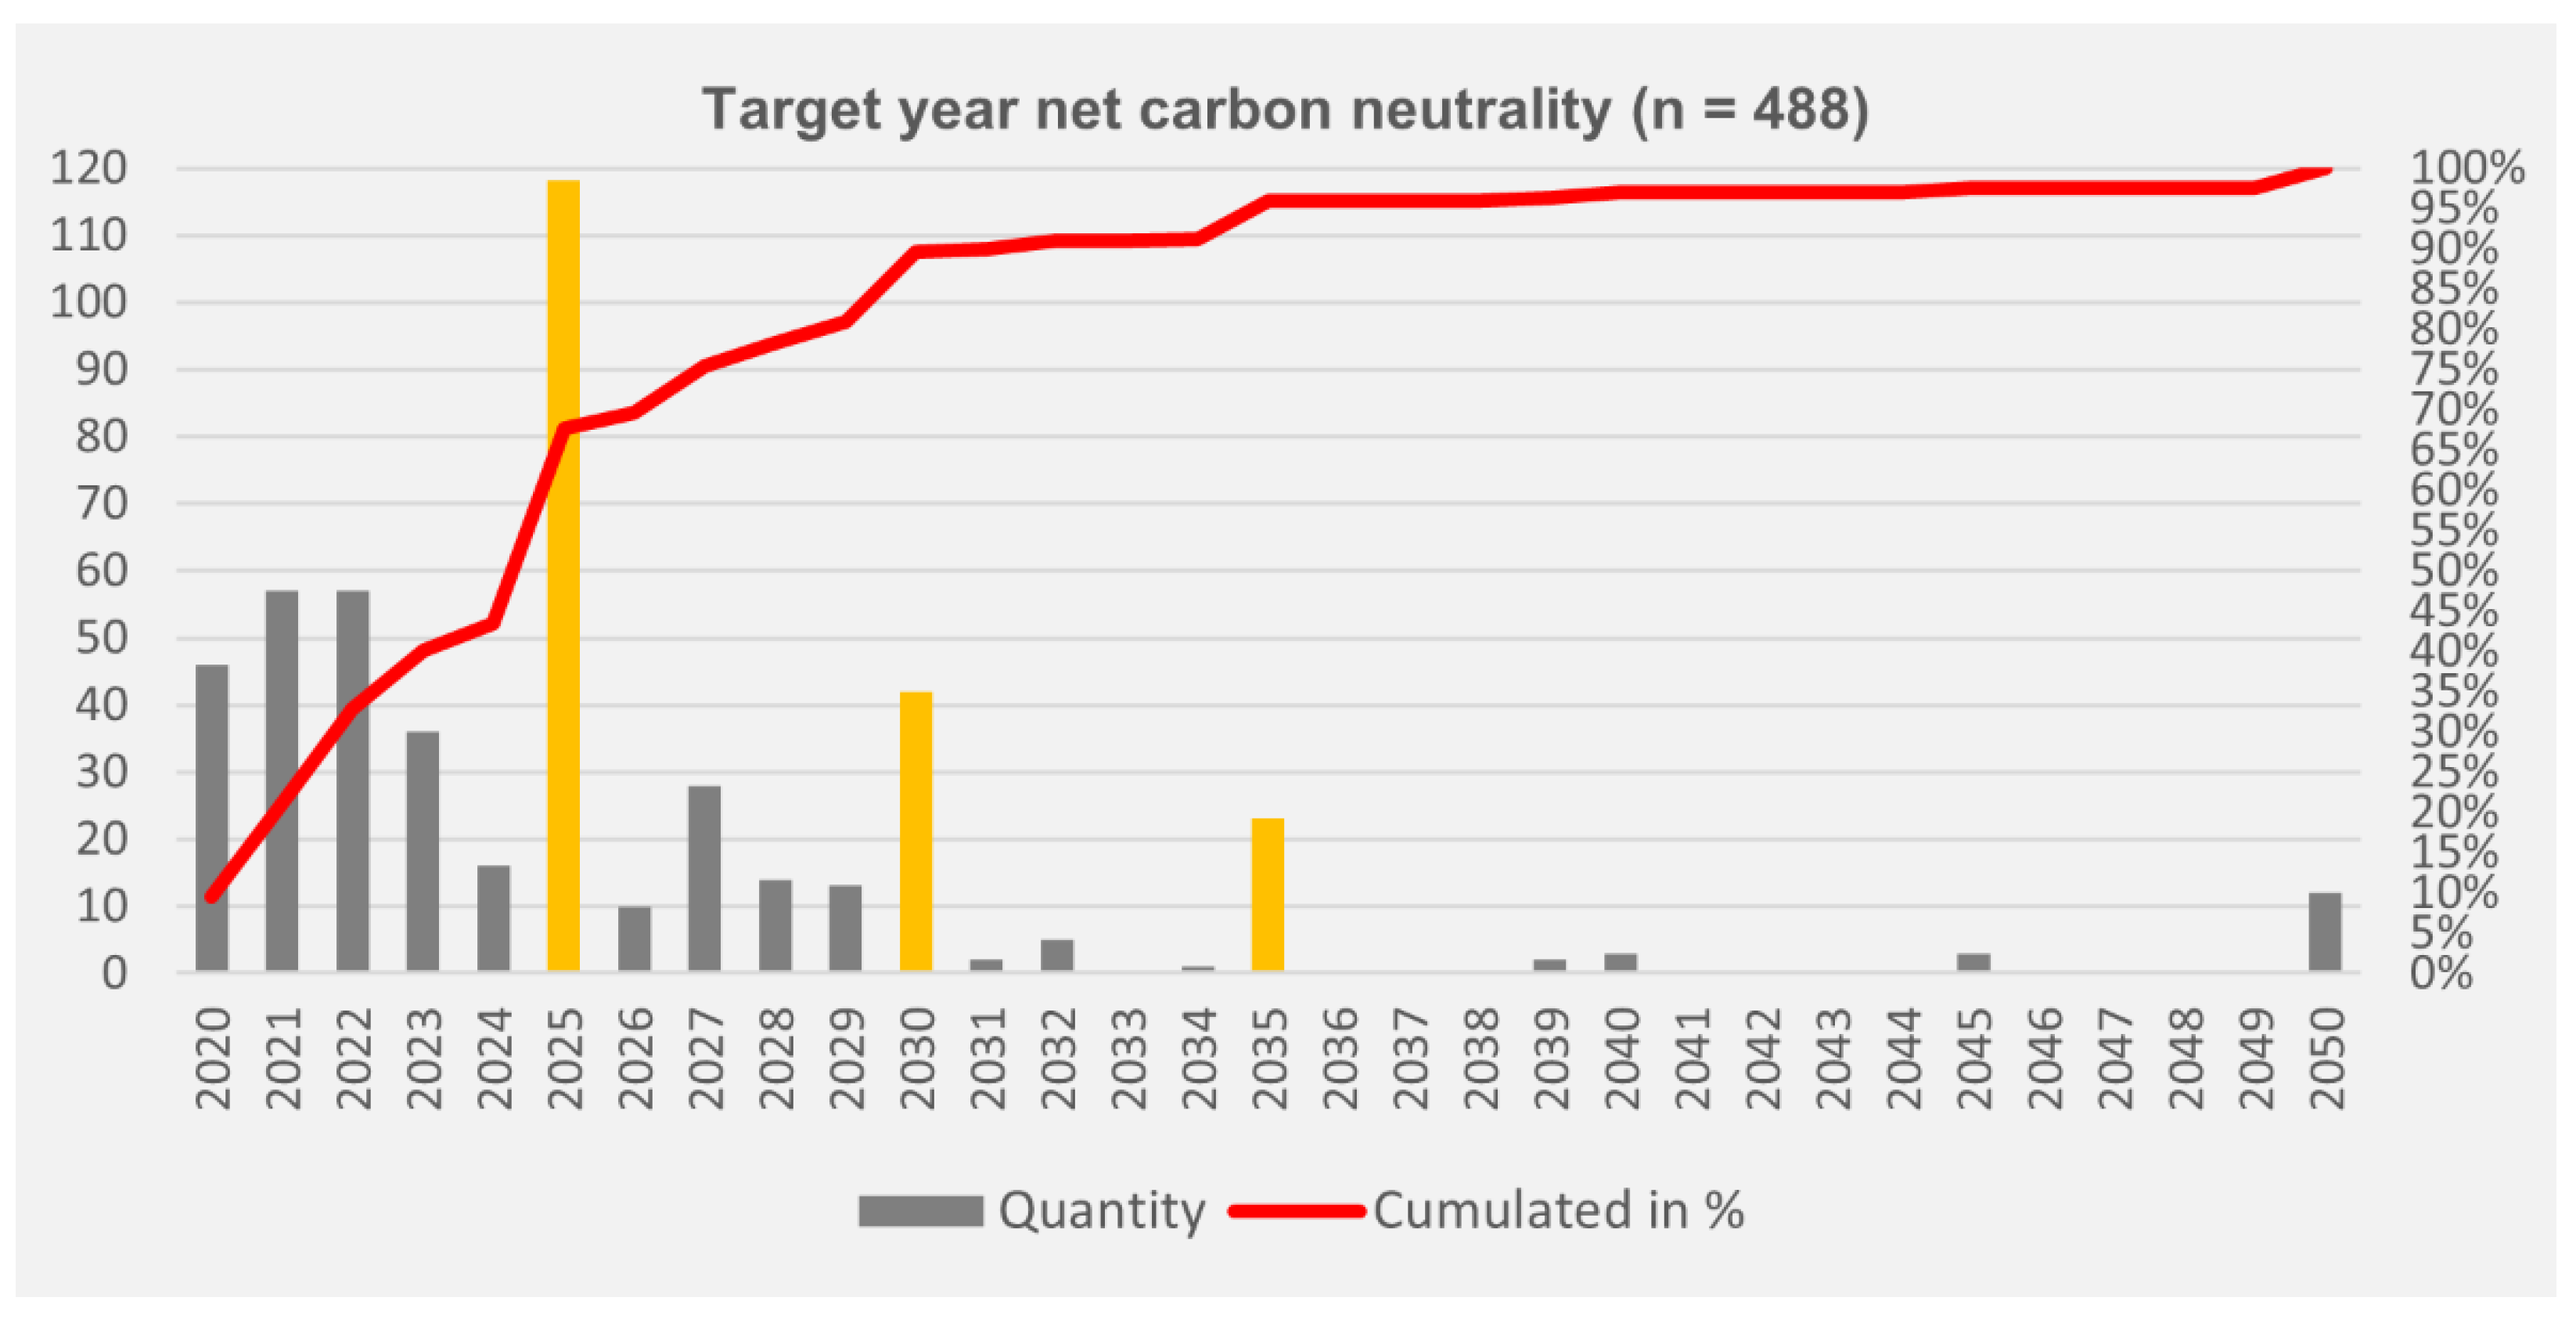
34]. We therefore decided to incorporate the question by when the net-zero carbon state is aimed to be achieved, giving legislators a clear picture of what the private sector’s level of ambition is, but also what support action (e.g., the provision of sufficient renewables) is needed. EEIs first data collection (2020) aims to help quantify the latter.
Of the 489 companies that aim to reach net carbon neutrality, two thirds have this goal for 2025 already, surpassing 90% by 2030 and 96% by 2035. This calls on policy makers to shape a series of five-year plans to facilitate this, rather than a strategy for 2050 with an interim stop in 2030, as it appears that
more than half the intended decarbonisation action until 2050 is scheduled for the next five years! (cf.
Figure 5). Only one company aims to meet the goal later than 2050.
Looking at the ambition per company size, 71% of micro companies that strive for carbon neutrality plan to have reached this goal by 2025 (or earlier), 93% 5 years later, and 97% by 2035. Fairly similar for medium-sized companies, the percentage figures are 70%, 90%, and 98% for these milestones, whereas small companies aim a slightly lower, with 66%, 85%, and 94% of companies planning to achieve decarbonisation by these dates. Of the large companies participating in this question, this is 61% by 2025, 94% by 2030, and 99% by 2035.
From an energy intensity perspective, 64% of the non-energy intensive companies plan to have reached net carbon neutrality by 2025, 88% by 2030, and 96% by 2035; the ambition rises looking at less energy intensive companies with targets of 68%, and 92% and 98% of them having succeeded by then. Moderately energy intensive companies aim for 74%, 93%, and 99% decarbonisation by the target years. Only energy intensive companies fall back to the level of non-energy intensive companies: 64% in 2025, 90% in 2030, and 97% 2035.
Looking at the ten sectors comprised of at least 20 companies aiming to become net carbon neutral by a specific target date, the “motor vehicle” and “wood and wood products” sectors (80%) are ahead for the first milestone in 2025, with the “chemical industry” (56%), “basic metals”, and “machinery and equipment” (59% each) falling behind. By 2030, all participating companies of the “motor vehicle” sector plan to have achieved the goal, with 96% of the “wood” and “paper” sectors close behind, and 81% of the “rubber and plastics” sector following below the average for that milestone. By 2035, “leather”, “electrical equipment”, and “paper and paper products” will have caught up to the automotive sector and, thus, have reached carbon neutrality, whilst the “chemical” sector will have achieved 91%.
Whether the 489 companies are representative of the level of ambition of their peers, and whether they will succeed in the time planned, is a different question. So are the challenges in their path.
4. Discussion
The ambitions described by the automotive industry in terms of their decarbonisation timeline and intended measures fall in line with, for instance, Daimler and Volkswagen pushing the decarbonisation agenda, with suppliers, such as Bosch and Continental, having to follow [
35]. Whilst the data indicates that companies push the responsibility for decarbonisation down the supply chain more often (13%) than being prepared to compensate emissions (10%), the factor “company size” does not play the big role expected. That said, suppliers from the SME sector may face greater problems satisfying such requests, as most of them are reported to not be ready for this transformation. For one, this is because of the small margins and expensive replacement of machinery, but also because they are mostly not in a position to demand higher remuneration, unless being a unique specialist. Others have not recognised the state of affairs or do not yet dare to bet on a particular technology in which they want to invest [
35]. According to Müller [
36], only one in five SME has taken measures to decarbonise themselves; it is a higher share in our sample, but the reading is similar. Identifying their optimal mix of measures to reduce costs and emissions is even more complex than in the case of efficiency optimisation alone.
If the decarbonisation of the industrial sector moves ahead at the pace suggested by the EEI data, investments need to double, and bottlenecks will soon become a problem: IG Metall approximates the need for 12,000 additional wind turbines to provide for a transition of the German steel industry alone to convert to hydrogen [
37]. Avoiding process emissions, which make up, for example, for approximately 30% of emissions in the chemical, steel, and cement industry, will require a drastic increase in renewable generation [
38]. As this is scarce, it becomes evident that doing whatever is possible through a more efficient use of energy and self-generation (internal measures)—as half the companies in the sample indicate doing—is a prerequisite to achieve overall decarbonisation. Implementing all this on-site and within the indicated timeframe will require a greater number of skilled personnel being able to identify and implement, and suppliers to deliver efficiency and microgeneration equipment. Particularly smaller SMEs require help, the distinct composition of which differs between sectors. If successful, this activity, however, promises a gradual decoupling from uncertain energy and emission charges, as well as from potential energy supply shocks whilst increasing energy productivity.
While, at present, the ownership structure and corporate culture largely determines the degree of ambition (e.g., Bosch is owned by Bosch Foundation), the Climate Action Summit in 2019 paved the way for an increasing number of investors considering investment in fossil business models a “stranded investment”, with a known due date [
4,
5]. This means that in future, more and more shareholder-controlled companies are likely to decide for decarbonisation.
Having addressed the research gap of current approaches on decarbonisation as being too narrow [
10], by taking interdependencies and specifics of the diverse industrial demand side into consideration, as well as the broader cultural and societal context across the previous pages, this work uncovers a series of questions and issues.
4.1. Where Is the Line Drawn? The Question of Scope
Having a better insight into companies’ intentions and means they intend to apply to decarbonise, it remains unclear what companies actually consider as ”decarbonisation”, and where the line is drawn—is it their estates? Is it including (scope 1) or excluding their mobile assets (e.g., trucks, vans, and cars) or also the materials they use? The indirect emissions from the generation of the purchased energy (scope 2)? Or all indirect emissions, beginning-to-end of the value chain (scope 3) [
39]?
This question of scope cannot be answered at this point. From an operational point of view, it appears that for such an analysis of intended action, it is better to be able to draw a clear line as to where one company’s responsibility for emissions ends and another’s begins. In an article for the Financial Times, Alecta chief executive Magnus Billing puts it like this: “The reporting of Scope 3 data will remain plagued by uncertainty for the foreseeable future” [
40].
4.2. Why Decarbonise? What Is the Range of Factors That Influence the Decision?
Similarly, it remains unclear what set of triggers leads companies to decide on decarbonising their operations in the first place. The understanding of which factors, besides regulation and carbon tax, play a role in the decision to decarbonise, is essential to tailor schemes and services appealing to these trigger points. Of similar relevance is the (relative) weighting of the individual factors.
4.3. How Do Companies Prioritise? How Do They Identify Their Ideal Mix?
Motivation and scope aside, how do companies prioritise different options that come with direct costs, these being clustered as interventions reducing their energy demand, on-site generation of green energy, purchase of green energy, and compensation measures? Is it the level of investment, the cost of carbon saved per EUR, technical aspects, experience in the type of intervention, access to skilled personnel, or other factors, such as environmental considerations and image, for instance via visible interventions—or is it a mix of them? How do they identify a mix of measures that is ideal for them, such as saving most emissions and preparing for the carbon tax [
41]?
Drawing on the supply chain, similar to the question of Scope 3, we consider an external measure, similar to minimum requirements in tendering services (e.g., ISO 9001 to certify quality management procedures).
4.4. Are Companies Able to Decarbonise?
Asking whether companies are planning to become net-zero carbon and by when, does not answer the question of whether they are able to decarbonise at all and to what extent. Christian Stöcker [
42] nicely summarises that there are six different types of companies with different means to decarbonise from carbon negative ones, such as forest enterprises (cat. 6), to those whose business model builds on carbon, such as coal mines (cat. 1). Companies in the other four categories have differing means to decarbonise: those whose products emit CO
2, such as, the automotive industry that could switch to e-vehicles (cat. 2), companies whose business models currently lead to emissions but do not necessarily have to, such as, logistics (cat. 3), and category 4—including most companies—comprises those who depend on cat. 2 and cat. 3. And finally, those who claim to be carbon neutral (cat. 5)—many of these may only achieve this with compensation schemes [
42,
43].
One could argue that manufacturing sectors can easily be tagged with one of these categories. However, is this really the case, or does it depend on their individual business case? Tesla, for example, can be considered as automotive, but their products do not emit CO2 during operation if green electricity is used. Putting it differently, the six categories are where companies begin by sectoral default and—through the choices they make and the mix of measures they apply—they have different means and ambitions to move towards category 5 or 6.
4.5. What Is the Companies’ Individual “Decarbonisability Factor”?
Tagging a company to one of these six decarbonisation categories therefore proves difficult from the outside, and is more something that arises from an internal assessment of “decarbonisability”.
Decarbonisability describes what percentage of decarbonisation (emission reduction) can be achieved on site, through (1) the reduction of consumption and choice of materials, and, in a second step, through on-site generation, flexibility, and buffer storage means, i.e., internal measures. Identifying this
Decarbonisability Factor is of relevance to assess the weight imposed on the system to permit a full net decarbonisation of the economy. The problem: externalisation—someone else will take care of it. These emissions still remaining need to be compensated outside the factory premises through sustainable generation or compensation measures. However, considering the large number of companies aiming to become net zero carbon by 2025, combined with the policy goal striving for a coupling of energy sectors towards electricity as a main source, will quickly lead to a run on the easiest decarbonisation option, the green electricity on the market. Whilst this market noted a 42.6% record share of renewable electricity in 2019, the industry sector alone accounted for 45.7% of the overall electricity consumption [
44,
45]. Considering that the increase in new renewable energy installations has plummeted in 2019 [
46], due to public concerns and new transmission lines struggling with the same issues, the demand will overshoot supply and eventually drive up their prices; the story is the same for domestic compensation projects—finding ones with a reliable effect may become increasingly difficult. The effect is decarbonisation leakage to other parts of the world (similar to emissions leakage, the effect happens elsewhere), and it is to be questioned what this does to the country’s emissions balance sheet. Therefore, it is crucial to determine the decarbonisability factor, to allow an aggregation of the required amount of green energy and to assess by how much it overshoots what is available on the market, and, hence, to inform legislators who still have to find a solution to end the green generation grid lock and generate acceptance in society.
4.6. Are All Companies Willing to Become Net-Zero Carbon? Those Who Are Not, Are They Not Willing at All, or Just Unwilling to Go That Far?
We must not forget about the third of the companies that does not strive towards net carbon neutrality. For these, it is a question of whether they cannot, or they choose not to do so. For both options, it still remains to be explored how close to their decarbonisability factor they want to come and how high that factor is.
4.7. Do Companies Really Strive for Carbon Neutrality or Do They Mean Climate Neutrality (or Vice Versa)?
The policy goal of the European Union is reaching climate neutrality [
47]. The measuring unit to achieve this goal is reaching a net-neutrality of CO
2-equivalents. As, according to Buettner [
48], the suffix “equivalents” becomes easily lost in the practical use and conversations, it is an impediment to create a common understanding and clarity of the actual goal, as, otherwise, actions are taken that would not have been needed to reach carbon neutrality, and, more severely, actions that are critical to reach climate neutrality are not taken (i.e., addressing methane emissions).
5. Conclusions
This study has analysed the demand-side perspective of decarbonisation in German industry. Overall, the analysis has shown that despite ambitious reduction targets, companies in German industry face difficulties that vary significantly from company to company, making industrial decarbonisation multi-layered and complex.
This applies, in particular, across structural characteristics (i.e., company size, energy intensity, and sector). Especially micro-companies and energy-intensive companies are challenged. However, this is also the case for companies whose processes can only be decarbonised by substantial interventions into core processes and the way the products are being created.
Gaining clarity on what the actual status quo, the system boundaries, and the dimensions of the goal are, is equally important to make a decision regarding which factors and motivators determine the mix of measures chosen to pursue the goal set. Understanding this and also the actual means that a company has to cut carbon emissions on-site, will allow for the determination of the decarbonisation factor, and give an indication of what energy generation and transmission infrastructure as well as compensatory means are needed.
Understanding what triggers companies to make the decision to decarbonise is as relevant to tailor fitting policies and providing the environment for concrete action (i.e., planning permissions and transmission lines) as knowing what type of decarbonisation action companies intend to undertake by roughly when.
The conclusion of this study is not only that previous research has paid too little attention to the voice of the demand side, but also that a “one-size-serves-all” approach to decarbonising German industry is not efficient. Instead, policymakers and researchers should work more closely with industry to identify and to address their challenges and needs. Taking this approach will allow industry to fully work towards fulfilling the pledges that individual companies made and continue to make.
Having gained an improved insight into companies’ intentions and means for decarbonisation, some questions nevertheless remain unanswered and should be addressed by further research.
As the number of companies taking the decision to decarbonise steadily increases and, from the authors’ perspective, should continue to do so, it is of high relevance that this further research is undertaken in the near future and on a broad empirical basis to adequately consider the broad bandwidth of German manufacturing companies.
An Outlook: Answers and Transferability of Findings
Whilst all these questions arising from the data discussed remain unanswered for the moment, subsequent iterations of the Energy Efficiency Index in 2020, 2021, and 2022 (will) provide the basis to find an answer for many of these questions, in regards to German companies and lead to a number of forthcoming publications currently in preparation.
In this paper, we focused on data from companies manufacturing in Germany. Whilst the sector coding and technologies available differ only slightly, between industrialised countries (i.e., the theoretical decarbonisability factor for a company), the general stance towards climate questions and approaches, and, hence, towards decarbonisation, greatly differs.
It is in the nature of scientific studies that their results reveal limitations or open up new questions. As the EEI only captures the perspective of German manufacturing companies, the results reflect the institutional and cultural background of Germany. Comparative or cross-national studies may shed light on how manufacturing enterprises act towards decarbonisation, depending on their different contexts. Therefore, upcoming data collections of the Energy Efficiency Barometer of Industry (#EEBarometer) are of particular interest.
Whatever the decarbonisation choice and mix is, the combination of measures resulting will be quite individual based on individual priorities, goals, financial means, and realities. Therefore, each puzzle differs. Let’s start puzzling.


 ,
, 


