Review

Quantifying Emotions in Architectural Environments Using Biometrics

1
Department of Interior Design, Kookmin Graduate School of Design, Seoul 02707, Korea
2
Department of Spatial Design and Consumer Studies, College of Human Ecology, The Catholic University of Korea, Bucheon 14662, Korea
*
Author to whom correspondence should be addressed.
Appl. Sci. 2022, 12(19), 9998; https://doi.org/10.3390/app12199998
Submission received: 26 May 2022 / Revised: 8 September 2022 / Accepted: 21 September 2022 / Published: 5 October 2022
(This article belongs to the Section Applied Neuroscience and Neural Engineering)

Abstract

:
This paper reviews studies that have quantified humans’ emotions in architectural environments using biometrics. We analyzed the design variables that induced positive emotions and compared the study conditions for each result, including the biometric tools utilized. The objective was to analyze the design characteristics of the architectural environment, biometric tools, and study conditions that measure emotional responses in design research, their limitations, and future uses of biometric devices. Twenty papers were selected using the preferred reporting items for systematic reviews and meta-analyses. The population, intervention, control, outcome, and setting study design were used as an analysis framework. The reviewed papers used biometric tools such as electroencephalography, functional near-infrared spectroscopy, functional magnetic resonance imaging, galvanic skin response, electromyography, electrocardiography, and eye-tracking to analyze emotions. Environmental factors that produce positive emotional responses in the architectural spaces included form, layout, material, color, furniture, and lighting. The findings from methodology using biometric tools have the potential to develop an evidence-based design to produce positive emotions in architectural environments that improve our mental health and well-being.

1. Introduction

1.1. Background

Most of us spend a significant amount of our lives in buildings, and the qualities of those spaces affect our emotional, physiological, and cognitive functioning experiences [1,2]. However, while it has been long argued that our physical surroundings affect our emotions, understanding how the aesthetic perception of the built environment affects people’s cognitive and emotional states has relied on architects’ subjective intuition and experiences [3,4,5,6]. Unfortunately, in the past, information about users was obtained through largely subjective methods such as interviews, surveys, and observation, making such data difficult to analyze.
The research methodology has been refined to compensate for the inadequate understanding of our built contexts. Science and technology, especially neuroscience, are advancing new perspectives and expanding our knowledge of the interaction between humans and the built environment. The use of valid, reliable measurement methods such as biometric tools allows the capture of variables containing rich information with high interpretative value [7]. The research into the interaction between neuroscience and architecture will deepen our understanding of human existence and experience in the built environment; this is a topic with great potential to enhance and optimize the evidence-based design principles that promote health and well-being.
However, the role of the human brain in experience has only been recently addressed, and there is still a lack of knowledge and consensus on experiences at the intersection of architecture, psychology, and neuroscience [2,8]. Furthermore, preliminary research has been conducted to formulate architectural spaces’ effects on human emotion and behavior [3,4,9]. The methodology is still underdeveloped with no standardized protocol and adopts qualitative measures that lack consistency and objectivity. There is also insufficient knowledge of biometric tools to measure people’s experiences in architectural environments.
Previous studies have explored how individual perceptions of an environment play an integral role in one’s emotional and cognitive interactions within the environment. Such studies have also confirmed that subjective experiences can be measured and quantified with neurophysiological methods, and researchers have suggested ways to enhance the methodology for higher validity.

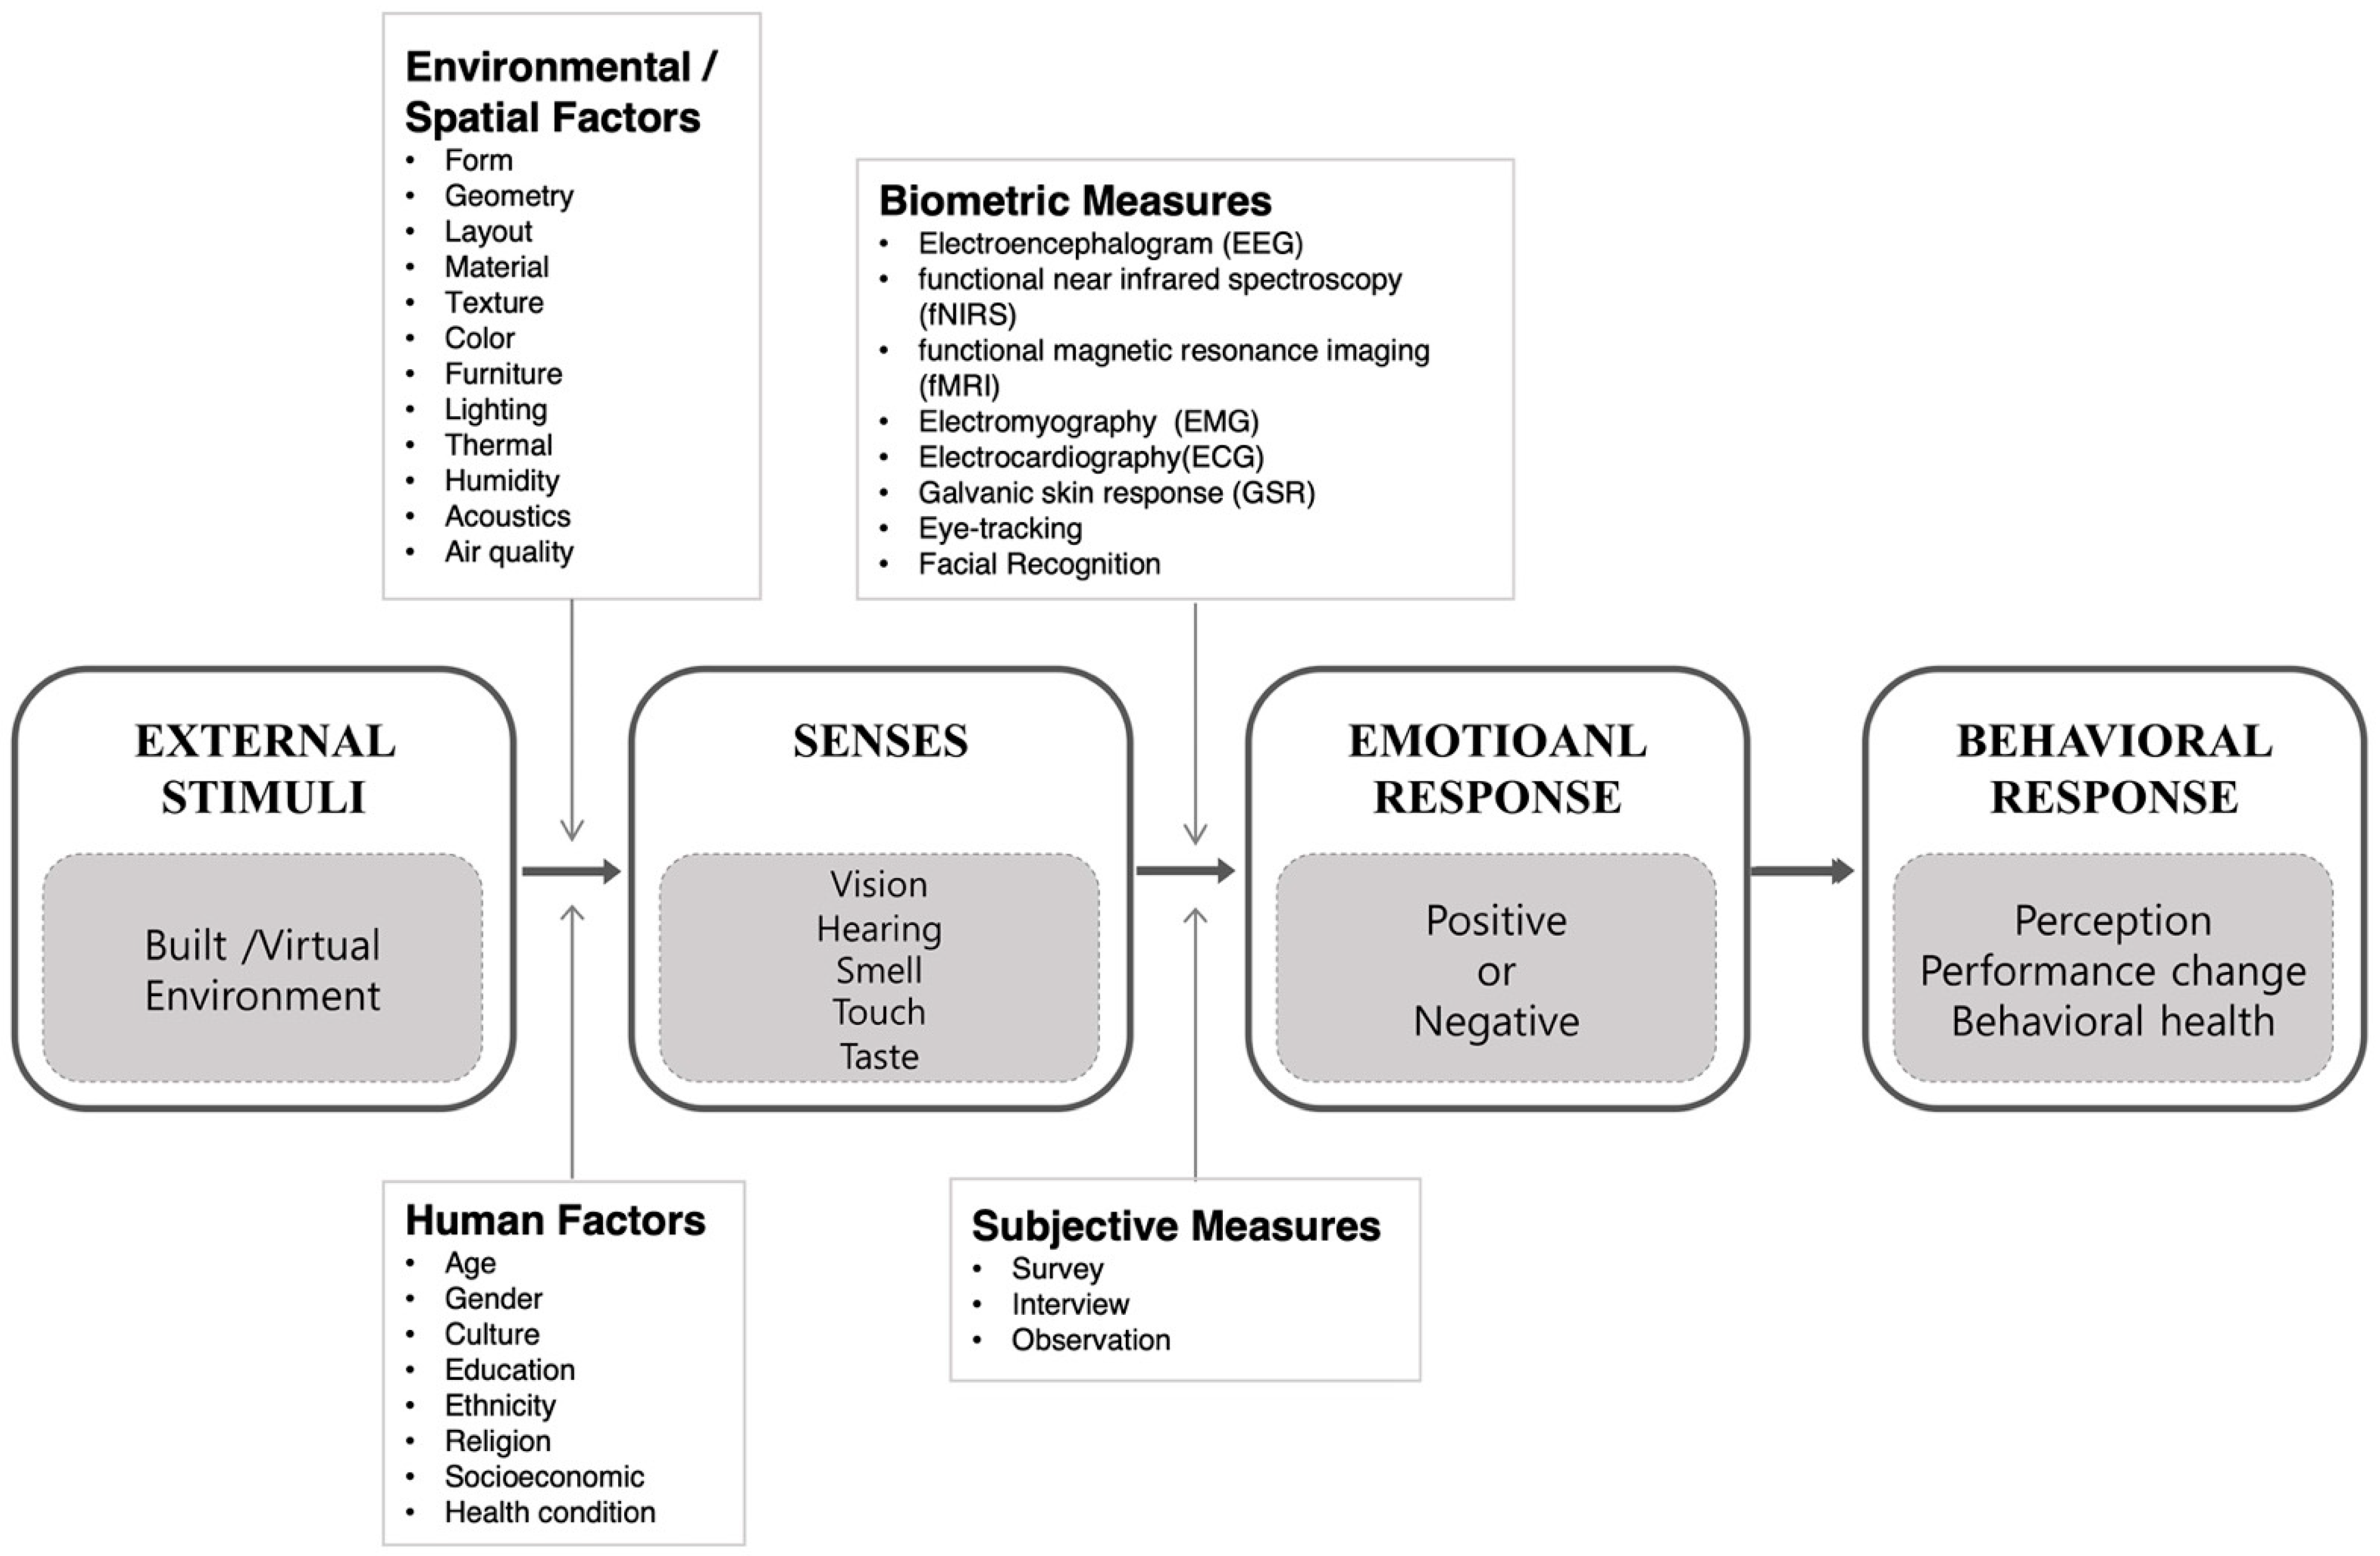
1.2. Biometric Tools

The experience of positive emotions can be measured using several biometric tools such as electroencephalography (EEG), functional magnetic resonance imaging (fMRI), functional near-infrared spectroscope (fNIRS), electromyography (EMG), electrocardiography (ECG), galvanic skin response (GSR), and eye-tracking [10]. An EEG records the brain’s electrical activity using electrodes placed on the scalp. The power spectrum is used as an analysis metric, describes the distribution of power, showing EEG signals in the frequency domain, and represents power distribution in frequency bands. Another analysis metric for EEG is frequency bands; their approximate spectral boundaries are delta (1–3 Hz), theta (4–7 Hz), alpha (8–12Hz), beta (13–40 Hz), and gamma (40 Hz and above) [5,11]. Different neural parts are activated in response to different subjective experiences. fMRI measures the flow of blood in the brain, with shaded areas indicating that the corresponding region of the brain is activated. fNIRS measures cortical hemodynamic activity in response to neural activity [10].
ECG records the electrical signals of the heart. It measures the heart rate (HR) and heart rate variability (HRV) to discern states of relaxation or anxiety. EMG records the electrical activity of skeletal muscle using thin needle electrodes inserted into the muscle through the skin. GSR (SCR) measures fast-varying skin conductance caused by external stimulations, and PPG (HRV) measures variation in the time interval between the subject’s heartbeats. The analysis metrics for GSR include SCR peaks, where the SCR signal jumps higher than the defined threshold, and the peak amplitude, which is the amplitude at the peak minus the defined threshold [5]. For PPG (HRV), the inter-beat interval (IBI), which is the time between consecutive heartbeats measured in milliseconds, and the AVNN score, the average of the normal sinus rhythm (i.e., heart rate of 60–100 beats per minute), are used as the analysis metrics [5]. Lastly, eye-tracking devices can measure both the “point of interest” (POI) and the duration of attention by tracking the eye movements and the pupil size as related to emotion [12]. It can also be used to identify, quantify, and visualize the patterns shown by specific groups of people, combining factors associated with viewing selected architectural scenes.

1.3. Positive Emotion

Environmental design that elevates psychological comfort and satisfaction can help to improve mental health and well-being. Architectural environments can be designed to cultivate positive emotions that enhance mental health and well-being. Watson developed measures of positive and negative affect. Positive affect is an experience of pleasurable engagement with the surrounding environment [13]. It is the feeling of enthusiasm, action, and alertness. The 10 items of the PA scale are: attentive, interested, alert, excited, enthusiastic, inspired, proud, determined, strong, and active [13]. Studies confirmed that the experience of positive emotions has corresponding responses in neurophysiological realms. For instance, pleasure is an affective (emotional) response which considers the valence dimension of the affect circumplex [14,15,16,17]. For “pleasantness”, cerebral responses underpinning the experience exhibit activation of the motor system, including the simulation of actions, emotions, and corporeal sensations, which are responsible for the perception of architecture.
This paper measures positive emotions, including pleasure, interest, excitement, lower stress, and comfort. Instead of using comprehensive subjective experiences, as other reviews on the subject have, this paper discusses the relationship between design variables and emotional responses in architectural environments. It can determine and enhance the validity of quantifying emotional states using biometric tools. The study compares studies that have used positive emotions as the dependent variable. The evaluation reveals the conditions which are most conducive to testing a particular emotional state.
This review addresses the following questions: (i) What design characteristics of the architectural environment induce positive emotion? (ii) What biometric tools and study conditions measure emotional responses in architectural environments? (iii) What are the limitations of current and future research agendas?

2. Methodology

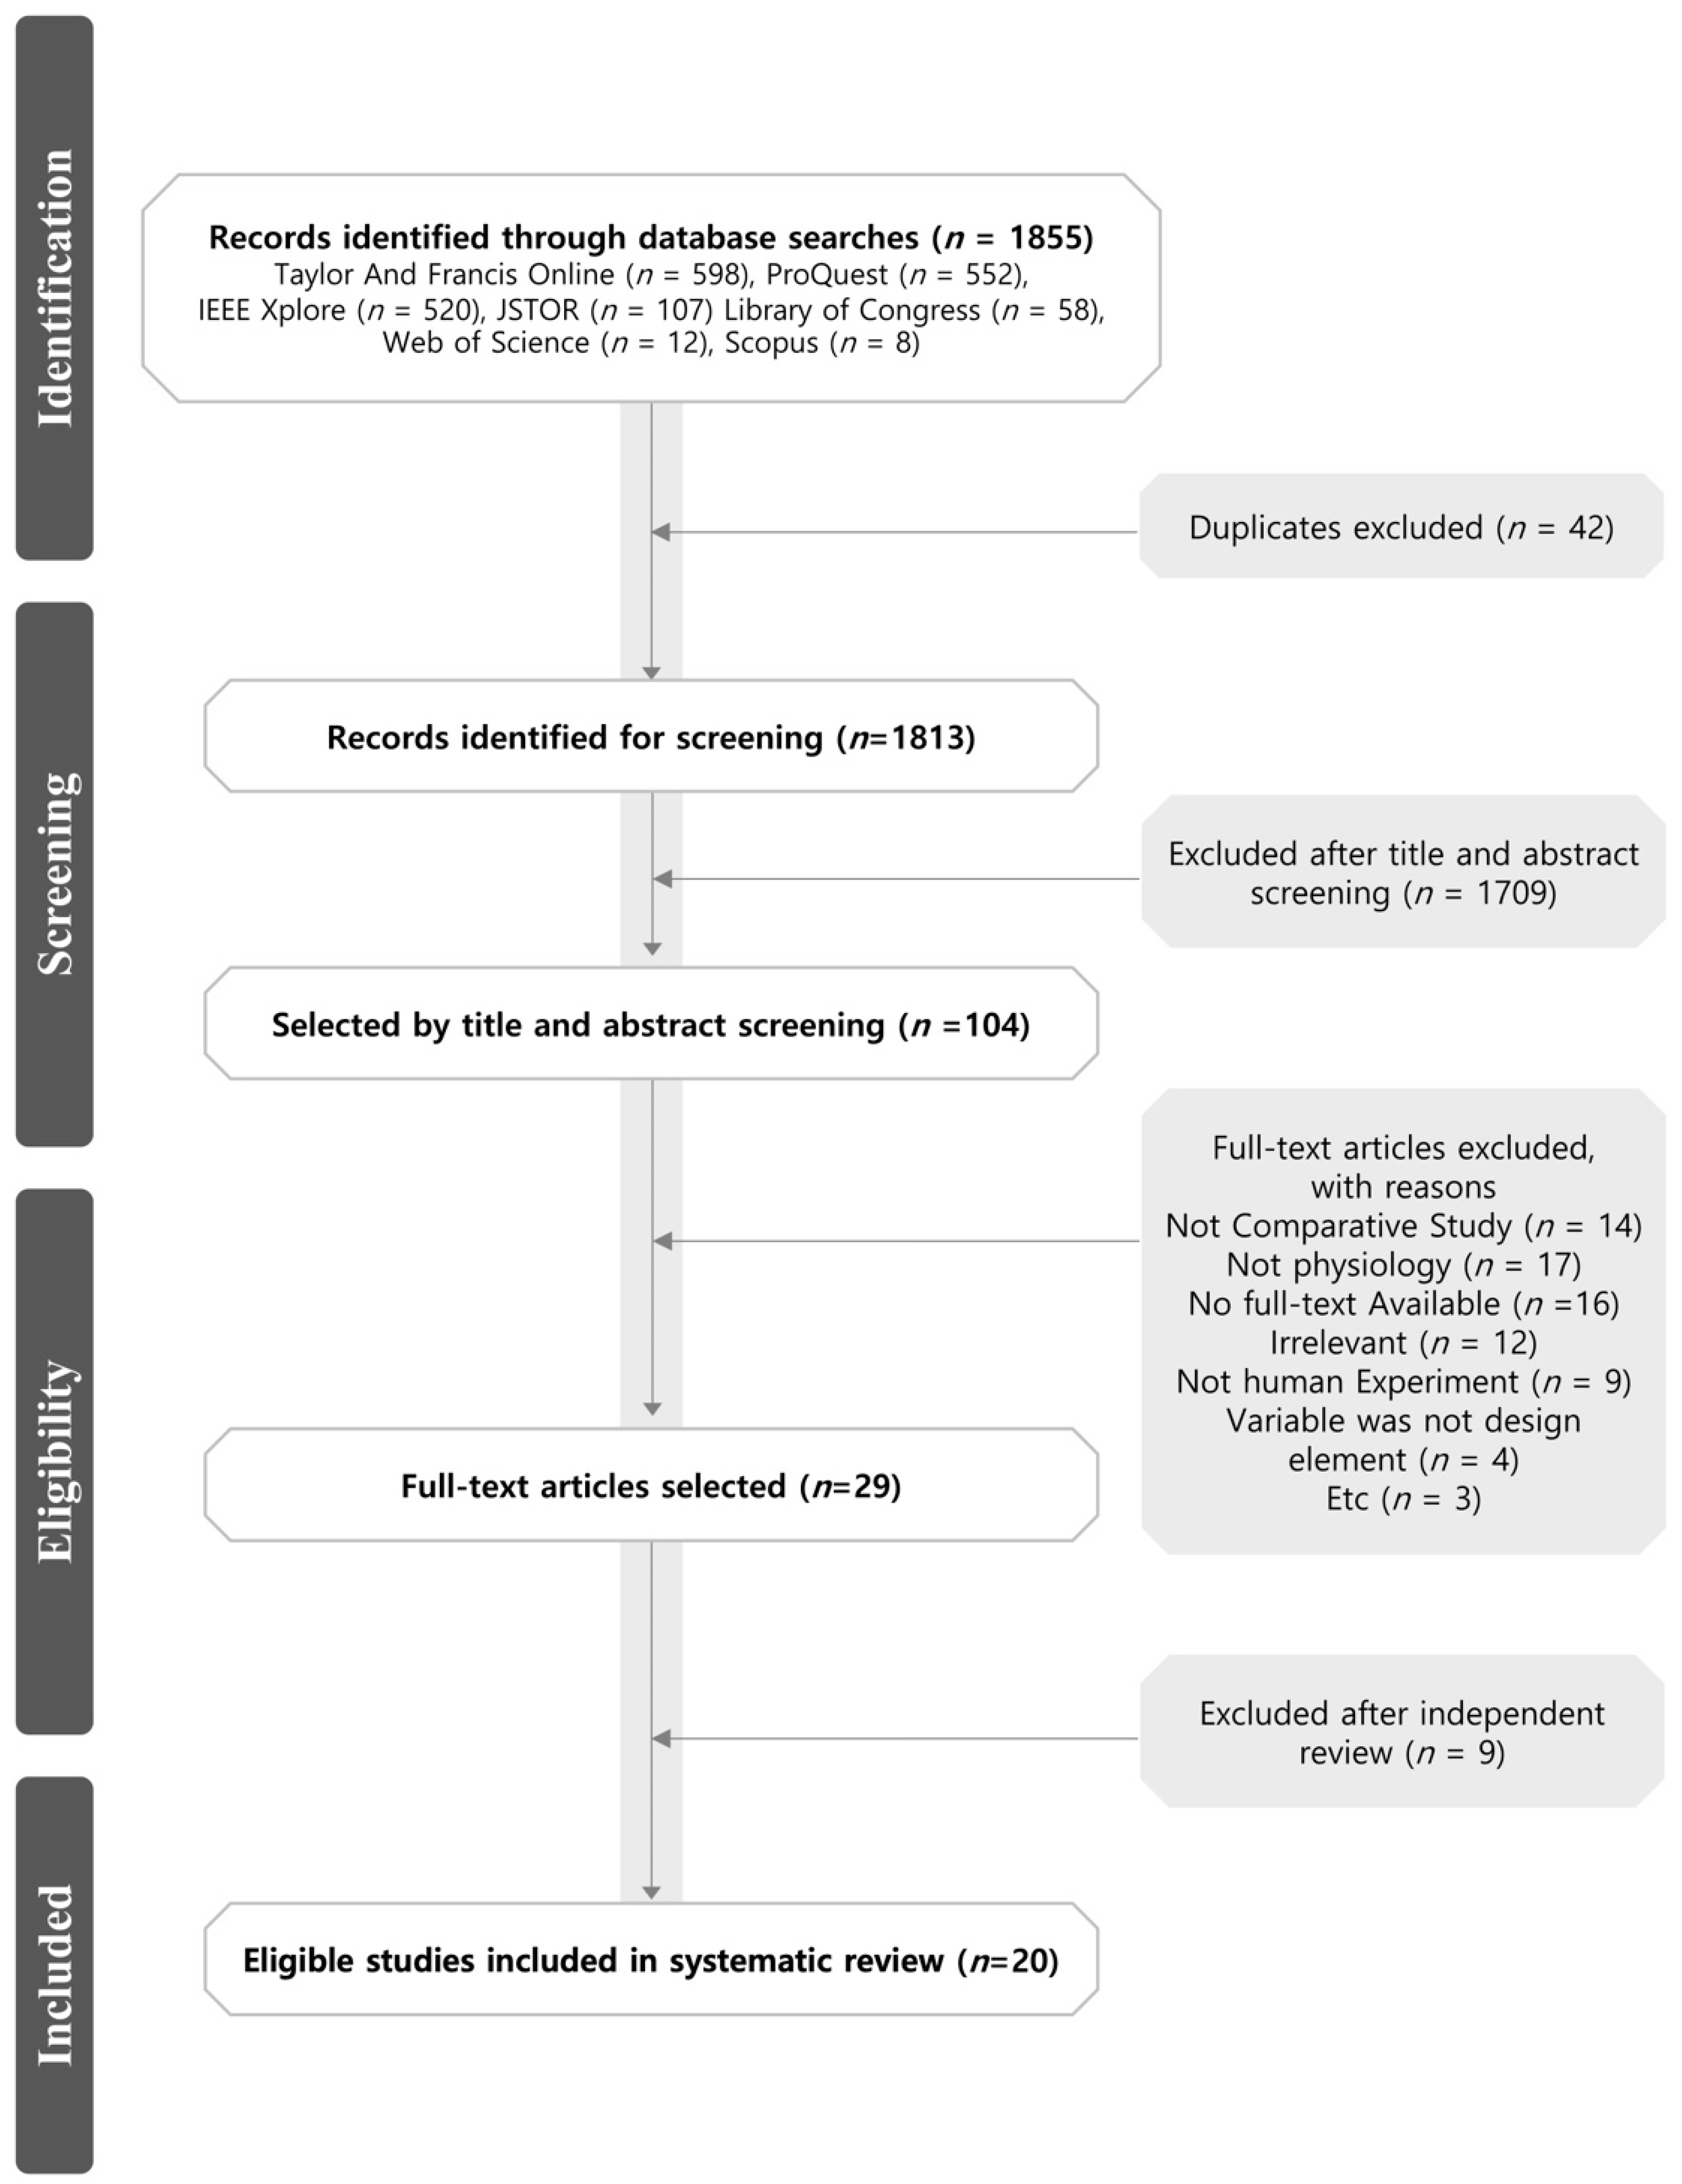
2.1. Criteria for Selection of Papers

The preferred reporting items for systematic reviews and meta-analyses (PRISMA) were used to identify relevant studies. This review focused on the effects of design characteristics of built environments (physical or virtual) on emotional states. The search strings were limited to the most frequently used terms, written in English, peer-reviewed in international journals, and published between 2009 and 2021. The time frame was based on the recent growth of interest in multidisciplinary research, accelerated by technological advancement. This scope was selected to ensure that the biometric techniques were utilized in experimental design research. The main keywords encompassed both physical and immersive virtual environments.
Taylor and Francis Online, ProQuest, JSTOR, PubMed, EMBASE, PsyclINFO, IEEE Xplore, Library of Congress, Web of Science Scopus, and Google Scholar databases were used in the search. The database search keywords used included “biometric”, neuroscience”, “emotion”, “affective response”, “pleasure”, “architecture”, “interior design”, “built environment”, and “virtual environment”. Subcategories were searched for using “OR”, and higher-level categories were searched for using “AND”. Searches that exceeded the search word limit were conducted separately using different subcategories.
Additional papers were identified through a subjective search of the bibliographies of relevant papers. A total of 1855 papers were identified through database searching. After title and abstract screening, 104 were selected for full-text review. After the full-text screening, 85 articles that were not comparative, were unrelated to physiology, did not provide a full text, were not relevant to the topic, and/or did not involve human experiments were excluded, resulting in 20 eligible studies as shown Figure 1.

2.2. Analysis Method

This review adopted an analysis method suggested by Cochrane Handbook and categorized and analyzed the papers according to population, intervention, control, outcome, and setting (PICOS) study design. First, the PICOS study design was used as an analysis framework, and the criteria of each PICOS were reviewed to analyze the selected papers (Table 1). Then, the type of study, method, participant, intervention, comparator, outcome, and setting measures were extracted from the review papers with the analysis method adapted from the Cochrane Public Health Group Data Extraction and Assessment Template.
The papers focused on the effects of the design characteristics in an architectural environment (of physical or virtual spaces) on the emotional state of healthy populations. The papers met the criterion of utilizing both objective and subjective measures. This review focuses on papers that study neuroarchitecture, a field that combines neuroscience, environmental psychology, and architecture. It is concerned with how the form of architecture can attend to human functions and generate delight [18]. All the studies incorporate experimental neuroscience, which tests hypotheses, makes predictions, and engenders quantitative results [19]. The review adopts a theoretical framework of the “aesthetic triad”, a model initially developed in neural terms [20,21], which is applicable to the neuroscience of architecture [22]. The model proposes that aesthetic experiences consist of three systems—sensorimotor, knowledge–meaning, and emotion–valuation—that interact to generate a holistic experience of architectural spaces [19].

3. Analysis of Selected Papers

This paper reviewed 20 papers and analyzed the type of participants, settings (controlled experimental conditions), interventions, and comparators, and outcomes measured using biometric tools.

3.1. Population

In all studies, all participants were healthy. The selection process was not limited to participants based on age, gender, or cultural background. All participants were over 16 years old and exhibited verbal fluency, a trait appropriate for studies that analyze the built environment’s subjective experiences. Adolescents also show a higher interest than children in novel things and a willingness to explore, and thus are more appropriate participants than children.
Inclusion criteria for participants also varied across studies. Since the response to a stimulus can vary according to a subject’s gender, age, cultural background, and health condition, it is essential to design selection criteria for participants. For instance, one study was limited to female participants, as gender might affect responses to visual complexity [23].
Some studies compared groups of participants to abstract findings particular to each archetype of people. For example, one study classified participants according to their involvement in fashion as determined by their survey responses to correlate specific spatial experiences to a common feature beyond the individuality of each participant [23]. Another factor in the selection criteria could be the expertise of the participants. The selection of students with non-architectural educational backgrounds ensured the exemption of preconceptions and preferences that may result in biases in the results. On the other hand, the choice of architectural students confirmed an intrinsic interest when exploring a building and safety with the portable tools utilized in the study. Limiting the survey to first-semester students excluded participants with extensive knowledge of buildings, which eliminates preconceptions [12]. Table 2 summarized the characteristics of participants.

3.2. Setting

The physical settings of the controlled experimental conditions in the selected papers included a laboratory, a field, and a virtual environment. The stimuli were presented as 2D images, 3D images, and VR images through a computer screen, projector, and VR headset. The environmental design was presented in a residence, a retail location, and an office, with differing factors including furniture design, interiors, exteriors, and urban streets. The experiment setup observed environmental control according to standard IEQ parameters of lighting, temperature, humidity, and noise elements. For example, one study controlled the lighting by preventing natural lighting, temperature, and humidity in the experimental room [41].
Most studies were conducted in a laboratory setting. However, other experiments were performed in a real environment, such as a historic train station in Monterrey, Mexico [12]. In addition, some studies created an immersive virtual environment using commercially available VR technology. For example, one study used the CAVE automatic virtual environment system, and another used a 249 cm (98 in.) touch screen and a motion-tracking solution composed of optical cameras to build a virtual environment. Other studies used VR headsets to display VR contents (i.e., 360-degree panoramic images, videos, and VR dynamics) of architecture/interior spaces.

3.3. Intervention and Comparators

This paper classified interventions as variables being tested for, which included design characteristics in the architectural environment, such as form, layout, color, material, furniture, and lighting. The included papers measured the impact of the design characteristics on emotional responses using biometric tools such as EEG, fMRI, ECG, EMG, GSR, and eye-tracking.
  • Form
    Regarding form, one study investigated how systematic variations in contour (e.g., curvilinear or rectilinear spaces) affect aesthetic judgments and approach–avoidance decisions using fMRI [34]. The parametric analyses of pleasantness and beauty suggested that the two variables activated dissociable aspects of the same network in the aesthetic judgment of a visual stimulus [34]. The studies involving first-order polynomial expansions showed that activation in the precuneus, middle frontal gyrus, and anterior cingulate cortex (ACC) co-varied pleasantness ratings [34]. Another study arrived at a similar conclusion with another bio-tool. Curvilinear spaces accompanied greater pleasure and activated the θ activity in or near the ACC, as observed from EEG data [25]. The group with higher pleasure and arousal ratings recorded higher θ activity (3–7 Hz) near the ACC (Cls 24). A partial correlation controlling for arousal and pleasure was conducted to control for the effect of affective processes, from which changes in the ACC theta band activity were shown to be caused by processing aspects of architectural features in the built environment and not by the arousal or valence of the form features [25].
  • Layout
    Using psychophysiological metrics with self-report, the effect of visual complexity on affective/behavioral responses was measured. The visual complexity was manipulated with patterns and layout [23].
  • Material
    Regarding material, wooden material has a positive impact on the nervous system. The brain becomes calmer and less stressed, while longer exposure results in a more active brain, making the participants less afraid and anxious and increasing their memory and ability to think. Such experience is accompanied by the EEG beta wave change that initially decreases and then significantly increases after more prolonged exposure [29]. Additionally, natural elements, such as biophilic designs, reduce stress and anxiety and improve physiological and cognitive performance [37,38].
  • Color
    The variations in color schemes were used to assess emotional responses such as pleasure, arousal, relaxation, and comfort. For effective assessment, the colors of a scene can be classified into easily recognized categories. One of the models used in a study was the HSV color model, which utilizes color parameters such as hue (H), saturation (S), and value (V) and approximates how the human visual system perceives colors [40]. Another study compared the brightness of color. The study found that bright color, with light-bounce intensity above average (2.0 in Unity 3D), increased oscillations in the α, β, and θ frequency bands for EEG measures, lowered the average number of SCR peaks, and resulted in less perspiration and heart rate variability [5]. Two studies compared monotone and multitone environments. One study concluded that both colorful and gray environments induce unpleasant experiences [30]. Another study examined the psychological and physiological effects of colored room interiors on people [33]. The participants were given activities to do, such as work or leisure [33]. The study was designed to measure experiences and the result differed according to the function of the room. In a space for work, subdued colors were preferred, while for leisure, gray and bright colors were preferred [33].
Likewise, blue was seen as more pleasant across several studies and accompanied the decrease of heart rate [24,27]. The decrease of heart rate is associated with the relieving of stress-levels [27]. On the other hand, red, an arousing color scheme, accompanied the smallest decrease of heart rate, compared to green, blue, and white [27] or an increase in heart rate [24]. The result indicates that the subjective experience of the same color could change when additional variables such as the performance of an activity (i.e., office work) is introduced. Unlike the findings in which blue was rated more pleasant than red, when office work was introduced, red had a higher positive rate than blue [30]. This is consistent with the hypothesis that colors with higher arousal rates, such as red, induce more stimulation and thus result in higher work efficiency. On the other hand, the proportion of plants and green colors in urban streets positively and significantly affects feelings of comfort and vitality [40]. More diversity of color led to positive emotions, indicating that designers should avoid uniformity of color for higher stimulation.
  • Furniture
    The different style of furniture in a room was tested using EEG. One study compared three room designs: no furniture, modern furniture, and cutting-edge furniture. The results showed that the two furnished rooms were correlated with high pleasure [36]. In the experiment, participants’ EEG data were obtained during the experience of immersive virtual reality environments. Then, participants were asked to assess their experience, including “pleasantness”, using a nine-point scale. The EEG data’s power spectral density (PSD) for each behavioral dimension in the theta, alpha, and mu bands was analyzed using time–frequency analysis and topographic statistical maps. The results indicated that pleasant virtual environments activated mechanisms involved with action planning in addition to sensory visual areas and frontal regions. Statistical comparisons revealed that theta band features spread activity enhancement in the occipitoparietal and frontal networks, while the alpha band returns desynchronization of left parietal and frontal sites [36]. Thus, the perception of pleasant environments entails parts related to visuospatial processing. Furthermore, the suppression of the mu rhythm over the left motor areas is common in both enjoyable and comfortable environments, consistent with embodied simulation theory.
  • Lighting
    A room with direct and indirect lighting induces more pleasure than a room with only natural lighting, as indicated by the higher theta band and oscillations in EEG data [32]. Since the perception of room size is an essential predictor of comfort, combining direct and indirect lighting to regulate the perception of space results in higher pleasure. Another study confirmed that a positively configured environment with standard lighting reduced stress [5].

3.4. Outcomes

The selected papers have assessed the experience of positive emotion. This paper explored whether these studies demonstrate that design characteristics affect our emotional states in conjunction with objective biometric tools and subjective self-assessment tools for cross-validation. The experiments were conducted in both physically built and immersive virtual environments. The interventions were categorized according to the design characteristics found in architectural/interior spaces: form, layout, material, color, furniture, and lighting. The results show that positive emotions can be engendered in diverse types of architectural environments using various measurement tools. A summary of design variables, biometric tools, and outcomes is described in Table 3.

3.4.1. Effects of the Design Characteristics on Emotions

The outcomes showed a positive relationship between design interventions and emotional responses in architectural environments. Furthermore, the findings showed that types of design characteristics could cultivate positive emotion in built or virtual environments.
  • Curvilinear forms (unlike rectilinear) engender a higher experience of pleasure and are correlated with positive ratings [25,31,34]. Proportion is also a design element that affects a participant’s emotional assessment. An interior with a golden ratio principle accompanies a pleasurable experience [33]. Low complexity for low-fashion-involvement group and high complexity for high-fashion-involvement group engender higher experiences of pleasure [23]. For the composition of constituent elements, diverse and less fragmented scenes inspire positive feelings [40]. The visual attraction also indicates what design elements should be incorporated for attention. The result of one paper showed that a large media screen in the center of the wall and building with high contrast and punched windows compared to blank or featureless facades induces attention [28].
  • The layout of retail stores is related to respondent characteristics. When the consumers’ fashion involvement is low, high visual complexity produces a negative effect. However, such a negative effect decreases with high fashion involvement [23].
  • Solid wood has regenerative and is suitable for healthcare environments [29]. Adding natural elements, such as biophilic design, reduces stress and anxiety and improves physiological and cognitive performance [37].
  • Warm colors, such as red and yellow, were seen to have arousing properties, whereas the color blue was rated more pleasant than red and yellow [24]. However, red had a higher affection rate in another setting than blue and a higher positive rate when introduced in a room color with a work task [30]. In a room designed for leisure, grey tones were highly preferred, while for work and study, subdued colors were preferred [33]. The higher proportion of greenish color improved comfort and relaxation, a result that was reconfirmed in an environment with a higher presence of plants [40]. Similarly, bright color, defined as light-bounce intensity set above average, or 2.0 in Unity 3D in a virtually configured environment, induced positive emotion [5].
  • Modern and cutting-edge furniture (unlike no furnishing) engender greater pleasure. Comparing empty and object-filled interiors, indistinctive in the type of furniture, rooms with objects were rated more favorably [36].
  • A combination of direct and indirect (rather than explicit) lighting engenders a higher experience of pleasure [32]. In a virtually configured environment, standard lighting, defined as lighting with intensity above average (intensity > 3.5 in the gaming engine), induced positive emotion [5].
Our findings showed that form and color were the most highly used design intervention to influence positive emotions. The form could be tested through rectilinear or curvilinear shapes, ceiling height, openness or closure, window, grid, free-form layout, etc. Color could be tested in multiple schemes, including different tones and monochromatic or multichromatic. The combination of form and color could also create new comparison conditions. For example, the grid layout and homochromatic rooms make up a low-complexity indoor environment; free-form and multichromatic decorative patterns make up a high-complexity indoor environment. The differing results according to the characteristics of participants revealed that the brain reacts to external stimuli based on previous experiences. The difference in the level of expectancy may affect reactions to a given stimulus [2].
The experiments were conducted in interior and exterior design and incorporated objective (biometric tools) and subjective methods (self-reported indicators). Incorporating both methods for cross-validation is vital as studies show that evaluative and emotional responses can involve distinct neural circuitry; people could have different thoughts and feelings about the same building. For instance, in one study, aesthetic judgments of architecture were shown to activate neural regions of the prefrontal cortex, including the frontopolar cortex and the superior frontal gyrus, and areas involved in memory retrieval, which differ from reward circuitry associated with emotions [34].These activated neural regions imply that aesthetic judgment may be affected “by inputs from the knowledge-meaning systems such as expertise, cultural trends, and an understanding of a building’s intended function” [22]. Thus, it is essential to understand both objective and subjective dimensions of architectural experience and to execute a parametric analysis to examine the association between bio-signals and subjective assessment [41].

3.4.2. Biometric Indicators and Interpretation

This paper investigated the use of biometric tools to measure positive emotion. An emotional experience is a reaction to a stimulus that processes the subcortical and cortical brain networks [3]. Emotional states are identified through individual patterns of central nervous system response [42]. Furthermore, the intensity of an emotional expression is measured by brain waves [43]. Since this study views human emotion as an action in response to an elicitor [43], neurophysiological emotions are measured through neuroimaging techniques indicating both the central nervous and autonomic nervous systems.
For EEG, 40% of the oscillations in the time domain were higher across all channels in the positively configured environment (stress-reducing) than in the negatively configured environment (stress-inducing). The raw EEG data were first normalized against baseline signals to bring the different data to a comparable scale. For EEG, higher theta and alpha bands are related to meditation and relaxation, especially for frontal channels (i.e., F3/F4 and F7/F8). In contrast, lower beta band power (14–40 Hz) is associated with active, busy, or anxious thinking. fMRI images of people viewing pleasurable images show activation of the precuneus, middle frontal gyrus, and anterior cingulate cortex [34]. With ECG, higher rates of HRV indicate anxiety and thus refer to negative emotion. The experience of pleasure can also be measured by EMG, where the zygomaticus major muscle is associated strongly with feelings of happiness [23]. For eye-tracking, research results confirmed that the pupil diameter relates to emotional assessment, with an increase in the diameter typical of positive experience and a decrease in the diameter typical of negative experience [12]. For GSR data, SCR was higher in the hostile environment, indicating stress, and the average number of peaks in a positively configured environment increased by 154% from a stress-reducing climate to a stress-inducing one. Participants showed more reductions in BP and SCL from baseline when a biophilic atmosphere is compared to a non-biophilic environment [37]. AVNN, the average N–N interval, HRV features’ metrics also showed higher for the stress-reducing environment, indicating more relaxation.
Some papers demonstrated inconsistent results. One inconsistency was seen in anxiety levels. A high average peak elevation of GSR levels, indicating high anxiety, was correlated with the self-assessed experience of pleasure [5]. While in other cases, high relaxation and thus low anxiety were related to happiness. Thus, the lack of uniform protocol and consistency across results in data analysis procedures leads to inconclusive results. There could also be a discrepancy between the subjective and objective outcomes. For example, in one study, the finding that experts in design preferred sharp-angled spaces while non-experts preferred curvilinear was confirmed by traditional measuring methodology (questionnaires and observations) [31]. However, the same result was not distinctly recognized in the biodata captured and thus significance was reduced.
Eye-tracking devices used to analyze visual attention and emotional arousal in response to architectural components and interior design elements [28]. In addition, a comparative study could be conducted to distinguish the level of attention of different sectors of groups representing an archetype, with results revealing the characteristics of each group. Such a study design can reflect the primary interests in the architectural research field.

4. Discussion

4.1. Limitations of Current Research

The review from the included papers showed some limitations in terms of population, settings, interventions, comparators, and outcomes measured using biometric tools. The limitations need to be reflected in the enhancement of the testing conditions and this paper discussed suggestions.
The population was limited to healthy subjects to reduce gaps in bio reaction because the results may vary depending on the physiological characteristics of an individual, such as physical condition and health status. However, the limitation is that it does not reflect age or cultural differences, and draws results limited to specific subjects. Some additional limitations included the lack of representation of the population that, as a result, failed to reflect the age and cultural differences in the results. The subjects ranged in age from 20 to 30 years. It would be necessary to extend the research to a diverse group of age ranges by considering schools for children and hospitals for seniors. Experiments using neuroscience techniques find it difficult to recruit subjects, and small sample sizes are another limitation.
As for the experimental setting, we suggest the creation of a virtual environment which is more immersive than traditional 3D rendering. Using a CAVE or VR headset, measuring biometric data while immersed in the space is essential. Future research needs to be extended to a fully immersive virtual environment simulation with intentional interactions and tasks using emerging technologies. The VR environment that provides an audio–visual connection could compensate for the limitation of visual connection to the environment.
A lack of variety in the design intervention of independent variables, usually limited to one factor, such as form, color, lighting, and furniture, also signals the need to design multiple and complex conditions. When designing an architectural space, architects and designers consider many factors. In particular, the atmosphere is not determined by only one environmental factor. Thus, environmental factors (e.g., thermal, humidity, light, acoustics, air quality) and architectural/interior design factors must be considered at multisensory levels [9]. In addition, experiments should be conducted to test various types of space. Finally, it is necessary to consider design elements of architectural environments according to purpose and function, such as hospital, school, commercial, and exhibition spaces.
Regarding the biometric tools used, most studies are limited to one biometric mean, and it might damage the accuracy of generalizing the results. In addition, the analysis methods in most studies are limited to statistical analysis. Additionally, the study’s results were limited to descriptive analyses of related research. However, the novelty of these techniques means that no standard protocol has been developed to guide their use in research.

4.2. Future Research Agenda

The results of the reviews indicated areas of limitations. Therefore, to fill the gaps in knowledge in this field, a conceptual framework focused on future implications has been proposed in the present research (Figure 2).
The proposed constructs are based on Mehrabian and Russell’s theoretical framework of the stimulus–organism–response model. This model describes how people respond to environmental stimuli such as design elements, ambiance, and social factors. In addition, it examines their emotional responses regarding pleasure, arousal, and dominance and whether these responses influence their behavior in terms of approach or avoidance [15]. The proposed constructs in this paper include external stimuli (i.e., built or virtual environment), human senses (i.e., vision, hearing, smell, touch, taste), emotional response (i.e., positive or negative), and behavioral response (i.e., perception, performance change, behavioral health).
This framework illustrates that various tangible and intangible variables in architectural environments can be tested as environmental and spatial factors. The human factors are also a key consideration in understanding individual differences. Objective measures from multimodal biometric data and subjective measures from surveys and interviews can be combined to achieve more comprehensive results and will help discover underlying emotions. Furthermore, through carefully designed experiments, the causal relationship between human experiences in designed spaces and design elements needs to be conclusively drawn so that the results of the biodata obtained from the body can be attributed to each design element [44].
Future research needs to magnify a methodology with a multimodal biometric tool. There is a limit to how each tool can measure emotion. The mixed use of subjective and objective methodologies using biometrics can allow cross-validation and elucidation of results and lead to comprehensive results. While biometric data reflect instantaneous effects of forms, analyses of subjective data from surveys or interviews can be performed after experiments to compare covariations between physiological activity and subjective ratings. In-depth interviews also can help understand the causes of the results. The comparability of biometrics and self-assessment is also an excellent way to complement their respective strengths and weaknesses. Thus, further strategic developments are required to obtain more accurate results.
Future research is suggested to develop a prediction model, forecast individuals’ emotional responses, and find their preferred architectural environments. In addition, it is helpful to consider analyzing big data using machine learning analysis and deriving participants’ data patterns for classifying each emotion using machine learning algorithms. Finally, future research needs to develop an evidence-based design methodology further, and the results of the experiments can guide data-driven decision-making procedures.
To compensate for the novelty of the techniques, when a reproducible and standard practice is developed, more authentic results can be obtained; these can be utilized in various practical ways in our daily lives. Furthermore, related research can be explored using the latest VR/AR technologies to evaluate the user experience in extended reality.

5. Conclusions

This study illuminated how people experience architectural spaces and explored users’ emotional responses to design elements. Biometric tools allow a better understanding of the interrelation between humans and the built environment. Architectural spaces are experienced in a myriad of ways, and extensive efforts have been made to quantify human experiences; such processes involve identifying the variables and the causal relations between the independent and dependent variables.
This study identified the positive emotions measured by biometric tools in relation to design characteristics in architectural environments. Our findings have potential applications in design practice and can contribute to a broader trend in the area toward evidence-based design. The conceptual framework focused on future implications proposed in this study extended the body of knowledge of Mehrabian and Russell’s environmental psychology approach. In a theoretical framework, this study suggests including tangible and intangible attributes in architectural environments and investigating the effects of environmental and spatial factors on emotional and behavioral responses. Future research can also examine how individual characteristics, such as cultural background, gender, and age, affect emotions in architectural spaces. These studies can use multimodal biometric tools to measure emotions in architectural environments and be supplemented by subjective measures such as surveys or interviews.
Researchers can use emerging technologies to evaluate emotional experiences using more immersive virtual simulation with intentional interactions and tasks. However, the novelty of these neuroscience techniques means that no standard protocol has yet been developed to guide their use in VR research. More authentic results could be obtained when a reproducible and standard practice is developed. Further analysis revealed how different types of stimuli and spatial designs produce either positive or negative emotional affect in a metaverse environment.
Neuroarchitecture can create more human-centered design by understanding the emotions that design can elicit. Architects must understand the feelings and preferences of a building’s users beyond functionally designing the spaces. And physiological and brain measures are synthetic methods that provide information about the human behavior that are non-verbal and reflect the subconscious or unconscious reactions [45]. The benefits of well-designed facilities also manifest practically. For example, results show better hospital recovery, enhanced learning in schools, and enhanced productivity in offices under various architectural design features [46,47]. In contrast, poorly designed buildings elicit negative effects, such as the sick building syndrome (SBS), which is linked to sickness resulting from occupants’ time in the facilities [48].
The studies will help identify the elements which people are more sensitive to and can support designers in controlling their plans for specific emotional effects in their designs. On the other hand, due to the nature of interior design, it is difficult to consider the complex influence of various factors, so the experimental design such as variable selection The information reveals information that are non-verbal and reflect the subconscious or unconscious reactions. The quantified results can also be biometrics for scientific validation/invalidation of traditional design knowledge and help solidify/expand our knowledge of the design field. With more consistent experimental procedures and methods using neuroscience and physiology and accurate identification of variable selection and control conditions, higher accuracy of analysis results is expected.
This transdisciplinary combination of neuroscience, architecture, and environmental psychology will help develop architectural environments that encourage positive emotions that optimize mental health and well-being.

Author Contributions

Conceptualization, N.K.; methodology, N.K. and J.K; validation, J.K. and N.K.; formal analysis, J.K.; investigation, J.K. and N.K.; resources, J.K.; data curation, N.K.; writing—original draft preparation, J.K. and N.K.; writing—review and editing, N.K.; visualization, N.K.; supervision, N.K.; project administration, N.K.; funding acquisition, N.K. All authors have read and agreed to the published version of the manuscript.

Funding

This work was supported by Basic Science Research Program through the National Research Foundation of Korea (NRF) funded by the Ministry of Education [NRF-2020R1I1A1A01073447].

Institutional Review Board Statement

Not applicable.

Informed Consent Statement

Not applicable.

Data Availability Statement

Not applicable.

Conflicts of Interest

The authors declare no conflict of interest. The funders had no role in the design of the study; in the collection, analyses, or interpretation of data; in the writing of the manuscript, or in the decision to publish the results.

References

  1. Evans, G.W.; McCoy, J.M. When buildings don’t work: The role of architecture in human health. J. Environ. Psychol. 1998, 18, 85–94. [Google Scholar] [CrossRef] [Green Version]
  2. Homolja, M.; Maghool, S.A.H.; Schnabel, M.A. The impact of moving through the built environment on emotional and neurophysiological states: A systematic literature review. In Proceedings of the 25th International Conference of the Association for Computer-Aided Architectural Design Research in Asia (CAADRIA), Bangkok, Thailand, 5–6 August 2020; Volume 1, pp. 641–650. [Google Scholar]
  3. Bower, I.; Tucker, R.; Enticott, P.G. Impact of built environment design on emotion measured via neurophysiological correlates and subjective indicators: A systematic review. J. Environ. Psychol. 2019, 66, 101344. [Google Scholar] [CrossRef]
  4. Eberhard, J.P. Brain Landscape the Coexistence of Neuroscience and Architecture; Oxford University Press: Oxford, UK, 2009. [Google Scholar]
  5. Ergan, S.; Radwan, A.; Zou, Z.; Tseng, H.-A.; Han, X. Quantifying Human Experience in Architectural Spaces with Integrated Virtual Reality and Body Sensor Networks. J. Comput. Civ. Eng. 2019, 33, 04018062. [Google Scholar] [CrossRef]
  6. Nanda, U.; Pati, D.; Ghamari, H.; Bajema, R. Lessons from neuroscience: Form follows function, emotions follow form. Intell. Build. Int. 2013, 5, 61–78. [Google Scholar] [CrossRef]
  7. Ugwitz, P.; Kvarda, O.; Juříková, Z.; Šašinka, Č.; Tamm, S. Eye-Tracking in Interactive Virtual Environments: Implementation and Evaluation. Appl. Sci. 2022, 12, 1027. [Google Scholar] [CrossRef]
  8. Karakas, T.; Yildiz, D. Exploring the influence of the built environment on human experience through a neuroscience approach: A systematic review. Front. Archit. Res. 2020, 9, 236–247. [Google Scholar] [CrossRef]
  9. Mostafavi, A. Architecture, biometrics, and virtual environments triangulation: A research review. Archit. Sci. Rev. 2021, 1–18. [Google Scholar] [CrossRef]
  10. Gero, J.; Milovanovic, J. A framework for studying design thinking through measuring designers’ minds, bodies and brains. Des. Sci. 2020, 6, E19. [Google Scholar] [CrossRef]
  11. Guan, H.; Hu, S.; Lu, M.; He, M.; Zhang, X.; Liu, G. Analysis of human electroencephalogram features in different indoor environments. Build. Environ. 2020, 186, 107328. [Google Scholar] [CrossRef]
  12. De la Fuente Suárez, L.A. Subjective experience and visual attention to a historic building: A real-world eye-tracking study. Front. Arch. Res. 2020, 9, 774–804. [Google Scholar] [CrossRef]
  13. Watson, D.; Tellegen, A. Toward a consensual structure of mood. Psychol. Bull. 1985, 98, 219–235. [Google Scholar] [CrossRef]
  14. Bakker, I.; Van Der Voordt, T.; Vink, P.; De Boon, J. Pleasure, Arousal, Dominance: Mehrabian and Russell revisited. Curr. Psychol. 2014, 33, 405–421. [Google Scholar] [CrossRef] [Green Version]
  15. Mehrabian, A.; Russell, J.A. An Approach to Environmental Psychology; MIT Press: Cambridge, MA, USA, 1974. [Google Scholar]
  16. Kuppens, P.; Tuerlinckx, F.; Russell, J.A.; Barrett, L.F. The relation between valence and arousal in subjective experience. Psychol. Bull. 2013, 139, 917. [Google Scholar] [CrossRef] [PubMed] [Green Version]
  17. Russell, J.A. My psychological constructionist perspective, with a focus on conscious affective experience. In The Psychological Construction of Emotion; Guilford Press: New York, NY, USA, 2015; pp. 183–208. [Google Scholar]
  18. Zeizel, J. Inquiry by Design: Environment/Behavior/Neuroscience in Architecture, Interiors, Landscape and Planning; Eberhard, J.P., Ed.; Norton: New York, NY, USA, 2006. [Google Scholar]
  19. Chatterjee, A.; Coburn, A.; Weinberger, A. The neuroaesthetics of architectural spaces. Cogn. Process. 2021, 22, 115–120. [Google Scholar] [CrossRef] [PubMed]
  20. Chatterjee, A. The Aesthetic Brain: How We Evolved to Desire Beauty and Enjoy Art; Oxford University Press: New York, NY, USA, 2013. [Google Scholar]
  21. Shimamura, A. Experiencing Art: In the Brain of the Beholder; Oxford University Press: New York, NY, USA, 2013. [Google Scholar]
  22. Coburn, A.; Vartanian, O.; Chatterjee, A. Buildings, Beauty, and the Brain: A Neuroscience of Architectural Experience. J. Cogn. Neurosci. 2017, 29, 1521–1531. [Google Scholar] [CrossRef] [Green Version]
  23. Jang, J.Y.; Baek, E.; Yoon, S.Y.; Choo, H.J. Store design: Visual complexity and consumer responses. Int. J. Des. 2018, 12(2), 105–118. [Google Scholar]
  24. AL-Ayash, A.; Kane, R.T.; Smith, D.; Green-Armytage, P. The influence of color on student emotion, heart rate, and performance in learning environments. Color Research & Application 2016, 41, 196–205. [Google Scholar]
  25. Banaei, M.; Hatami, J.; Yazdanfar, A.; Gramann, K. Walking through Architectural Spaces: The Impact of Interior Forms on Human Brain Dynamics. Front. Hum. Neurosci. 2017, 11, 477. [Google Scholar] [CrossRef] [PubMed]
  26. Bower, I.S.; Clark, G.M.; Tucker, R.; Hill, A.T.; Lum, J.A.; Mortimer, M.A.; Enticott, P.G. Built environment color modulates autonomic and EEG indices of emotional response. Psychophysiology. 2022, e14121. [Google Scholar] [CrossRef]
  27. Cha, S.H.; Zhang, S.; Kim, T.W. Effects of interior color schemes on emotion, task performance, and heart rate in immersive virtual environments. Journal of Interior Design 2020, 45, 51–65. [Google Scholar]
  28. Kim, N.; Lee, H. Assessing Consumer Attention and Arousal Using Eye-Tracking Technology in Virtual Retail Environment. Front. Psychol. 2021, 2861. [Google Scholar] [CrossRef] [PubMed]
  29. Kotradyova, V.; Vavrinsky, E.; Kalinakova, B.; Petro, D.; Jansakova, K.; Boles, M.; Svobodova, H. Wood and Its Impact on Humans and Environment Quality in Health Care Facilities. Int. J. Environ. Res. Public Health 2019, 16, 3496. [Google Scholar] [CrossRef] [PubMed] [Green Version]
  30. Küller, R.; Mikellides, B.; Janssens, J. Color, arousal, and performance—A comparison of three experiments. Color Res. Appl. Endorsed By Inter-Soc. Color Counc. Colour Group (Great Br.), Can. Soc. Color Color Sci. Assoc. Jpn. Dutch Soc. Study Color Swed. Colour Cent. Found. Colour Soc. Aust. Cent. Français De La Coul. 2009, 34, 141–152. [Google Scholar] [CrossRef]
  31. Shemesh, A.; Talmon, R.; Karp, O.; Amir, I.; Bar, M.; Grobman, Y.J. Affective response to architecture – investigating human reaction to spaces with different geometry. Arch. Sci. Rev. 2017, 60, 116–125. [Google Scholar] [CrossRef]
  32. Shin, Y.-B.; Woo, S.-H.; Kim, D.-H.; Kim, J.; Kim, J.-J.; Park, J.Y. The effect on emotions and brain activity by the direct/indirect lighting in the residential environment. Neurosci. Lett. 2015, 584, 28–32. [Google Scholar] [CrossRef]
  33. Tuszyńska-Bogucka, W.; Kwiatkowski, B.; Chmielewska, M.; Dzieńkowski, M.; Kocki, W.; Pełka, J.; Przesmycka, N.; Bogucki, J.; Galkowski, D. The effects of interior design on wellness: Eye- tracking analysis in determining emotional experience of architectural space. A survey on a group of volunteers from the Lublin Region, Eastern Poland. Ann. Agric. Environ. Med. 2020, 27, 113–122. [Google Scholar] [CrossRef] [PubMed]
  34. Vartanian, O.; Navarrete, G.; Chatterjee, A.; Fich, L.B.; Leder, H.; Modroño, C.; Nadal, M.; Rostrup, N.; Skov, M. Impact of contour on aesthetic judgments and approach-avoidance decisions in architecture. Proc. Natl. Acad. Sci. USA 2013, 110, 10446–10453. [Google Scholar] [CrossRef] [PubMed] [Green Version]
  35. Vartanian, O.; Navarrete, G.; Chatterjee, A.; Fich, L.B.; Gonzalez-Mora, J.L.; Leder, H.; Modroño, C.; Nadal, M.; Rostrup, N.; Skov, M. Architectural design and the brain: Effects of ceiling height and perceived enclosure on beauty judgments and approach-avoidance decisions. J. Environ. Psychol. 2015, 41, 10–18. [Google Scholar] [CrossRef]
  36. Vecchiato, G.; Tieri, G.; Jelic, A.; De Matteis, F.; Maglione, A.G.; Babiloni, F. Electroencephalographic Correlates of Sensorimotor Integration and Embodiment during the Appreciation of Virtual Architectural Environments. Front. Psychol. 2015, 6, 1944. [Google Scholar] [CrossRef] [PubMed] [Green Version]
  37. Yin, J.; Arfaei, N.; Macnaughton, P.; Catalano, P.J.; Allen, J.G.; Spengler, J.D. Effects of biophilic interventions in office on stress reaction and cognitive function: A randomized crossover study in virtual reality. Indoor Air 2019, 29, 1028–1039. [Google Scholar] [CrossRef] [PubMed]
  38. Yin, J.; Yuan, J.; Arfaei, N.; Catalano, P.J.; Allen, J.G.; Spengler, J.D. Effects of biophilic indoor environment on stress and anxiety recovery: A between-subjects experiment in virtual reality. Environ. Int. 2020, 136, 105427. [Google Scholar] [CrossRef]
  39. Yoon, S.Y.; Wise, K. Reading emotion of color environments: Computer simulations with self-reports and physiological signals. In Industrial Applications of Affective Engineering; Springer: Cham, Switzerland, 2014; pp. 219–232. [Google Scholar]
  40. Zhang, Z.; Zhuo, K.; Wei, W.; Li, F.; Yin, J.; Xu, L. Emotional Responses to the Visual Patterns of Urban Streets: Evidence from Physiological and Subjective Indicators. Int. J. Environ. Res. Public Health 2021, 18, 9677. [Google Scholar] [CrossRef]
  41. Kim, S.; Ha, M. A systematic review of the attributes of interior design affecting user’s positive emotions measured via bio-signals. J. Archit. Inst. Korea 2020, 36, 83–91. [Google Scholar]
  42. Lee, Y.-Y.; Hsieh, S. Classifying Different Emotional States by Means of EEG-Based Functional Connectivity Patterns. PLoS ONE 2014, 9, e9541. [Google Scholar] [CrossRef]
  43. Kim, M.; Chong, S.C.; Chun, C.; Choi, Y. Effect of thermal sensation on emotional responses as measured through brain waves. Build. Environ. 2017, 118, 32–39. [Google Scholar] [CrossRef]
  44. Bratman, G.N.; Hamilton, J.P.; Daily, G.C. The impacts of nature experience on human cognitive function and mental health. Ann. New York Acad. Sci. 2012, 1249, 118–136. [Google Scholar] [CrossRef]
  45. Hu, L.; Shepley, M.M. Design Meets Neuroscience: A Preliminary Review of Design Research Using Neuroscience Tools. J. Inter. Des. 2022, 47, 31–50. [Google Scholar] [CrossRef]
  46. Dudek, M. Architecture of Schools: The New Learning Environments; Routledge: New York, NY, USA, 2000. [Google Scholar]
  47. Goldhagen, S.W. How the Built Environment Shapes Our Lives; Harper Collins Publisher: New York, NY, USA, 2017. [Google Scholar]
  48. Dravigne, A.; Waliczek, T.M.; Lineberger, R.D.; Zajicek, J.M. The effect of live plants and window views of green spaces on employee perceptions of job satisfaction. HortScience 2008, 43, 183–187. [Google Scholar] [CrossRef]
Figure 1. Diagram of the systematic review and meta-analysis workflow.
Applsci 12 09998 g001
Figure 2. Conceptual framework for future implications.
Applsci 12 09998 g002
Table 1. PICOS framework.
CriteriaCategory
ParticipantRespondents’ characteristics: Sample size, age, gender, condition
InterventionVariables being tested for: Design characteristics in an architectural environment
ComparatorConditions of comparison within each group of independent variables
OutcomeResults of biometric data retrieved from experiments
SettingControlled experimental conditions: setup—laboratory, field experiment, virtual environment; stimuli—2D images, 3D images, VR contents; display method of stimuli—computer screen, projection, VR headset
Table 2. Characteristics of participants.
Author (Year)Sample SizeAge Condition
Al-Ayash et al.,
(2016)
[24]
2420–38Undergraduate and postgraduate students at Curtin University in Western Australia; gender—male = 11, female = 13.
Banaei et al.,
(2017)
[25]
1528.6
(Mean)
Non-architecture students; normal vision; gender—male = 7, female = 8.
Bower et al.,
(2019)
[26]
1818–55Normal or corrected-to-normal vision; no prior experience or training in built environment design; gender—male = 10, female = 8.
Cha et al.,
(2020)
[27]
5520-28Engineering students and management and education students; gender — male = 48, female =7.
De la Fuente Su’arez et al., (2020)
[12]
4017
(Mean)
First-semester architecture students.
Ergan et al.,
(2019)
[5]
3321–30Students or faculty or staff members at university; gender—male = 22, female = 11.
Jang et al.,
(2018)
[23]
2720–30Undergraduate and graduate students; gender—female = 27.
Kim and Lee,
(2021)
[28]
5021–35Gender: male = 25, female = 25.
Kotradyova et al.,
(2019)
[29]
50NRNR
Kuller et al.,
(2009)
[30]
12–2517–54High school and university students; school of architecture students.
Shemesh et al.,
(2017)
[31]
42NR21 experts; 21 non-experts.
Shin et al., (2015)
[32]
2822.5
(Mean)
Gender: male = 16, female = 12.
Tuszyńska-Bogucka et al. (2020)
[33]
20218–49Volunteers from rural areas of the Lublin region in Eastern Poland; gender—male = 99, female = 103.
Vartanian et al. (2013)
[34]
1823.39
(Mean)
Normal vision; gender—male = 6, female = 12.
Vartanian et al. (2015)
[35]
1823.38
(Mean)
Normal vision; right-handed; gender—male = 6, female = 12.
Vecchiato et al. (2015)
[36]
1226.8
(Mean)
Normal vision; gender—male = 7, female = 5.
Yin et al. (2019)
[37]
30 Students and staff from the Harvard TH Chan School of Public Health
Yin et al. (2020)
[38]
100NRHarvard-affiliated faculty, staff, and students.
Yoon and Wise (2014)
[39]
32NRStudents from Midwestern university.
Zhang et al., (2021)
[40]
2618–22: 14
23–25: 11
Above 25: 1
Students from Peking university; gender—male = 12, female = 14.
NR—not reported.
Table 3. Summary of design variables, biometric tools, and outcomes.
InterventionsVisual Stimuli Biometric (Tools)Biometric (Indicators)OutcomesAuthor (Year)
FormForm:

- Linear
- Curvilinear
- Linear
Applsci 12 09998 i001

Applsci 12 09998 i002
- Curvilinear
Applsci 12 09998 i003

Applsci 12 09998 i004
EEGCurvilinear:

• EMG
- Activate anterior cingulate cortex (ACC)
- Stronger θ synchronization in the ACC
Curvilinear:

Positive emotion
Banaei et al.,
(2017)
[25]
Form:

Spatial design in virtual retail environment
- Sales and displayApplsci 12 09998 i005
- Service
Applsci 12 09998 i006
Eye-tracking(Sales area and service area):
-Environmental factors
-Display factors
-Communication factors

• Eye-tracking
- Higher combination of total dwell time (TDT), total fixation count (TFC), and average pupil diameter (APD)
(Sales area)
Environmental factors (e.g., facade, ceiling): Higher visual attraction

Display factors
(e.g., wall fixture): Higher combination of visual attraction and emotional arousal

(Service area)
Communication factor (e.g., media screen): Higher visual attraction
Kim and Lee.,
(2021)
[28]
Form:

- Sharp-angled
- Curvilinear
- Sharp-angled
Applsci 12 09998 i007
- Curvilinear
Applsci 12 09998 i008
EEG(Experts)
Sharp-angled space:

• EEG
- Difference not recognized
- Confirmed by questionnaires

(Non-experts)
Curvy-shaped space:

• EEG
- Difference not recognized
- Confirmed by questionnaires
(Experts)
Sharp-angled space:
Beautiful

(Non-experts)
Curvy-shaped space:

Beautiful
Shemesh et al.,
(2017)
[31]
Form:

- Golden-ratio proportion
- Violation of golden-ratio proportion
- Orthogonal cubic interior in the shape of a cuboid
-Golden-ratio
Applsci 12 09998 i009
-Violation of golden-ratio
Applsci 12 09998 i010
-Orthogonal cubic interior in the shape of a cuboid
Applsci 12 09998 i011
Eye-trackingGolden-ratio proportion:

• Eye-tracking
- Large pupil dilation
Golden-ratio proportion:

Higher emotional assessment
(Attractiveness, security, and comfort)
Tuszyńska-Bogucka
et al.,
(2020)
[33]
Form:

- Curvilinear
- Rectilinear
- Curvilinear
Applsci 12 09998 i012
- Rectilinear
Applsci 12 09998 i013
fMRICurvilinear:

• fMRI
- Activate precuneus
(PN)
- Activate middle
frontal gyrus
- Activate ACC
Curvilinear:

Pleasant
Vartanian et al.,
(2013)
[34]
Form:

- High ceiling
- Low ceiling

- High ceiling
Applsci 12 09998 i014
- Low ceiling
Applsci 12 09998 i015
fMRIHigh ceiling:

• fMRI
- Activated structures involved in visuospatial exploration and attention in the dorsal stream
High ceilings:

Pleasant
Vartanian et al.,
(2015)
[35]
Form:

- Open room
- Enclosed room
- Open room
Applsci 12 09998 i016
Applsci 12 09998 i017
- Enclosed room
Applsci 12 09998 i018
fMRIOpen room:

• fMRI
- Activated structures underlying perceived visual motion
Open room:

Beautiful
Vartanian et al.,
(2015)
[35]
Form
(Constituent parts):

- Rate of diversity
- Rate of division
- Examples of different scenes
Applsci 12 09998 i019
- EEG
- EDA
- HR
Diverse and less fragmented scene:

• Synchronized observation of EEG, EDA, and HR
- Compared in linear regressions
Diverse and less fragmented scene:

Positive emotion
Zhang et al.,
(2021)
[40]
LayoutLayout:

- Grid layout
- Free-form layout
- Grid layout
Applsci 12 09998 i020
- Free-form layout
Applsci 12 09998 i021
- EMG
- EDA
(High fashion involvement)
High complexity (Free form):

• EMG
- Greater zygomatic EMG activities
• EDA
- Higher

(Low fashion involvement)
Low complexity (Grid):

• EMG
- Greater zygomatic EMG activities
• EDA
- Lower
(High fashion involvement)
High complexity
(Free form):

Pleasant

(Low fashion involvement)
Low complexity (Grid):

Pleasant
Jang et al.,
(2018)
[23]
MaterialMaterial:

Different parts of an exterior of a historic train station
- 16 zones of the building composed of one or more areas of interest (AOIs)
Applsci 12 09998 i022
Eye-trackingHigh-quality architecture:

• Eye-Tracking
- Longer observation time
High-quality architecture:

Pleasant
De la Fuente
Su’arez et al.,
(2020)
[12]
Material:

- Wooden room
- Other
- Wooden room
Applsci 12 09998 i023
- Other
Applsci 12 09998 i024
- EEG
- ECG
Wooden room:

• EEG
- Decrease in EEG α by −17%
- Decrease in EEG β by −13% and increase of +36% after longer exposure
- Decrease in SMR waves by −7%
• ECG
- Decrease in the LF/HF ration by 26.4% (p = 0.06)
Wooden room:

Regenerative and Positive impact
Kotradyova et al.,
(2019)
[29]
Material:
- Non-biophilic
- Natural elements
(Green plants)
- Natural analogues
(Natural materials)
- Non-biophilic
Applsci 12 09998 i025
- Natural elements
Applsci 12 09998 i026
- Natural analogues
Applsci 12 09998 i027
Applsci 12 09998 i028
- HRV
- HR
- SCL
- Eye-Tracking
Biophilia:

• HRV
- Increase in RMSSD
• HR
- Decrease
• SCL
- Decrease
• Eye-tracking
- Spend more time
Biophilia:

Restorative
(Less stress)
Yin et al.,
(2019)
[37]
Material:

- Non-biophilic
- Indoor green
(Green plants, Wooden material)
- Outdoor view
(Natural environments)
- Combination
- Non-biophilic
Applsci 12 09998 i029
- Indoor green
Applsci 12 09998 i030
- Outdoor view
Applsci 12 09998 i031
- Combination
Applsci 12 09998 i032
- HRV
- HR
- SCL
- BP
- ECG
Indoor green:

• HRV
- RMSSD 2.1% faster, higher value indicating increased
parasympathetic activities
• HR
- The hazard ratios of complete recovery > 1
• SCL
- Stable
• BP
- Improve diastolic blood pressure
Biophilic environment:

Restorative
(Less stress, Anxiety)

* Indoor green (green plants, wooden material) condition resulted in physiological stress recovery
* Outdoor view (natural environment) condition resulted in anxiety reduction
Yin et al.,
(2020)
[38]
ColorColor
(Hue):

-Blue
-Yellow
-Red
Blue
Applsci 12 09998 i033
-Yellow
Applsci 12 09998 i034
-Red
Applsci 12 09998 i035
Heart RateBlue:

• Heart rate
-Decrease
Blue:

More pleasant
Al-Ayash et al.,
(2016)
[24]
Color:

- Blue (Chromatic)
- White (Achromatic)
- Black (Resting)
- Blue - White - Black
Applsci 12 09998 i036
-EEG
-GSR
Blue:

• EEG
- Increase in the α frontal midline power and frontal hemispheric lateralization
- Increased power spectral density across all electrodes for the θ, α, β bandwidths

• GSR (SCR)
- Increase skin conductance response

• HRV
- Decrease in RMSSD
Red:

Restorative
Bower et al.,
(2019)
[26]
Color:

-Red
-Green
-Blue
-White
-Red
Applsci 12 09998 i037
-Green
Applsci 12 09998 i038
-Blue
Applsci 12 09998 i039
-White
Applsci 12 09998 i040
Heart
Rate
Red:

• Heart Rate
-Smallest decrease
Red:

Unpleasant
Cha et al.,
(2020)
[27]
Color:

- Monochromatic
- Multichromatic
- Monochromatic
Applsci 12 09998 i041
- Multichromatic
Applsci 12 09998 i042
- EMG
- EDA
(High fashion involvement)
High complexity (Multitone):

• EMG
- Greater zygomatic EMG activities
• EDA
- Higher

(Low fashion involvement)
Low complexity (monochromatic):

• EMG
- Greater zygomatic EMG activities
• EDA
- Lower
(High fashion involvement)
High complexity (Multitone):

Pleasant

(Low fashion involvement)
Low complexity
(monochromatic):

Pleasant
Jang et al.,
(2018)
[23]
Color (Hue):

- Red
- Blue

Color (Complexity):

- Monochromatic (gray)
- Multichromatic (colorful)
- Example of a red office
Applsci 12 09998 i043
- EEG
- EKG
Blue:

• EEG
- Greater EEG δ waves
- Greater EEG α rhythm

Colorful and Gray:

• EEG
- Analog power analysis of EEG α is lower in the colorful room than gray room
• HR
-Lower in the colorful room
Red, blue:

Average pleasant (red more pleasant than blue when office work is introduced)

Colorful and gray:

Unpleasant
Kuller et al.,
(2009)
[30]
Color (room for rest and relaxation/
recreation):

- Bright colors
- Grey
- Subdued colors
- Bright colors
Applsci 12 09998 i044
- Grey
Applsci 12 09998 i045
-Subdued colors
Applsci 12 09998 i046
Eye-Tracking(Room for rest and relaxation/recreation)
Monochromatic with bright colors:

• Eye-Tracking
- Large pupil dilation
(Room for rest and relaxation/recreation)
Monochromatic with Grey, Bright Colors:

Positive emotion
Tuszyńska-Bogucka
et al.,
(2020)
[33]
Color (Room for studying/work):

- Bright colors
- Grey
- Subdued colors
-Bright colors
Applsci 12 09998 i047
-Grey
Applsci 12 09998 i048
-Subdued colors
Applsci 12 09998 i049
Eye-Tracking(Room for studying/work)
Subdued colors:

• Eye-Tracking
- Large pupil dilation
(Room for studying/work)
Subdued colors:

Positive emotion
Tuszyńska-Bogucka
et al.,
(2020)
[33]
Color (Bedroom)

- Colorful
- Soft
- Calm
- Heavy and deep
- Agile
- Colorful
Applsci 12 09998 i050
- Soft
Applsci 12 09998 i051
- Calm
Applsci 12 09998 i052
- Heavy and Deep
Applsci 12 09998 i053
- Agile
Applsci 12 09998 i054
- SCL
- EMG
Colorful:

• SCL
- Greatest
• EMG
- Corrugator activation
higher than calm and soft

Calm and Soft:

• SCL
- Smaller initial peaks
- Greatest sustained arousal
• EMG
- Lowest corrugator activation

Heavy and Deep:

• SCL
- Failed
• EMG
- Higher than calm and soft

Agile:

• SCL
- Failed
• EMG
- Higher than calm and soft
Brighter combination:

Greater pleasantness

(Soft > Calm)
(Bright > Gray Tones = Calm and Heavy and Deep)
Yoon and Wise
(2014)
[39]
Color (Hue):

- Red
- Green
- Blue
- Gray
- White
- Black
- Example of different scenes
Applsci 12 09998 i055
- EEG
- EDA
- HR
Vegetation/greenish colors:

• Synchronized observation of EEG, EDA, and HR
- Compared in linear regressions
Vegetation/greenish color:

Positive emotion
(comfort, relaxation, vitality)
Zhang et al.,
(2021)
[40]
FurnitureFurniture:

- Empty
- Modern style
- Cutting edge
- Empty
Applsci 12 09998 i056
- Modern style
Applsci 12 09998 i057
- Cutting edge
Applsci 12 09998 i058
EEGInterior with objects:

• EEG
- Increase in θ power across visuomotor circuits
- Activation of α band in areas devoted to visuospatial exploration and processing of categorical spatial relation
Interior with objects:

Pleasant
Vecchiato et al.,
(2015)
[36]
LightingLighting:

- Standard
(intensity above average, intensity > 3.5 in the gaming engine)
- Poor
(Intensity below average)
- Standard
Applsci 12 09998 i059
- Poor
Applsci 12 09998 i060
- EEG
- GSR (SCR)
- PPG (HRV)
Standard lighting:

• EEG
- Higher oscillations in the α, β, and θ frequency bands
• GSR (SCR)
- Lower average number
of SCR peaks as well as the amplitude of the peaks
• PPG (HRV)
- Less perspiration and heart
rate variability
- Higher AVNN score
Standard lighting:

Positive emotion
Ergan et al.,
(2019)
[5]
Lighting:

- Direct lighting
(700 lx downlight)
- Direct/Indirect lighting
(400 lx downlight, 300 lx uplight)
- Direct lighting
Applsci 12 09998 i061
- Direct/Indirect lighting
Applsci 12 09998 i062
EEGDirect/Indirect lighting:

• EEG
- Greater θ oscillations on the F4, F8, T4, and TP7 electrodes
Direct/Indirect lighting:

Pleasant, Cooler
Shin et al.,
(2015)
[32]
Publisher’s Note: MDPI stays neutral with regard to jurisdictional claims in published maps and institutional affiliations.

