Abstract
The Ria de Coruña (NW Spain) is a wide estuary recently formed by the flooding of the Mero fluvial valley lowlands during the last postglacial transgression. During the last glacial episode, with the sea level located more than 100 m below the current one, the final section of the Mero river and lateral tributaries contributed numerous deposits that the postglacial rise in sea level has partially flooded. Until now, the presence of these alluvial deposits disconnected from the main network by the Holocene marine transgression had been misinterpreted, especially for lack of an absolute chronology that would place them in an adequate paleoclimatic context. For the first time, a deposition age was assessed in this work by optically stimulated luminescence (OSL) dating back from 128 ka to 51 ka.
1. Introduction
The age of alluvial deposits on the Atlantic coast of Galicia (NW Spain) (Figure 1) is poorly known, despite the fact that they represent the existence of older continental processes where today marine processes are developing due to sea-level rise during the transgressive episodes of the Late Pleistocene and Holocene. The only available ages correspond to fluvial terraces of the lower course of the Miño River [1] and braided-type deposits of the lower Ulla River [2], both on the south coast, of the Late Pleistocene age, as some of the few examples dated with suitable techniques on the Atlantic coast of northwest Spain and northern Portugal related to coastal fluvial sediments and glacio-eustatic oscillations. It should be mentioned that any regional correlation could include a high contribution of uncertainty associated with neotectonic processes since this area has very particular characteristics as it is an extensive plate border with lithospheric uplift [1]—different from the Cantabrian Coast (N Spain) where the European plate subducts under the Iberian plate, showing much higher rates of lithospheric uplift that have been described [3]. For its part, the Atlantic coast of the southern Iberian Peninsula also presents its tectonic peculiarities due to the collision of the African and Iberian plates.
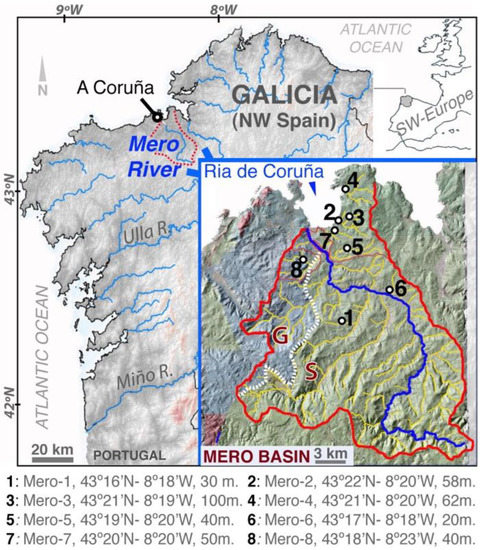
Figure 1.
Atlantic coast of Galicia (NW Spain) and the alluvial deposits studied in the Mero Basin and Ria de Coruña. S: Metasediments (green area); G: granitoids (blue area). (1, 2 … 8): Mero samples, UTM (WGS84) coordinates and relative height (m).
Regarding the alluvial deposits of the Mero River Basin, some of them are located on the current sea shore, in the innermost of the Ria de Coruña (Figure 1), a wide estuary formed by the flooding of the valley lowlands during the Holocene transgression [4]. Despite this, their chronology is still unknown. Tentative ages were ambiguously assigned from the Plio–Quaternary boundary [5,6] to the recent Quaternary [7]. Subsequent geomorphological studies on these sediments [4] proposed more recent relative ages by correlating their formation with sea-level oscillations during the Late Pleistocene. In this sense, the relative Holocene age assigned by other authors [8] was completely inconsistent. However, the impossibility of applying suitable dating techniques to these azoic sediments at that time prevented a more reliable age from being assigned.
Thus, the aim of this work was to obtain, for the first time, a depositional age for eight selected alluvial deposits of the Mero River (Figure 1) by optically stimulated luminescence (OSL) on quartz grains to situate them in a defined palaeo-climatic context.
2. Study Area
Mero River drainage basin (A Coruña, Galicia) (Figure 1) is a small network (350 km2) that originates in the Ria de Coruña. This ria, like the rest of the Galician Rias, are very particular formations formed as a result of the flooding by the sea of the lower areas of the valley during the last Holocene transgression [4].
Mero River basin mainly drains metasediments [9] from Ordes Complex, although the westernmost sector drains Hercynian granitoids (Figure 1). The Ordes Complex is the largest of the complexes in NW Iberia [10]. Its central part is occupied by extensive outcrops of the so-called upper units, up to 12 km thick. One of the units that make up the Ordes Complex is the Betanzos Unit, a sequence with a flysch appearance, composed mainly of metamorphic rocks, whose protoliths present characteristics of turbiditic greywackes, conglomerates, phyllites and calco–silicates, varying to black metapelites and quartzites in the lower part of the unit. The detailed study of these turbidite sequences suggests that their sedimentation took place in a deep submarine fan context, observing sedimentary facies that typically occur in distribution channels and lobes commonly associated with turbidite systems. The metagrauvakic sequences of the Ordes Complex are classified as immature feldspathic sandstones from a first sedimentary cycle and present low-grade metamorphism. In them, the grains are mainly formed by quartz, plagioclase and rock fragments. They present angular or subangular textures with poor classification within a shale matrix. These metagreywackes occupy the upper structural levels and are particularly well exposed along the shoreline, where they outcrop with a shale appearance. A detailed geochemical study of the metagreywackes of the Ordes Complex confirms their immature character, as well as their origin from a felsic igneous source with an affinity for an upper continental crust [10]. The maximum age of sedimentation calculated for the graywackes of the Ordes Series (c. 510–530 Ma) and the age of magmatism in the upper units (c. 500–520 Ma), as well as the presence of the abundant diabase dikes that intrude and cut the series, with age calculated for its formation of circa 510 Ma.
According to previous studies [4], the current disposition of the Mero River drainage basin over these materials is assumed to be less than 5 Ma ago, at which time the Tertiary endorheic basins, present at the head of the valley, collapsed and drained their waters towards the Atlantic, conditioned by tectonic processes related to the Alpine orogeny [4]. In this sense, no neotectonic differences can be observed within the basin [4]. At present, sedimentary deposits from this period are not found in the basin. Only small outcrops of alluvial deposits, probably Pleistocene up to +200 m above present sea level (apsl), are preserved. Among them are the sediments studied here, represented by undated younger alluvial deposits of variable thicknesses between 3 m and 20 m, formed by quartzite gravels (>80%) with sand and silt lenses [4,11]. For this work were sampled sand lenses (Figure 2) of the best-preserved levels at heights between +2 m to +60 m above present sea level (apsl), some of them located very close to the coastline (in Figure 1 are represented relative heights). These alluvial deposits would represent the last episode of the dismantling of the previous rocky materials and the formation of the fluvial valley that gave rise to the Ria de Coruña. The calculation of their age would extend the geological knowledge and the evolution of the coast in the study area within the age limit of the dating technique used here.
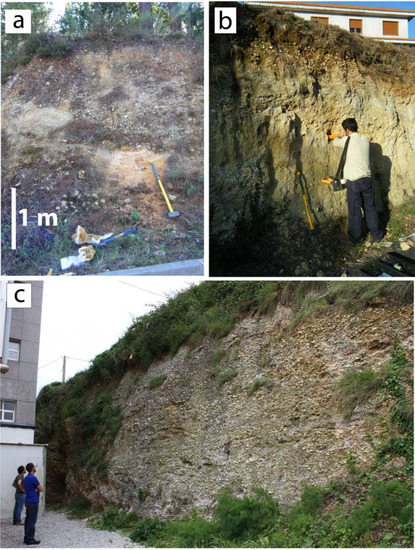
Figure 2.
Alluvial deposits in the Mero basin. Outcrops: Mero-1 (a), Mero-3 (b) and Mero-2 (c).
3. Materials and Methods
Sampling for OSL dating was performed on homogeneous sand lenses within the dated alluvial deposits (Figure 2) by hammering steel cores. In the Luminescence Laboratory of the University of A Coruña, the dry-sieved sand grains (180–250 µm) from the central part of the core were treated with HCl and H2O2. The dried feldspars and heavy minerals were removed by density separation using sodium polytungstate solutions with densities of 2.62 g/cm3 and 2.70 g/cm3. The obtained quartz was HF-etched (40%) to remove any remaining feldspars. Quartz multigrain aliquots were checked with infrared (IR) stimulation to ensure the absence of contamination by minerals other than quartz.
Luminescence measurements were performed on small multigrain aliquots (100 grains) mounted on stainless steel discs in a Risø DA-15 automated TL/OSL reader equipped with blue light emitting diodes (LEDs) (470 ± 30 nm) for stimulation, a Hoya U-340 filter and a 9235QA photomultiplier. A 90Sr/90Y beta source of 0.120 ± 0.003 Gy/s was used for irradiation. The single-aliquot regenerative dose (SAR) protocol [12] was used to estimate the Des. Preheat tests were carried out to choose the appropriate preheat treatment, and recovery tests were performed after assessing the Des. The OSL signal was stimulated for 40 s at 125 °C. The early background (EBG) [13] from 0.4 s to 4 s natural OSL decay curve were subtracted from the fast component (first 0.4 s) for signal integration. Descriptive statistics were used on the Des obtained from individual aliquots using Abanico plots and normality tests (Kolmogorov–Smirnov (Lillier.); Shapiro–Wilks if n < 50) were performed. Dose-variation test as a function of aliquot size [14] were performed, from 10, 30, 100, 300 and >700 grains.
Coarse K feldspar grains (180–250µm) and fine grains (<63 μm) were also obtained and used for IRSL dating [15]. The IRSL50 and post-IR IRSL290 signal was measured on both grain sizes. The IRSL signals were stimulated for 200 s at 50 °C and 290 °C, integrating both the first 5 s and using the last 25 s for background subtraction [16]. However, it was not possible to obtain Des from the IRLS signals due to the low amount of both coarse (250–90 μm) and fine (<63 μm) feldspar grains obtained. The scarce grains obtained provided saturated IRSL signals [11].
The Dr was estimated to use a Camberra-XTRA gamma detector (Ge-Intrinsic) during 46–68 h and counting. Guérin’s conversion factors were used [17]. The alpha contribution was neglected for quartz dose rates, and the beta dose rate was corrected due to HF etching [18]. Moisture and water saturation values were assessed for all samples to estimate average water content. The cosmic dose rate was calculated in accordance with Prescott and Hutton [19].
The concentration of potassium (and therefore 40K) was also estimated in the fine (<63 μm) and coarse (63–1000 μm) grains of bulk sediments for each sample by X-ray fluorescence spectrometry (XRF). The grain size distribution of samples was assessed by laser diffraction (<250 μm) using a Saturn-DigiSizerII laser detector and dry-sieving (250–2000 μm). Thus, it was possible to weigh the concentration of K on the silt (2–63 μm) and sand (63–2000 μm) grains for each sample.
4. Results
4.1. Dose Rate (Drs), OSL Signal and Des
The radioisotope activity concentration of the 238U and 232Th decay series was similar for all samples (Table 1). Such radioisotope concentration does not depend on the lithology underlying the deposits (either metasediments or granite). No disequilibrium was observed in the 238U and 232Th series. Significant variations in 40K activity were observed between samples, ranging from 78 Bq/ka to 230 Bq/ka (Table 1). The gamma dose component (Dr-gamma) ranges from 0.2 to 1.3 (Gy/ky), the beta dose component (Dr-beta) ranges from 0.3 to 0.8 Gy/ky and the cosmic dose (Dr-cosmic) values are about 0.15 (Gy/ky) [11]. The final Drs ranges between 0.68 Gy/ka and 1.83 Gy/ka (Table 1).

Table 1.
Radioisotopic activity (Bq/kg) from 238 uranium, 232 thorium and 40 potassium. Dose-rate (Dr) and saturation fraction (F) from water content (w = 40 ± 4%) following [20].
Multigrain aliquots of 100 grains show a better fit to De and lower uncertainty than the other tested aliquot sizes (10, 30, 300 or >700 grains). In general, the natural OSL signals show dim signals (<40,000 c/u.t) [11]. This could be related to the origin of the quartz and the expected differences in radioisotope content and natural radiation (dose rate) between metasedimentary and granitic lithology in the area [11]. However, sample Mero-8 from the granitic area also shows lower signals than expected (<60,000 c/u.t) (Figure 3). However, all signals show a fast decay, with 95% of the counts being recorded in the first 0.5 s of exposure to blue LEDs. Bleaching tests (between 0.2 s and 1000 s) were performed, showing a reduction in the signal to background levels (>80%) after 1 s of exposure to blue LEDs. No linear correlation (neither exponential nor logarithmic) is observed between signal intensity (natural, regenerated or test-dose) and De of aliquots (r < 0.65). The signal/test dose ratios (LN/TN) are low (<10), although the growth curves show a large and steeply sloping linear interpolation region (Figure 3). In addition, dim OSL signals do not mean higher aliquot rejection in the recovery and recycling tests (the higher percentage of aliquot rejection is due to aberrant growth curves or non-interpolation) [11], indicating their reliability. Furthermore, in all samples, there are some aliquots (20%) with brighter OSL signals (natural, test dose and regenerate), with higher signal/test-dose ratios and a lower relative error (<10%). The Des from much more sensitive aliquots are very similar to the central estimators as median, arithmetic mean or weighted mean of the Central Age Model, CAM [11]. The Des were estimated by using the CAM [21] (Table 2).
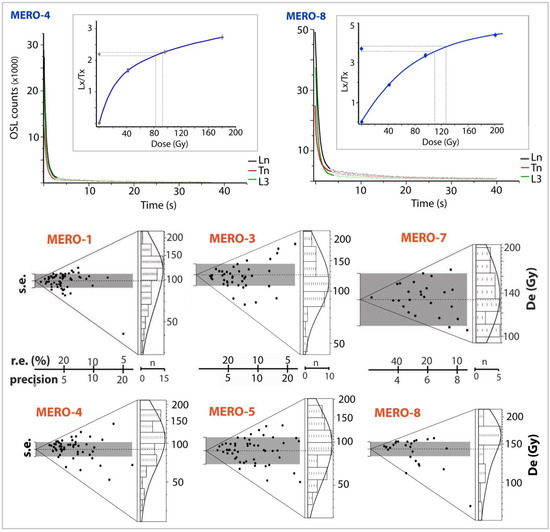
Figure 3.
OSL signal and Des distributions. (Up) Examples of OSL decay curves and growth curves of Mero-4 and Mero-8 samples. (Down) Abanico plots of samples Mero-1, 3, 4, 5, 7 and 8: standard estimate (s.e) and (±2σ) standard error (grey area), relative error (r.e), equivalent dose (De) and accumulate density (n) from each aliquot (black dots).
Table 2.
Dose rate (Dr), equivalent dose (De), overdispersion (OD) and final ages. N: number of accepted/analysed aliquots. Mero-6 age from central dose (CAM) invalidated by asymmetric distribution.
The relative deviation of the Des ranges between 10% and 20%. The absolute deviation of the Des shows an increasing linear trend vs. the De. The proportion of aliquots rejected for exceeding the saturation threshold (≥200 Gy) is below 30%, except for samples Mero-3 (50%) and Mero-8 (70%). The proportion of rejected aliquots because they did not meet the SAR recycling test is below 30%, except for Mero-2 (70%). Recovery tests showed ratios between 0.9 and 1.1, with low overdispersion values (OD-recovery < 5%) [11]. All samples show highly dispersed distributions (Figure 3) and high OD values from central dose (De) (Table 2), except for sample Mero-7 (OD = 13 ± 5%). However, these distributions are non-skewed and unimodal (Figure 3). Normality tests indicate a good fit to a normal distribution (p < α = 0.05), with the exception of the Mero-6 sample, which shows a highly skewed distribution [11].
4.2. Grain Size Distributions and Concentrations of K
Most of the dated samples correspond to silty sands (ranging the silt between 40% and 80% of the sample). The only exception is sample Mero-8 (granitic lithology) with 80% sand-sized grains (63–1000 μm). The major elements are SiO2 (≥40%) and Al2O3 (≥20%), Fe2O3 (<5%) and K2O (<2%) [11]. A negative linear trend (r = −0.8) was observed between the beta doses (Dr-beta) and overdispersion values (OD). In the sample from the granitic lithology (Mero-8), the potassium is concentrated in the sandy-sized grains (85%). In the samples from the metasedimentary area of the basin, potassium (and therefore, 40K) is concentrated in the silty-size grains (>75%) (Figure 4a,b). In these latest samples (Figure 4c), a positive linear correlation (r = 0.91) between the proportion of K in silts (2–63 μm) and the Dr-beta component. Despite the small data, linear correlation analyses indicate that a slight increase in potassium (1%) leads to a considerable decrease (20%) in overdispersion (Figure 4d).
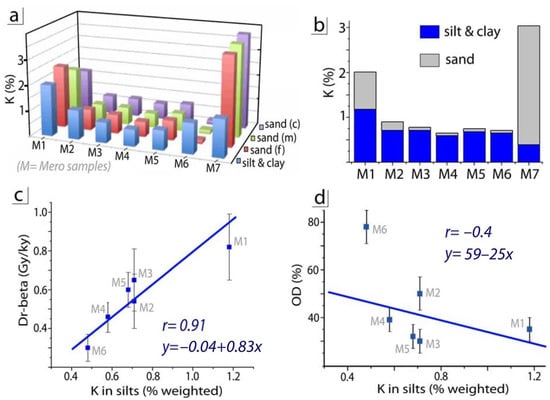
Figure 4.
Potassium distribution and overdispersion of metasedimentary samples. (a) Potassium distribution in sand fraction (f: fine; m: medium; c: coarse) and silt-clay fraction. (b) Proportion of potassium weighted by the proportion of silt and sand fractions. (c,d) Linear correlation of samples with high OD: (c) Dr-beta vs. K in silts; (d) OD vs. K in silts. (M: Mero basin samples).
5. Discussion
The OSL signals of all the studied samples are dim, not different in quartz grains of sediments of either the metasedimentary or granitoid areas of the Mero basin. A higher concentration of uranium, thorium and potassium radioisotopes [22,23] would be expected in sediments of the granitoid area, as observed on the gamma radiation map of the area [24] (although these measurements were taken at 50 cm above the ground). Such a high correlation between high gamma radiation and concentration of radioisotopes in granitoid lithologies has been frequently observed in the region [1,25], ranging the Drs between 3 and 5 Gy/ky for fluvial deposits with bright OSL signals. In contrast, the estimated Drs for the Mero basin is low and similar among samples, including for the sample located in the granitoid area (Mero-8) (Table 1). The used quartz grains highly come from Precambrian metasediments [9,10] and Variscan granitoids [26]. The alluvial deposits studied [4] correspond to a late stage of relief dismantling at the end of the Pleistocene, during which runoff acted on a highly weathered rocky substrate that provided clays, sands and fragments of quartz and quartzite. The brief transport that they suffered justifies the bad selection of the sediments and the low rolling of the quartz and quartzite fragments. They correspond to a wet periglacial stage of the Late Pleistocene [27]. It is possible that such circumstances could lead to radioisotope leaching (above all for U, Th and K), and this could explain the low Drs obtained [11]. Moreover, no correlation or dependence is observed between signal intensities and Drs in the samples.
The characteristics of the OSL signal from quartz grains have been related to the original lithology [28,29] or their degree of weathering [30], as well as the sedimentary transport [31] at a local or even regional scale [32,33]. In the present work, no differences were observed in the signal characteristics and the type of quartz according to its lithologic origin (metasediments or granitoids). The response of quartz grains from sediments deposited downstream (Mero-2 or Mero-4) is similar to that of quartz grains upstream (samples Mero-1 or Mero-6) (Figure 1). The quartz grains analysed in a nearby basin from similar Hercynian granitoids [2] also show low sensitivity, unlike quartz grains from other basins in the region [1]. Both the dim signals and OSL signal sensitivity hindered the use of single-grain for dating, which provides uncertainty for each grain [34]. However, for all samples, the Des of the most sensitive aliquots (with brighter OSL signals, higher normalisation ratios and a lower relative error) were found to be similar to the central estimators (median, arithmetic mean or weighted mean of the CAM) [11]. Thus, the CAM is considered for assessing the Des, provided that the data fit a normal type distribution (symmetrical and unimodal) [21,35]. In this sense, sample Mero-7 shows a normal-type distribution and low overdispersion value (13%). Thus, we can take this sample age as a reference age to assess the age estimates of the other samples using the CAM. Due to the high OD values observed (Table 1) for the other samples, we compared and discussed the possible factors that hypothetically contribute to such OD [36].
5.1. Overdispersion Analysis
Dim OSL signals at high doses and low normalisation ratios in quartz grains have sometimes been correlated with a limited proportion of luminescence-sensitive traps and/or a low contribution from the fast component of the OSL signal [37,38]. At prolonged doses over time, this limitation can result in a natural OSL signal (LN) of similar intensity to the natural OSL signal of the test dose (TN), albeit within the recommended ratio (1/3LN = TN) [11,12]. Considering that the dose induced in the test dose represents 10% of the De [11,12], these low-sensitive quartz grains would not accurately reflect the real differences between signal and dose, which would result in a generalised reduction in the normalisation ratios (LN/TN). As the growth curve is constructed by plotting the normalised signal vs. dose–response, low normalisation ratios at increasing doses lead to a low slope of the linear segment of the dose–response curve. Interpolation of this normalised signal with errors in such low-slope curves can lead to high uncertainty of the De of individual aliquots [39,40]. When this occurs in most accepted aliquots (individual Des), it results in high variability between individual data, above what could be expected [37,38]. As a result, high OD values of the CAM could be obtained. This is the main reason for rejecting aliquots that interpolate above 200 Gy, taking this value as the saturation threshold [11], at which the estimates of the Des become unreliable [41], although the Des estimated by including these aliquots (>200 Gy) are similar [11]. On the other hand, the number of rejected aliquots in the recovery and recycling tests is very low and lower than those of aliquots with abnormal behaviour (aberrant growth curves) [11]. These characteristics of the OSL signal are coupled with rapid bleaching of the signal (see Section 5.1.1). Considering all these aspects and the low sensitivity and fast decay of the OSL signal, we used the early background (EBG) signal-integration method [13]. The EBG maximises the contribution of the fast component of the OSL signal [42], providing suitable dose–response curves for signal interpolation in cases of low OSL sensitivity [11] and low normalisation ratios with high error (between 10% and 20%). This error is due to intrinsic factors, such as counting statistics, reproducibility and luminescence sensitivity [37,43]. When interpolating normalised signals with high error in the dose–response curves, a high error in the obtained Des is expected (in our samples, ranging between 5% and 20%), and the error increases with dose, so it is expected to be higher in older samples [44]. However, recovery tests (with an OD < 5%) evidenced that the De uncertainty due to intrinsic factors does not contribute substantially to the increase in OD [11], which has high values (>23%), with the exception of sample Mero-7 (13%). Thus, the analysis of other possible extrinsic factors, such as incomplete bleaching or beta microdosimetry, is necessary to check the most suitable age model.
5.1.1. Incomplete Bleaching
A possible cause of high OD values in fluvial deposits (20–30%) is incomplete bleaching of the OSL signal [45,46]. In such cases, the use of the CAM will overestimate the burial age [36]. Bleaching tests [41] on quartz grains show a 90% of decay of the OSL signal after 1 s of exposure to blue LEDs. As a cross-check with IRSL ages has not been possible [47] due to the low amount of K-feldspar coarse and fine grains and the saturation of IRSL signals [11], we alternatively observed the Des distributions [48]. Abanico plots [49] show wide but non-skewed and unimodal distributions (Figure 3). The normality tests performed also suggest a good fit to a normal distribution (p < α = 0.05), with the sole exception of the Mero-6 sample, with high skewness. We assumed such distributions as an indicative absence of incomplete bleaching as a cause of the high OD, except in sample Mero-6.
5.1.2. Beta-Microdose Variability and Overdispersion
Another extrinsic factor that may contribute to high OD is a heterogenous beta micro-dosimetry, due to a heterogeneous distribution of potassium (and 40K), as the main source of beta radiation in the studied samples [50]. The concentration of K in samples is low (<5%) in the sediments from the metasedimentary area of the basin. Such K is mostly present in the silty-sized grains (Figure 4a,b), and a positive linear trend is observed with the beta dose component and the total dose rates (Dr-Total y Dr-beta). Conversely, a negative trend is observed between Dr-beta and the overdispersion (OD), as well as the proportion of potassium in fines and the OD (Figure 4c,d). This trend would indicate differences between the (beta) dose effectively absorbed by different quartz grains, although it is impossible to know the dose that absorbs each grain. In some single-grain analyses under similar circumstances (absence of partial-bleaching, beta-microdose variability and high OD) [51], an underestimation of the age by CAM of 8% was observed [51] by not including in the model the differences between the estimated average dose (Dr-Total) and the actual dose absorbed by each grain. Given the impossibility of using single-grain (due to the dim OSL signal of quartz grains), the signal of multigrain aliquots (100 grains) was analysed in this work. This means that a sum of OSL signals from different grains was analysed and this type of variation is not only homogenised [44,52] but also reduced [11]. Proof of this would be the Mero-7 sample, with an OD of 13% (Table 1), and according to the recovery test, 5% of this OD would be explained by intrinsic factors). Therefore, the CAM age for this Mero-7 sample would be representative of the sedimentation process dated here.
5.1.3. Burial Ages
For sample Mero-7, most individual Des are within the 95% c.i. of the estimated CAM (Figure 3), providing a low OD value (13%). This is the sample with the lowest percentage (<10%) of aliquots rejected by trespassing saturation threshold (De > 200Gy), although the calculated De from CAM, including or excluding these aliquots, are very similar [11]. Considering that there is no evidence of incomplete bleaching, the estimated burial age of 99 ± 22 ka for this sample (Table 1) is assumed as reliable. This result is helpful in checking the other OSL ages based on their stratigraphic correlation (see relative heights in Figure 1), with the oldest deposits corresponding to those at the highest relative heights. Relative heights are measured with respect to the main channel of the Mero River. In cases where the paleochannel remains covered under the sea waters and its sediments, the geometrical calculation of the angle (α) and the height (sin α) between two outcrops of the same deposit (e.g., Mero-2 and Mero-3 in Figure 5a,b) is carried out [11].
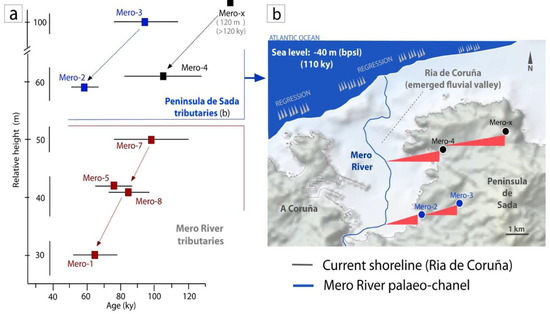
Figure 5.
(a) Chronology of alluvial sediments from lower Mero River and relative heights from the main paleochannel. (b) Alluvial deposits from Peninsula de Sada tributaries (Mero4–Merox and Mero3–Mero2), with a sea level of –40 m below present sea level (bpsl), 110 ky ago. Mero-x: undated sample (most probably older than 120 ky) at 120 m (relative height). The triangles show the slope (tangent line) between samples and the bottom of the Ria de Coruña (then emerged) and represented by the hypothetical Mero river palaeo-channel. Elevation model and bathymetry from [53].
This more logical estimate also coincides with the slope (tg α) from the drainage divide to the bottom of the ria, adding the thickness of the sedimentary cover [54,55]. For the deposits located in the innermost area of the Ria de Coruña, the Mero-7 sample (99 ± 22 ky) is located at +50 m (relative heights for all of them). Samples Mero-8 (85 ± 12 ky) and Mero-5 (77 ± 11 ky) are located at a +40 m, and Mero-1 (65 ± 13 ky) is located at +30 m. In the outermost area of the ria, Mero-3 deposit (95 ± 19 ky) is located at +100 m, while the correlative deposit of Mero-2 (59 ± 8 ky) is located at +60 m (Figure 5a). All samples show chronological coherence. Mero-4 deposit (105 ± 24 ky), located at +60 m, is correlative to another outcrop (Mero-x, undated) located at +120 m, probably older (Figure 5a). These ages fit the depositional age established for other continental deposits preserved on the Galician coast (Table 2). Such is the case of the alluvial deposits dated by OSL at the mouth of the Ulla River [2] (Figure 1 and Figure 6), as well as the lower terrace levels of the Rio Miño (Figure 1 and Figure 6), with minimum ages estimated by OSL and IRSL [1]; these latter data are also consistent with the different terrace levels dated by cosmogenic nuclides over 650 ky [1]. Finally, all these ages were also coherent with the coastal fluvial deposits dated by OSL on the north coast of Portugal [56,57] (Table 3).
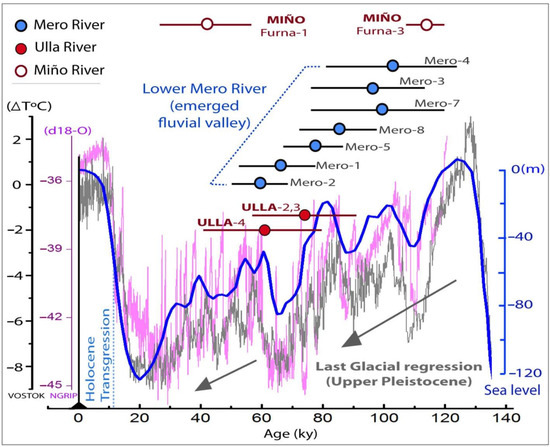
Figure 6.
Chronology of alluvial deposits in the lower Mero River and global climate record for the last 120 ky. Temperature variation from Vostok ice cores [58] (grey line) and isotopic record (d18-O) from Greenland [59] (pink line). Global sea-level oscillations [60] (blue line). Age of alluvial and fluvial deposits on the Atlantic coast of Galicia dated by OSL and IRSL: lower Mero River (this paper), lower Ulla River [2] and lower Miño River [1].
Table 3.
OSL and IRSL age ranges for coastal fluvial sediments on NW Iberian.
Within a palaeoclimatic context, these alluvial deposits were formed at the beginning of the marine regression of the Last Glacial episode (Upper Pleistocene). Throughout this stage, the sea level fell 40 m 90 ky ago, 80 m 65 ky ago and more than 100 m 20 ky ago (Figure 6).
This caused the oceanic waters to retreat and the outermost parts of the valley to be abandoned by the sea, which remained fully emerged for more than 100 ky (Figure 5b). Thus, where we can see the Ria de Coruña today, there was a fluvial valley during that period where continental processes developed, resulting in this type of sediments.
6. Conclusions
The OSL signal from quartz grains included in the coastal alluvial deposits of the Mero River Basin in the Ria de A Coruña (NW Spain) has allowed the estimation of a depositional age between 120 ky and 51 ky. Therefore, they are Upper-Pleistocene sediments and not Plio-Quaternary or Holocene.
The analysed OSL signal from multigrain aliquots is characterised by a low intensity which is most probably related to low luminescence sensitivity, although this intrinsic factor contributes less than 5% to the increase in overdispersion (OD recovery) according to the recovery tests. For samples coming from metasedimentary lithology and affected by high overdispersion values (OD > 20%) with respect to the central dose, a negative trend is observed, from which an increase in the proportion of potassium in silt leads to an increase in Dr-beta and a decrease in OD. Statistical analysis of the data reveals the presence of unimodal and symmetrical distributions, with a good fit to a normal distribution. Based on these results, the absence of incomplete bleaching is interpreted as an extrinsic factor contributing to an increase in OD, and the CAM central age model is used to calculate a reliable De.
There is chronological coherence between the ages calculated for the alluvial deposits of the Lower Mero River, as well as the age of other alluvial and fluvial coastal deposits on the NW Iberian Atlantic coast. Based on this chronology, these sediments of continental origin, many of them located on the present-day shoreline, were deposited as the sea level fell during the Last Glacial episode when the Ria de Coruña was transformed into a fluvial valley over 100,000 years.
Author Contributions
Conceptualisation, C.A.-C., J.R.V.-R. and J.S.-S.; funding acquisition, J.R.V.-R.; methodology, C.A.-C. and J.S.-S.; investigation and resources, C.A.-C. and J.R.V.-R.; supervision, J.R.V.-R. and J.S.-S.; writing, C.A.-C. and J.S.-S. All authors have read and agreed to the published version of the manuscript.
Funding
This research was funded and supported by Consellería de Cultura, Educación y Ordenación Universitaria, Xunta de Galicia (programmes ED431B 2018/47 and ED431B 2021/17) through the Grupo Interdisciplinar de Patrimonio Cultural e Xeolóxico (CULXEO).
Institutional Review Board Statement
Not applicable.
Informed Consent Statement
Informed consent was obtained from all subjects involved in the study.
Data Availability Statement
The data used in this study were obtained from the doctoral thesis of the first author (C.A.C.) (https://ruc.udc.es/dspace/handle/2183/19810) (accessed on 7 July 2022).
Acknowledgments
Thanks to the Consellería de Cultura, Educación y Ordenación Universitaria, Xunta de Galicia for its support through the Grupo Interdisciplinar de Patrimonio Cultural e Xeolóxico (CULXEO) (programmes ED431B 2018/47 and ED431B 2021/17). We would also like to thank most sincerely the Reviewers and the Editors for their suggestions and comments.
Conflicts of Interest
The authors declare no conflict of interest. The funders had no role in the design of the study, in the collection, analyses or interpretation of data, in the writing of the manuscript nor in the decision to publish the results.
References
- Viveen, W.; Braucher, R.; Bourlès, D.; Schoorl, J.M.; Veldkamp, A.; van Balen, R.T.; Wallinga, J.; Fernandez-Mosquera, D.; Vidal-Romani, J.R.; Sanjurjo-Sanchez, J. A 0.65 Ma chronology and incision rate assessment of the NW Iberian Miño River terraces based on 10Be and luminescence dating. Glob. Planet. Chang. 2012, 94–95, 82–100. [Google Scholar] [CrossRef]
- Arce-Chamorro, C.; Vidal-Romaní, J.R. Late-Pleistocene chronology of coastal fluvial deposits at the mouth of the Ulla River in the Ría de Arousa (Galicia, NW Spain) by OSL dating. Cad. Lab. Xeol. Laxe 2021, 43, 61–88. [Google Scholar] [CrossRef]
- López Fernández, C.; Llana-Fúnez, S.; Fernández-Viejo, G.; Domínguez-Cuesta, M.J.; Díaz-Díaz, L.M. Comprehensive characterization of elevated coastal platforms in the north Iberian margin: A new template to quantify uplift rates and tectonic patterns. Geomorphology 2020, 364, 107242. [Google Scholar] [CrossRef]
- Escuer-Sole, J.; Vidal-Romaní, J.R. Facies y modelo local de los depósitos aluviales de la cuenca del río Mero y península de Sada (A Coruña, Galicia, NW Spain). Cad. Lab. Xeol. Laxe 1987, 11, 69–83. [Google Scholar]
- Nonn, H. Les Régiones Cotières de la Galice (Espagne). Etude Géomorpholigique; Publications de la Faculté des Lettres de L´Université de Strasbourg; Foundation Baulig: Paris, France, 1966; Tomo III. [Google Scholar]
- Macías-Vázquez, F.; García-Paz, C. Formaciones sedimentarias de las Mariñas. Estudio Mineralógico. Bol. Soc. Gal. Hist. Nat. 1977, 1, 145–166. [Google Scholar]
- Monteserín-López, V.; Fernández-Pompa, F. Hoja 21: A Coruña. Mapa Geológico de España 1:50.000; Servicio de Publicaciones del Ministerio de Industria y Energía IGME: Madrid, Spain, 1975. [Google Scholar]
- Galán-Arias, J.; Fernández-Rodríguez Arango, R. Hoja 45: Betanzos. Mapa Geológico de España 1:50.000; Servicio de Publicaciones del Ministerio de Industria y Energía IGME: Madrid, Spain, 1981. [Google Scholar]
- Arenas, R.; Díaz-García, F.; Martínez-Catalán, J.R.; Abati, J.; González-Cuadra, P.; Andonaegui, P.; González del Tánago, J.; Rubio-Pascual, F.; Castiñeiras, P.; Gómez-Barreiro, J. Structure and Evolution of the Ordenes Complex: Pre-conference Field Trip 29 June–3 July. In Basement Tectonics; Universidad de Oviedo: Oviedo, Spain, 2000; 160p. [Google Scholar]
- Fuenlabrada Pérez, J.M. Geoquímica de series Metasedimentarias del Macizo Ibérico: Contexto Dinámico de la Transición Ediacarense- Cámbrico. Ser. Nova Terra 2018, 46, 1–183. Available online: http://www.iux.es/almacen/NT_49_html/ (accessed on 7 September 2022).
- Arce-Chamorro, C. Datación por Luminiscencia de Depósitos Fluviales y Eólicos en el Margen Occidental de Galicia. Ph.D. Thesis, Universidad de A Coruña, A Coruña, Spain, 2017; 399p. [Google Scholar]
- Murray, A.S.; Wintle, A.G. Luminescence dating of quartz using an improved single- aliquot regenerative-dose protocol. Radiat. Meas. 2000, 32, 57–73. [Google Scholar] [CrossRef]
- Ballarini, M.; Wallinga, J.; Wintle, A.G.; Bos, A.J. A modified SAR protocol for optical dating of individual grains from young quartz samples. Radiat. Meas. 2007, 42, 360–369. [Google Scholar] [CrossRef]
- Rodnight, H.; Duller, G.A.T.; Wintle, A.G.; Tooth, S. Assessing the reproducibility and accuracy of optical dating of fluvial deposits. Quat. Geochronol. 2006, 1, 109–120. [Google Scholar] [CrossRef]
- Buylaert, J.P.; Jain, M.; Murray, A.; Thomsen, K.; Thiel, C.; Sohbati, R. A Robust Feldspar Luminescence Dating Method for Middle and Late Pleistocene Sediments. Boreas 2012, 41, 435–451. [Google Scholar] [CrossRef]
- Thiel, C.; Buylaert, J.P.; Murray, A.; Terhorst, B.; Hofer, I.; Tsukamoto, S.; Frechen, M. Luminescence Dating of the Stratzing Loess Profile (Austria)—Testing the potential of an elevated temperature post-IR IRSL protocol. Quat. Int. 2009, 234, 23–31. [Google Scholar] [CrossRef]
- Guérin, G.; Mercier, N.; Adamiec, G. Dose rate conversion factors: Update. Ancient TL 2011, 29, 5–8. [Google Scholar]
- Brennan, B.J. Beta doses to spherical grains. Radiat. Meas. 2003, 37, 299–303. [Google Scholar] [CrossRef]
- Prescott, J.R.; Hutton, J.T. Cosmic ray contribution to dose rates for luminescence and ESR dating: Large depths and long-term time variations. Radiat. Meas. 1994, 23, 497–500. [Google Scholar] [CrossRef]
- Aitken, M.J. An Introduction to Optical Dating; Oxford University Press: London, UK, 1998; 267p. [Google Scholar]
- Galbraith, R.F.; Roberts, R.G.; Laslett, G.M.; Yoshida, H.; Olley, J.M. Optical dating of single and multiple grains of quartz from Jinmium rock shelter, northern Australia: Part I, experimental design and statistical models. Archaeometry 1999, 41, 339–364. [Google Scholar] [CrossRef]
- Gascoyne, M. Geochemistry of the actinides and their daughters. In Uranium-Series Disequilibrium: Applications to Earth, Marine, and Environmental Sciences; Ivanovich, M., Harmon, R.S., Eds.; Clarendon Press: Oxford, UK, 1992; pp. 34–61. [Google Scholar]
- Boyle, R.W. Geochemical Prospecting for Thorium and Uranium Deposits; Elsevier: New York, NY, USA, 1982; 489p. [Google Scholar]
- CSN. Proyecto Marna. Mapa de Radiación Gamma Natural; Consejo de Seguridad Nuclear: Madrid, Spain, 2000; 138p. [Google Scholar]
- Sanjurjo-Sánchez, J.; Vidal Romaní, J.R. Luminescence Dating of Pseudokarst Speleothems: A first approach. Spectrosc. Lett. 2011, 44, 543–548. [Google Scholar] [CrossRef]
- Gutiérrez-Alonso, G.; Fernández-Suárez, J.; Jeffries, T.E.; Johnston, S.T.; Pastor-Galán, D.; Murphy, J.B.M.; Piedad-Franco, P.; Gonzalo, J.C. Diachronous post-orogenic magmatism within a developing orocline in Iberia, European Variscides. Tectonics 2011, 30, TC5008. [Google Scholar] [CrossRef]
- Railsbak, L.B.; Liang, F.; Vidal-Romaní, J.R.; Garret, K.B.; Sellers, R.C.; Vaqueiro-Rodríguez, M.; Grandal-D´Anglade, A.; Cheng, H.; Edwards, R.L. Radiometric, isotopic, and petrographic evidence of changing interglacials over the past 550,000 years from six stalagmites from the Serra do Courel in the Cordillera Cantábrica of northwestern Spain. Palaeogeogr. Palaeoclimatol. Palaeoecol. 2017, 466, 137–152. [Google Scholar] [CrossRef]
- Fritzsimmons, K.E. An assessment of the luminescence sensitivity of Australian quartz with respect to sediment history. Geochronometria 2011, 38, 199–208. [Google Scholar] [CrossRef]
- Alexanderson, H.; Næraa, T.; Doverbratt, I. Luminescence characteristics of Scandinavian quartz, their connection to bedrock provenance and influence on dating results. In Proceedings of the 16th International Luminescence and ESR Dating Conference, Virtual, 13–17 September 2021. [Google Scholar]
- Cao, Z.; Zhou, L.P. Luminescence Sensitivity of Quartz from Rocks under Different in situ Weathering Conditions. Front. Earth Sci. 2022, 10, 940212. [Google Scholar] [CrossRef]
- Panda, S.K.; Kaushal, R.K.; Parida, S.; Chauhan, N.; Singhvi, A.K. Spatial variations in luminescence sensitivity of quartz extracted from source rocks and fluvial sediments of the Sabarmati River basin, Western India: Implications for provenance studies. In Proceedings of the 16th International Luminescence and ESR Dating Conference, Virtual, 13–17 September 2021. [Google Scholar]
- Sawakuchi, A.O.; Jain, M.; Mineli, T.D.; Nogueira, L.; Bertassoli, D.J.; Häggi, C.; Sawakuchi, H.O.; Pupim, F.N.; Grohmann, C.H.; Chiessi, C.M.; et al. Luminescence of quartz and feldspar fingerprints provenance and correlates with the source area denudation in the Amazon River basin. Earth. Planet. Sci. Lett. 2018, 492, 152–162. [Google Scholar] [CrossRef]
- Bartyik, T.; Magyar, G.; Dávid Filyó, D.; Tóth, O.; Blanka-Végi, V.; Kiss, T.; Marković, S.; Persoiu, I.; Gavrilov, M.; Mezősi, G.; et al. Spatial differences in the luminescence sensitivity of quartz extracted from Carpathian Basin fluvial sediments. Quat. Geochronol. 2021, 64, 101166. [Google Scholar] [CrossRef]
- Jacobs, Z.; Duller, G.A.T.; Wintle, A.G. Interpretation of single grain De distributions and calculation of De. Radiat. Meas. 2006, 41, 264–277. [Google Scholar] [CrossRef]
- Wallinga, J. Optically stimulated luminescence dating of fluvial deposits: A review. Boreas 2002, 31, 303–322. [Google Scholar] [CrossRef]
- Galbraith, R.F.; Roberts, R.G. Statistical aspects of equivalent dose and error calculation and display in OSL dating: An overview and some recommendations. Quat. Geochronol. 2012, 11, 1–27. [Google Scholar] [CrossRef]
- Duller, G.A.T. Improving the accuracy and precision of equivalent doses determined using the optically stimulated luminescence signal from single grains of quartz. Radiat. Meas. 2012, 47, 770–777. [Google Scholar] [CrossRef]
- Feathers, J.K.; Pagonis, V. Dating quartz near saturation—Simulations and application at archaeological sites in South Africa and South Carolina. Quat. Geochronol. 2015, 30, 416–421. [Google Scholar] [CrossRef]
- Murray, A.S.; Olley, J.M. Precision and accuracy in the optically stimulated luminescence dating of sedimentary quartz: A status review. Geochronometria 2002, 21, 1–16. [Google Scholar]
- Singarayer, J.; Bailey, R. Further investigations of the quartz optically stimulated luminescence components using linear modulation. Radiat. Meas. 2003, 37, 451–458. [Google Scholar] [CrossRef]
- Wintle, A.G.; Murray, A.S. A review of quartz optically stimulated luminescence characteristics and their relevance in single-aliquot regeneration dating protocols. Radiat. Meas. 2006, 41, 369–391. [Google Scholar] [CrossRef]
- Cunningham, A.C.; Wallinga, J. Selection of integration time intervals for quartz OSL decay curves. Quat. Geochronol. 2010, 5, 657–666. [Google Scholar] [CrossRef]
- Thomsen, K.J.; Murray, A.S.; Bøtter-Jensen, L. Sources of variability in OSL dose measurements using single grains of Quartz. Radiat. Meas. 2005, 39, 47–61. [Google Scholar] [CrossRef]
- Arnold, L.J.; Roberts, R.G. Stochastic modelling of multi-grain equivalent dose (De) distributions: Implications for OSL dating of sediment mixtures. Quat. Geochronol. 2009, 4, 204–230. [Google Scholar] [CrossRef]
- Rittenour, T.M. Luminescence dating of fluvial deposits: Applications to geomorphic, palaeoseismic and archaeological research. Boreas 2008, 37, 613–635. [Google Scholar] [CrossRef]
- Duller, G.A.T. Single-grain optical dating of Quaternary sediments: Why aliquot size matters in luminescence dating. Boreas 2008, 37, 589–612. [Google Scholar] [CrossRef]
- Colarossi, D.; Duller, G.A.T.; Roberts, H.M.; Tooth, S.; Lyons, R. Comparison of paired quartz OSL and feldspar post-IR IRSL dose distributions in poorly bleached fluvial sediments from South Africa. Quat. Geochronol. 2015, 30, 233–238. [Google Scholar] [CrossRef]
- Jacobs, Z.; Wintle, A.G.; Duller, G.A.T. Optical dating of dune sand from Blombos Cave, South Africa: I—Multiple grain data. J. Hum. Evol. 2003, 44, 599–612. [Google Scholar] [CrossRef]
- Burow, C.; Kreutzer, S.; Dietze, M.; Fuchs, M.; Fischer, M.; Schmidt, C.; Brückner, H. RLumShiny—A graphical user interface for the R Package ‘Luminescence’. Ancient TL 2016, 34, 22–32. [Google Scholar]
- Nathan, R.; Thomas, P.J.; Murray, A.S.; Rhodes, E.J. Environmental dose rate heterogeneity of beta radiation and its implications for luminescence dating: Monte Carlo modelling and experimental validation. Radiat. Meas. 2003, 37, 305–313. [Google Scholar] [CrossRef]
- Guérin, G.; Christophe, C.; Philippe, A.; Murray, A.S.; Thomsen, K.J.; Tribolo, C.; Urbanova, P.; Jain, M.; Guibert, P.; Mercier, N.; et al. Absorbed dose, equivalent dose, measured dose rates, and implications for OSL age estimates: Introducing the Average Dose Model. Quat. Geochronol. 2017, 41, 163–173. [Google Scholar] [CrossRef]
- Anechitei-Deacu, V.; Timar-Gabor, A.; Thomsen, K.J.; Buylaert, J.P.; Jain, M.; Bailey, M.; Murray, A.S. Single and multi-grain OSL investigations in the high dose range using coarse quartz. Radiat. Meas. 2018, 120, 124–130. [Google Scholar] [CrossRef]
- EDMOnet Bathymetry Consortium. EMODnet Digital Bathymetry (DTM). 2018. Available online: https://doi.org/10.12770/18ff0d48-b203-4a65-94a9-5fd8b0ec35f6 (accessed on 7 July 2022).
- Mosquera-Santé, M.J. Evolución Post-Glaciar del Nivel del Mar en el NO de la Península Ibérica: El Caso del Golfo Ártabro. Ph.D. Thesis, Universidad de A Coruña, A Coruña, Spain, 2000; 155p. [Google Scholar]
- Valencia-Vila, F. Golfo Ártabro: Marco Físico. In Biodiversidad Marina del Golfo Ártabro (A Coruña); Valencia-Vila, F., Parra, S., Eds.; Instituto Español de Oceanografía; Ministerio de Ciencia e Innovación: A Coruña, Spain, 2015; Chapter 2; p. 45. [Google Scholar]
- Ribeiro, H.; Bernal, A.; Flores, D.; Pissarra, J.; Ruas de Abreu, I.; Vidal-Romani, J.R.; Noronha, F. A multidisciplinary study of an organic-rich mudstone in the Middle Holocene on the Northern coast of Portugal. Comun. Geol. 2011, 98, 93–98. [Google Scholar]
- Ribeiro, H.; Pinto de Jesus, A.; Sanjurjo-Sánchez, J.; Abreu, I.; Romani, J.R.V.; Noronha, F. Multidisciplinary study of the quaternary deposits of the Vila Nova de Gaia, NW Portugal, and its climate significance. J. Iber. Geol. 2019, 45, 553–563. [Google Scholar] [CrossRef]
- Petit, J.R.; Jouzel, J.; Raynaud, D.; Barkov, N.I.; Barnola, J.-M.; Basile, I.; Bender, M.; Chappellaz, J.; Davis, M.; Delaygue, G.; et al. Climate and atmospheric history of the past 420,000 years from the Vostok ice core, Antarctica. Nature 1999, 399, 429–436. [Google Scholar] [CrossRef]
- Andersen, K.K.; Azuma, N.; Barnola, J.M.; Bigler, M.; Biscaye, P.; Caillon, N.; Chappellaz, J.; Clausen, H.B.; Dahl-Jensen, D.; Fischer, H.; et al. High-resolution record of Northern Hemisphere climate extending into the last interglacial period. Nature 2004, 431, 147–151. [Google Scholar] [CrossRef]
- Waelbroeck, C.; Labeyrie, L.; Michel, E.; Duplessy, J.C.; McManus, J.F.; Lambeck, K.; Balbon, E.; Labracherie, M. Sea-level and deep water temperature changes derived from benthic foraminifera isotopic records. Quat. Sci. Rev. 2002, 21, 295–305. [Google Scholar] [CrossRef]
Publisher’s Note: MDPI stays neutral with regard to jurisdictional claims in published maps and institutional affiliations. |
© 2022 by the authors. Licensee MDPI, Basel, Switzerland. This article is an open access article distributed under the terms and conditions of the Creative Commons Attribution (CC BY) license (https://creativecommons.org/licenses/by/4.0/).