Article

Experimental Study on the Mechanical Behaviors of Loess Reinforced with Randomly Distributed Basalt Fiber

1
Shaanxi Key Laboratory of Safety and Durability of Concrete Structures, Xijing University, Xi’an 710123, China
2
School of Civil Engineering, Architecture and Environment, Hubei University of Technology, Wuhan 430068, China
*
Author to whom correspondence should be addressed.
Appl. Sci. 2022, 12(19), 9744; https://doi.org/10.3390/app12199744
Submission received: 2 September 2022 / Revised: 17 September 2022 / Accepted: 19 September 2022 / Published: 28 September 2022
(This article belongs to the Special Issue Advances in Geosynthetics, Volume II)

Abstract

:
Loess has the structural characteristics of porous, weakly cemented and under compacted, leading to its collapsible, disintegrative and dissolute features. To study the mechanical behaviors of basalt fiber-reinforced loess, consolidated undrained triaxial tests were carried out to investigate the effects of fiber length (FL), fiber content (FC) and cell pressure (σ3) on the shear strength. Based on the test results, a constitutive model considering the effects of the σ3, FL and FC was established using regression analysis, and the estimation method for the model parameters was proposed. The results show that the stress–strain curve of the unreinforced loess exhibited a strain-softening type, while the reinforced loess displayed a strain-hardening type. The peak strength of the reinforced loess was significantly higher than that of the unreinforced soil, and increased with increasing of FL, FC and σ3. Compared with the peak strength when FL was 8 mm, the peak strength increased slightly when the FL was 12 and 16 mm, respectively. The anchoring effect and bridging effect between soil particles and fibers improved the cohesion and friction of reinforced soil, resulting in the increment in the shear strength. The experimental results are in good agreement with the model predictions, indicating that the established model and the parameter estimation method are suitable for describing the relationship between the stress and strain of basalt-fiber-reinforced loess. The research results can provide guidance of the design and construction of fiber-reinforced soil in loess areas.

1. Introduction

Loess belongs to terrestrial loose sediments formed by wind transport in the Quaternary arid and semi-arid climatic environment. The small unit weight of loess is dominated by silt particles, rich in calcium carbonate, and with typical engineering characteristics such as collapsible, disintegrative and dissolute, which easily induce engineering accidents. Traditional geosynthetics materials for soil reinforcement include geogrids, geotextiles, geomembranes and geocells, and they have been extensively used and have achieved excellent performance in foundation treatment. As a new type of reinforcement material, fibers have drawn more and more attention in recent years. Fiber-reinforced soil is a composite material formed by adding a certain quality of fibers to the soil, and the soil deformation was restrained by the fiber tensile and the friction between fibers and particles, thereby the soil strength was improved [1,2,3]. Dong et al. [4] concluded that the shear strength of lignin-fiber-reinforced loess increased with increasing of compaction and cell pressure, and the shear strength was highest when the fiber content reached 5%. Xiong et al. [5] found that the reinforcement effect of basalt fiber was significantly greater than that of polypropylene fiber, polyester fiber and glass fiber. The enhancement of the cohesion was related to the interface adhesion and the fiber tensile, while the enhancement of the internal friction angle is mainly due to the interface friction between the fibers and the soil particles. Lu et al. [6] reported that polypropylene fiber can effectively improve the shear strength and anti-disintegration properties of loess. With the increasing fiber content, the cohesion of fiber-reinforced soil showed an increase firstly and then a decrease, whereas the disintegration rate exhibited a decrease firstly and then increased, respectively. Furthermore, the shear strength of fiber-reinforced soil reached a peak when the fiber content is 0.3% and the fiber length is 15 mm. An et al. [7] revealed that the cohesion and disintegration rates of polypropylene-fiber-reinforced loess showed a decrease firstly and then increased with the increase in fiber length and fiber content. The shear strength and anti-disintegration characteristics reached the optimum when the fiber length was 15 mm and the fiber content was 0.5%. In addition, the permeability coefficient of fiber-reinforced loess increased with the increase in fiber content and decreased with the increase in fiber length. Based on the orthogonal test method, Hu et al. [8] concluded that the water content, compaction, fiber content, and cell pressure were significant influencing factors for the shear strength of basalt-fiber-reinforced soil. The local optimum ratio was obtained when the water content was 11%, compaction was 0.95 and fiber content was 0.4%. Xu et al. [9,10] found that the shear strength of loess reinforced with basalt fiber was significantly higher than that of unreinforced loess, whereas not monotonically increased with the increase in fiber length and fiber content. The maximum shear strength appeared at a 0.6% fiber content and 12 mm fiber length. The plastic failure had an overall bulging failure mode for fiber-reinforced loess, while the typical brittle failure has a visible shear band for unreinforced soil. Wu et al. [11] concluded that the shear strength of basalt-fiber-reinforced loess decreased with the increase in dry–wet cycles, and the optimal resistance to dry–wet action occurred at the 0.6% fiber content. Fibers can inhibit the generation of microcracks, and the damage mainly appeared in the initial stage of dry–wet cycles. Yan et al. [12] reported that the cohesion and internal fiction angle of polypropylene-fiber-reinforced loess decreased with the increase in the dry–wet cycles or free–thaw cycles, whereas the permeability coefficient increased with the number of cycles. Mariri et al. [13] noted that the failure strain was increased with the addition of recycled polyester fiber to zeolite–cement–loess composites, and this method is effective for overcoming the brittle behavior of cemented loess. Xue et al. [14] revealed that the strain-hardening behavior of straw-fiber-reinforced loess can be exhibited using the dilation angle or the difference between the large-displacement friction angle and peak friction angle. Yang et al. [15] found that combined modified polypropylene fiber and cement could remarkably improve the strength of loess to 3.65–5.99 MPa in three days. The unconfined compressive strength (UCS) and tensile strength attained the maximum under the condition of 0.3–0.45% fiber content and 12 mm fiber length. Lian et al. [16] concluded that the failure stress and shear strength of loess were improved with the addition of polyester fiber, and the cohesion of fiber-reinforced loess was significantly improved when the fiber content increased up to 0.75%, while the internal friction angle had less of an effect. Zhang et al. [17] indicated that the UCS of polypropylene-fiber-reinforced loess first increased and then decreased with the increase in fiber content, and the optimum fiber content varied from 0.30% to 0.45%. In addition, the erosion mass and erosion rate of reinforced soil were decreased with the increase in cement and fiber content. Gao et al. [18] stated that lignin fiber can improve the UCS of loess under freeze–thaw cycles, whereas the reinforcement effect no longer increased with the increase in fiber content, and the optimum fiber content was 1% for fiber-reinforced loess under freeze–thaw cycles. Sarli et al. [19] concluded that the combination of recycled polyester fiber with nano-SiO2 can improve the shear strength of loess, and the optimum fiber content was 4%. Based on ring shear tests, Wang et al. [20] pointed out that the peak strength and residual strength of loess can be significantly improved by polypropylene fiber, and the optimum fiber content and water content were 0.5% and 16%, respectively.
The fiber-reinforcement method can significantly improve the mechanical properties of loess and increase the shear strength, anti-disintegration, and erosion resistance. Basalt fiber has the advantage of being economical, green and durable, and has strong application prospects in aerospace, manufacturing, and civil engineering, while relatively few studies were conducted on the shear strength of basalt-fiber-reinforced loess. Based on the consolidated undrained triaxial tests, the effects of fiber length (FL), fiber content (FC), and cell pressure (σ3) on the shear strength of basalt-fiber-reinforced loess were studied, and a constitutive model that considers the fiber content, fiber length, and cell pressure was established, which can provide guidelines for the design and construction of fiber-reinforced subgrades.

2. Materials and Methods

2.1. Test Materials

The test loess was Malan loess that taken from a construction site in Xi’an with a depth of 2.0–3.0 m, and the soil was yellowish brown and homogeneous. According to the Standard for Soil Test Method (GB/T 50123-2019), the main physical properties of loess are shown in Table 1.
The basalt fibers were purchased from Haining Anjie Composites Co., Ltd., Jiaxing, China. The fibers were bundled monofilaments with a smooth surface, bronze color, and could sink in water. The physical and mechanical properties of basalt fiber are shown in Table 2.

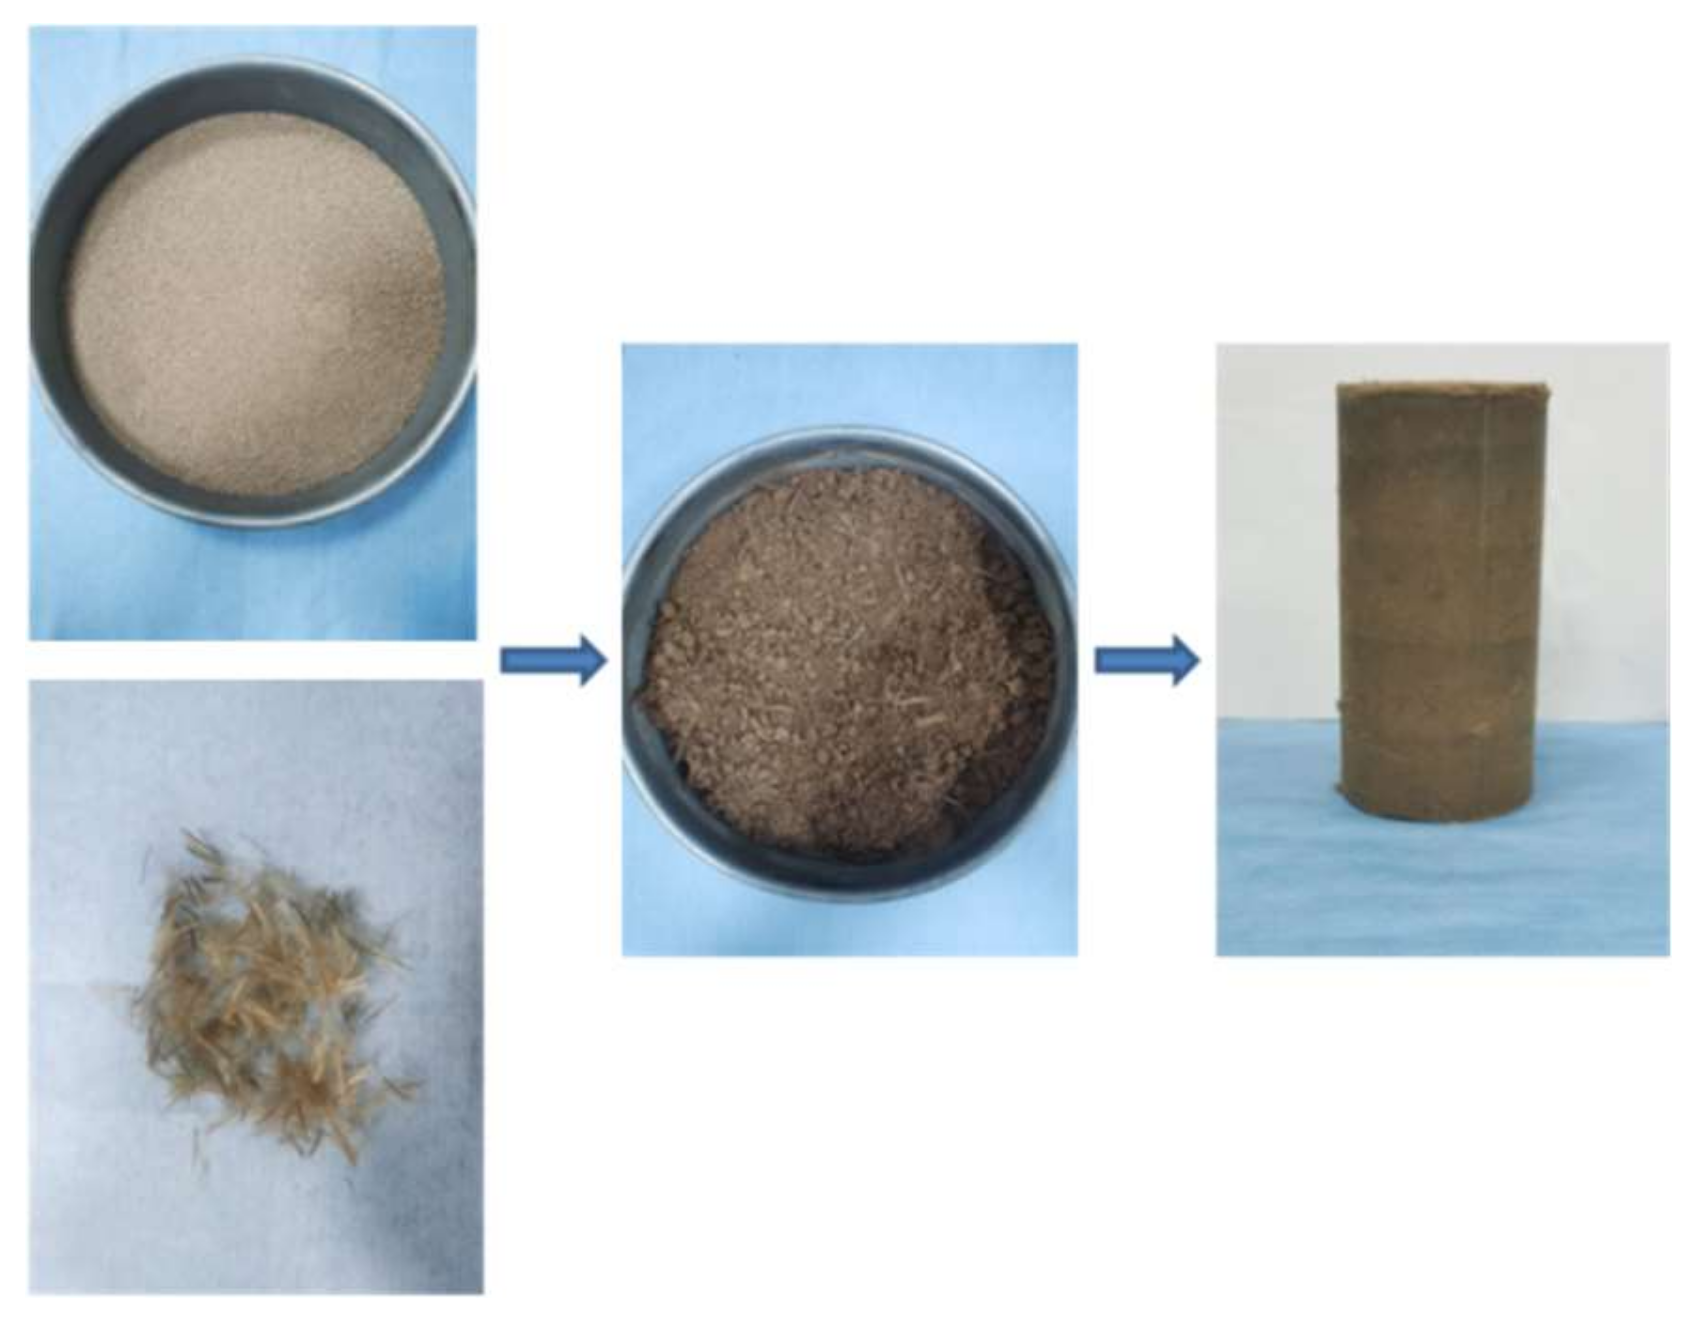
2.2. Sample Preparation
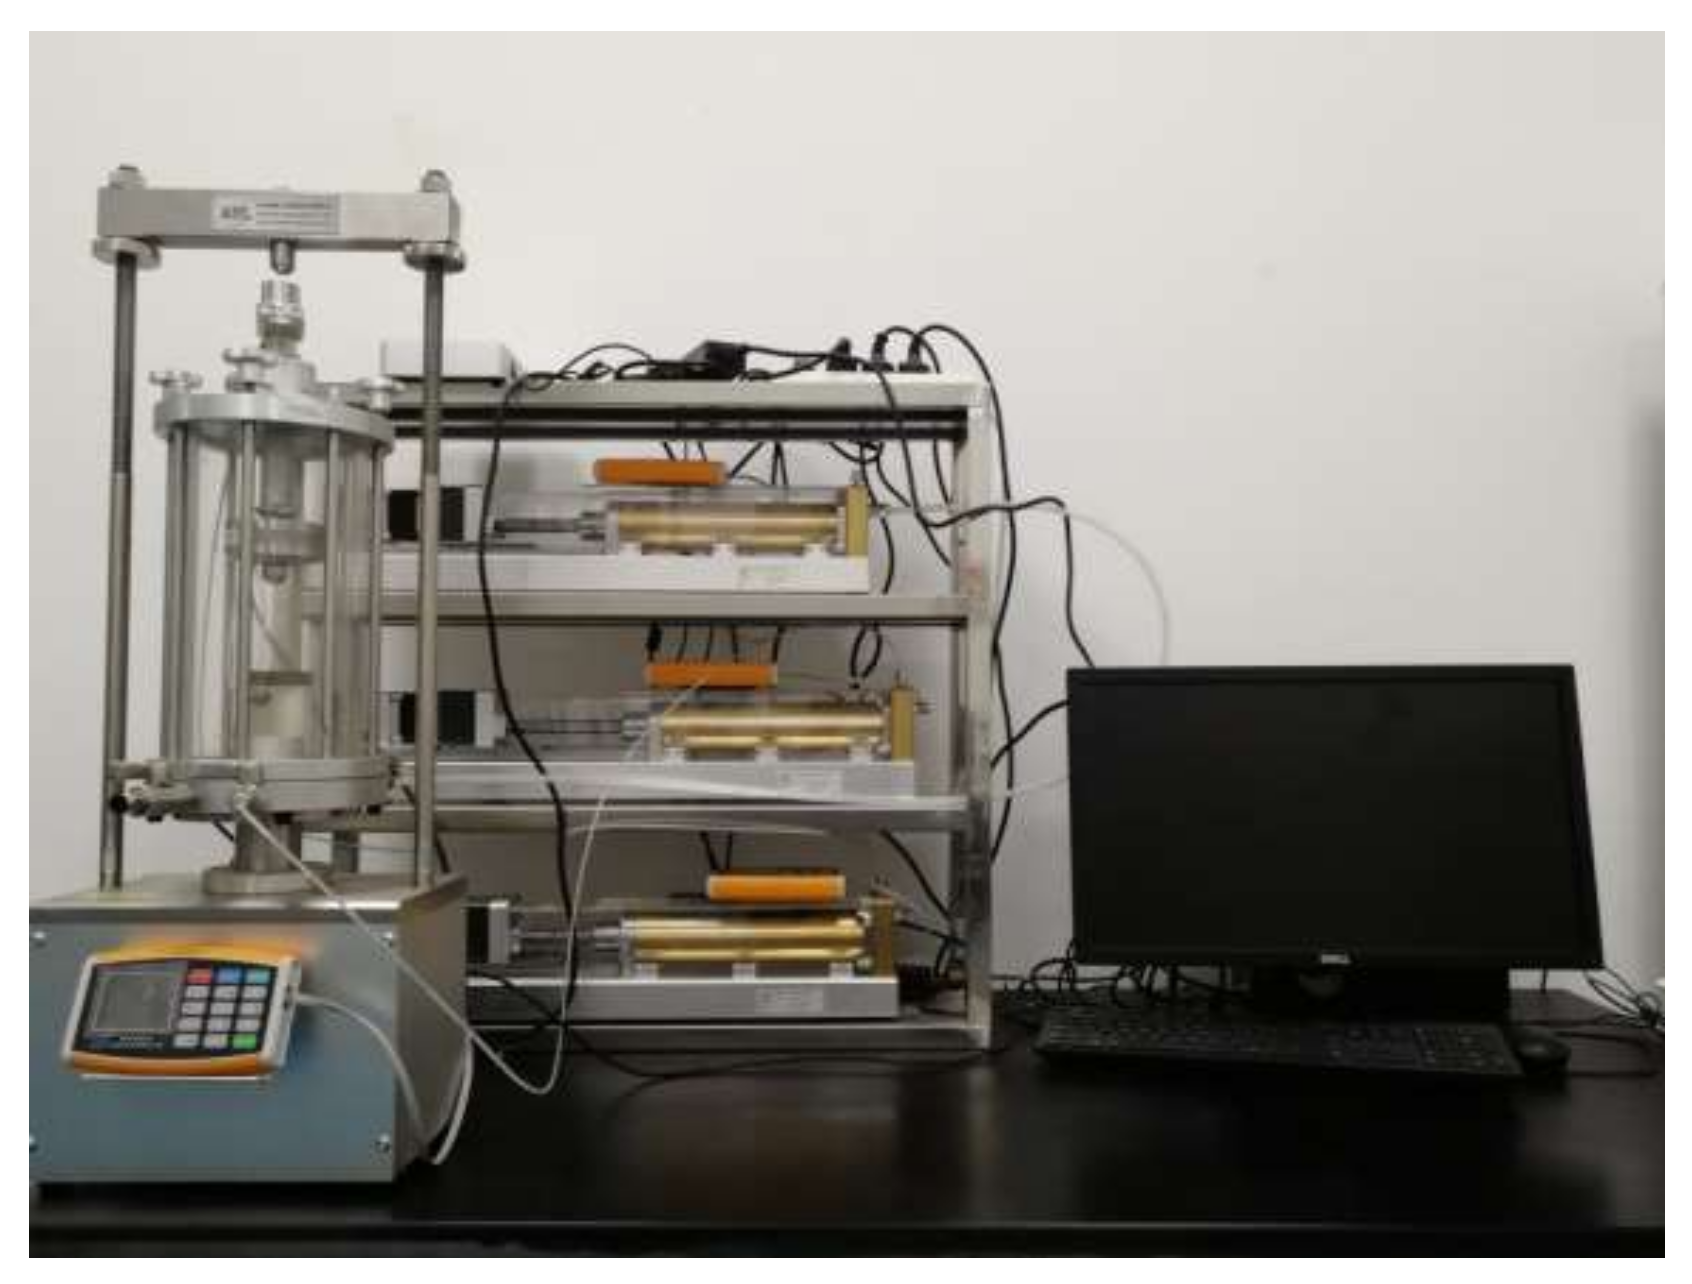
In order to prepare remolded samples, firstly, the air-dried loess was taken and crushed with a rubber hammer, and then passed through a 2 mm sieve. The dry density of the sample was controlled at 1.72 g/cm3, and a certain mass of loess was mixed evenly with water at an optimum water content and then left to stand in a plastic film for 24 h. Subsequently, specific lengths and contents of basalt fibers were mixed and stirred rapidly with loess to ensure the uniform distribution of fibers. The fiber lengths used in the test were 4, 8, 12, and 16 mm. The fiber mass content was 0.2%, 0.4%, 0.6%, and 0.8%, which corresponds to the volume content of 0.13%, 0.26%, 0.39%, and 0.52%, respectively. The sample was 50 mm in diameter and 100 mm in height, and the sample preparation included five layers and was compacted layer by layer with scraping between layers. Figure 1 shows the flow chart of the sample preparation.

2.3. Test Method

To analyze the mechanical properties of basalt-fiber-reinforced loess, the consolidated undrained triaxial tests were conducted using triaxial testing equipment (KTL-LDF 50 type, Xi’an KTL Instruments Co., Ltd., Xi’an, China), as shown in Figure 2. According to the Standard for Soil Test Method (GB/T 50123-2019), the test was performed with strain-controlled loading with a strain rate of 0.5%/min, and the test was stopped when the axial strain reached 20%. The test scheme is shown in Table 3, a total of 51 groups of tests were conducted, and each group was repeated 3 times to reduce errors.

3. Stress–Strain Relationship of Basalt-Fiber-Reinforced Loess

3.1. Effect of Fiber Content on Strength

Figure 3 shows the stress–strain curves for reinforced loess with different FL (4, 8, 12, and 16 mm) and FC (0.2%, 0.4%, 0.6%, and 0.8%) under 50 kPa cell pressure. It can be observed that the curves for unreinforced loess were significantly strain-softening, while that for reinforced loess were mainly strain-hardening. The strength of reinforced soil was significantly higher than that of the unreinforced soil and increases with the increase in FC [9,11]. When the FL was 4 mm, the peak strength of reinforced soil at 0.2%, 0.4%, 0.6%, and 0.8% FC improved by 36.38%, 62.36%, 105.46%, and 123.23% compared to the unreinforced soil, respectively. When the FL was 16 mm, the peak strength of reinforced soil at different FC increased by 78.87%, 105.52%, 160.68%, and 179.01% compared to the unreinforced soil, respectively. The primary causes of the above phenomenon is that the fibers can form an effective spatial mesh structure with the increase in FC, and the enhancing effect is more obvious due to the contact points between fibers and soil particles. When the sample is subject to shear loading, the force will be gradually transferred to the fiber through the contact points. The shear strength of reinforced loess significantly improved with the increase in FC due to the strong tensile strength of the basalt fibers.

3.2. Effect of Fiber Length on Strength

Figure 4 shows the stress–strain curves of reinforced loess with different FL (4, 8, 12, and 16 mm) and FC (0.2%, 0.4%, 0.6%, and 0.8%) under 50 kPa cell pressure. It can be found that the peak strength of reinforced loess was significantly higher than that of the unreinforced soil, and gradually increased with the increase in FL, which exhibited a different trend compared to reference [10]. When the FC was 0.2%, the peak strength of the reinforced soil at 4, 8, 12, and 16 mm FL increased by 36.38%, 69.95%, 73.97%, and 78.87% compared to the unreinforced soil, respectively. When the FC was 0.8%, the peak strength of the reinforced soil with different FL improved by 123.23%, 166.45%, 175.52%, and 179.01% compared to the unreinforced soil. It can be revealed that the peak strength of the reinforced soil with FL of 12 and 16 mm increased slightly compared to reinforced soil with an FL of 8 mm. For the actual engineering of subgrade backfill, the FL can be chosen to facilitate the construction. The primary reasons for the above phenomenon is that the contact points between the fiber and soil particles gradually increased with the increase in FL, and the tensile effect of a single fiber is more obvious. When the sample is subject to shear loading, the bridging effect of the fiber can form a wider force transmission system, which results in the improvement of the uniformity and integrity of the sample. The transfer effect between the fibers and soil particles occurs, thereby increasing the shear strength of basalt-fiber-reinforced loess.

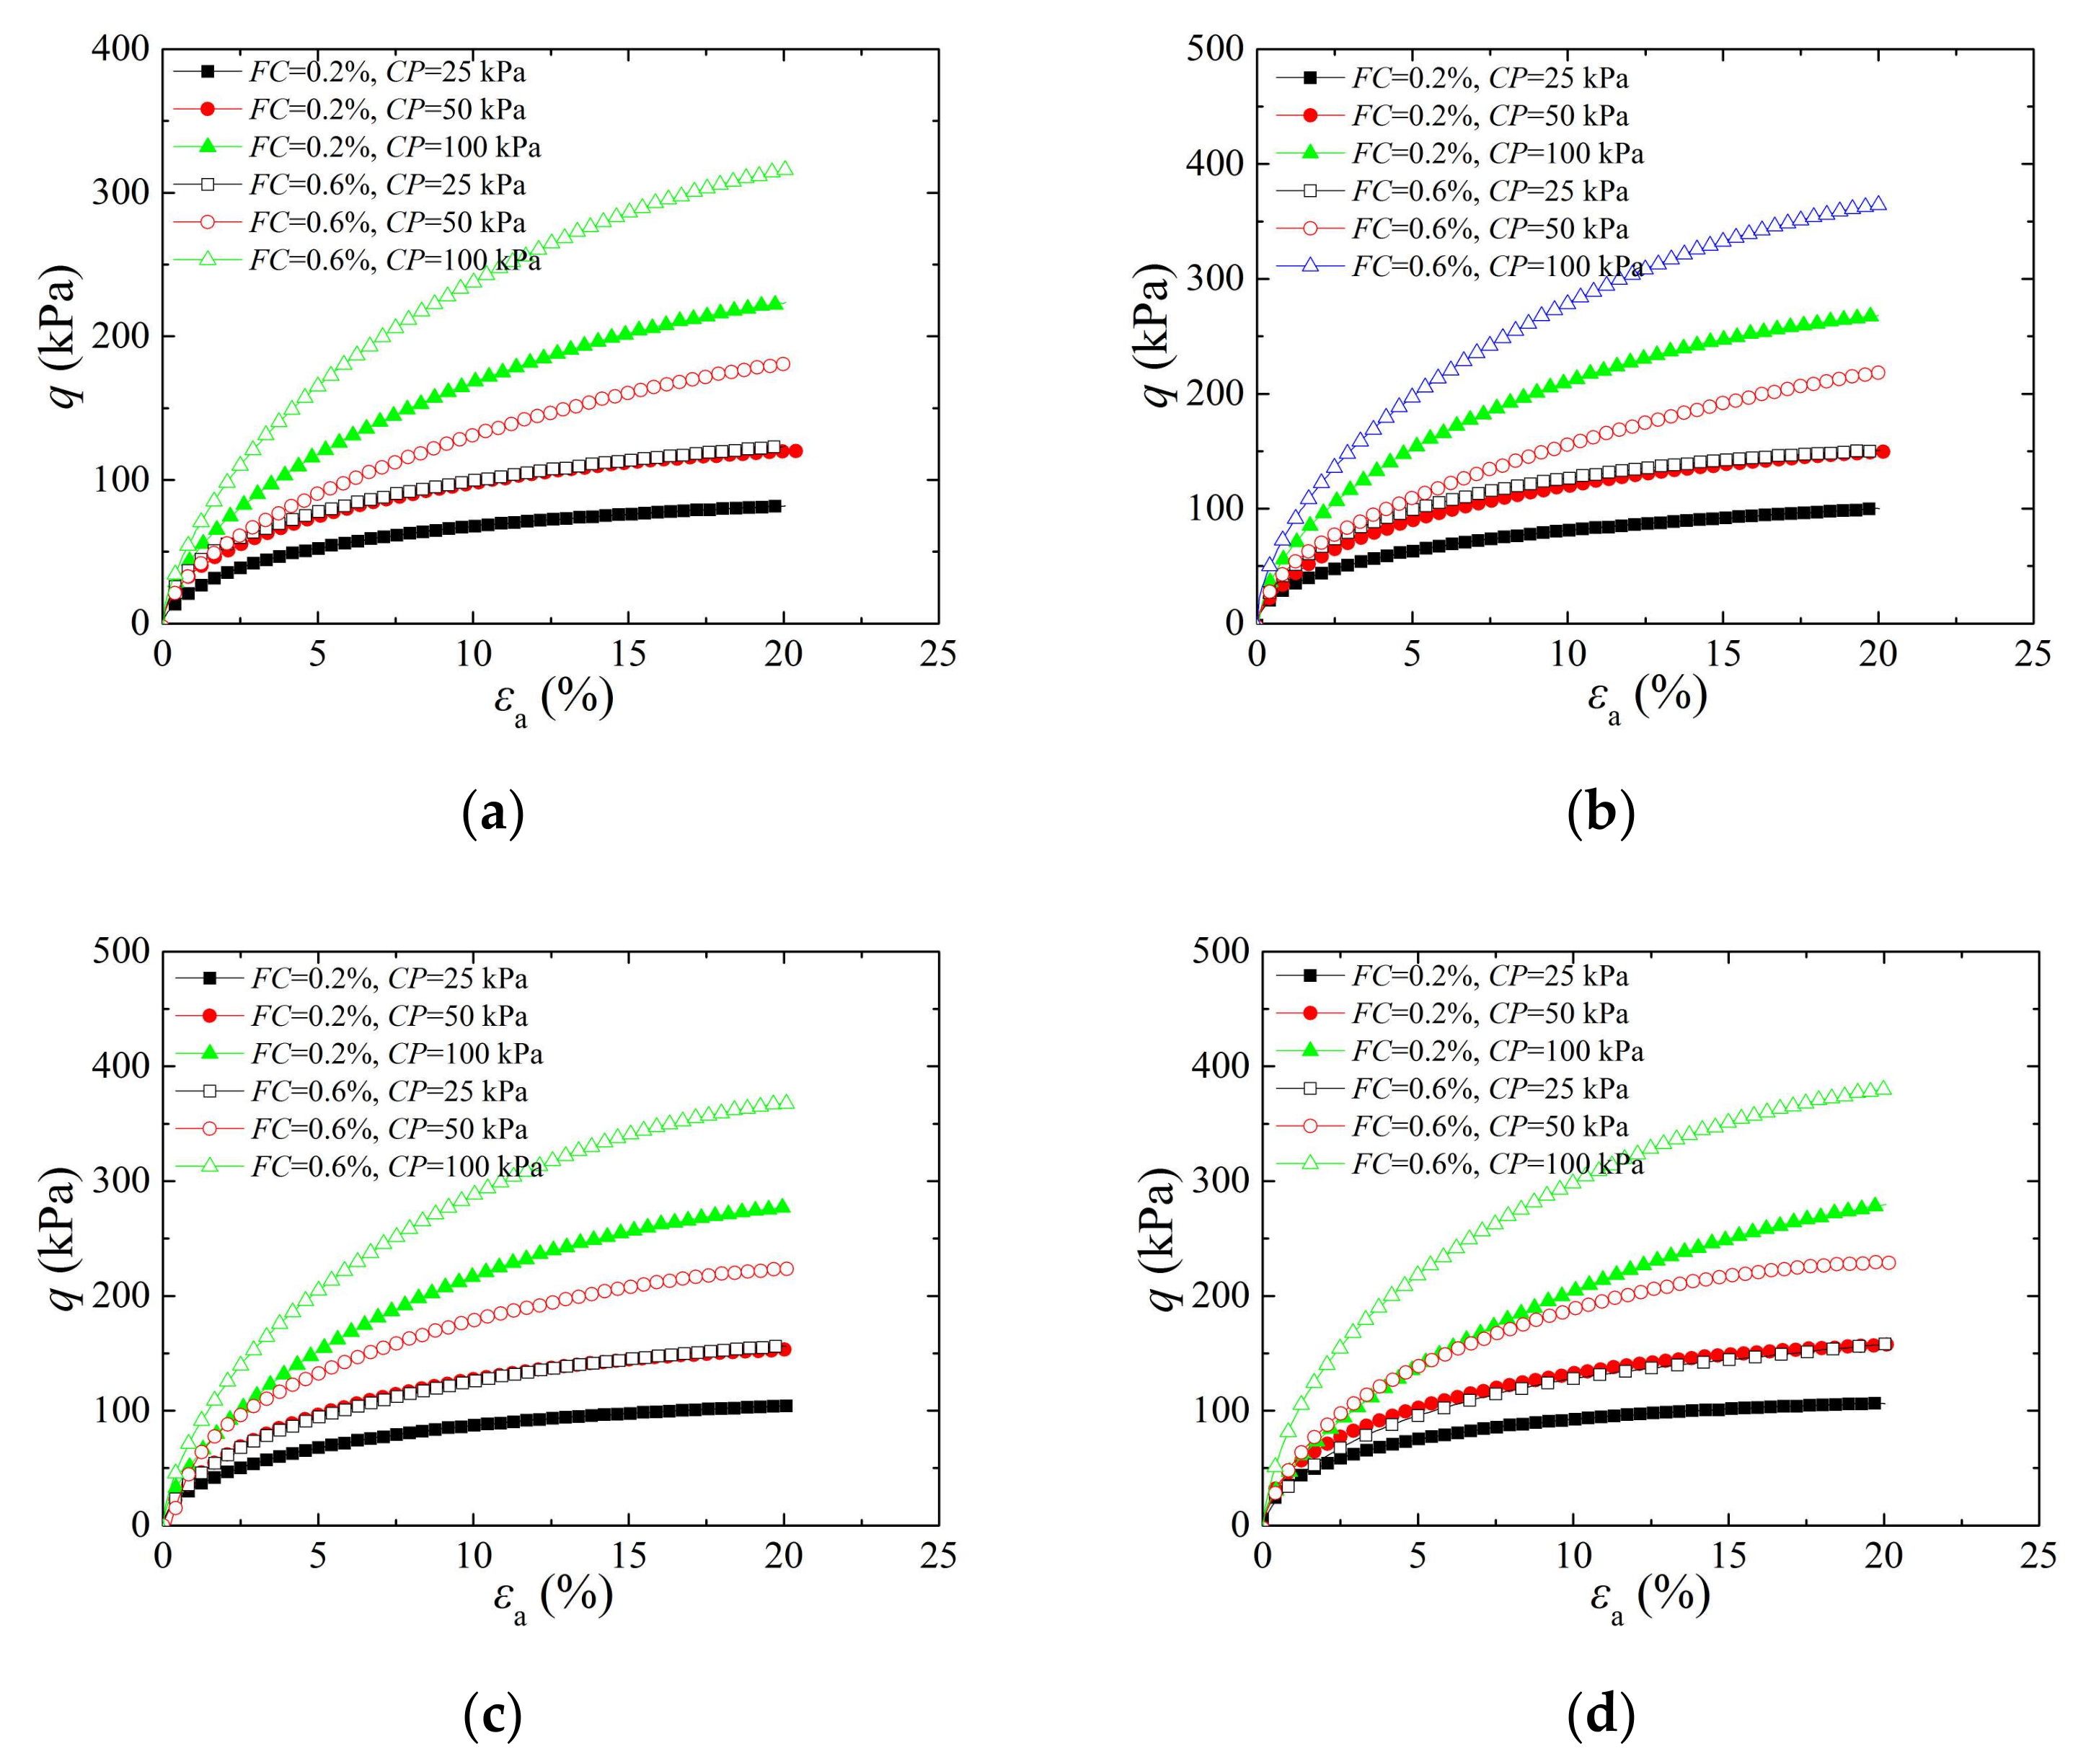
3.3. Effect of Cell Pressure on Strength

For different depths of soil, the cell pressure increased with the increase in depth. Figure 5 shows the stress–strain curves of reinforced soil with different cell pressures (25, 50, and 100 kPa) and FL (4, 8, 12, and 16 mm). It can be observed that the peak strength of fiber-reinforced loess increased with the increase in cell pressure, and the strength of the reinforced soil was significantly higher than that of the unreinforced soil [16]. When the FL was 4 mm and the FC was 0.2%, the peak strength reached 81.84, 120.16, and 223.73 kPa under 25, 50, and 100 kPa, respectively. With the increase in soil depth or cell pressure, the sample encountered a higher lateral restraint force, which requires a larger shear loading to destroy. Due to the bridging effect of fibers, the single tension and spatial mesh structure formed by the fibers can significantly improve the homogeneity and shear strength of the reinforced soil, which is consistent with previous conclusions.

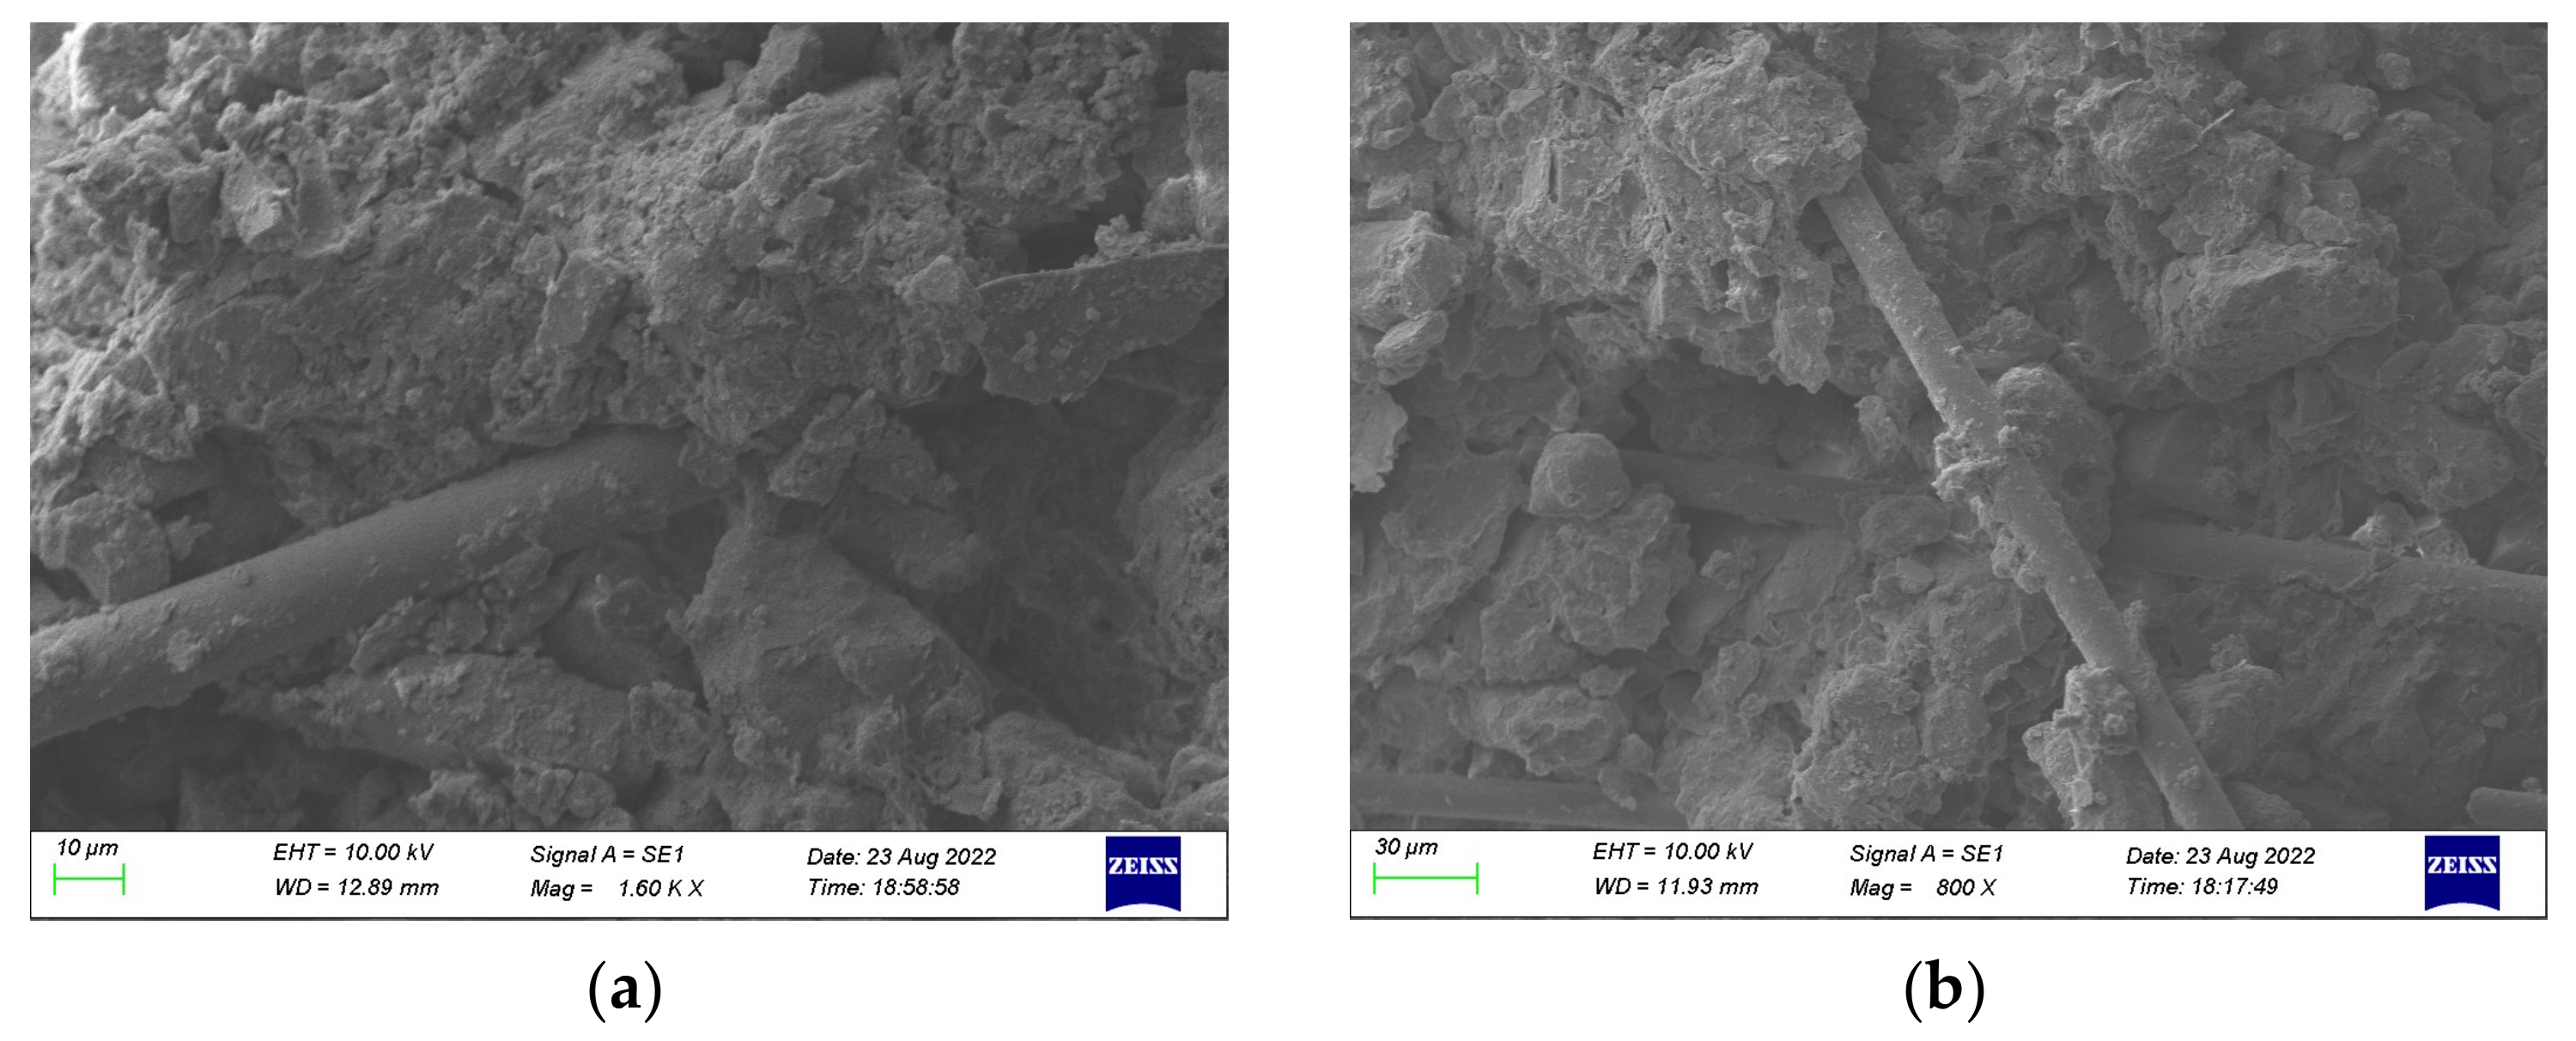
3.4. Microstructure of Basalt-Fiber-Reinforced Loess

To analyze the reinforcement mechanism of fiber-reinforced soil, the scanning electron microscopy (SEM) tests were carried out using SEM equipment (EVO 10 type, ZEISS, Jena, Germany), and Figure 6 shows the microstructure of basalt-fiber-reinforced loess. As shown in Figure 6a, it can be observed that the fiber was surrounded with soil particles, and soil particles had an anchoring effect on the fiber. The shear strength of the reinforced soil depended on the cohesion and friction between fibers and soil particles. When the sample was subjected to shear loading, the external force was transferred from soil particles to fibers between the interfaces. The anchoring effect increases the friction force, prevents the pullout of fibers, and improves the integrality of composite material. Therefore, the peak strength of the reinforced soil was significantly higher than that of the unreinforced soil. As shown in Figure 6b, it can be found that the soil particles were connected by fibers, and fibers played a bridging effect. Due to the high tensile strength of fibers, the bridging effect can restrain the displacement of soil particles and improve the cohesion force of composites, thereby the sample can resist larger deformation and destruction under shear loading. On the whole, the anchoring effect and the bridging effect between fibers and soil particles contributed to the cohesion and friction of composites, resulting in the improvement in the shear strength of the reinforced soil.

4. Constitutive Model of Basalt-Fiber-Reinforced Loess

4.1. Model Establishment

Duncan and Chang [21,22] proposed that the stress–strain relationship of soils can be represented using a hyperbolic model
σ 1 σ 3 = ε 1 a + b ε 1
where σ1 is the axial stress, ε1 is the axial strain, and a and b are the test parameters.
Equation (1) can be transformed to
ε 1 σ 1 σ 3 = a + b ε 1
By plotting the test results as ε1/(σ1σ3) − ε1 curves, the intercept a and slope b can be derived from the regression analysis using OriginPro 9.1 software (OriginLab Corporation, Northampton, MA, USA). The single factor analysis results showed that the parameter b has a negative correlation with FL, FC, and σ3, thus defined as
b = a 2 F L m σ 3
Substituting Equation (3) into Equation (2) to obtain
ε 1 σ 1 σ 3 = a 1 + a 2 F L m σ 3 ε 1
where a1(a1 = a) and a2 (a2 = b·FL·m·σ3) are the model parameters.
From above analysis, it can be concluded that the model contains two model parameters a1 and a2, which can be derived by fitting the experimental data.

4.2. Parameter Fitting

Figure 7 shows the fitting results of reinforced loess with an FL of 4, 8, 12, and 16 mm under 50 kPa cell pressure. It can be observed that the fitting curves are basically positively correlated and have a good linear relationship. The slope of the fitting curve decreased with the increase in the FC when the FL remains constant, whereas the intercept changed slightly. The parameter values of a, b, R2, a1, and a2 can be obtained using the regression analysis, as shown in Table 4. The determinable coefficients of the fitting curves are greater than 0.98, indicating that the hyperbolic model is suitable for describing the stress–strain relationship of basalt-fiber-reinforced loess. According to the statistical analysis of the model parameters, it can be revealed that:
(1)
Under the fixed cell pressure, the parameter a1 has a small internal change with different FL and FC, thereby, the average value of a1 is taken as an estimate value of a1*.
(2)
Under the fixed cell pressure and FL, the parameter a2 increased with the increase in FC. Therefore, taking the parameter a2 at FC = 0.2% as the basic value, a2*(FC = 0.4%) = 1.7 a2*(FC = 0.2%), a2*(FC = 0.6%) = 1.9 a2*(FC = 0.2%), a2*(FC = 0.8%) = 2.3 a2*(FC = 0.2%).
(3)
Under the fixed cell pressure and FC, the parameter a2 increased with the increase in FL. Therefore, taking the parameter a2 at FL = 4 mm as the basic value, a2*(FL = 8 mm) = 1.6 a2*(FL = 4 mm), a2*(FL = 12 mm) = 2.3 a2*(FL = 4 mm), a2*(FL = 16 mm) = 3.0 a2*(FL = 4 mm).
Figure 7. Fitting of the test results under 50 kPa cell pressure: (a) FL = 4 mm; (b) FL = 8 mm; (c) FL = 12 mm; (d) FL = 16 mm.
Applsci 12 09744 g007
Table 4. Model parameters under 50 kPa cell pressure.
σ3 (kPa)FL (mm)FC (%)abR2a1a2a1*a2*
5040.20.028260.007100.995520.028260.00284 0.020000.00284
40.40.027110.006120.990230.027110.00490 0.00483
40.60.030920.004200.984580.030920.00504 0.00540
40.80.022680.004080.995360.022680.00653 0.00653
80.20.025600.005560.995890.02560.00445 0.00454
80.40.021430.004960.994900.021430.00794 0.00772
80.60.025010.003570.982130.025010.00857 0.00863
80.80.018060.003440.994440.018060.01101 0.01045
120.20.022790.005440.998020.022790.00653 0.00653
120.40.015400.004850.999230.01540.01164 0.01110
120.60.018870.003580.997390.018870.01289 0.01241
120.80.011290.003590.998770.011290.01723 0.01502
160.20.018930.005500.996930.018930.00880 0.00852
160.40.011770.004950.998750.011770.01584 0.01448
160.60.017180.003500.997530.017180.01680 0.01619
160.80.012360.003400.999090.012360.02176 0.01960
The estimated values of the parameters a1* and a2* were obtained using the above calculation method and as shown in Table 4. It can be observed that for the fiber-reinforced loess under fixed cell pressure, the model parameters can be obtained from one basic test data set (FL = 4 mm, FC = 0.2%) using regression analysis, and subsequently the other model parameters can be calculated using the above calculation method. In other words, 15 groups of test data can be deduced from one basic test data set (FL = 4 mm, FC = 0.2%), which is convenient as it saves a lot of test time.

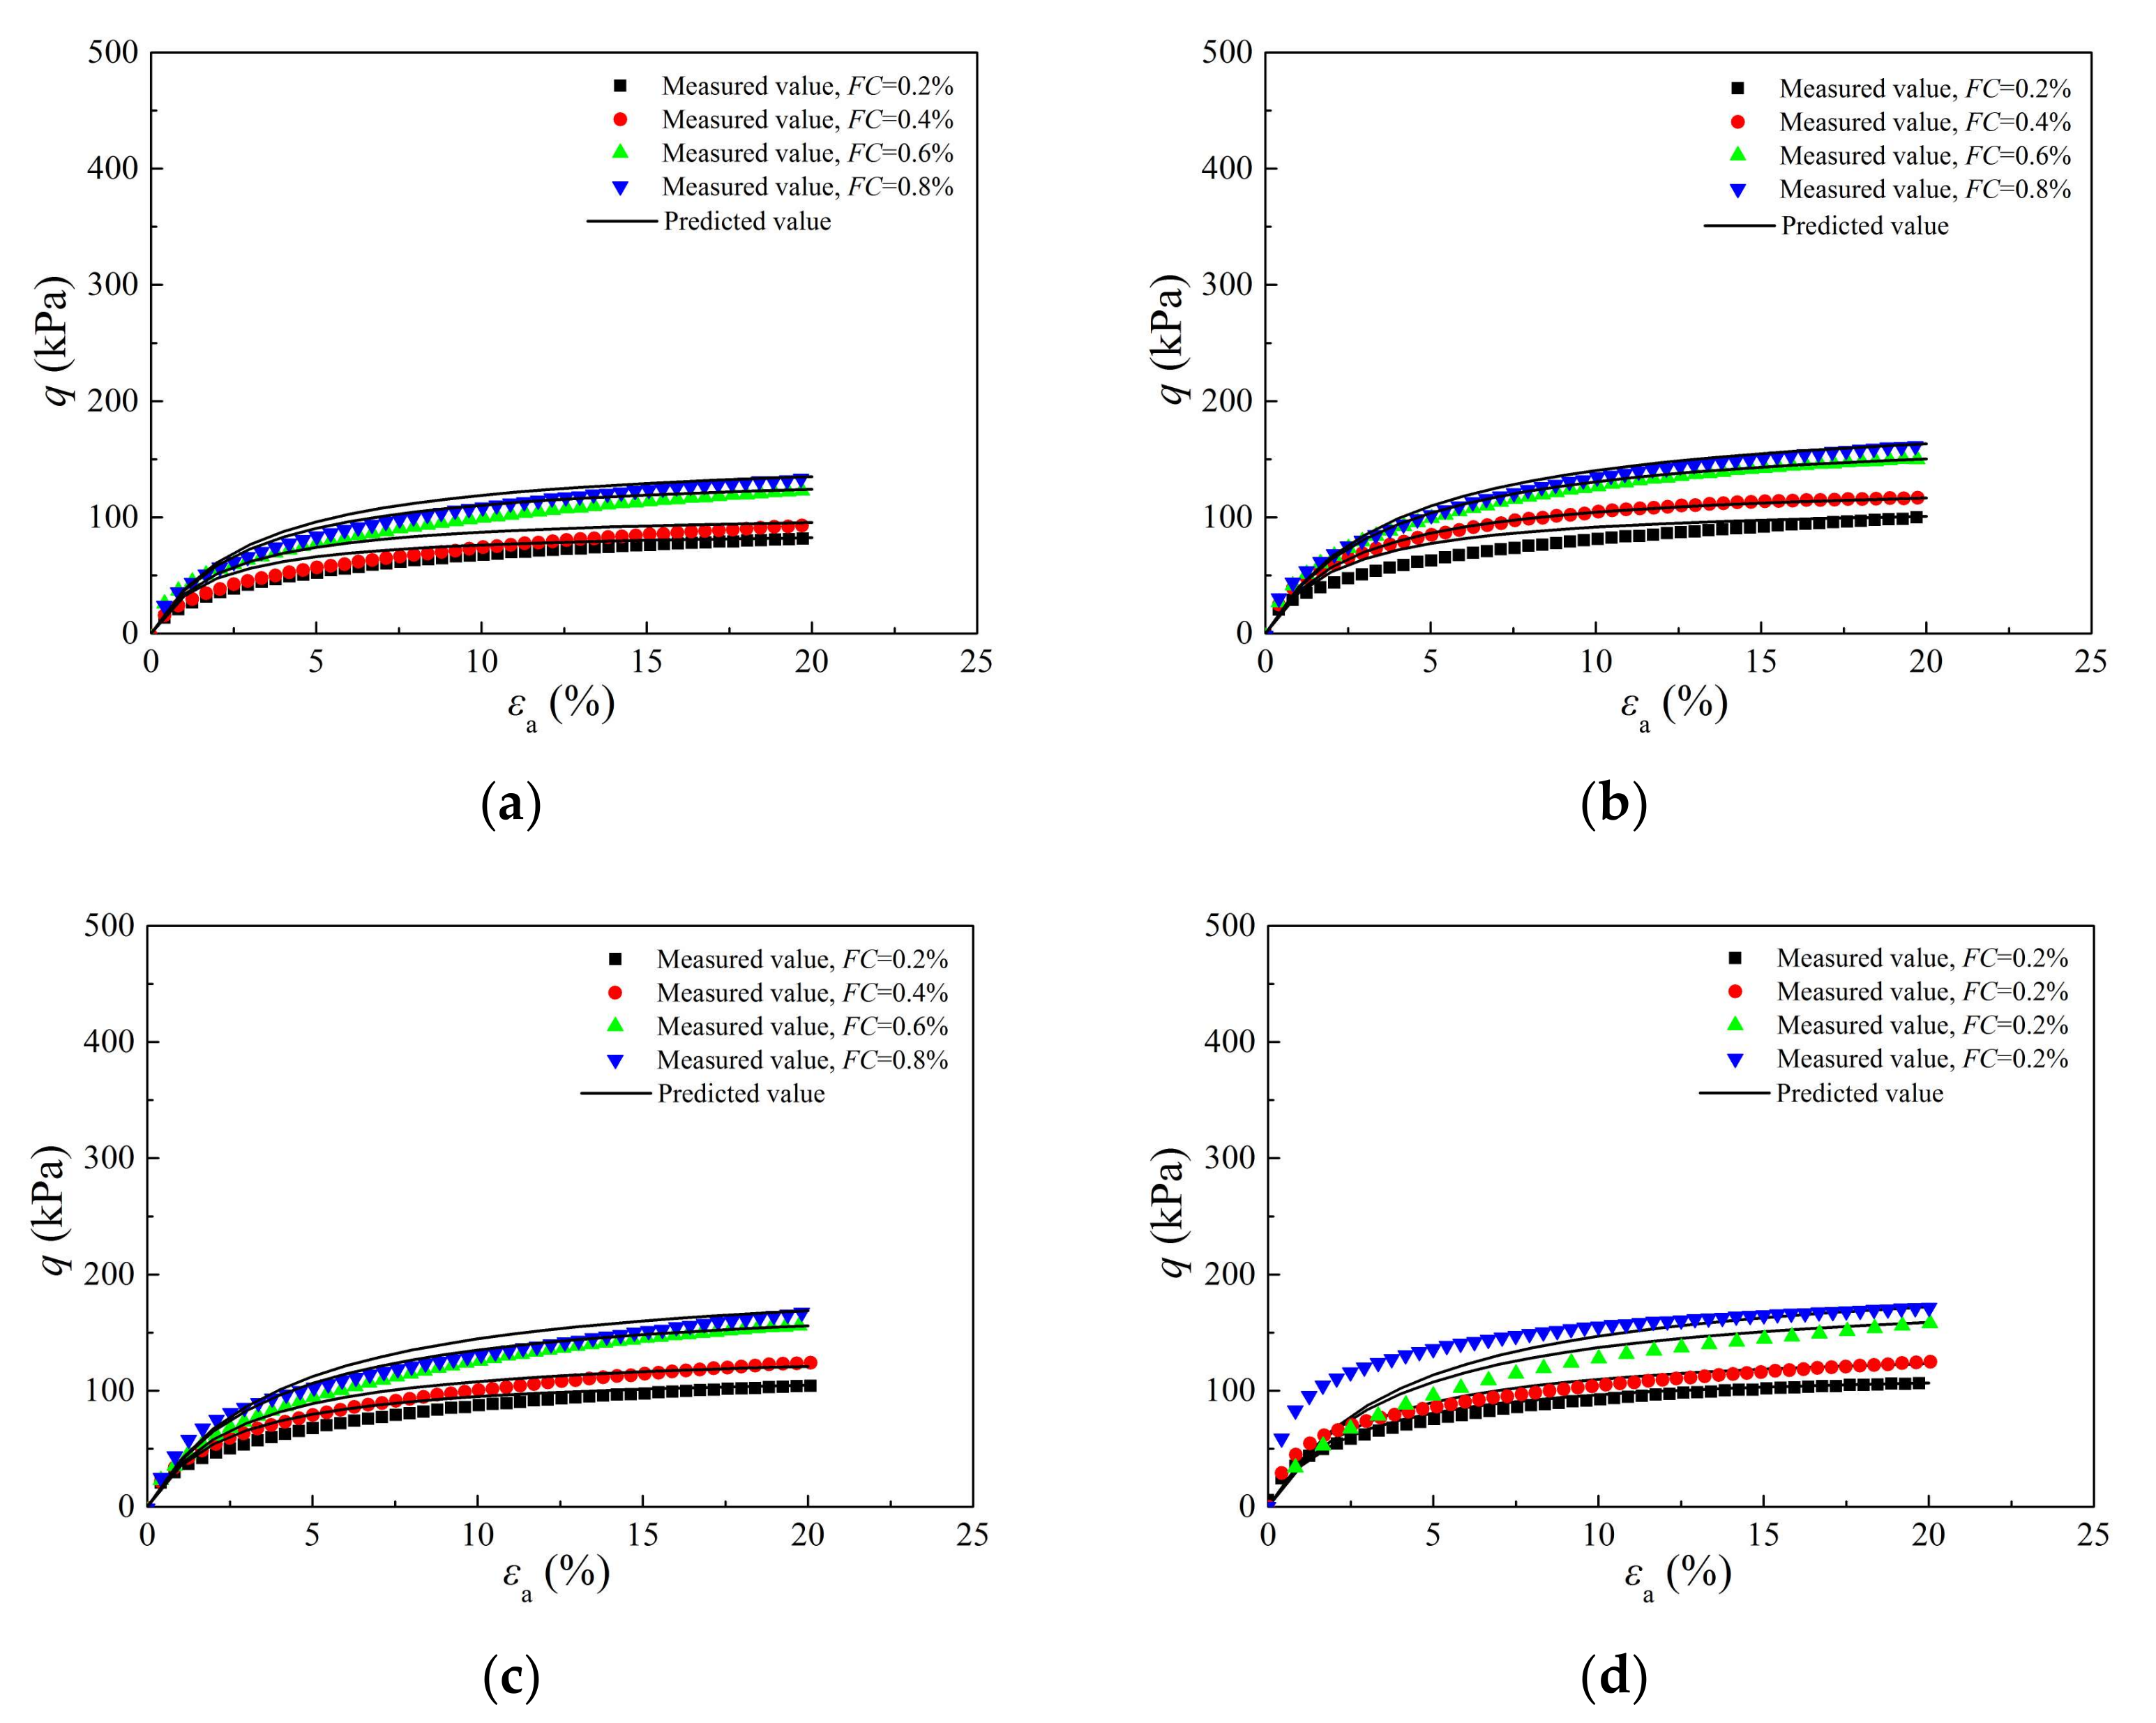
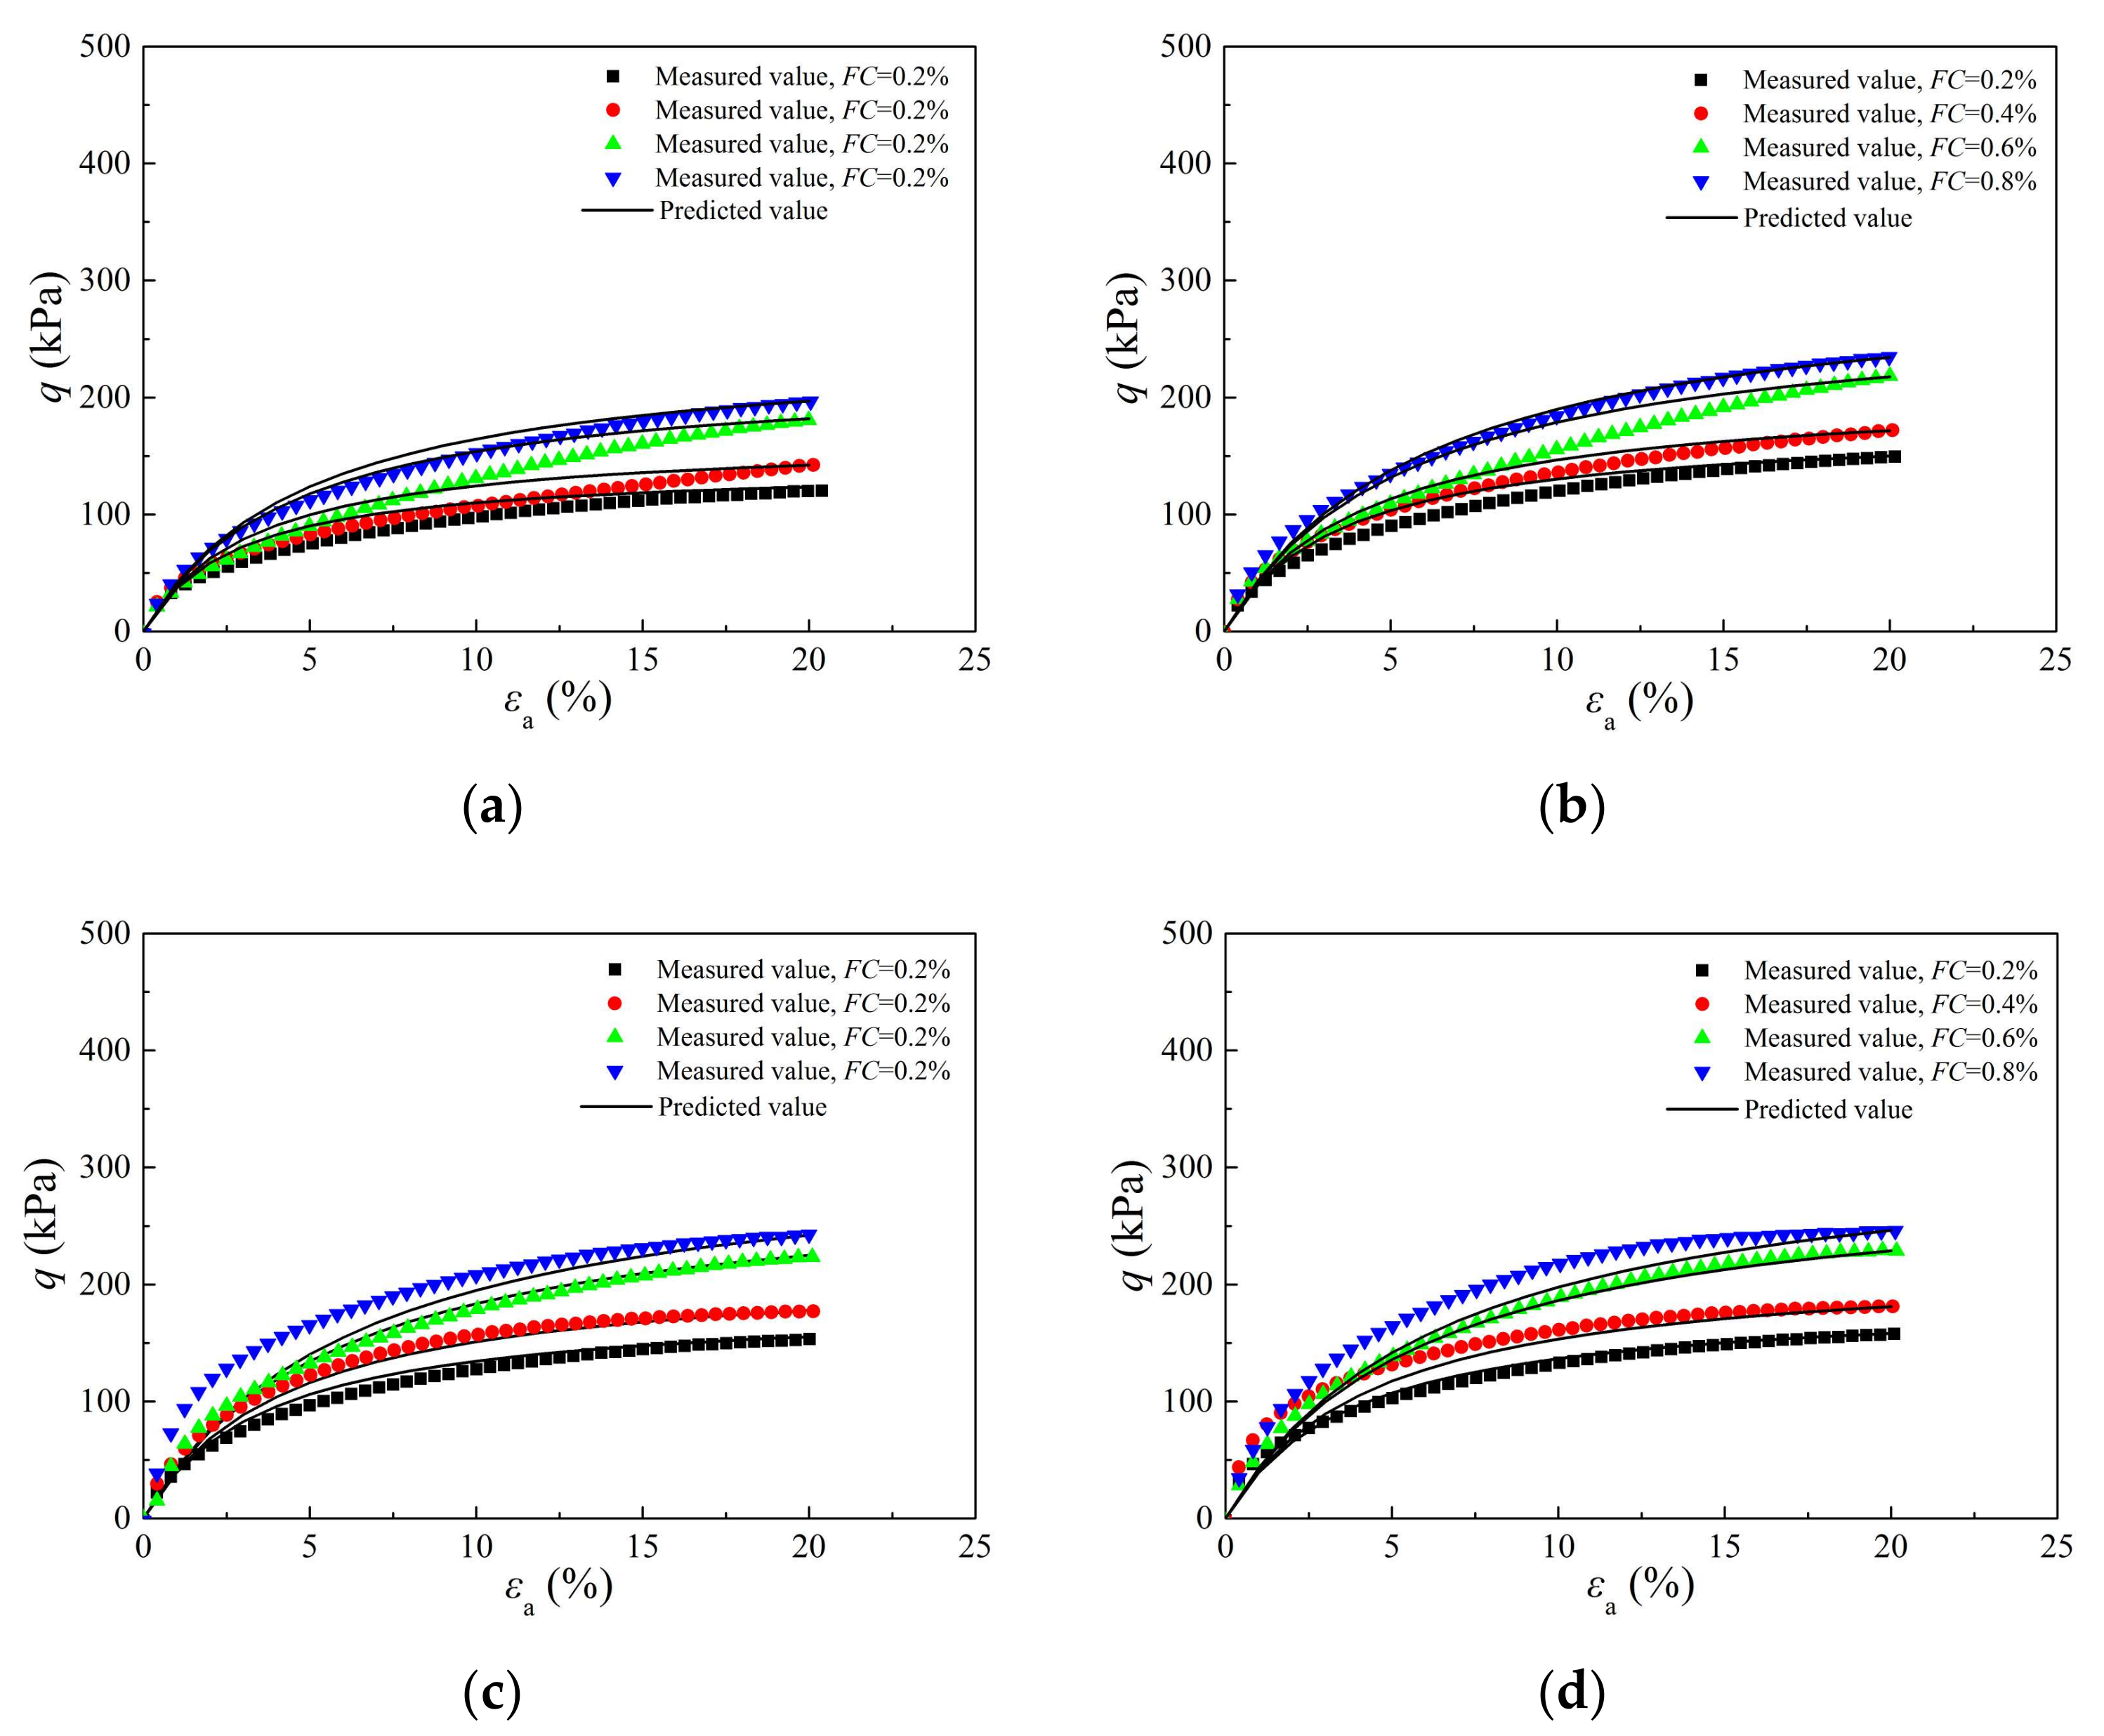
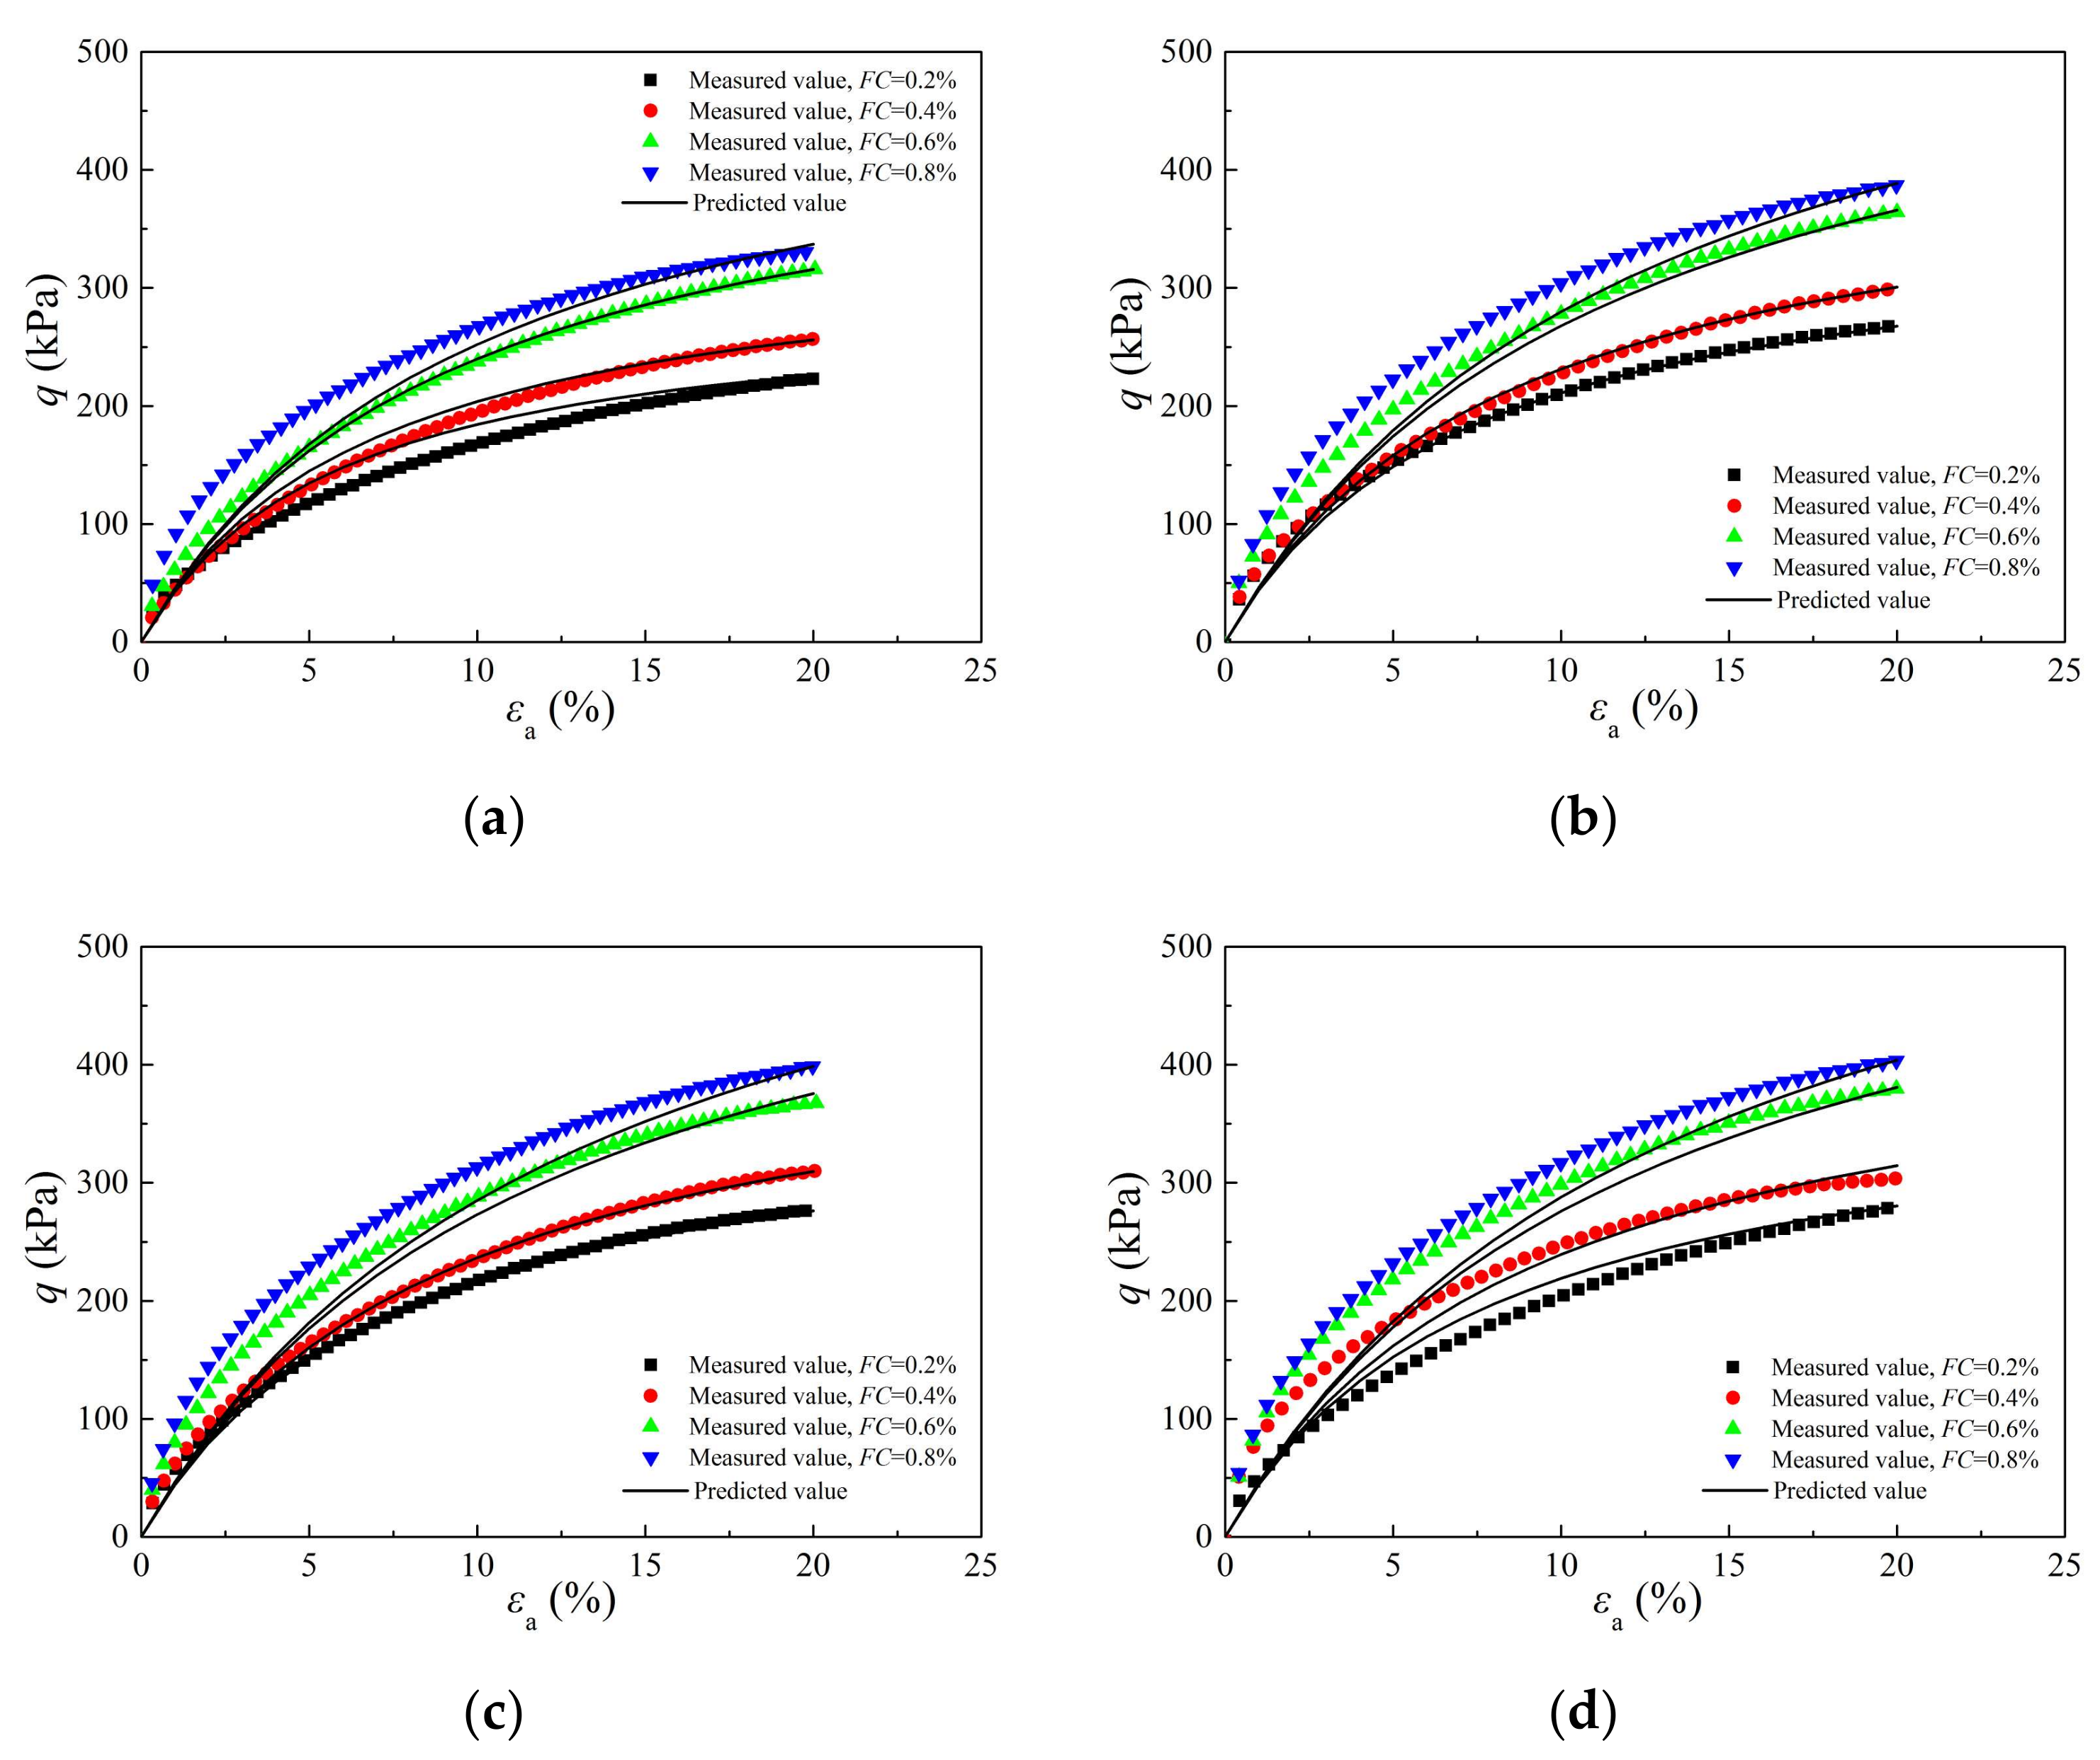
4.3. Model Validation

In order to verify the reliability of the established model, the above calculation method was also used on the test data of 25 kPa and 100 kPa cell pressure, and the results are shown in Table 5. Taking the estimated values of a1* and a2* into Equation (4), the deviatoric stress can be calculated corresponding to the axial strain. Figure 8, Figure 9 and Figure 10 show the comparison between the measured and predicted results of basalt-fiber-reinforced loess under 25, 50, and 100 kPa. It can be concluded that the experimental results agree well with the predicted results, which verified the reliability of the established model and indicated that the hyperbolic model and parameter estimation method are suitable for describing the stress–strain relationship of basalt-fiber-reinforced loess.

5. Conclusions

Based on the consolidated untrained triaxial tests, the effects of fiber length, fiber content and cell pressure on the strength of basalt-fiber-reinforced loess were analyzed. A constitutive model for the reinforced soil was established to consider the effects of fiber content, fiber length and cell pressure, and an estimation method for the model parameters was proposed. The main conclusions can be drawn as follows:
(1)
The stress–strain curve of the unreinforced soil exhibited strain-softening, while that of reinforced soil showed strain-hardening. The peak strength of the fiber-reinforced soil was significantly higher than that of the unreinforced soil and increased with the increase in fiber content.
(2)
The peak strength of fiber-reinforced soil gradually increased with the increase in fiber length, and the peak strength of 12 and 16 mm fiber lengths increased slightly than the 8 mm fiber length.
(3)
The peak strength of the fiber-reinforced soil increased with the increase in cell pressure. When the fiber length was 16 mm and the fiber content was 0.6%, the peak strength reached 158.01, 229.67, and 380.31 kPa under 25, 50, and 100 kPa cell pressure, respectively.
(4)
Soil particles had anchoring effect on fibers, and fibers had a bridging effect on soil particles. The anchoring effect and bridging effect improved the cohesion and friction of the reinforced soil.
(5)
The experimental results agreed well with the predicted results, indicating that the established model and the parameter estimation method are suitable for describing the constitutive relationship of basalt-fiber-reinforced loess.

Author Contributions

Conceptualization, H.K. and Q.M.; methodology, Q.M.; validation, H.K. and S.H.; formal analysis, H.K.; data curation, S.H.; writing—original draft preparation, H.K.; writing—review and editing, Q.M.; funding acquisition, Q.M. All authors have read and agreed to the published version of the manuscript.

Funding

This research was funded by the National Natural Science Foundation of China, grant number 52078194, the National Young Top-notch Talent of “Ten Thousand Talents Program”, the Young Top-notch Talent Cultivation Program of Hubei Province, and the Innovation Demonstration Base of Ecological Environment Geotechnical and Ecological Restoration of Rivers and Lakes, grant number 2020EJB004.

Institutional Review Board Statement

Not applicable.

Informed Consent Statement

Not applicable.

Data Availability Statement

Not applicable.

Conflicts of Interest

The authors declare no conflict of interest.

References

  1. Li, G.; Zhang, J.L.; Liu, J. Experimental study on the shear behaviors of polypropylene fiber-reinforced sand. KSCE J. Civ. Eng. 2019, 23, 4992–5001. [Google Scholar] [CrossRef]
  2. Zhang, J.L.; Yang, Z.Y.; Yang, Q.; Yang, G.; Li, G.; Liu, J. Liquefaction behavior of fiber-reinforced sand based on cyclic triaxial tests. Geosynth. Int. 2021, 28, 316–326. [Google Scholar] [CrossRef]
  3. Zhang, J.L.; Yang, Z.Y.; Yang, Q.; Li, G.; Liu, J. Pore water pressure model for sands reinforced with randomly distributed fibers based on cyclic triaxial tests. Soil Dyn. Earthquake Eng. 2021, 148, 106812. [Google Scholar] [CrossRef]
  4. Dong, C.F.; Zhang, W.Y.; Sun, X.L.; Xie, B.L. Experimental study on the shear strength of lignin fiber-improved loess. Saf. Environ. Eng. 2022, 29, 102–110. [Google Scholar]
  5. Xiong, Y.; Deng, H.F.; Peng, M.; Qi, Y.; Li, T. Shear properties of loess reinforced with four synthetic fibers. J. Yangtze River Sci. Res. Inst. 2022, 39, 122–126. [Google Scholar]
  6. Lu, H.; Yan, C.G.; Jia, Z.L.; Lan, H.X.; Shi, Y.L.; Yang, X.H.; Zhang, Z.Q. Shear strength and disintegration properties of polypropylene fiber-reinforced loess. J. Traffic Transp. Eng. 2021, 21, 82–92. [Google Scholar]
  7. An, N.; Yan, C.G.; Wang, Y.C.; Lan, H.X.; Bao, H.; Xu, J.B.; Shi, Y.L.; Sun, W.F. Experimental study on anti-erosion performance of polypropylene fiber-reinforced loess. Rock Soil Mech. 2021, 42, 501–510. [Google Scholar]
  8. Hu, W.L.; He, P.L.; Liu, H. Experimental study on optimization of shear strength parameters of basalt fiber loess. Chin. J. Geol. Hazard Control. 2019, 30, 92–97. [Google Scholar]
  9. Xu, J.; Wu, Z.P.; Chen, H.; Shao, L.T.; Zhou, X.G.; Wang, S.H. Study on strength behavior of basalt fiber-reinforced loess by digital image technology (DIT) and scanning electron microscope (SEM). Arabian J. Sci. Eng. 2021, 46, 11319–11338. [Google Scholar] [CrossRef]
  10. Xu, J.; Wu, Z.P.; Chen, H.; Shao, L.T.; Zhou, X.G.; Wang, S.H. Triaxial shear behavior of basalt fiber-reinforced loess based on digital image technology. KSCE J. Civ. Eng. 2021, 25, 3714–3726. [Google Scholar] [CrossRef]
  11. Wu, Z.P.; Xu, J.; Chen, H.; Shao, L.T.; Zhou, X.G.; Wang, S.H. Shear strength and mesoscopic characteristics of basalt fiber-reinforced loess after dry-wet cycles. J. Mater. Civ. Eng. 2022, 34, 04022083. [Google Scholar] [CrossRef]
  12. Yan, C.G.; An, N.; Wang, Y.C.; Sun, W.F. Effect of dry-wet cycles and freeze-thaw cycles on the antierosion ability of fiber-reinforced loess. Adv. Mater. Sci. Eng. 2021, 2021, 8834598. [Google Scholar] [CrossRef]
  13. Mariri, M.; Moayed, R.Z.; Kordnaeij, A. Stress-strain behavior of loess soil stabilized with cement, zeolite, and recycled polyester fiber. J. Mater. Civ. Eng. 2019, 31, 04019291. [Google Scholar] [CrossRef]
  14. Xue, Z.F.; Cheng, W.C.; Wang, L.; Song, G.Y. Improvement of the shearing behaviour of loess using recycled straw fiber reinforcement. KSCE J. Civ. Eng. 2021, 25, 3319–3335. [Google Scholar] [CrossRef]
  15. Yang, B.H.; Weng, X.Z.; Liu, J.Z.; Kou, Y.N.; Jiang, L.; Li, H.L.; Yan, X.C. Strength characteristics of modified polypropylene fiber and cement-reinforced loess. J. Cent. South Univ. 2017, 24, 560–568. [Google Scholar] [CrossRef]
  16. Lian, B.Q.; Peng, J.B.; Zhan, H.B.; Cui, X.S. Effect of randomly distributed fibre on triaxial shear behavior of loess. Bull. Eng. Geol. Environ. 2020, 79, 1555–1563. [Google Scholar] [CrossRef]
  17. Zhang, J.; Weng, X.Z.; Liu, J.Z. Strength and water stability of a fiber-reinforced cemented loess. J. Eng. Fibers Fabr. 2018, 13, 72–83. [Google Scholar] [CrossRef]
  18. Gao, Z.N.; Zhong, X.M.; Wang, Q.; Su, Y.Q.; Wang, J. The influence of freeze-thaw cycles on unconfined compressive strength of lignin fiber-reinforced loess. J. Renewable Mater. 2022, 10, 1063–1080. [Google Scholar] [CrossRef]
  19. Sarli, J.M.; Hadadi, F.; Bagheri, R.A. Stabilizing geotechnical properties of loess soil by mixing recycled polyester fiber and nano-SiO2. Geotech. Geol. Eng. 2020, 38, 1151–1163. [Google Scholar] [CrossRef]
  20. Wang, X.G.; Liu, K.; Lian, B.Q. Experimental study on ring shear properties of fiber-reinforced loess. Bull. Eng. Geol. Environ. 2021, 80, 5021–5029. [Google Scholar] [CrossRef]
  21. Duncan, J.M.; Chang, C.Y. Nonlinear analysis of stress and strain in soils. J. Soil Mech. Found. Div. 1970, 96, 1629–1653. [Google Scholar] [CrossRef]
  22. Liu, J.; Li, X.A.; Li, G.; Zhang, J.L. Investigation of the mechanical behavior of polypropylene fiber-reinforced red clay. Appl. Sci. 2021, 11, 10521. [Google Scholar] [CrossRef]
Figure 1. Flow chart of the sample preparation.
Applsci 12 09744 g001
Figure 2. Triaxial testing equipment.
Applsci 12 09744 g002
Figure 3. Effect of fiber content on stress–strain curves under 50 kPa cell pressure: (a) FL = 4 mm; (b) FL = 8 mm; (c) FL = 12 mm; (d) FL = 16 mm.
Applsci 12 09744 g003
Figure 4. Effect of fiber length on stress–strain curves under 50 kPa cell pressure: (a) FC = 0.2%; (b) FC = 0.4%; (c) FC = 0.6%; (d) FC = 0.8%.
Applsci 12 09744 g004
Figure 5. Effect of cell pressure on stress–strain curves: (a) FL = 4 mm; (b) FL = 8 mm; (c) FL = 12 mm; (d) FL = 16 mm.
Applsci 12 09744 g005
Figure 6. SEM images of fiber-reinforced loess: (a) anchoring effect; (b) bridging effect.
Applsci 12 09744 g006
Figure 8. Results comparison between measured and predicted results under 25 kPa cell pressure: (a) FL = 4 mm; (b) FL = 8 mm; (c) FL = 12 mm; (d) FL = 16 mm.
Applsci 12 09744 g008
Figure 9. Results comparison between measured and predicted results under 50 kPa cell pressure: (a) FL = 4 mm; (b) FL = 8 mm; (c) FL = 12 mm; (d) FL = 16 mm.
Applsci 12 09744 g009
Figure 10. Results comparison between measured and predicted results under 100 kPa cell pressure: (a) FL = 4 mm; (b) FL = 8 mm; (c) FL = 12 mm; (d) FL = 16 mm.
Applsci 12 09744 g010
Table 1. Main physical properties of loess.
Gsρ (g/cm3)w (%)ewL(%)wP (%)IPρdmax (g/cm3)wopt (%)
2.701.6814.20.83525.816.79.11.7215.0
Table 2. Physical and mechanical properties of basalt fiber.
Diameter (μm)Tensile Strength (MPa)Elastic Modulus (GPa)Density (g/cm3)Elongation at Fracture (%)
103500–45001002.652.2
Table 3. Test scheme.
σ3 (kPa)FL (mm)FC (%)
2500
40.2, 0.4, 0.6, 0.8
80.2, 0.4, 0.6, 0.8
120.2, 0.4, 0.6, 0.8
160.2, 0.4, 0.6, 0.8
5000
40.2, 0.4, 0.6, 0.8
80.2, 0.4, 0.6, 0.8
120.2, 0.4, 0.6, 0.8
160.2, 0.4, 0.6, 0.8
10000
40.2, 0.4, 0.6, 0.8
80.2, 0.4, 0.6, 0.8
120.2, 0.4, 0.6, 0.8
160.2, 0.4, 0.6, 0.8
Table 5. Model parameters under 25 and 100 kPa cell pressures.
σ3 (kPa)FL (mm)FC (%)abR2a1a2a1*a2*
2540.20.039270.010530.997540.039270.00211 0.02000 0.00223
40.40.038980.009170.994570.038980.00367 0.00379
40.60.025890.007090.994700.025890.00425 0.00424
40.80.025140.006440.996150.025140.00515 0.00513
80.20.031890.008750.995470.031890.00350 0.00357
80.40.019300.007590.999300.019300.00607 0.00607
80.60.020040.005730.997770.020040.00688 0.00679
80.80.020260.005290.996500.020260.00846 0.00821
120.20.029010.008330.997090.029010.00500 0.00513
120.40.026290.007000.996030.026290.00840 0.00873
120.60.024440.005300.995890.024440.00954 0.00975
120.80.020930.005210.993800.020930.01250 0.01181
160.20.022150.008400.998430.022150.00672 0.00670
160.40.019670.007300.996860.019670.01168 0.01138
160.60.024270.005280.997910.024270.01267 0.01272
160.80.008320.005510.999220.008320.01763 0.01540
10040.20.022790.003460.990230.022790.00277 0.020000.00274
40.40.022430.002810.995550.022430.00450 0.00465
40.60.016950.002390.992840.016950.00574 0.00520
40.80.011380.002500.994910.011380.00800 0.00629
80.20.016640.002960.995310.016640.00474 0.00438
80.40.017110.002550.990290.017110.00816 0.00744
80.60.013120.002150.990570.013120.01032 0.00832
80.80.010940.002090.994440.010940.01338 0.01007
120.20.017540.002770.994190.017540.00665 0.00629
120.40.016770.002440.992380.016770.01171 0.01070
120.60.012770.002110.994930.012770.01519 0.01196
120.80.010620.002030.994440.010620.01949 0.01447
160.20.021150.002620.988780.021150.00838 0.00821
160.40.012270.002720.994980.012270.01741 0.01395
160.60.011150.002130.994440.011150.02045 0.01560
160.80.010500.002000.994440.010500.02560 0.01888
Publisher’s Note: MDPI stays neutral with regard to jurisdictional claims in published maps and institutional affiliations.

