1. Introduction
Essential oils are plant extracts commonly obtained by steam distillation and are primarily composed of terpenes. In recent years, their use has become increasingly prevalent. In the home, essential oils are often diffused with the purpose of adding a pleasant aroma to a living space and freshening the air. In fact, it has been noted that since ancient times, burning frankincense and myrrh in places of worship was performed for spiritual purposes [
1,
2]. However, this practice also had hygienic functions in that burning of incense not only improved odors/smells but also reduced contagion by purifying the indoor air. Research has demonstrated that incense fumes can affect a reduction in air-borne viable microbial counts by up to 80.4% for fungi and 91.4% for bacteria [
1,
2].
The perception of smell is a complex process that begins with odorant molecules, such as the terpenes and terpenoids that make up most essential oils, binding to G-protein coupled receptors in the olfactory bulb [
3,
4]. It is logical to consider that terpenes can bind to other proteins as well. Since allergens are commonly proteinaceous in nature, interactions between allergens and vaporized essential oils might be anticipated [
4,
5].
Allergy is a term introduced by the Austrian physician Clemens von Picquet in 1906 to describe the changes in reactivity of both the body’s protective immune system and the hypersensitivity reactions induced by allergens [
6]. Allergies affect an estimated 500 million people worldwide [
7], and pollen is a leading cause of allergies, with the most common symptoms being sneezing, itchy nose, rhinorrhea, and nasal congestion [
8]. The method of exposure to an allergen dictates the allergic response. For example, pollen size plays a role in allergic response. Wind can carry particles 20–60 µm in diameter and so cause allergic rhinoconjunctivitis, which affects the eyes and nose, whereas particles ≤7 µm may instead deposit in airways and lead to symptoms of asthma [
9].
Pollen allergies are reported to affect up to 30% of the world’s human population and the prevalence is rising [
6]. Previous epidemiological studies confirm the prevalence and progressive rise in allergy symptoms, including acute rhinitis, allergic rhinoconjunctivitis, asthma, and atopic eczema [
6,
9]. The rise in allergy prevalence has been attributed to increasing atmospheric levels of CO
2 and warmer temperatures, which are lengthening pollen seasons and allowing plants to produce pollen earlier and in larger quantities, particularly in northern latitudes [
10,
11,
12,
13]. This also means that urban locations, where heat is trapped by paved surfaces and buildings, and where more pollutants can interact with pollen, are more affected as well [
10,
14]. Urbanization and a Westernized lifestyle are correlated with an increased frequency of pollen allergies [
15]. As these changes continue, additional novel ways to combat allergies will become more necessary.
A great deal of the focus on allergy management rightly focuses on avoiding the outdoors and strategies to prevent pollen from entering indoors [
16]. Yet, it is inevitable that pollen will enter the home, and additional research concerning indoor management is still valuable. Household dust is a complex mixture that is a source of many allergens, containing such varied contents as dead skin cells, mites, dead insects, hair, pet dander, fibers, microplastics, soil, as well as pollen, with many compounds still unknown [
17]. The amount of pollen found indoors has also been shown to increase considerably following a pollinating season and persist even after the season has ended [
18]. Research in India of many pollen types similarly shows that indoor pollen is found in corresponding, albeit lesser, amounts relative to outdoor pollen [
19].
It follows from the above that the common and very popular practice of aromatherapy might have a beneficial effect on the presence of aeroallergens such as pollen in indoor air. Since diffusers are primarily designed for use indoors, we hypothesized that diffused essential oils could also interact with airborne pollen indoors, and perhaps help alleviate the increasing problem of allergies. To test this idea, we designed and conducted an experiment to determine if water and essential oil vapor from an ultrasonic diffuser might affect the behavior of pollen in a closed system. This initial test was designed as a proof of concept for how diffusers, with and without essential oil, and pollen interact in a closed system.
2. Materials and Methods
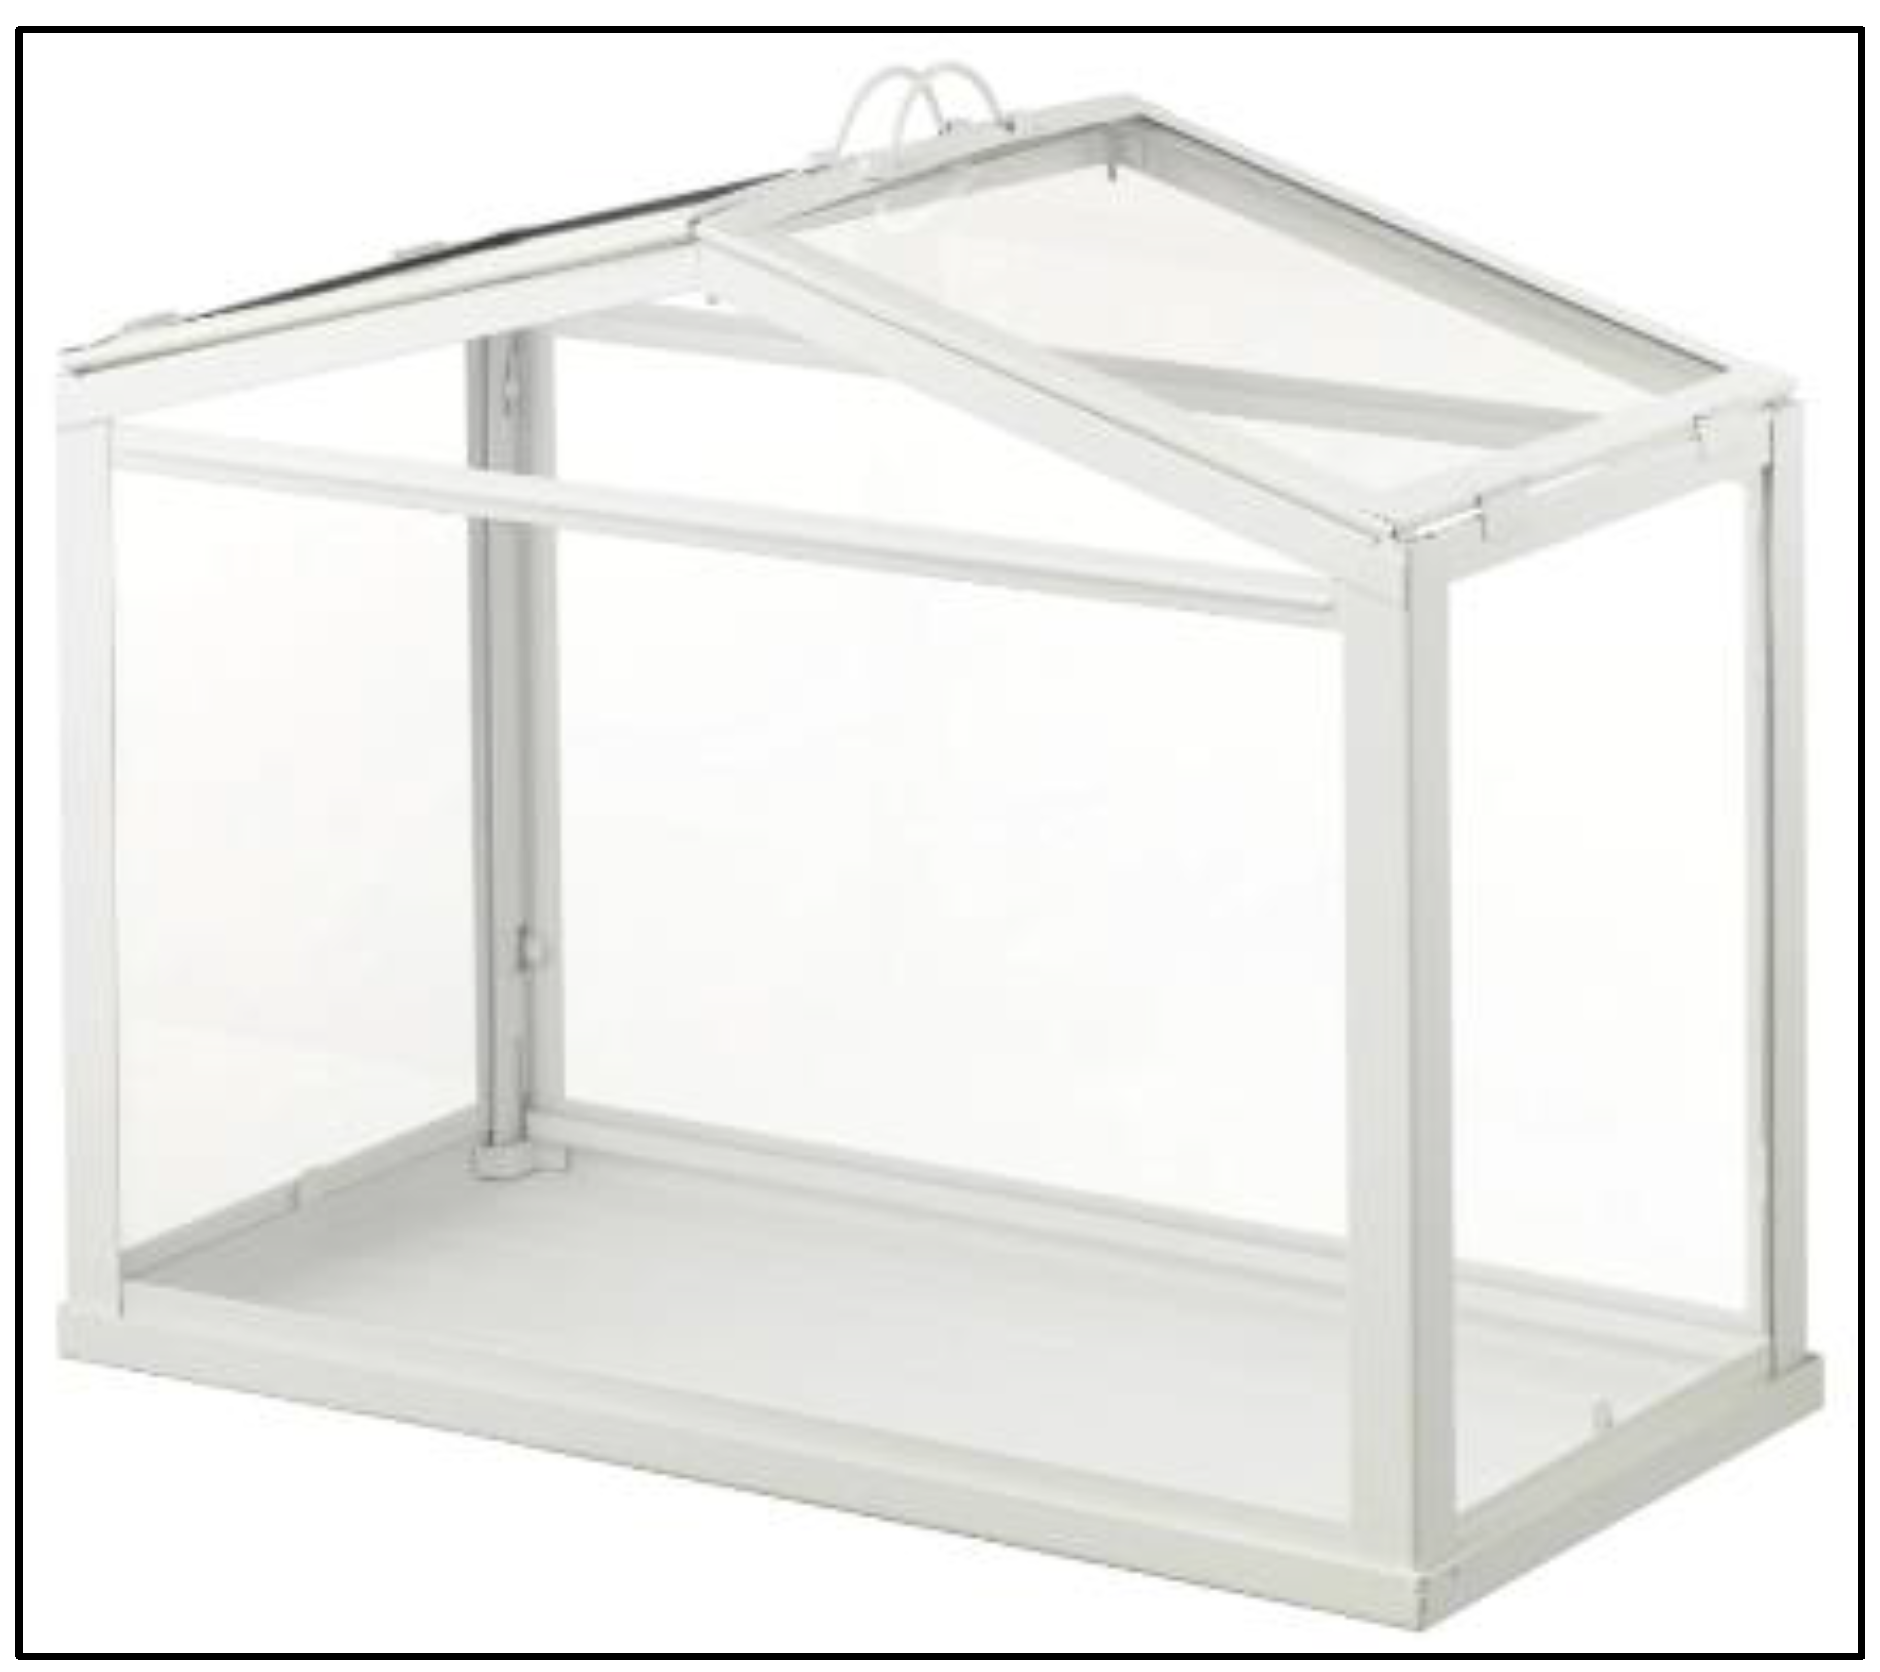
For the purposes of this experiment, a glass enclosed terrarium with dimensions of 17.75 in × 8.75 in × 13.75 in and an internal volume of 1853 in
3 was used (
Figure 1). A one-inch diameter opening was created in an upper side wall of the terrarium to facilitate the introduction of pollen into the terrarium. The upper portions of the terrarium were sealed with tape. The terrarium was placed on the counter of the laboratory so that it could be lifted off the table for setup and to collect data between different testing conditions.
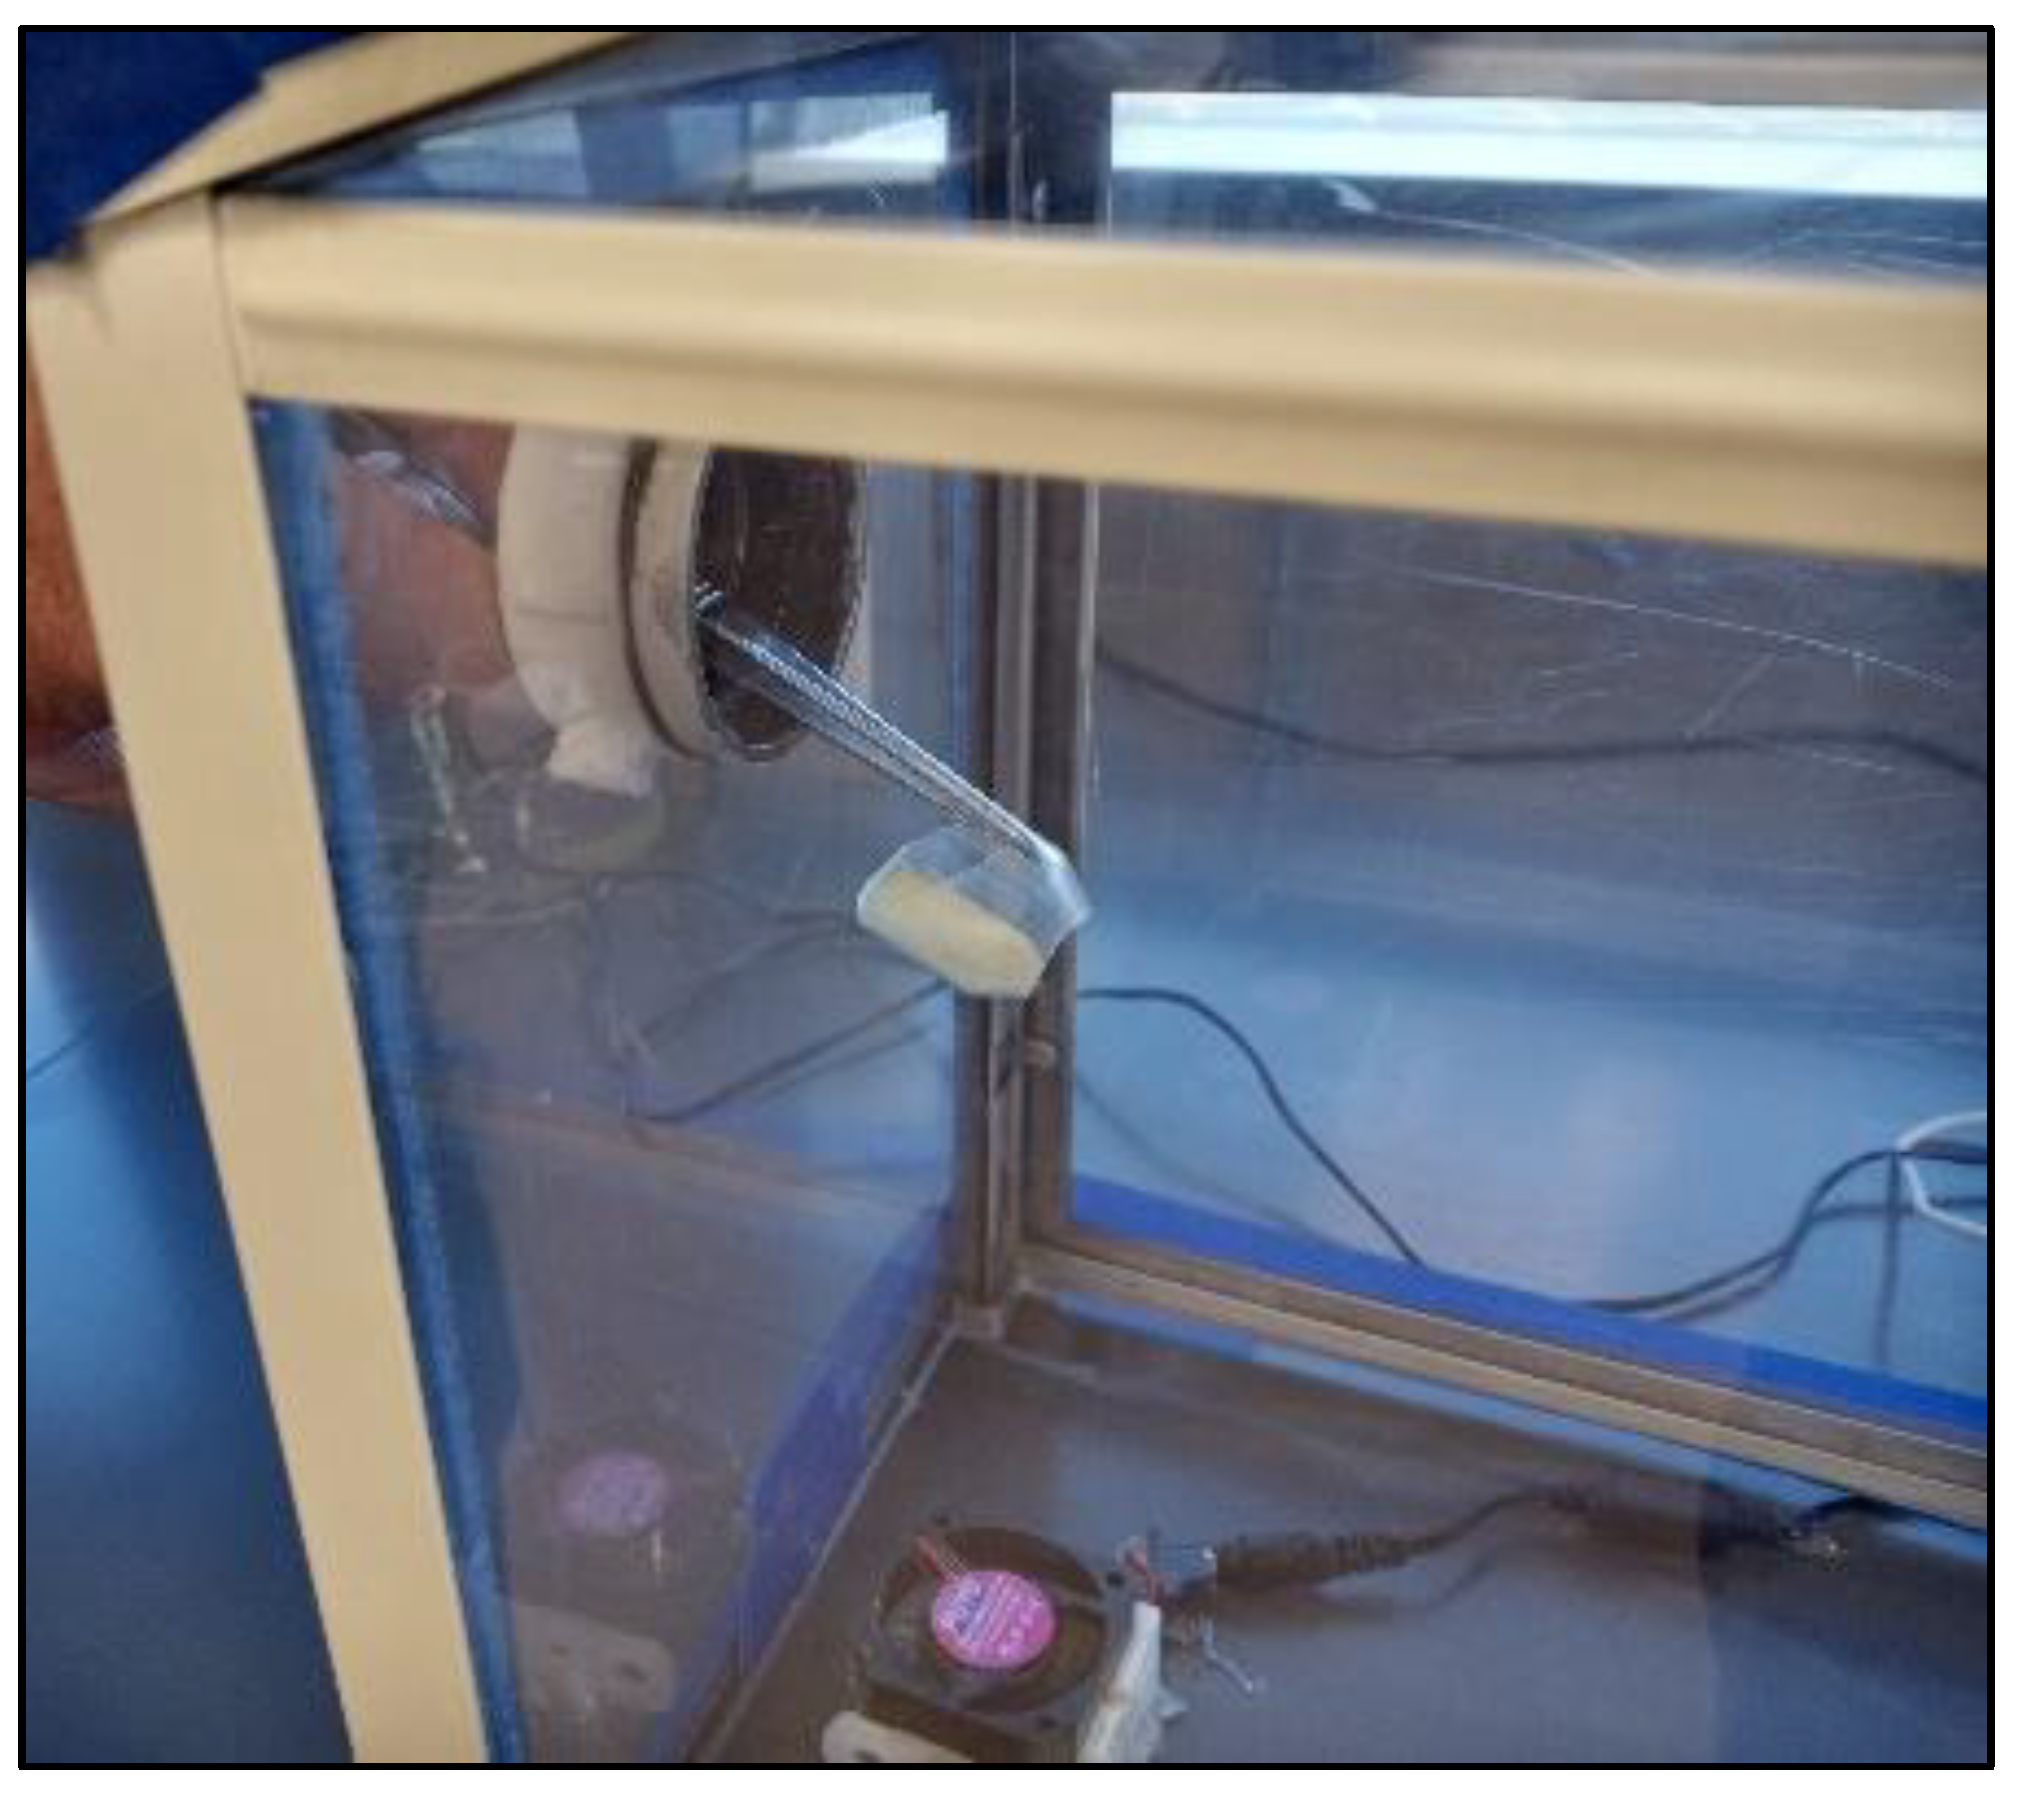
A Brushless DC fan (DC12V, 0.06A) controlled by an on/off switch was positioned inside the terrarium below the one-inch opening (
Figure 2). As shown in
Figure 2, a small plastic cup containing the weighed pollen sample was inserted into the terrarium opening, held in place with tweezers, and carefully agitated above the fan to evenly disperse the pollen into the terrarium.
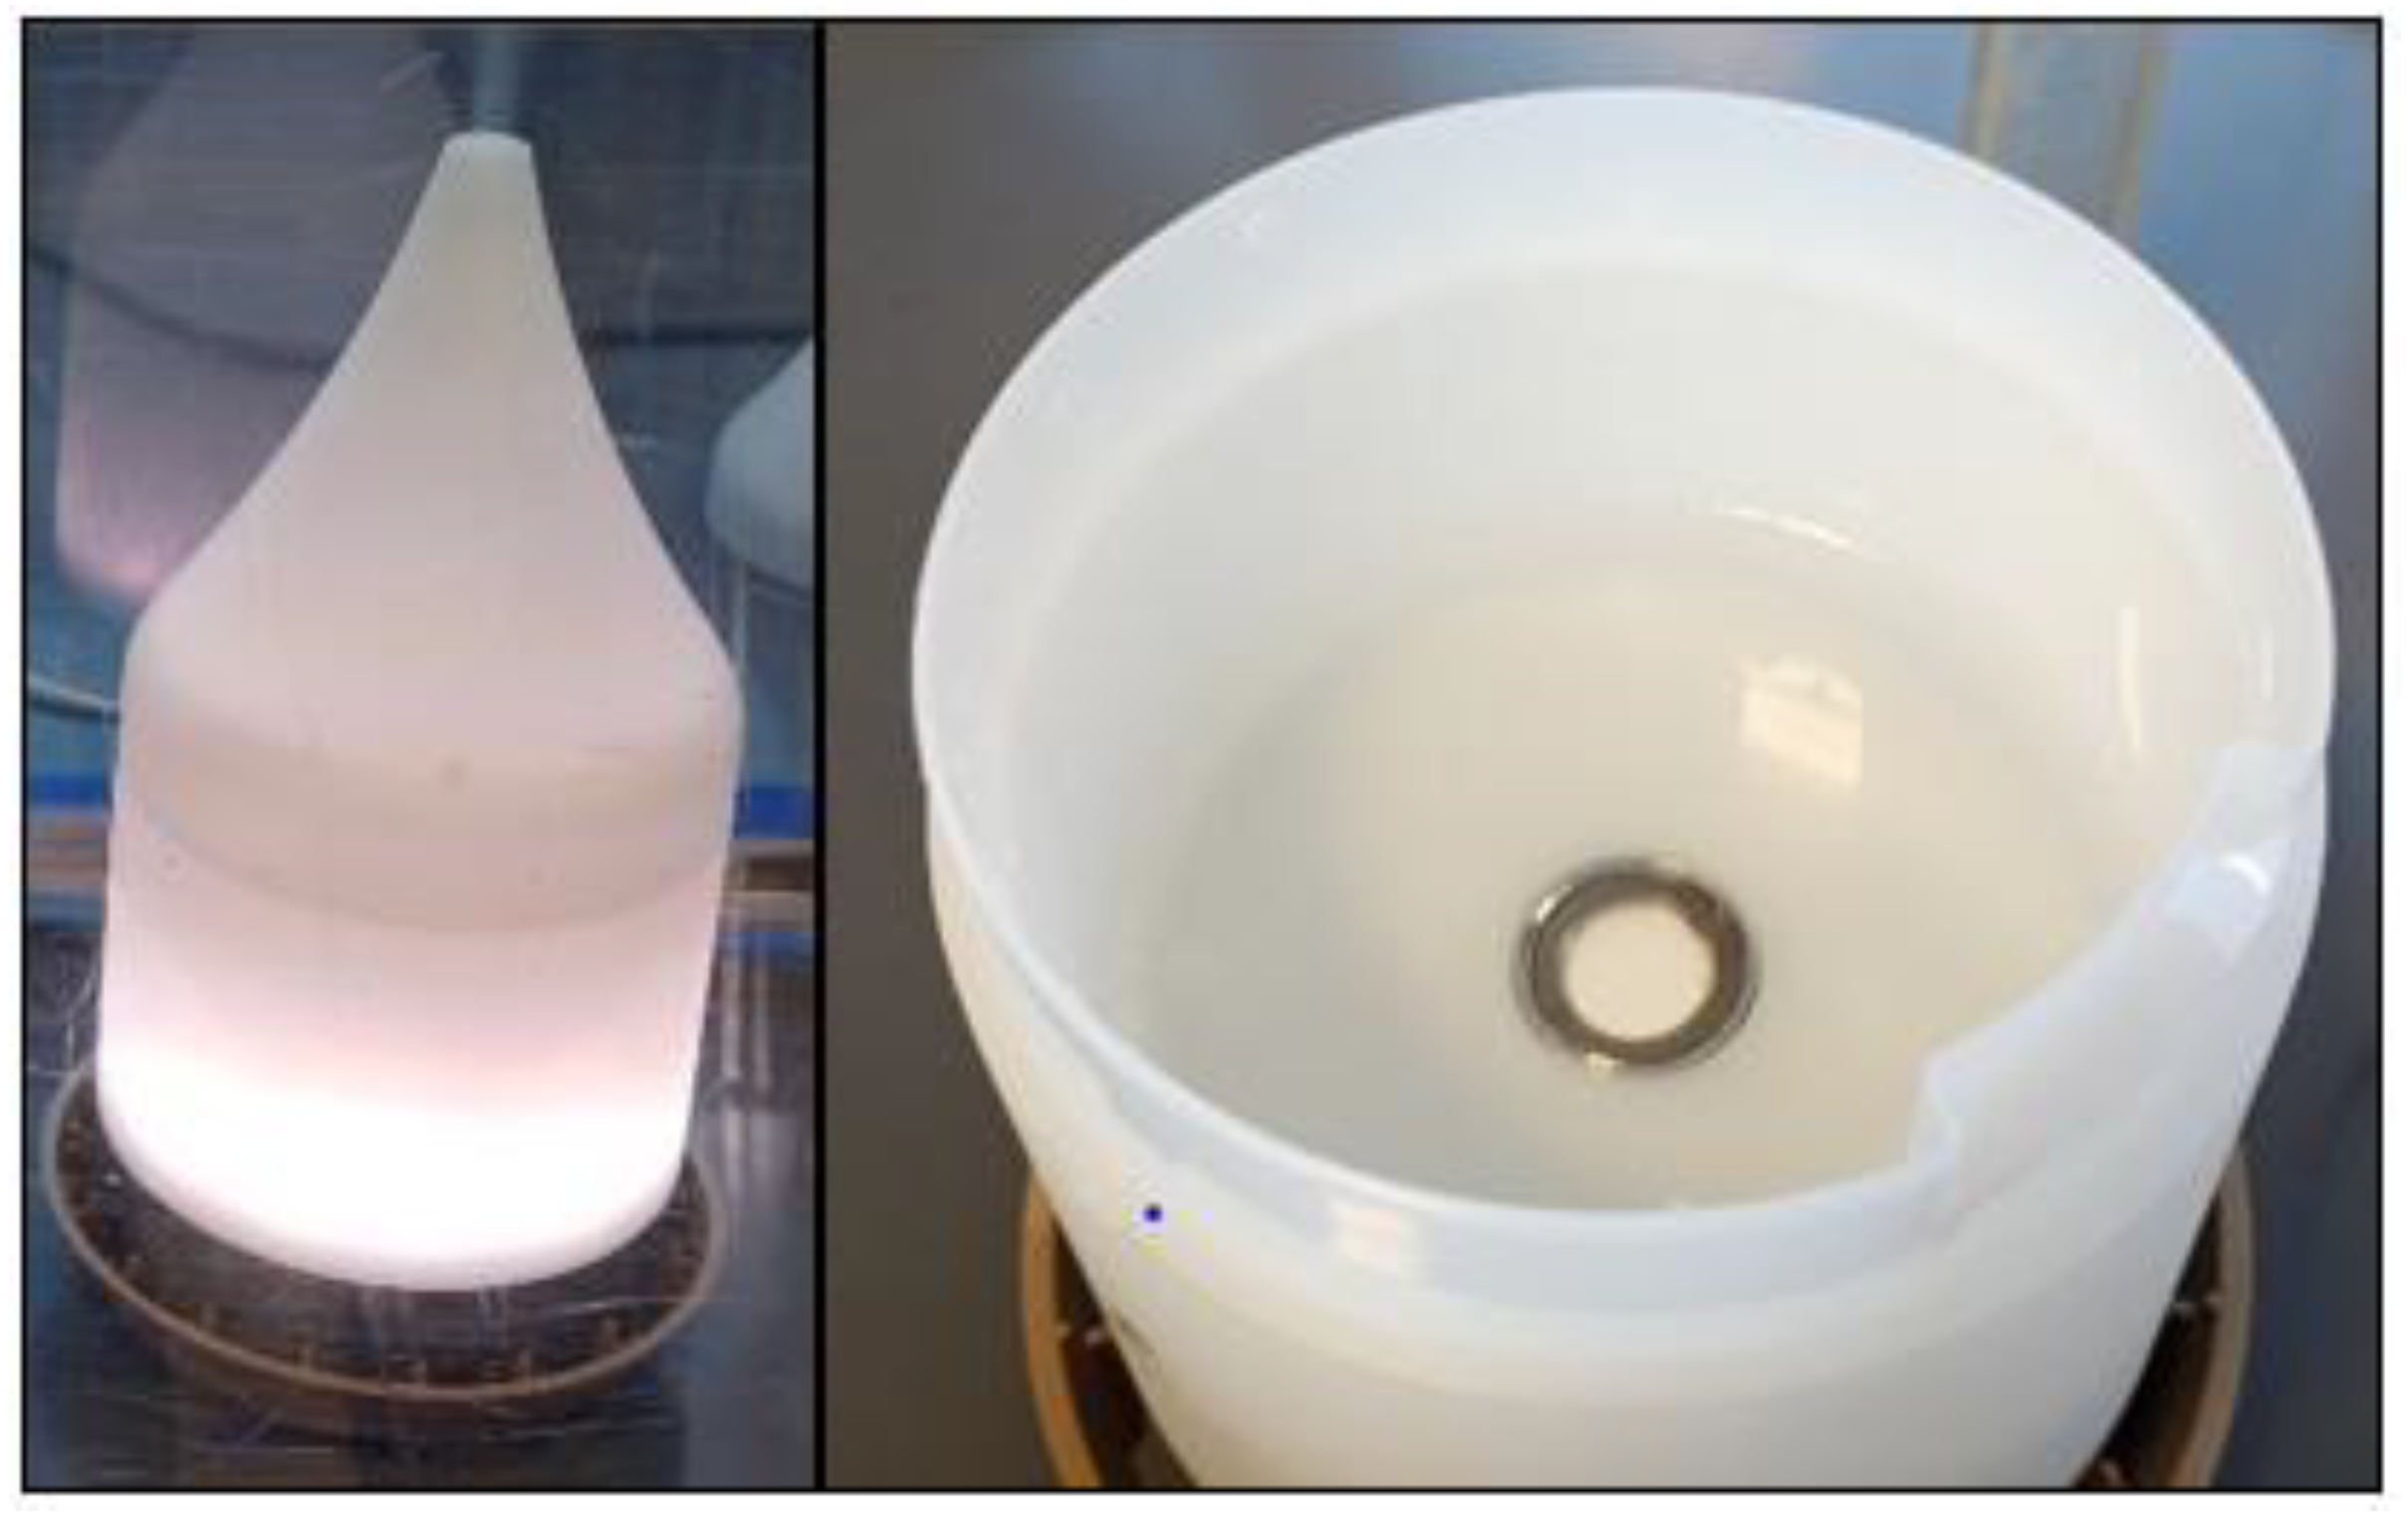
A Young Living ultrasonic type diffuser, model Desert Mist™, was placed into the terrarium (
Figure 3) and cycled on/off depending on the experimental protocol as described below. The Desert Mist™ diffuser has three run modes: high mode (runs for 5 h continuously), low mode (runs for 8 h continuously), and intermittent mode (1 min on/1 min off for 10 h). The diffuser was operated in high mode during all experiments. 100 mL of reverse osmosis water was accurately measured at the beginning of each experiment and added to the diffuser reservoir. For all experiments that required essential oils, ten drops were added to the diffuser reservoir after RO water was added.
Microscope slides coated with a dielectric silicone compound were used to collect the pollen grains that would fall to the terrarium floor. Three slides were positioned in the center of the terrarium between the fan and the diffuser for each experiment. At the conclusion of each test, the slides were removed and the pollen grains from three locations on each slide (left, center, right) were counted and recorded.
Three types of pollen were examined for suitability for this experiment: lodgepole pine,
Pinus contorta (Canadian Pine Pollen Co., North Vancouver, BC, Canada); pecan,
Carya illinoensis (Polysciences, Inc., Warrington, PA, USA); and ragweed,
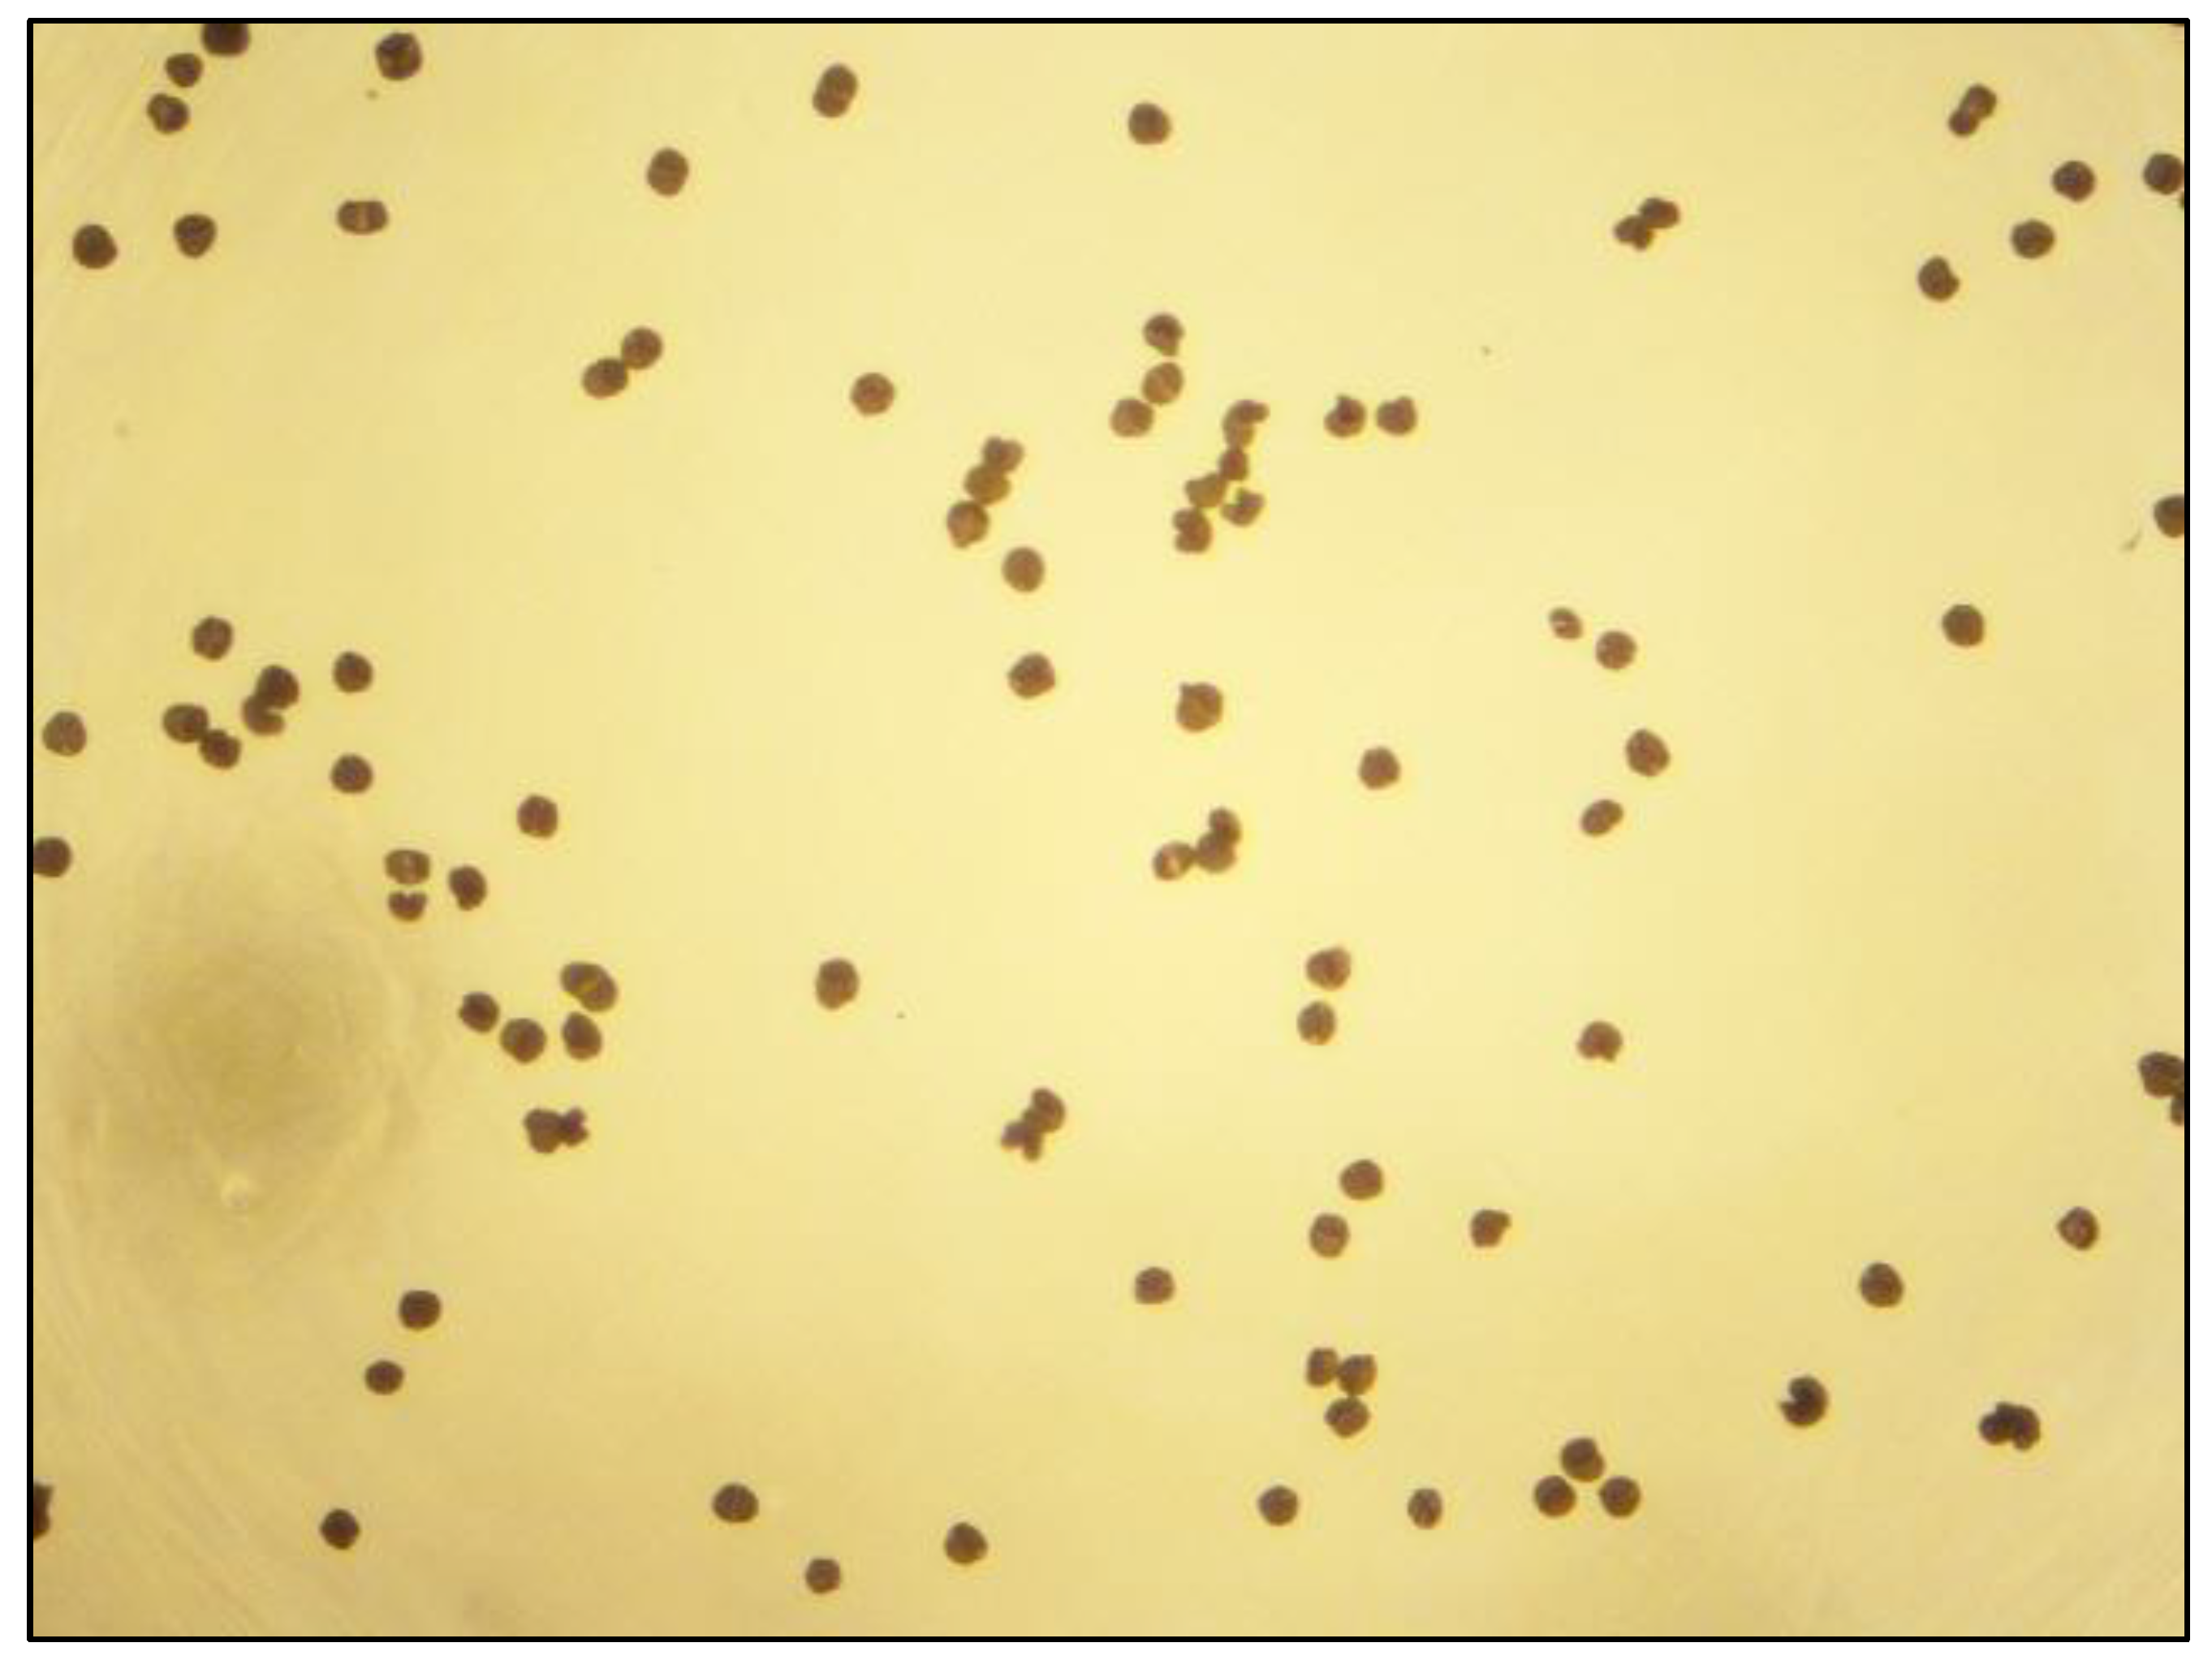
Ambrosia artemisiifolia (Polysciences, Inc., Warrington, PA, USA). These types of pollen were readily commercially available in the necessary quantities. Ragweed pollen is a common allergen, however it did not disperse evenly and clumped on slides, which prevented accurate and unbiased counts of deposited ragweed pollen, so we discontinued experimentation. Both lodgepole pine pollen and pecan pollen were chosen because their size made accurate counts possible and because of their even distribution in the terrarium and on the slides (
Figure 4). The pollen was weighed in the following amounts: 0.03 g, 0.05 g, 0.07 g, 0.09 g and 0.11 g. After the pollen was carefully released over the fan, the small plastic cup which had contained the pollen was weighed again to determine how much pollen was introduced into the terrarium. All tests were performed in triplicate.
Three different diffuser conditions were tested for each weight of pollen. First, pollen was introduced into the terrarium with the diffuser present but turned off. Second, pollen was introduced into the terrarium with a diffuser operating on high mode that contained 100 mL of RO water only. Finally, pollen was introduced into the terrarium with a diffuser operating on high mode and that contained 100 mL of RO water with ten drops added of one of the following Young Living essential oils: lavender, Thieves® (a blend of lemon, clove, cinnamon bark, eucalyptus radiata, and rosemary), Citrus Fresh™ (a blend of orange, grapefruit, mandarin, tangerine, lemon, and spearmint). These oils were chosen because of their popularity and because they are readily available to consumers.
During each experiment, the conditions of the terrarium environment were unchanged. All components were positioned in the same place for each test. The fan was used to make sure the air inside the terrarium was circulating when the pollen was introduced. For each test the fan was turned on for 2 min prior to pollen addition. For the tests using the diffuser, the fan and diffuser were turned on at the same time and left on for 2 min prior to adding pollen. Pollen was added at the two-minute mark and the fan and diffuser were left on for another 2 min. Afterwards, both the fan and the diffuser were turned off, and the slides containing the deposited pollen were removed and the pollen grains were counted. Each slide was examined under a 4× magnifying microscope (Nikon Eclipse E200, Minato City, Tokyo, Japan). Following each experiment, the interior of the terrarium was thoroughly cleaned with a vacuum. New slides were positioned. Fresh RO water and another 10 drops of essential oil, if the experiment required, were added to the diffuser.
The amount of pollen collected and counted on the slides after each experiment was compared and displayed in chart form. To remove irregular data points, the high and the low values from each experiment were removed before the averages were computed. The pollen count for those removed from the averages was recorded in red on top of the pollen picture and the pollen counts used in calculating the averages were recorded in black as shown in
Figure 5.
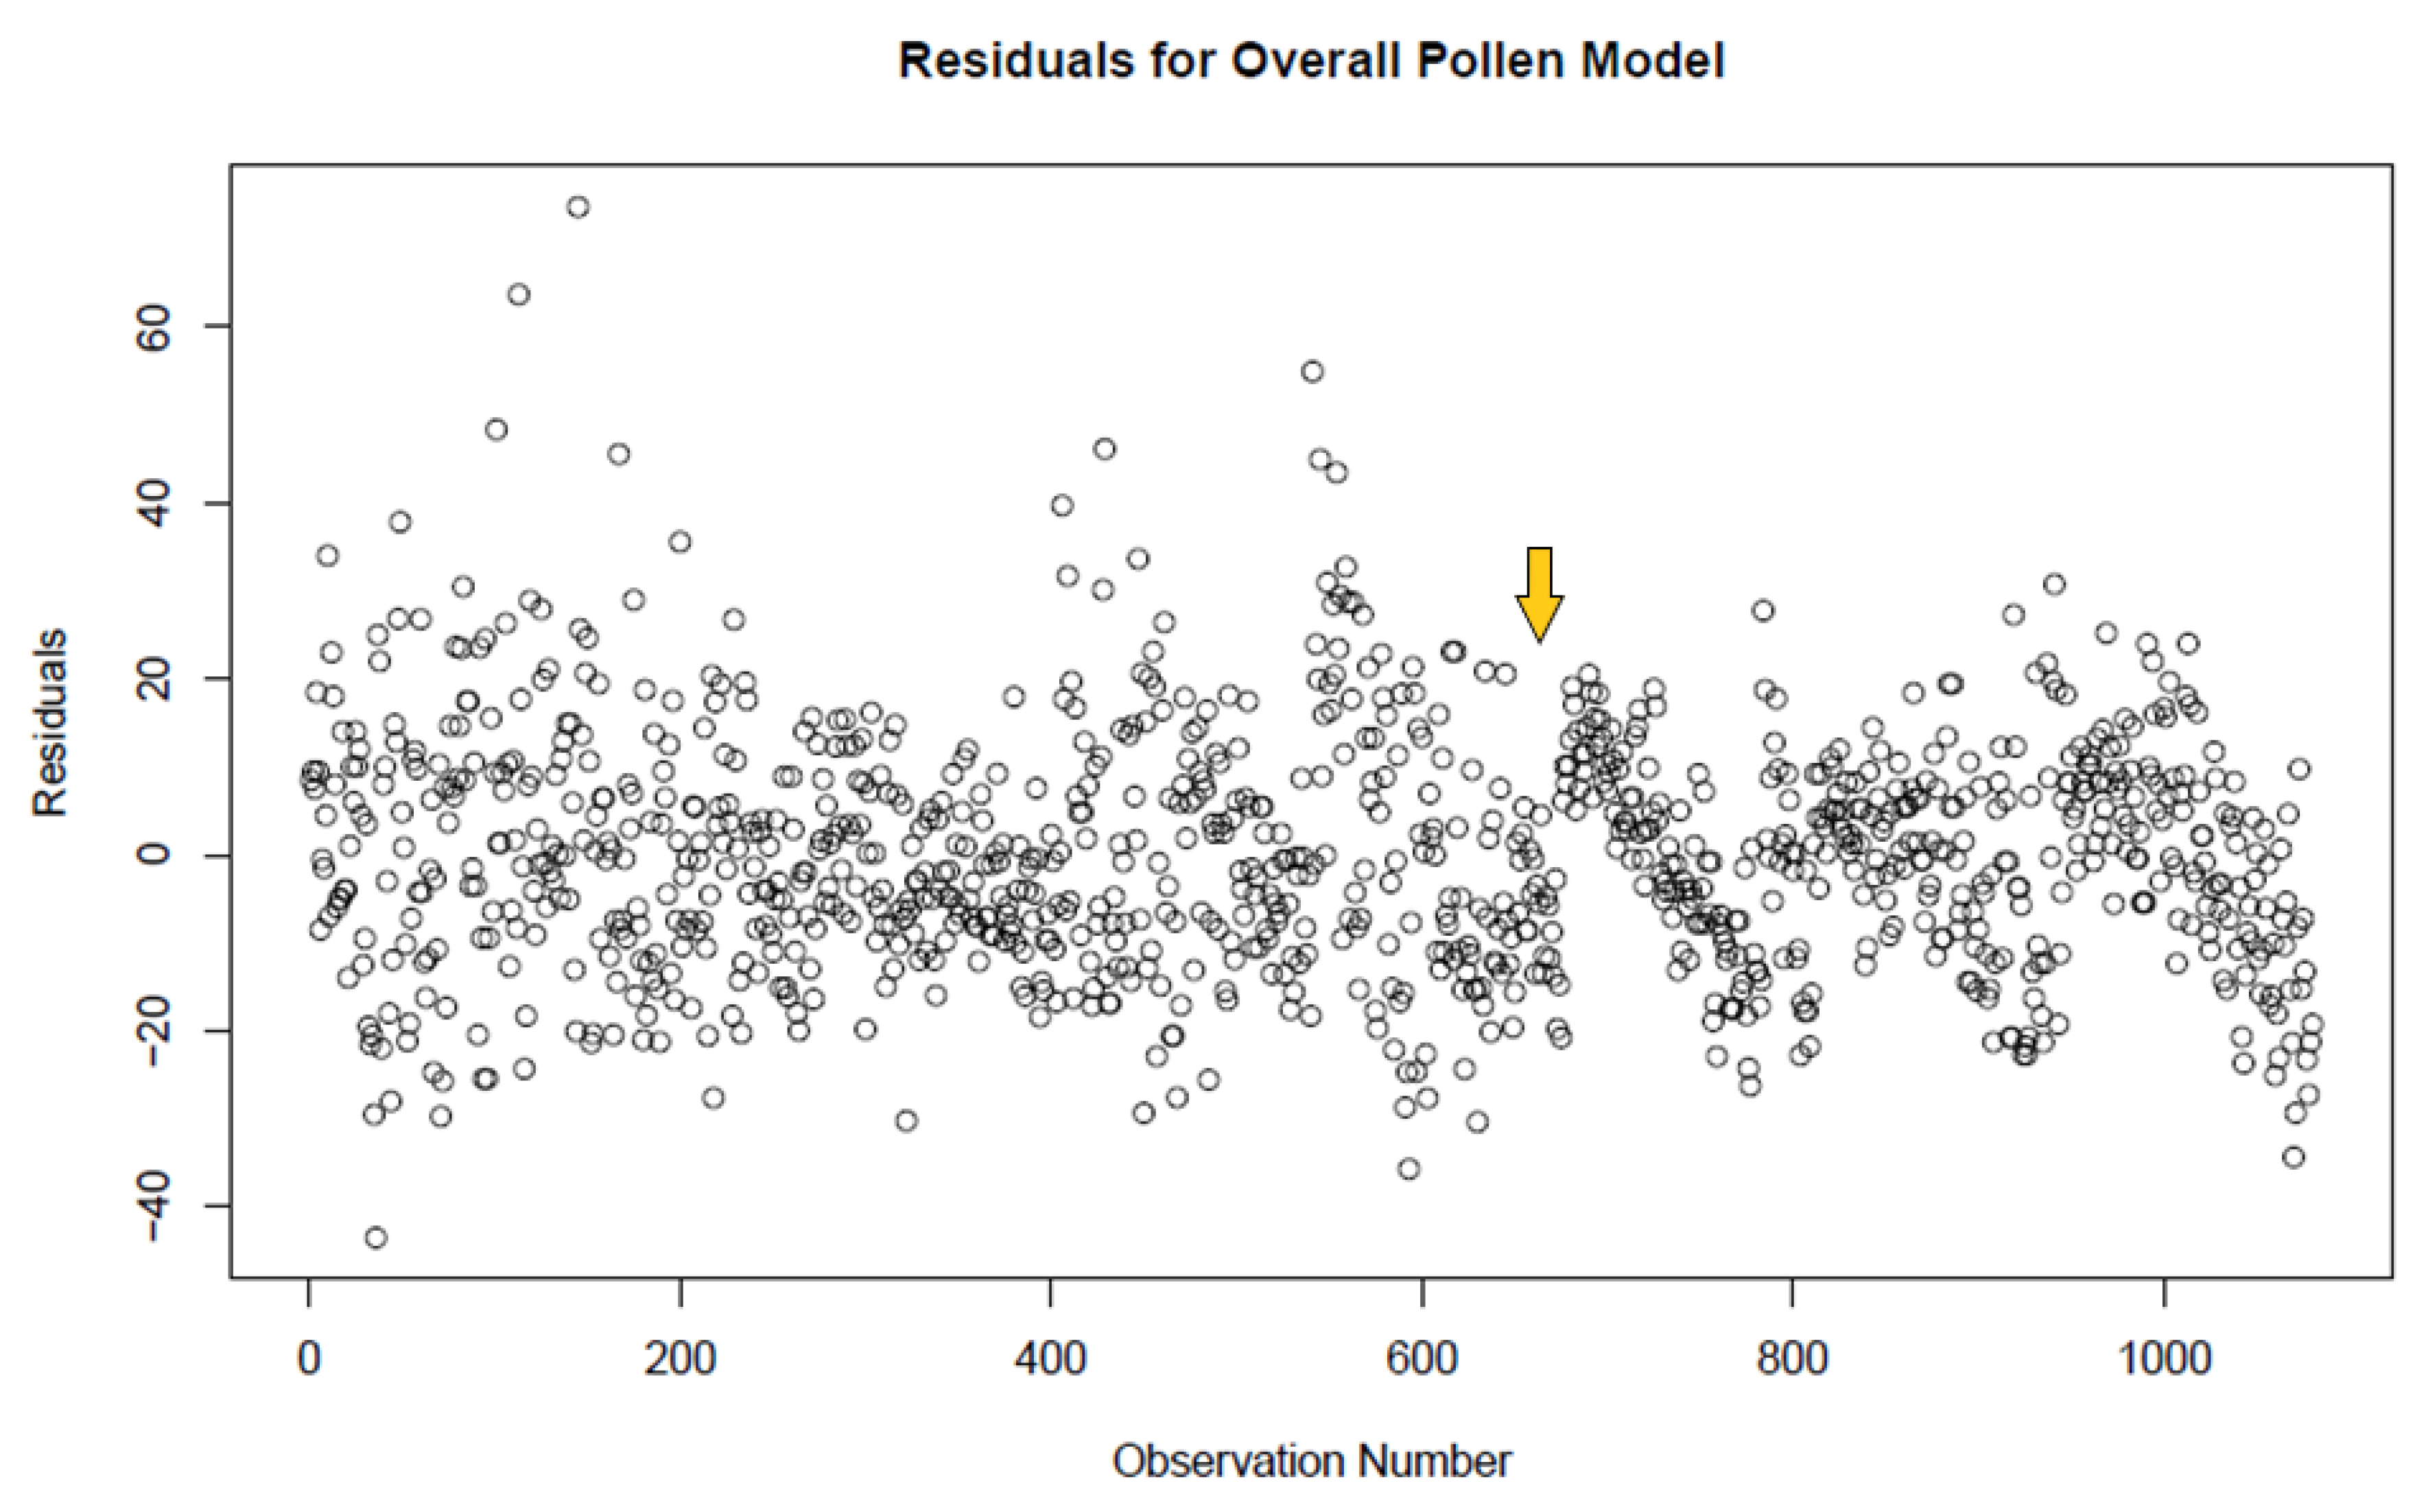
In total, 1080 samples were taken across the different pollen types and different diffuser conditions, with 135 slide counts recorded for each condition. To begin the statistical analysis of this data, an overall analysis of covariance was done where the response variable was the count of pollen grains on each slide. The factors for this study are the diffuser operating conditions (5 different levels) and the type of pollen. Average counts generally satisfy the assumptions of analysis of variance. The covariate for this analysis was the target pollen count. The interaction is between the type of pollen and the diffuser operating conditions. Note that since some of the operating conditions of the diffuser were not performed for the pecan pollen, some of the interaction terms could not be estimated. Subject to this constraint the model that was fit was the “saturated model” assuming no interaction between the covariate and the two factors. The residuals of this fit are plotted in
Figure 6. The F-statistic for each of these components of the analysis of covariance is given in
Table 1, showing each of these to be statistically significant.
This overall analysis identified two issues in proceeding to do further analyses. First, since there is a significant interaction between the diffuser and the pollen type, future analyses must be based on comparing the individual cell means. Second, the plot of residuals shows no pattern before observation 676. However, as seen in
Figure 6, from observation 676 on, the residuals show a repeating downward pattern. This pattern corresponds to the change in the experiment from the lodgepole pine pollen to the pecan pollen. The combination of these two issues suggests that the analyses measurement error in not warranted because of the large number of counts for each arm (lodgepole pine vs. pecan) is sufficient to suggest a direction for this pilot study.
For the individual analyses of lodgepole pine and pecan pollen, the analysis of covariance was performed with the diffuser operating conditions as the single factor and the target amount of pollen as the covariate. In these analyses the overall mean effect at levels of diffuser conditions were compared using the standard t-test where the standard error was obtained from the overall analysis of covariance estimated variance.
3. Results
Total pollen counts for all pollen types under all experimental conditions can be found in
Supplemental Table S1. To begin our analysis, we first compared all data points from all testing conditions to look at the residuals for fit of the overall model. A repeating downward pattern emerged after data point 676 (
Figure 6). This is the point at which the experiment shifted from testing pine pollen to testing pecan pollen, indicating that the behavior of the experiment at different target levels of pollen was different for pecan pollen than it was for pine pollen. Therefore, we separated the data according to pollen type for further analysis.
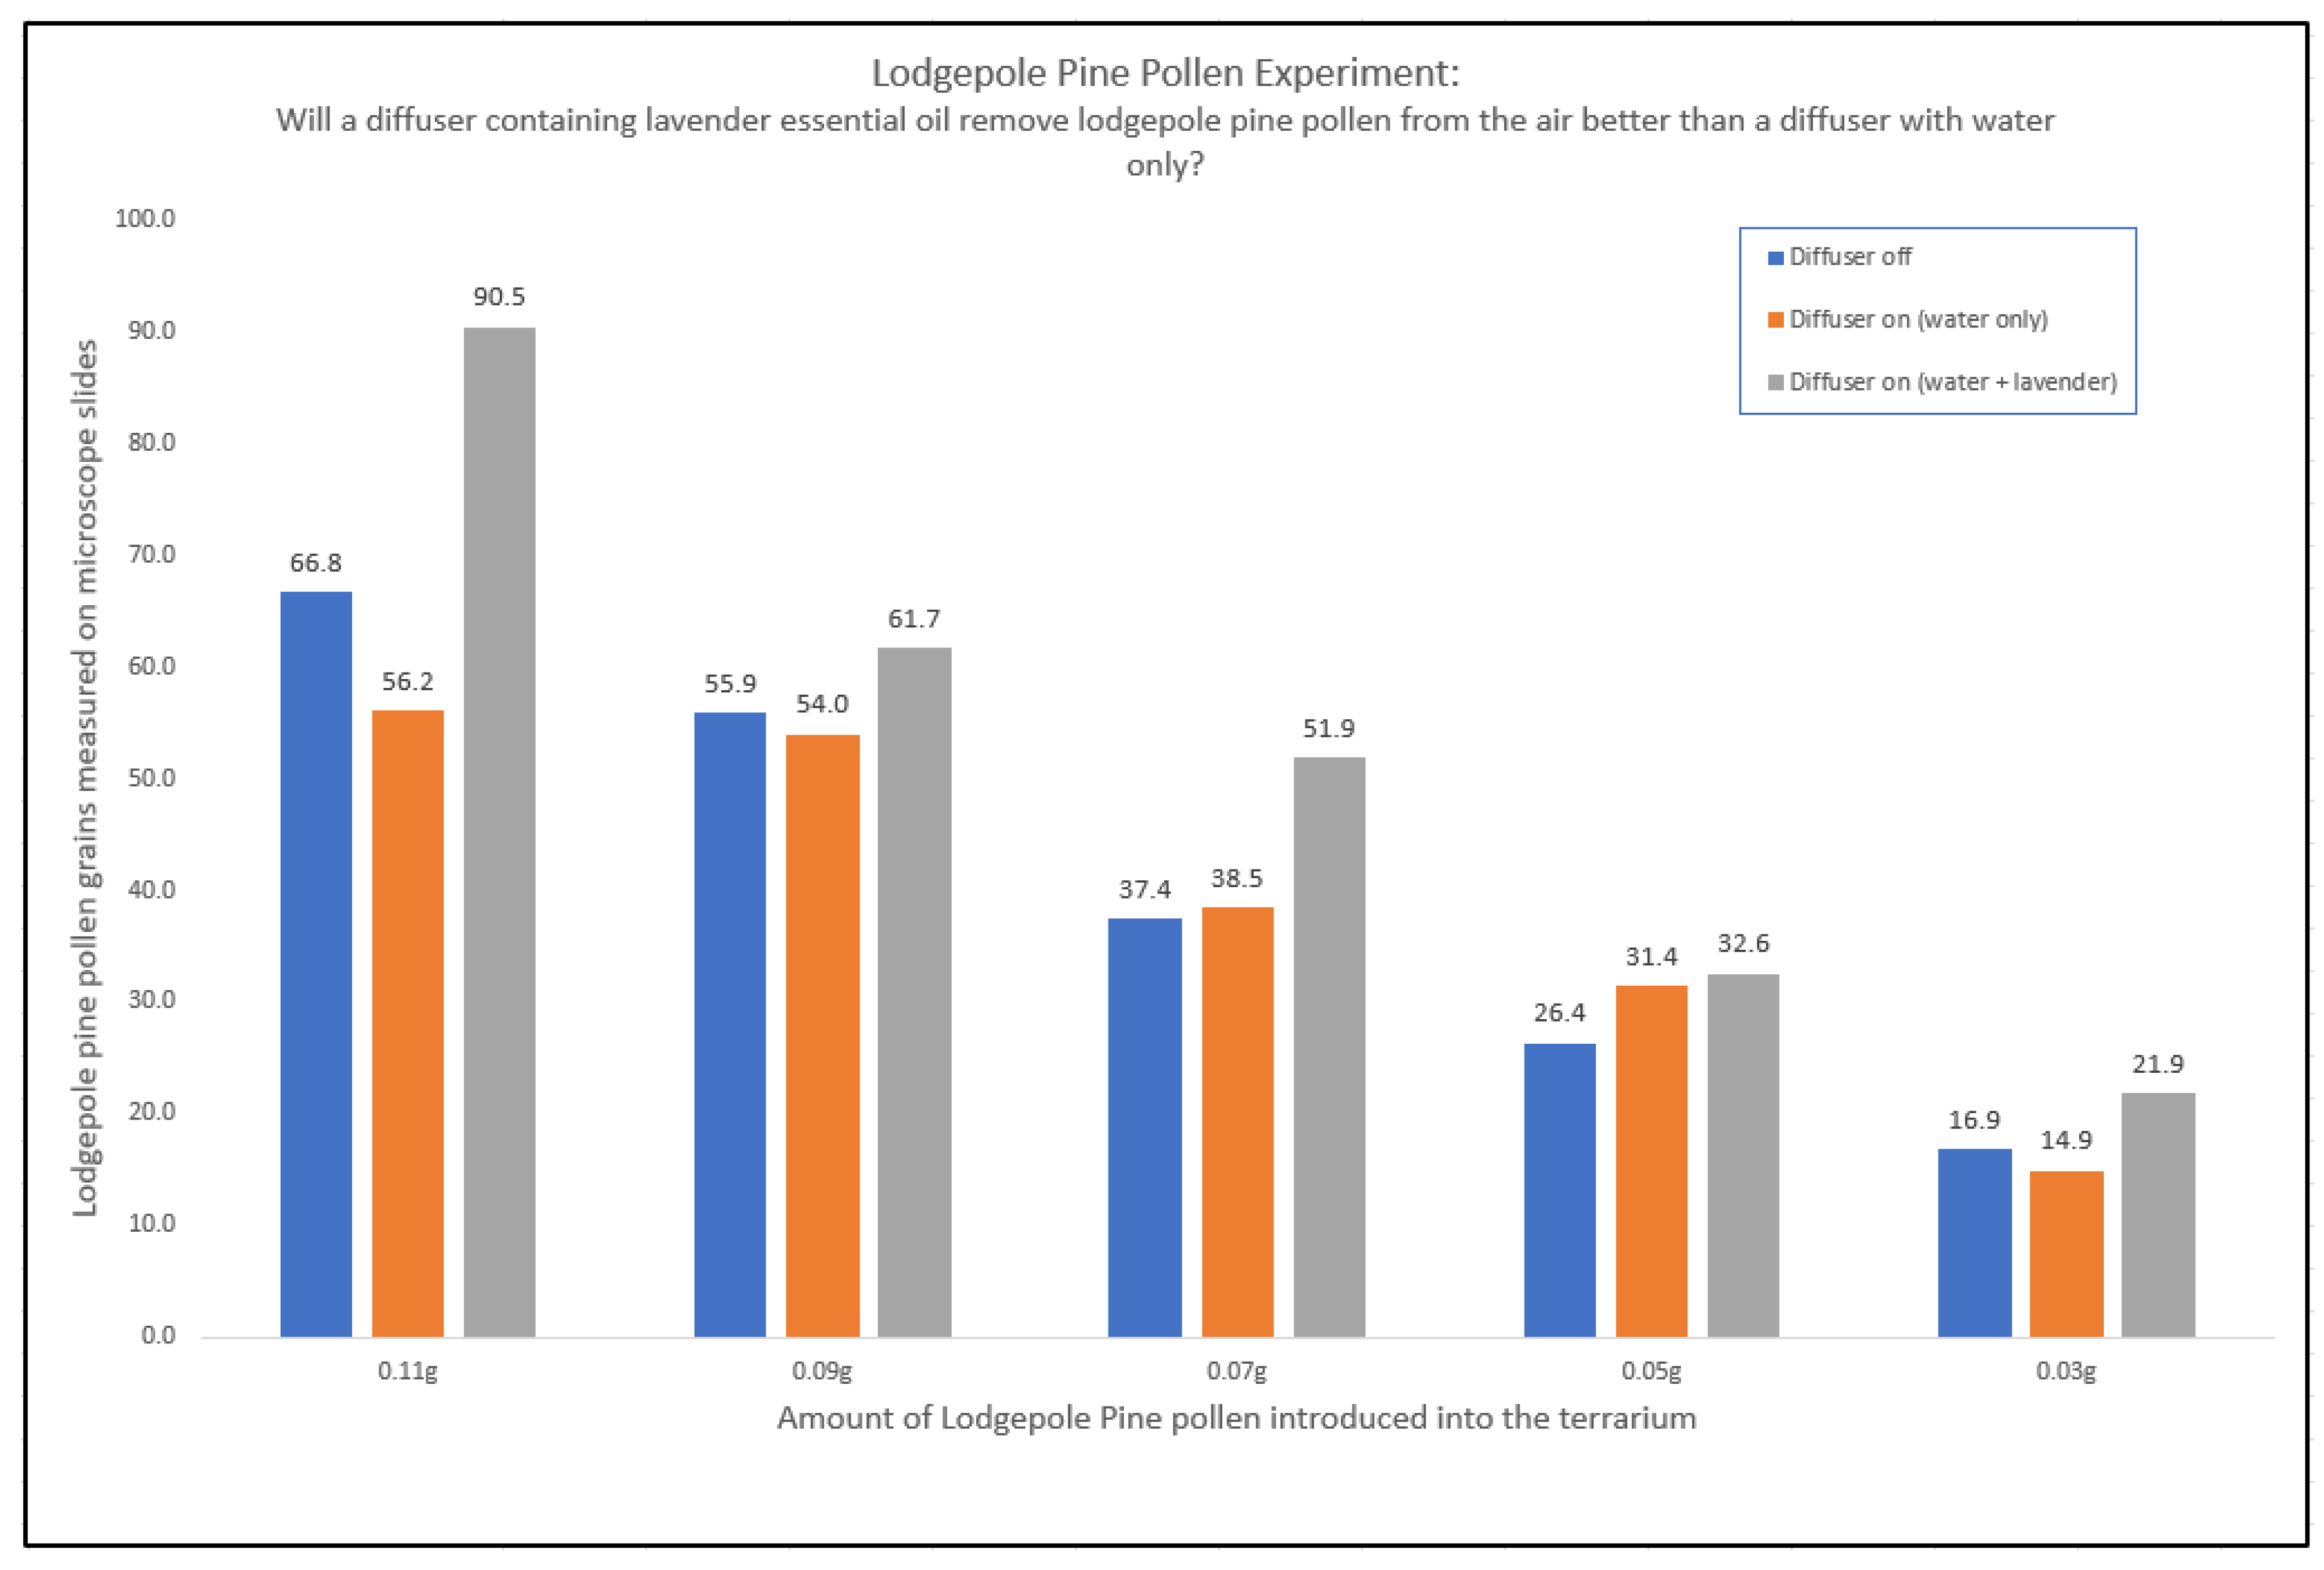
First, we looked at lodgepole pine pollen. The distribution of lodgepole pine pollen in a closed environment was affected by the presence of a diffuser containing lavender essential oil (
Figure 7). The difference between diffuser off and a diffuser running with RO water only was small. In most cases, except for the 0.5 g pollen, adding lavender essential oil to the diffuser led to a distinct increase in the amount of pollen found on the slides, which indicates that lavender essential oil had an effect on reducing the amount of pollen in the air. Similar results were seen when this was repeated with the blends Citrus Fresh™ and Thieves
® (
Figure 8).
Across all experiments, the amount of pollen introduced into the terrarium had no effect on how much pollen was found on the slides, other than the predictable linear effect, which can be seen in
Figure 7. The average pollen counts of lodgepole pine pollen for each test condition are given in
Table 2, and includes the variation caused by the different target levels of pollen introduced to the environment.
Comparing all collected data for the differing amounts of pollen added and the five main test conditions, it is clear that each essential oil has some effect on reducing airborne pollen, evidenced by the increasing number of pollen grains on the slides (
Figure 8).
Next, an analysis of covariance was performed to confirm statistical significance. Since adding the different target levels of pollen had no effect other than a linear one on the amount of pollen collected on slides, this analysis removed the effects of the five different target pollen levels in order to show that there is still a significant difference between the different experimental conditions. These results can be found in
Table 3.
Note that in
Table 3 the different diffuser and essential oil estimates are estimates of the difference between the particular diffuser status and the Citrus Fresh™ results. In other words, the −8.8683 value for “Diffuser on (water only)” represents an average count of 8.8683 counts of pollen per plate less when the diffuser is on with no essential oil, relative to the count for “Diffuser on (water + Citrus Fresh™). The p-value for this measurement is also very low, indicating that the “Diffuser on (water only)” results in statistically lower counts than Citrus Fresh™. Note that the lavender value 3.6394 is marginally higher than Citrus Fresh™ (p-value of 0.0344) whereas Thieves
® has essentially the same value as Citrus Fresh™. The three essential oils show a statistically significant higher pollen count on the plates than either the “Diffuser on (water only)” or the “Diffuser off” status. Lavender is slightly higher than either the Citrus Fresh™ or the Thieves
® conditions. There is no statistical evidence that having the “diffuser on (water only)” is better than “diffuser off.”
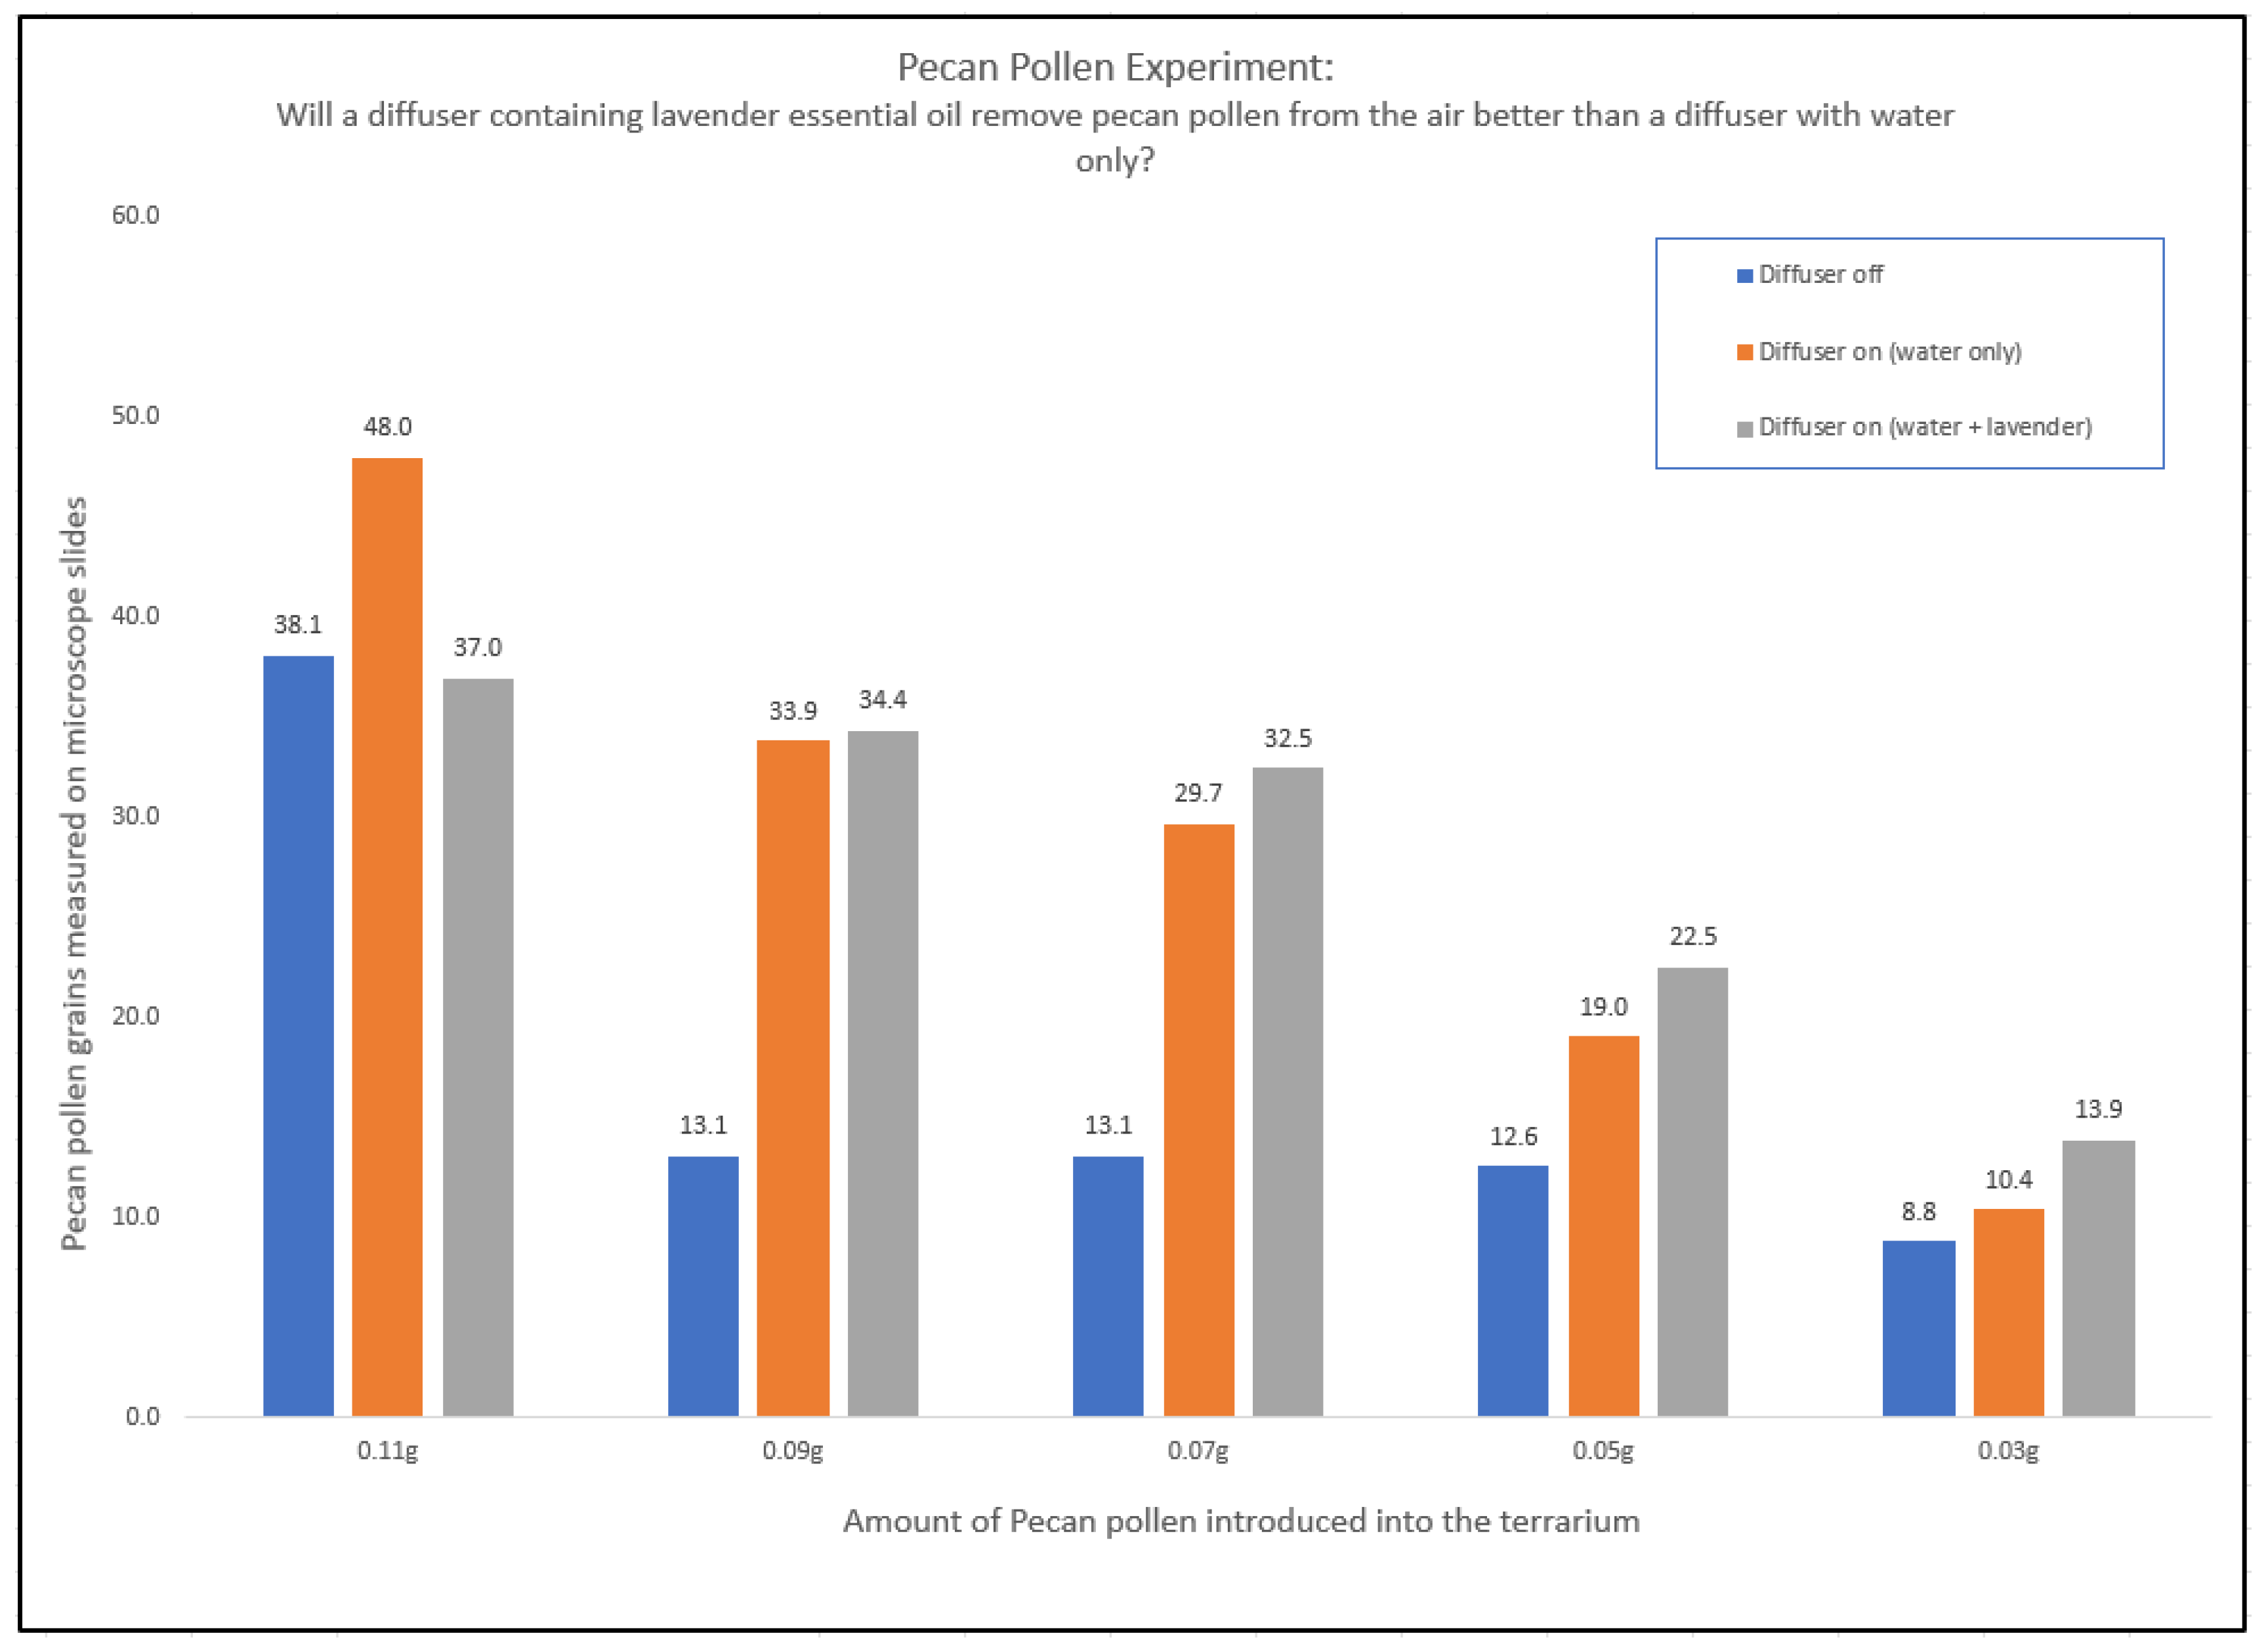
Pecan pollen results were somewhat different than lodgepole pine pollen. With pecan pollen, only three conditions were tested: diffuser off, diffuser on (water only), and diffuser on (water + lavender). Citrus Fresh™ and Thieves
® were not tested with pecan pollen primarily since they did not perform quite as well as lavender in the previous experiment. Mean pollen counts can be found in
Table 4 and full results are in
Figure 9.
Interestingly, there was a larger difference between the amount of pollen found on the slides comparing the terrarium with the diffuser off versus the diffuser on, but the difference between a diffuser with water only and a diffuser with lavender essential oil did not show a large difference, except for the largest and smallest amounts of pollen added (0.11 g and 0.03 g).
There is a linear trend for the environment with the diffuser and the diffuser plus lavender essential oil in this data set as well, but not for the terrarium with the diffuser off. Oddly, these pollen counts were very consistent except for the 0.11 g tests.
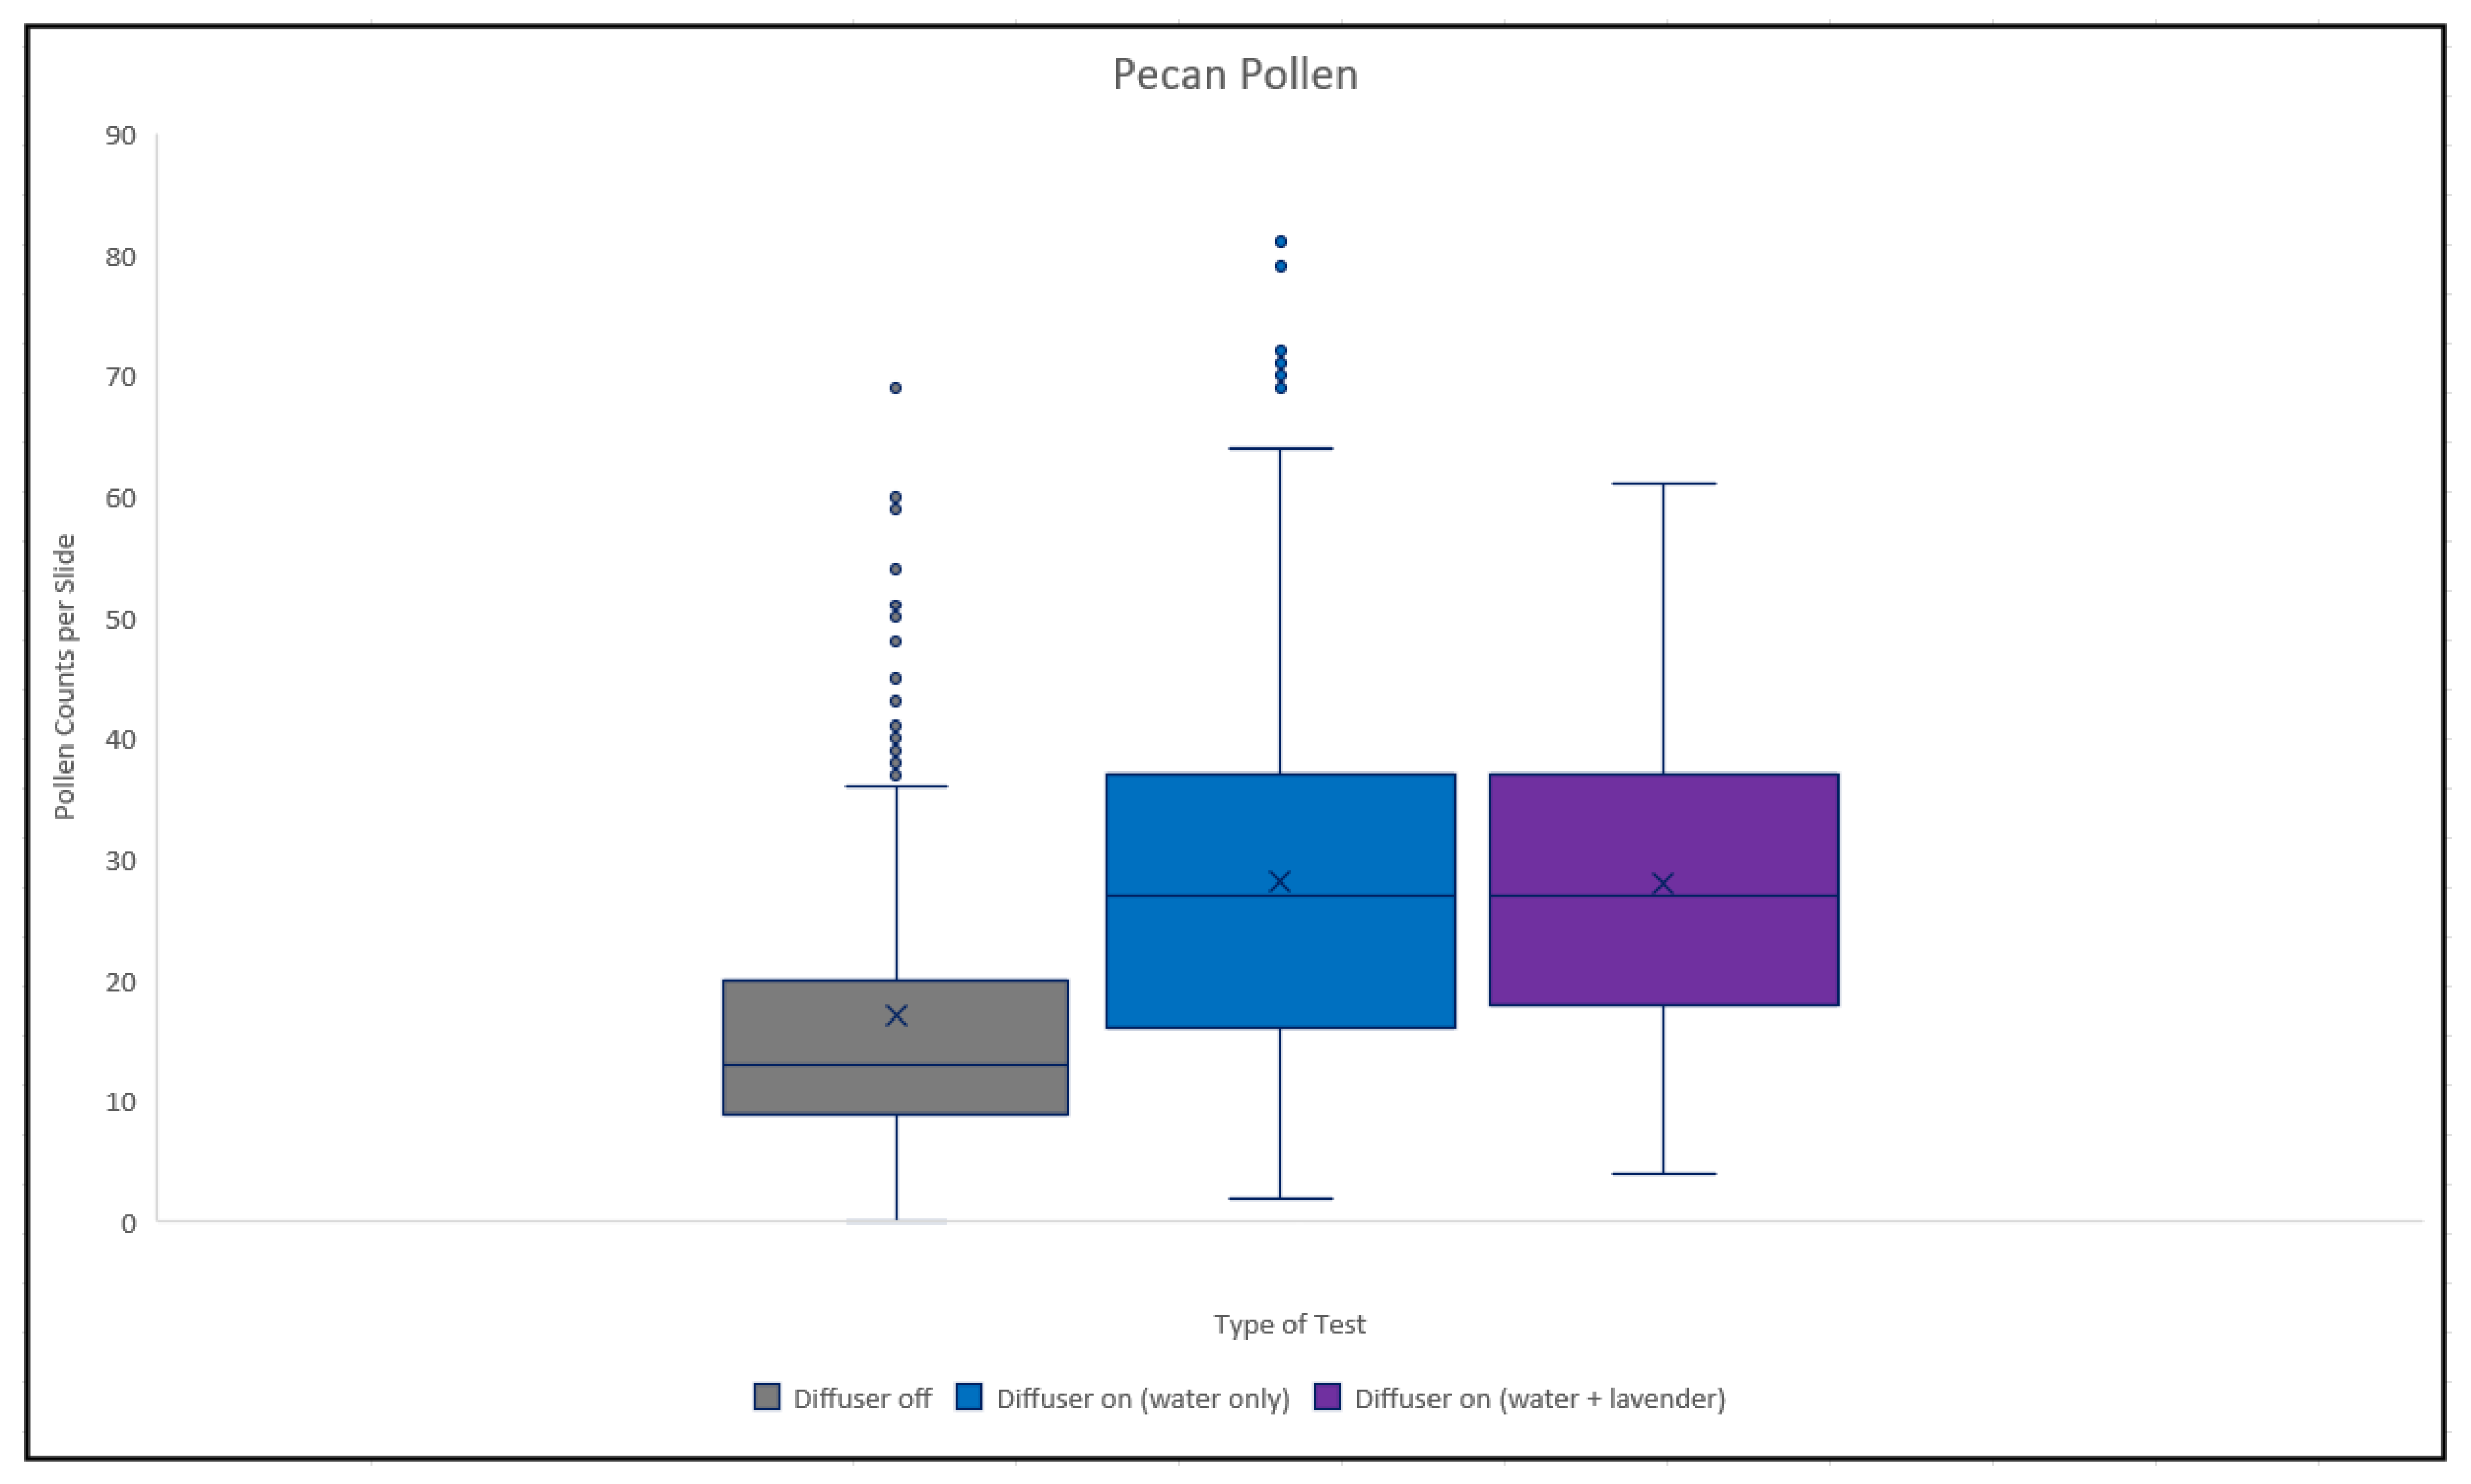
In
Figure 10 we see that there is no difference between the diffuser being on with or without the lavender essential oil. However, both seem to result in considerably more pollen on the slides than the “diffuser off” condition.
To confirm this statistically and to remove any biasing effects induced by the different amounts of target pollen to be released an analysis of covariance was performed. See results in
Table 5.
In this analysis the parameter estimates are the observed difference in the counts relative to the diffuser on (but no essential oil). From this we reach the conclusion that for pecan pollen the “diffuser on” has the same effect regardless of whether lavender is added. However, both have statistically significantly higher counts than the “diffuser off” condition.
4. Discussion
Experimentation showed that different types of pollen interacted differently with an ultrasonic diffuser and essential oils in a closed environment. When lodgepole pine pollen was introduced, the amount of pollen measured on microscope slides was proportional to the amount of pollen introduced to the environment, while the amount of pecan pollen grains measured was more consistent regardless of the amount of pollen introduced, particularly for the “diffuser off” condition.
For lodgepole pine pollen, there was not a significant difference between “diffuser off” and “diffuser on (water only)” on the measured amount of pollen grains on the slides. However, adding lavender, Citrus Fresh™, or Thieves® essential oil to the diffuser had a statistically significant increase in the amount of pollen measured on the slides, indicating that there was less pollen in the air under these conditions. Lavender essential oil had the largest effect.
When testing pecan pollen, we found a statistically significant difference between “diffuser off” and “diffuser on (water only)” on the amount of pollen measured on the slides, and little difference was seen when lavender essential oil was added to the diffuser. This indicates that the presence of water vapor by simply having the diffuser operational reduced airborne pecan pollen under these conditions. Only lavender essential oil was tested against pecan pollen.
It was interesting to see so many differences depending on pollen type and under different experimental conditions. Lodgepole pine and pecan pollen grains are of a similar size (about 50μmdiameter), so this does not seem a likely influence. Pollen shape could be a factor, as when viewed under a microscope, lodgepole pine pollen grains appear more oblong with a slight longitudinal indentation down the center and pecan pollen grains appear spherical.
Previous research has shown a relationship between high humidity (60–70%) and lower quantity of airborne pollen [
20]. Floating Japanese cedar pollen was found in significantly greater amounts on a day with low humidity compared to a day with high humidity [
18]. Our pecan results support this, as there was a significant difference between “diffuser off” and “diffuser on (water only)” but no significant difference when lavender essential oil was added, indicating that humidity could be the primary reason for these results. However, curiously, our results for lodgepole pine pollen seem to contradict this, since a significant difference was only seen when essential oils were added to the water in the diffuser. This is somewhat similar to results seen in a study in India, where some indoor worksites showed a negative correlation with indoor pollen and humidity, while other worksites did not [
19].
As a preliminary experimental study, these data indicate that there is a statistically significant positive reduction in airborne pollen when an ultrasonic diffuser is used in a closed, controlled environment. These results have raised many questions to pursue in future studies. Future research plans involve scaling up from a small terrarium to a full room, as well as examining different essential oils for their interaction with multiple types and shapes of pollen, particularly grasses, to learn more about the potential of diffusing essential oils to help alleviate the effects of seasonal allergies.


