Article

A Fuzzy Inference System for Detection of Positive Displacement Motor (PDM) Stalls during Coiled Tubing Operations

by
Rafael Augusto Galo Fernandes
1,*,
Paloma Maria Silva Rocha Rizol
1,
Andreas Nascimento
2 and
José Alexandre Matelli
3
1
Electrical Engineering Department, São Paulo State University, São Paulo 01049-010, Brazil
2
Institute of Mechanical Engineering, Federal University of Itajubá, Itajubá 37500-903, Brazil
3
Mechanical Engineering Department, São Paulo State University, São Paulo 01049-010, Brazil
*
Author to whom correspondence should be addressed.
Appl. Sci. 2022, 12(19), 9883; https://doi.org/10.3390/app12199883
Submission received: 2 September 2022 / Revised: 22 September 2022 / Accepted: 27 September 2022 / Published: 30 September 2022
(This article belongs to the Topic Artificial Intelligence and Fuzzy Systems)

Abstract

:
Positive Displacement Motors (PDM) are extensively used in the oilfield, either in drilling or in coiled tubing (CT) operations. They provide a higher rate of penetration and the possibility of drilling horizontal wells. For coiled tubing operations, PDMs can mill through obstructions and enable shut-in wells to work again. One of the major challenges while using these tools is the motor stalling, which can lead to serious damage to the PDM and lost time events in drilling and workover rigs. These events result in total losses of hundreds of thousands of dollars, and their avoidance mostly depends on trained and fully aware equipment operators. If a PDM starts to stall, the pumping needs to be halted immediately or the tool may fail. This paper describes the use of a Fuzzy Inference System (FIS) to detect the stalling events as they start to happen using the acquisition data from the coiled tubing unit, the output of the FIS could then trigger an alarm for the operator to take the proper action or remotely stop the pump. The FIS was implemented in Python and tested with real CT milling acquisition data. When tested using real data, the system analyzed 68,458 acquisition points and detected 94% of the stalling events across this data during its first seconds, whereas, during the real job, a CT operator could take longer to notice this event and take the proper action, or even take no action. If the FIS was applied on a real coiled tubing acquisition system, it could reduce PDMs over-pressurization due to stalling, leading to an increase on its useful life and decrease on premature failure. As of now there is no similar system in the market or published and this kind of operation is fully performed using human supervision only.

1. Introduction

Positive Displacement Motors (PDM) are extensively used in the oilfield to drill the formation towards the reservoir or to mill through any other restriction down hole. They have been developed in the 1940s and commercialized in the 1950s [1]. PDMs (also called mud motors in drilling applications) are being used in drilling complex formation to improve the rate of penetration (ROP). In this type of rotation drilling, PDM converts the energy mud flow to mechanical energy (Figure 1). On the slide drilling, PDM is responsible to generate bit rotation when drilling fluid is pumped. The performance of PDM can be controlled by the rotor/stator lobe configuration, rotary speed, and torque [2]. Drilling with positive displacement motors dominates oilfield drilling operations due to its operational and economic advantages over conventional rotary drilling [3].
PDMs are also very important in the coiled tubing (CT) industry, where they are mostly used to mill isolation plugs after hydraulic fracturing operations, which are common in shale gas environments, being one of the crucial parts of the Bottom Hole Assembly (BHA). “It is estimated that between 100,000 to 140,000 composite plugs are installed and milled each year in the US alone. Efficient removal of these composite plugs is critical in achieving operational efficiencies for both the operator and service suppliers” [4].
In the PDM, the rotor has one lobe less than the stator, which leaves a gap where the fluid circulates and as the rotor fluid forces the rotor for the next free lobe in the stator. The resulting rotation generates torque to drive the drill bit.
PDMs are prone to failure, particularly due to stalling and the overpressure that this event produces. As more stalls are accumulated over time, this interruption to drilling can amount to significant losses of productive drilling time [5]. A damaged motor downhole can lead to a loss up to hundreds of thousands of dollars in an offshore drilling rig. Stalling can also leave big cuts of the material being milled inside the wellbore, which are harder to circulate back to surface due to their size and shape, leading to an improper wellbore cleanout and finally to a stuck pipe situation. “Applying too much weight to the bit/mill increases the risk of stalling the motor. Stalls lead to a reduction in motor run life, increased coiled tubing fatigue, inefficient operation, and significant increase in the risk of leaving large chunks of composite material. These large composite chunks considerably increase the risk of the BHA becoming stuck in the well, and the risk that the chunks will block flowback equipment” [4]. Because water or mud contain very little compressive fluids, the pressure can raise too quickly, so a distracted operator does not have time to react and stop the operation.
Avoiding or minimizing the time the PDM stalls during a milling operation is one of the main duties of the equipment operator during the job. However, this same operator is prone to the following human errors [6,7]: perceptual errors, when the operator does not notice the data from the sensors are abnormal; skill-based errors, when even after noticing the parameters are off, he or she cannot assess the situation based on this data; and decision errors, where the operator acknowledges the situation, however does not carry on with the proper action to address the problem. In an effort to minimize those errors and their detrimental effect, this work studies the use of Artificial Intelligence (AI) on the data available during the milling job with PDM as procedure decision-taking and operational troubleshooting are some of the application areas for AI in the oilfield and drilling industry being discussed in the literature [8], and equipping the personnel with intelligent systems that improve the decision-making process can avoid the human-induced errors [9].
Consequently, means of helping the operator to detect this stall and take the proper action motivated this research. All data available during the coiled tubing milling job is measured on surface and there is no direct measurement of the rotation of PDM to directly diagnose a stall. The interpretation of the surface parameters in conjunction is required from the operator at every second to properly assess what is happening with the tool downhole. Considering that the operator is human and prone to errors, this paper aims to use a computer algorithm to supervise the data on surface, recognize any abnormal situation and inform it to the user.
Sircar (2021) [10] exemplified that many problem in drilling could be addressed by using Machine Learning (ML). Nevertheless, the case being studied has two major limitations for the use of ML: first, the dataset available for development is relatively small, containing data from 4 milling operations in different wells, however with the same PDM model and fluid; second, according to Noshi C [11], despite the petroleum industry relying on a large number of sensors, it also relies on human interaction with the equipment, which is not recorded in the data and just applying a machine learning technique, which would consider only this sensor data, would lead to incorrect correlations between inputs and outputs. Since the operation with PDM is heavily dependent on human interaction, a ML algorithm was deemed unfit for this purpose and other AI techniques as Fuzzy logic had to be considered.
Fuzzy logic uses linguistic variables with degrees of pertinence, making it closer to the human way of thinking and reasoning, instead of using pure numerical values and functions. Zadeh [12] first described the Fuzzy set in 1965, which were later mathematic modeled by Takagi and Sugeno [13] in 1985. Despite all data being available during the milling job being numeric (such as pressure, weight, and flow rate), the operator judgement is still subjective on whether a stall is happening at a given moment and if he/she has to stop pumping fluid through the PDM or not. In such non-Boolean decision-making processes, the Fuzzy approach to this problem seems to be promising, as it accounts for the uncertainty of human decision imprecision on defining precise criteria for decision making [12].
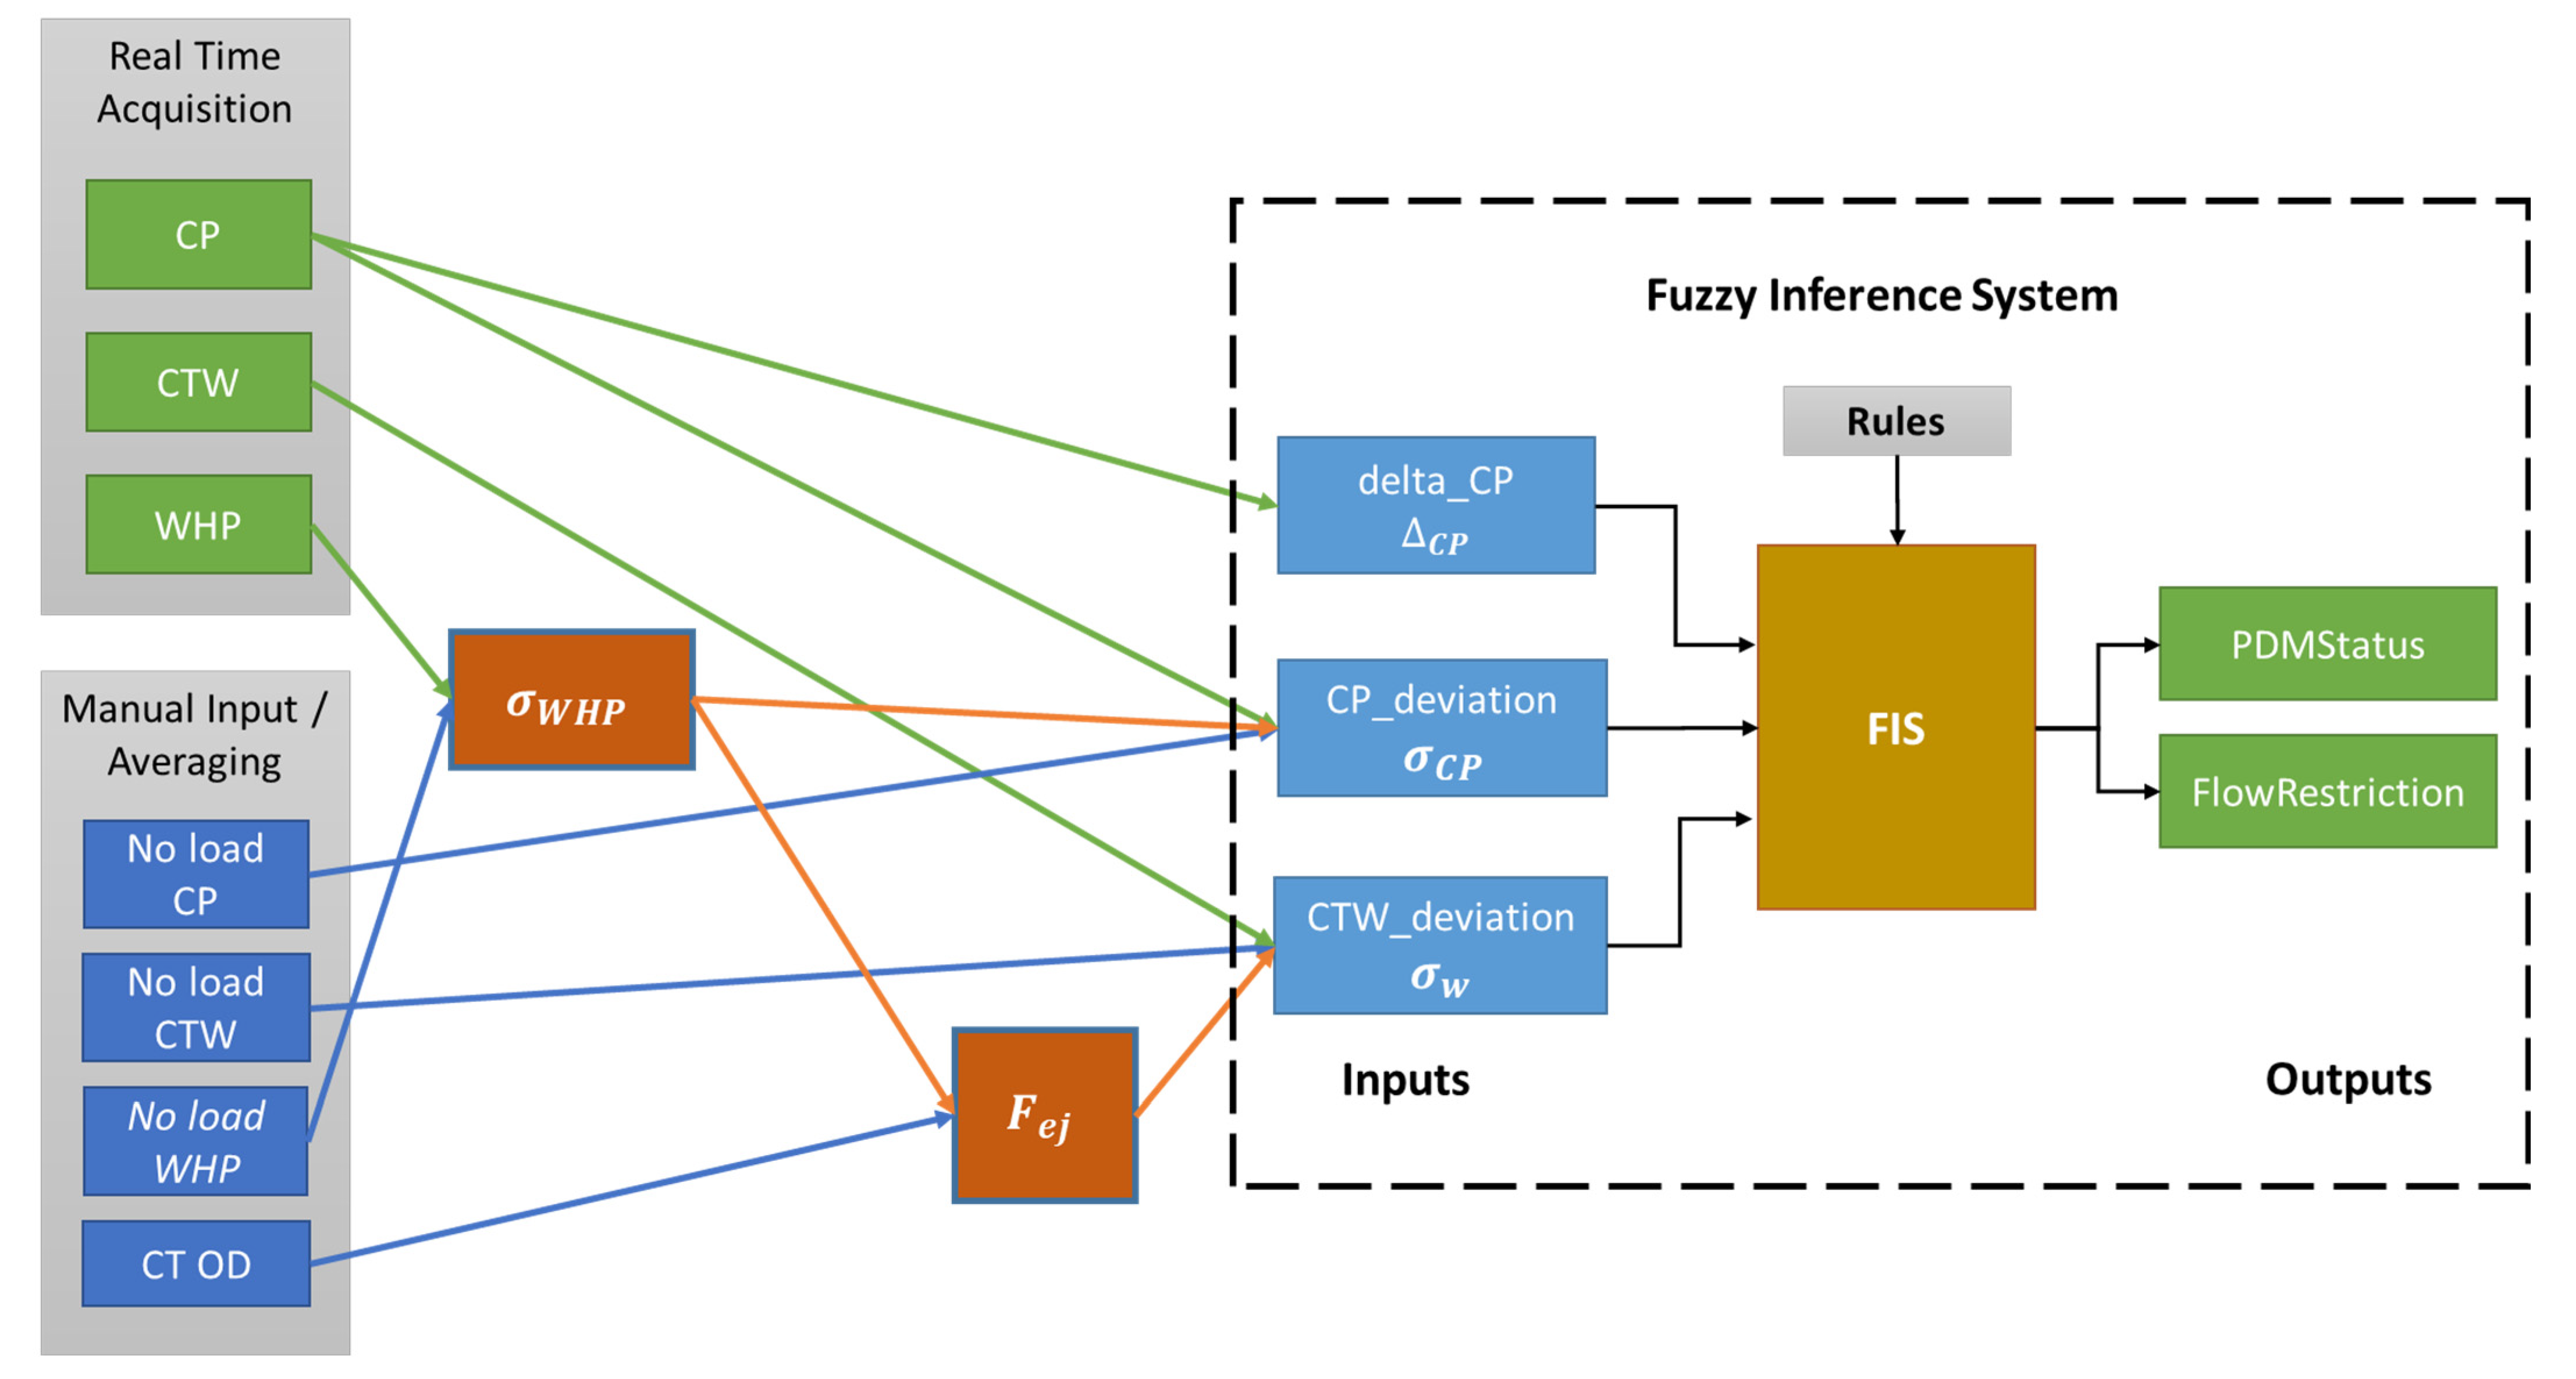
In the following sections, a Fuzzy Logic Inference System (FIS) with 3 inputs and 2 outputs which will monitor the surface parameters of a coiled tubing operation and detect the PDM stall in its initial seconds, giving enough time for pumping to be halted before the any damage occurs, is proposed. The system is required to detect the motor stalling as fast as possible, using only the data available from the coiled tubing unit surface sensors and other relevant pre-configured data. The setup of the inputs, outputs, knowledge database (fuzzy rules) and calculation is done with the support of an expert in coiled tubing and milling operations.
The following sections of this paper are structured as follows. The method section describes the FIS architecture, including inputs, outputs, rule-set, and pre-calculations of the system. The results and discussion section presents the outputs generated by the FIS using the acquisition dataset available for testing. All the abnormalities detected by the FIS are discussed and explained, and an overall discussion about the system is undertaken. Finally, the conclusion section ends this paper.

2. Related Works

Most of the efforts in the AI field to be applied for PDMs in the oilfield are regarding maintenance or data analysis of sensors in the tool itself. The most recent studies that use surface data together with AI to help the driller or CT operator to properly operate the motor or understand its real condition while downhole are mentioned below.
Demirer (2020) [14] presented a system which uses mixed-integer programming (MIP) to give the optimal drilling parameters to reach an expected well trajectory. The system considered the properties from the PDM, drill bit and real time data from the rig and defined the optimal steering commands, as tool face and steering ratio, that allow the well trajectory to be as close to the plan as possible. This system was an improvement on similar systems such as the one proposed by Zhao (2019) [15].
Zhang (2020) [3] matched the downhole and surface data acquired from several PDMs and matched them to calculate the actual efficiency of the motor. By joining the pump pressure, flow rate, and top drive RPM from surface plus rotational speed from downhole with the PDM specification, the actual rotational speed, torque, and power input versus output (efficiency) were calculated. In this work, he defined a correlation between the surface data acquired and the real efficiency of the PDM and the degradation of that efficiency over time. According to the author, this workflow can be used to estimate the motor degradation in a real-time application.
Kamyab (2020) [16] uses a rule-based system to detect in real-time at which stage of drilling program the rig is (e.g., tripping up, drilling) and determine if the step-by-step drilling program is being followed properly. This AI will monitor constantly all surface parameters and compare them with the pre-programmed steps, which include actions the driller has to do regarding the movement of the drill pipe, pumping fluids and maintaining WOB and pressures as per his/her instructions.

3. Method

3.1. Fuzzy Inference System

“Fuzzy rule-based systems have been successfully used in expert systems and control systems. A fuzzy-rule-based system can be expressed by a set of fuzzy inference rules. In each rule, there is a premise and a consequence. The premise is described by a fuzzy proposition and the consequence can be a fuzzy conclusion, or a linear model or some other models. Fuzzy inference methods are algorithms that deduce results from the inference rules and present inputs” [17]. A Fuzzy Inference System (FIS) is described in Figure 2.
The FIS inputs correspond to the coiled tubing operation data that enters the system and goes through the fuzzification interface, which converts the real-world data into linguistic values. From these linguistic values the inference engine infers the fuzzy outputs. The fuzzy outputs go through the defuzzification interface, generating a specific activation value for each output. The fuzzy rules that compose the knowledge base support the fuzzification, defuzzification and inference processes. “The inference engine is a reasoning mechanism which performs inference procedure upon the fuzzy control rules and given conditions to derive reasonable control actions. It is the central part of a fuzzy control system” [19]. In this work, the FIS system with 3 input variables and 2 output variables was implemented using Python and the libraries SciKit Learn and skFuzzy.

3.2. Measured Data from CT Unit

During the coiled tubing operations, there are only a few variables being measured in real-time, as follows.

3.2.1. Circulating Pressure (CP)

Pressure which the fluid is being pumping inside the coiled tubing reel. It is usually measured by a 4–20 mA pressure sensor in the reel manifold, but for the drilling operation with PDM, the circulating pressure is taken directly from the fluid pump. In this paper, we consider the average CP value while pumping and free spinning without any weight-on-bit (WOB) applied.

3.2.2. CT Weight (CTW)

The weight of the CT string hanging in the well plus the forces applied to push this hanging section of downhole or pull it back to the surface. It is measured by a capacitive load cell under the injector head. The injector head has a balance system in which the main injector head body that holds the CT in the well is connected to its outer frame through this load cell. The load cell is reset before starting to run the coiled tubing in the hole, so the total weight measured corresponds to the sum of the tubes weight, the downhole tools weight, the pulling force, and WOB applied downhole. Friction between the coiling tubes, BHA, and the well completion is reflected in the measured weight value and has to be taken into account while estimating the expected weight for the operation. In this paper, we considered the average of all the readings of the weight while running the tubes in the hole with the PDM BHA installed. This friction is already included in the weight value taken as reference.

3.2.3. Wellhead Pressure (WHP)

Pressure inside the well at surface level, being measured under the injector head usually by a 4–20 mA pressure transducer. The operator needs to be aware of the WHP to monitor if the values are getting closer to the surface equipment limitations or if the well is getting out of control. Based on the WHP, the operator can decide if the choke needs to be changed, if the well needs to be killed/controlled with heavier fluid or, as a last resort, if the blow out preventer (BOP) needs to be closed to secure the well safety.

3.3. Internal Calculations

None of the acquired data available are directly fed to the FIS and some intermediate calculations are undertaken before handing over data to the fuzzification interface.

3.3.1. Deviation of the WHP from the Set Point

In this work, the changes on the WHP are used to correct both CP and CTW, and the respective interpretations by the system. For the WHP to be useful, a parameter is required to monitor the change on the WHP during the milling operation ( W H P a q ) from the initial value or set point ( W H P s p ). Such a parameter is called WHP deviation Δ W H P and is defined according to Equation (1).
σ W H P = W H P a q W H P s p

3.3.2. CT Ejection Force by Well Pressure ( F e j )

Since the well has a much higher pressure than the atmospheric one, the CT string is constantly subject to a force that attempts to eject is from the well through the stripper. That force is proportional to the WHP and the cross-sectional area of the CT string as shown in Equation (2).
F e j = ( π D c t 2 / 4 ) σ W H P
This force acts against the CT weight being hold at the injector head. That means this force will be felt by the load cell and the acquired weight value will decrease accordingly as per Equation (3).
Δ C T W = Δ F e j

3.3.3. Variation of CP ( Δ C P )

It is stipulated that three reads of the CP are required to calculate the change in the CP. This is done by subtracting the current value C T ( t ) from the average of the two last readings C P ( t 1 ) and C P ( t 2 ) , as shown in Equation (4).
Δ C P ( t ) = C P ( t ) C P ( t 1 ) + C P ( t 2 ) 2
This rate of change is very important because it allows us to differentiate a partial flow restriction from a total one. A partial flow restriction can happen if one of the following occur: (i) the operator slowly close in the choke; (ii) the fluid density inside the well starts to change; (iii) if the motor is milling with a high WOB on a hard material. On the other hand, a total flow restriction would likely indicate a motor stall event, on which is expected for the pumping pressure to spike instantaneously. Anything else blocking the fluid path can also lead to this situation, such as clogged nozzles, hard shut-in or plugged coiled tubing. However, it might be not possible to differentiate any of these situations by only analyzing the pressure spike.

3.3.4. Deviation of the CP from the Set Point ( σ C P )

Like the WHP deviation (Equation (1)), this parameter value is defined as the measured pressure value subtracted from the set point (or the expected pressure value). Since no pumping pressure model is used to calculate the pressure, the average pressure while pumping without milling or WOB was used as the set point. However, due to the CP being measure upstream from the WHP, a correction is necessary.
All pumped fluid usually performs a loop where it enters the CT string, flows to the bottom of the well where actuates the PDM, flow back through the annular space CT/completion tubing and then flow through the choke. Due to the proximity of the pump and CT reel manifold, the pressure drop between them is neglected. The pressure measured at the pump or CT reel gauge ( C P s p ) is the sum of all those pressure losses, as shown in Equation (4), recognizing that the pressure at the choke and the WHP are the same.
C P s p = Δ P s t r i n g + Δ P P D M + Δ P a n + W H P
where: Δ P r e e l is the pressure loss due to friction inside the string; Δ P P D M is the pressure loss inside the PDM and Δ P a n is the pressure loss inside the annular space coiled tubing string and well bore tubulars.
The pressure losses Δ P s t r i n g and Δ P a n are always constant at a given pump rate and using a given fluid, and the fact that the PDM is milling or not should not change those parameters. The WHP is measured by the coiled tubing unit and acquired in real-time by the system, so the effect of any fluctuation of the WHP on the CP can be corrected to Equation (6).
σ C P = Δ P P D M σ W H P
This correction avoids misinterpretation about events in which changes in the WHP reflects on the CP. For instance, if the choke operator closes in the choke during a milling operation and increases the WHP by 500 psi, the CP will increase by the same amount and could be falsely interpreted as a motor stall. However, if the CP increases and the WHP and pump rate are constants, the change in CP is due to a change in the pressure drop at the PDM stator, which can indicate it is milling solids downhole or going into a stall.

3.3.5. Deviation of the Weight from the Set-Point ( σ w )

Analog to the CP, there is a correction needed because the WHP generates a force that tries to eject the coiled tubing out of the well (see Section 3.3.2). First, the system defines which is the expected weight for this depth under those well conditions. That parameter can be obtained by recording the CTW while the CT freely run down the well as per Equation (7). This formula is valid as long as WHP is null and there is no external force (slacking off weight or pull) acting on the CT string.
W s p = C T W
The weight deviation ( σ w ) is calculated according to Equation (8) where the measured weight (CTW) is subtracted by the weight set-point ( W s p ) and by the ejection force ( F e j ), and finally from the weight-on-bit (WOB) applied at the bottom of the PDM.
σ w = C T W W s p F e j W O B
The WOB is the only parameter of the Equation without a direct measurement; however, since any change in WHP will reflect both on F e j and CTW (see Equation (3)), and the W s p equals CTW (see Equation (7)), they can all cancel each other and that results on the Equation (9), where σ w is the negated WOB.
σ w = W O B

3.4. Implementing the FIS System

The parameters defined in Section 3.3.3, Section 3.3.4 and Section 3.3.5 are used as inputs to the fuzzification interface in the FIS. Since the system is written in Python, the variables have their names converted to plain English alphabet as follows: “CP_deviation” for σ C P ; “CTW_deviation” for σ w and “delta_CP” for Δ C P .
The system data flow structure is depicted in Figure 3. Most of the variables acquired from the CT unit go first under some calculation to be converted on the three inputs of the system, namely, delta_CP, CP_deviation and CTW_deviation (see Section 3.3).
The rules are also defined in the system which will run them together to define the values for both outputs PDMStatus and FlowRestriction.

3.5. Inputs Variables of FIS

As described in the previous section, the FIS is composed of 3 inputs which are defined in the paragraphs below.

3.5.1. Delta CP ( Δ C P )

For input variable Delta CP ( Δ C P ) as previously explained in Equation (4), a membership function (MF) with 5 triangular pertinence functions was created as seen in Figure 4. The linguistic variables used for each function are: “VL” for “Very Low”, “L” for “Low, “N” for “Normal, “H” for “High” and “VH” for “Very High” and the limits used for each value are described in Table 1 with the values given in “psi” (pounds per square inch). The limits for each membership function and the universe of discourse are taken from the expert who helped in the creation of the rules database. If the pressure starts to rise more than 30 psi (206 KPa) but less than 80 psi (551 kPa) in the average of the most recent 2 s, it will enable the H (High) input in the delta_CP field. That means this value will fall inside the H (High) value for the delta_CP. Note that the universe of discourse and the limits of the trapezoidal MFs had to be expanded to far away from the VL and VH activation values, as the skFuzzy system will generate an error if a data point out of these limits is given as an input, and all FIS execution will be halted.

3.5.2. CP Deviation ( σ C P )

For this input, the same membership functions as above where used, only the limits of each function and the universe of discourse was adjusted according to the expert knowledge and shown in Table 2 with the values given in “psi” (pounds per square inch). As an example, when using a 2–7/8 (73.152 mm) outside diameter (OD) PDM, the CT operator usually aims at a 200 psi (1380 kPa) to 800 psi (5516 kPa) pressure differential while pumping water or light brine at 2.8 bpm (445 L/min) pump rate when milling. That means this value will fall inside the H (High) value for the CP_deviation. The membership function is depicted in Figure 5.

3.5.3. Weight Deviation ( σ w )

Finally, the third input to the system is the deviation from the expected weight while performing the milling from the actual measured weight. As previously explained in Section 3.3.5, the deviation of the CTW from the set-point lead to an indirect measurement of the WOB being applied, the difference being that when the PDM slacks off weight on any downhole element, the σ w will assume negative values described in Equation (7). The same membership functions from previous inputs were used, with the universe and discourse and limits for each function adjusted as per Table 3 and Figure 6 with the values given in “lbf” (pound-force). As an example, during the milling it is common to apply a WOB from 500 lbf (2224 N) to 1000 lbf (4448 N) which will reflect on a −500 lbf to −1000 lbf on the CTW_deviation and activate the L (Low) membership function. The universe of discourse and trapezoidal MF also had to be expanded for the same reason explained in Section 3.5.1.

3.6. Output Variables of FIS

The FIS is composed of 2 outputs, one of them to flag when the PDM is stalling and the other to flag when the pressure reading is abnormal, but there is no evidence to conclude this is due to the PDM. As per the expert, a CP reading above the expected or the sudden increase on the CP can only be correlated to a condition on PDM if WOB is being applied. A lack of WOB could be the result of the PDM or any other change of condition in the pumping line, CT string or in the wellbore. For this reason, the FIS was designed to generate 2 outputs, one called “PDM Status” which will more certainly point out to the change in parameters being a result of the PDM conditions (e.g., milling, stalling, stator lost in hole) and a second output called “Flow Restriction” which indicates an abnormal pressure reading but does not have enough evidence to guarantee this is due to the PDM.
The main output function of the FIS is the motor stalling status, for which MF is shown in Figure 6. The same MF shape is used for the flow restriction output.

3.6.1. PDM Status

The PDM Status was generated using the “automf” function from the skFuzzy which automatically populates the output variable with equally distributed MFs as per Figure 7. The universe of discourse was from −1 to +1, where the value 0 (zero) is used to denote a normal operation. The linguistical values were similar to the input variables, except for the addition of 2 more MFs, being then “EH” for “Extremely High” and “EL” for “Extremely Low”. The values assigned for each MF of the input variable are in Table 4 together with the meaning of each level the output. As per the example, if the PDM Status output results on H (High) it means the FIS will infer that the PDM is milling and working as expected. If the output changes to VH (Very High) it infers that the motor is starting to stall or has a lower than ideal rotational speed.

3.6.2. Flow Restriction

Similarly, the Flow Restriction output was generated using the “automf” function (seen in Figure 8) and having exactly the same MFs as the first. Only the interpretation of each output level is changed as in Table 5 as this is the reason this output was created in the first place. A value of L (Low) in this variable means the FIS inferred that there is a pinhole in the CT string or minor leak in the pumping system, whereas if it changes to VL (Very Low) this is due to a more critical problem as the BHA is disconnected from the CT string and dropped inside the wellbore, or the CT string parted and there is a minor restriction to the flow.

3.7. Rules Database

After defining the membership functions for both the inputs and outputs of the FIS, the next step is to define the rules that infer the outputs from a given set of inputs. The rules database was then designed based on the knowledge of the expert. The usual approach is to define at least one rule for each combination of the inputs, which would result in 53 = 125 rules in the knowledge base. However, a preliminary analysis of these 125 rules shows that most of them cannot indicate any stall event alone and those rules were discarded to avoid cluttering the database. The rules database is described in Table 6 for a total of 39 rules. Taking rule #12 as an example if the delta_CP input is VH (Very High), the CP_deviation is H (High) and CTW_deviation is L (Low) then the PDM Status will output VH (Very High) and the Flow Restriction will output N (Normal). By correlating with Table 4 and Table 5, the FIS will infer that the PDM is probably stalling or has low rotational speed and there is no other flow restriction in the system.

4. Results and Discussion

4.1. FIS Execution with Test Data

Data from a real milling job was used to test and verify the proposed FIS. The set is comprised of data previously treated by removing any outliers and data which could interfere with the system. From this data, a total of 4 datasets were selected to test the FIS. Each of them was manually analyzed and values W H P s p , W s p and C P s p were taken from this data. These values were input to the FIS algorithm for each of these datasets. In a real application of this system in a real-time scenario, this manual input can be replaced by and automatic calculation of these parameters. A small dataset was created named Pre-Test Case to be used to initially test the system. Since it was a smaller dataset (20 min of acquisition data), it was faster to run on the Python algorithm. After the first adjustments and debugging done with the Pre-Test Case dataset, other 3 datasets numbered from 1 to 3 with more data (from 2 h to 4 h of acquisition) were used in the system to verify its functionality and accuracy.
All 4 datasets were run in the FIS algorithm on Python 3.10 and the output values recorded in an Excel sheet (.xls format). This data was later plotted.

4.2. Results Analysis

For all plots, we overlayed orange vertical lines to show where the PDMStatus output had a value ≥ 0.5, which is defined as VH (Very High) or EH (Extremely High), and is where the FIS inferred the stall event is being detected. The same was done for FlowRestriction output with a red line.
If during 1 s (1 acquisition data point) the PDMStatus output infers VH or EH, the stall is considered to happen. Even if the output goes under the threshold of 0.5 right after, one point only of stalling detection would, in a real situation, alarm the operator on a screen and he/she would be alerted of the abnormal condition, together with short instruction on the contingency to be performed (e.g., stop the pump immediately).

4.2.1. Pre-Test Case

When running the Pre-Test Case Dataset (Figure 9), the FIS correctly detected all the stall events. The orange vertical lines in Figure 9 show the datapoints where the PDMStatus output had a value ≥ 0.5, which is defined as VH (Very High) or EH (Extremely High) and is where the FIS inferred the stall event is being detected. The figure below shows the stall events happening around. 09:43, 09:54, and 09:57. Looking closer, a pressure spike can be seen around 09:46, which the system successfully did not flag as a stall, since there was no WOB applied to define it as such.
The FIS detected 3 out of 3 stalls present in this data.

4.2.2. Dataset 1

The first dataset analyzed showed that the stalling events were detected as they are forming. At around 03:01 (Figure 10), there is an event that was not detected by the system as a stall. This is due to the WOB not being high enough, and the PDMStatus output did not reach a value higher than 0.5. This can be considered normal as maybe the motor started to reduce its RPM; however, the restriction was removed by the mill before the WOB or CP could build up further.
At around 06:00, a FlowRestriction event is detected (denoted by the red vertical line) and this could be due to the fact that the motor was stalled and, while still having trapped pressure inside the housing, the operator started to remove the WOB by pulling up the CT string, which decreased the CTW_deviation back to N (Normal), and the FlowRestriction output was activated. This action of not waiting on the pressure to bleed off before moving up the tool string is an operational error by the operator side and could result in over-spinning of the PDM and, in the worst case, could lead to the rotor unscrewing from the PDM body and immediate failure of the tool. In a real case scenario, the PDMStatus output could be connected to an actuator on the CT unit that would not allow the CT pipe to move up even if the operator moves the lever to do so.
The FIS detected 7 out of 8 stalls present in this data.

4.2.3. Dataset 2

In Dataset 2 (Figure 11), all the stall points at 23:19, 23:29, and 00:15 were successfully detected.
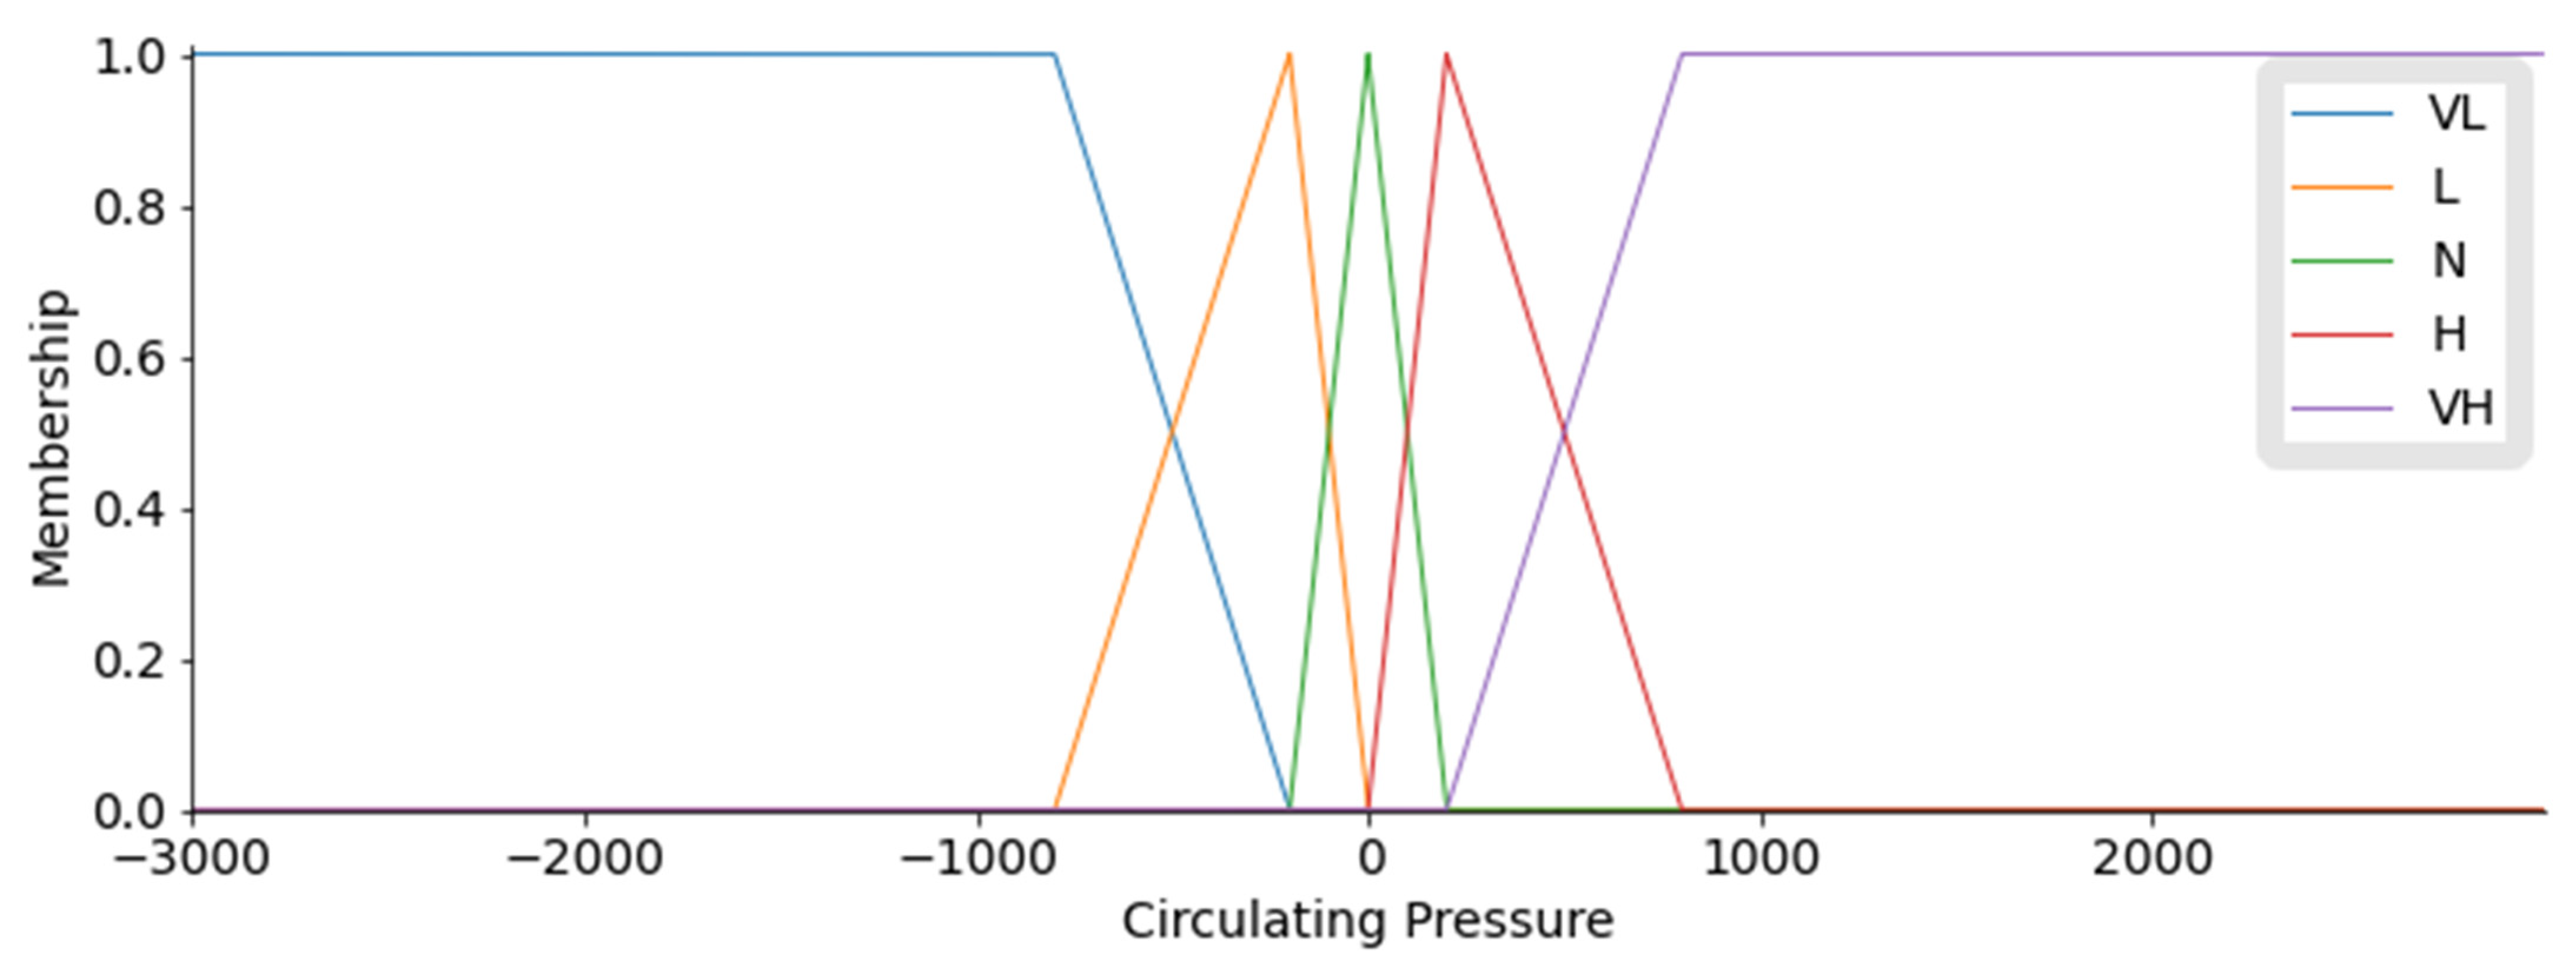
At around 00:26, there was an increase in pressure which did not result in a positive output for PDM Status and shows the importance of subtracting σ W H P when calculating CP_deviation ( σ C P ) as in Formula (6). Without this compensation, the system would not account for the increase in CP_deviation because, since it is a result of an increase in the WHP, it could wrongly activate one of the outputs and generate a false output.
The FIS detected 4 out of 4 stalls present in this data.

4.2.4. Dataset 3

When running the FIS with the last dataset (Figure 12), there are some false alarms during the first half of the acquisition (before 21:06), specially for the Flow Restriction, which was constantly alarming. Those alarms are mainly due the CP set point being defined as 7900 psi, which is an accurate value for the second half of the acquisition, but not for the first half, where the pressure was higher due to a higher pump flow rate. This indicates that this FIS will be more accurate if also adjusted by the flow rate of the fluid being pumped inside the CT string and through the PDM, which could not be done due to unavailability of accurate pump rate data in the available data. During the second half of the acquisition (21:06 onwards) the only stall event that occurred in reality was successfully detected by the FIS. There was an increase in pressure at 21:14; however, this event did not activate the PDM Status as no WOB was applied, and the Flow Restriction output was activated as expected.
The FIS detected 3 out of 3 stalls present in this data.

4.3. Overall Discussion

Overall, the FIS detected 17 out of 18 stall events present in the data, resulting in a 94% accuracy, which is considered very satisfactory. As this system is not a controller and is not directly connected to any actuator in the process, the figure of the human operator will always be present, and the FIS will act similarly to a second person watching the data at all times, and monitoring the job together with the operator.
A total of 68,458 acquisition points were run through the system, and each point was recorded at every 1 s during the job. The Python implementation of this FIS could process around 130 points per second, which translates to 8 millisecond of processing time for every 1 s of data, showing the algorithm is lightweight and can probably be ported to a compact and low-cost device such as a FPGA, PIC, or SBC.
The different datasets used come from different wells, with different trajectories and different depth. This was deliberately organized in this way in order to expose the FIS and test it in different scenarios. The PDM, however, with a 27/8-inch OD and 5/6 lobes arrangement, is the same in all datasets and the MFs values were adjusted to fit the differential pressure x torque relation applicable to that specific motor. In a situation with a different PDM, these functions must be adjusted for a system to have meaningful results. This specific PDM model is the most widely used for CT operations. Different sizes or lobe setups are considered niche. The use of fluids with different rheology than water (e.g., drilling mud, gelled fluids) may also require this same adjustment.

5. Conclusions

The objective of constructing a FIS using Python and skFuzzy to detect the stalls in a CT milling operation was accomplished, and the objectives of this work were met. By using the available real-world data, this approach could be validated as the stall events present in this data were successfully flagged by the system as such. Almost all events apart from 1 were detected, leaving a 94% accuracy for the system. The events were also detected as the pressure started to rise; therefore, in a real scenario, the objective of alarming the operator to take action before the stall turns into a permanent damage to the PDM is met.
Even after discarding more usual ML-based techniques due to restrictions on the available data, the more dated FIS approach, with parameters and rules obtained by the expert only, proved to be a viable option to solve this kind of problem. For more niche problems like the one described in this paper, where no large amounts of data are available, legacy AI techniques are probably the only viable option.
Due to the relatively small amount of data used for testing, for it to be used as part of a commercial and/or production artificial intelligence system, this algorithm still needs to undergo further testing and improvement with more data from different sources, including the use of PDMs with different specification and different fluids. The use of the flow rate as an input of the system is also recommended, as it can be used to compensate changes in the acquired pressures if the operator changes the pump rate during the job, avoiding false alarms.
In the future, this system will be used as a base to monitor and supervise other operations involving the coiled tubing unit such as, jetting, inflatable packers, and acid/cement placement. The FIS structure can be maintained and only adjustments to the membership function values and rule database for each kind of operation might be required. Additionally, its ease of use can be improved by automating the definition of the set points for WHP, CP, and CTW before starting each use of the PDM, and also by automatically detecting when the PDM is at depth and about to start the job, which would avoid the system of being activated while tripping in or out of hole.
During this research, no similar work was found during the literature review. This is no guarantee that no similar system is being developed or exists, as such a system could be part of a commercial product by a private company, and thus not be presented in a paper to the scientific community due to commercial needs.

Author Contributions

Conceptualization, R.A.G.F. and P.M.S.R.R.; methodology, R.A.G.F. and P.M.S.R.R.; software, R.A.G.F.; validation, R.A.G.F., P.M.S.R.R., A.N. and J.A.M.; formal analysis, R.A.G.F.; investigation, R.A.G.F.; resources, R.A.G.F.; data curation, R.A.G.F.; writing—original draft preparation, R.A.G.F.; writing—review and editing, J.A.M. and P.M.S.R.R.; visualization, R.A.G.F.; supervision, J.A.M.; project administration, R.A.G.F.; funding acquisition, J.A.M. All authors have read and agreed to the published version of the manuscript.

Funding

This research received no external funding and the APC was funded by São Paulo State University under process EDITAL PROPG 43/2022.

Conflicts of Interest

The authors declare no conflict of interest.

References

  1. Ma, T.; Chen, P.; Zhao, J. Overview on vertical and directional drilling technologies for the exploration and exploitation of deep petroleum resources. Geomech. Geophys. Geo-Energy Geo-Resour. 2016, 2, 365–395. [Google Scholar] [CrossRef]
  2. Chen, X.; Gao, D.; Guo, B.; Feng, Y. Real-time optimization of drilling parameters based on mechanical specific energy for rotating drilling with positive displacement motor in the hard formation. J. Nat. Gas Sci. Eng. 2016, 35, 686–694. [Google Scholar] [CrossRef]
  3. Zhang, Z.; Shen, Y.; Chen, W.; Chen, Z. Analyzing energy and efficiency of drilling system with mud motor through big data. In Proceedings of the SPE Annual Technical Conference and Exhibition, Virtual, 29 October 2020. [Google Scholar] [CrossRef]
  4. Craig, S.; Harris, J.; Lehr, D.; Brandt, N. Best practices for composite plug millin. In Proceedings of the SPE/ICoTA Coiled Tubing & Well Intervention Conference and Exhibition, The Woodlands, TX, USA, 26–27 March 2012; pp. 225–240. [Google Scholar] [CrossRef]
  5. Anyanwu, O.N.; Klotz, C.; Labrecque, D.; Ulrich, C. Optimized downhole mud motor delivers outstanding performance improvement in Alaska coiled tubing drilling. In Proceedings of the SPE/ICoTA Coiled Tubing & Well Intervention Conference and Exhibition, The Woodlands, TX, USA, 26–27 March 2012; pp. 88–100. [Google Scholar] [CrossRef]
  6. STheophilus, C.; Esenowo, V.N.; Arewa, A.O.; Ifelebuegu, A.O.; Nnadi, E.O.; Mbanaso, F.U. Human factors analysis and classification system for the oil and gas industry (HFACS-OGI). Reliab. Eng. Syst. Saf. 2017, 167, 168–176. [Google Scholar] [CrossRef]
  7. Selvik, J.T.; Bellamy, L.J. Addressing human error when collecting failure cause information in the oil and gas industry: A review of ISO 14224:2016. Reliab. Eng. Syst. Saf. 2018, 194, 106418. [Google Scholar] [CrossRef]
  8. Solanki, P.; Baldaniya, D.; Jogani, D.; Chaudhary, B.; Shah, M.; Kshirsagar, A. Artificial intelligence: New age of transformation in petroleum upstream. Pet. Res. 2022, 7, 106–114. [Google Scholar] [CrossRef]
  9. Bello, O.; Oppelt, J.; Holzmann, J.; Obiwanne, A. SPE-184320-MS Application of Artificial Intelligence Techniques in Drilling System Design and Operations: A State of the Art Review and Future Research Pathways: Artificial Intelligence (AI) oil and gas industry drilling prediction diagnosis wel. In Proceedings of the SPE Nigeria Annual International Conference and Exhibition, Lagos, Nigeria, 2–4 August 2016; pp. 2–4. [Google Scholar]
  10. Sircar, A.; Yadav, K.; Rayavarapu, K.; Bist, N.; Oza, H. Application of machine learning and artificial intelligence in oil and gas industry. Pet. Res. 2021, 6, 379–391. [Google Scholar] [CrossRef]
  11. Noshi, C.I.; Schubert, J.J. The role of machine learning in drilling operations; a review. SPE East. Reg. Meet. 2018, 2018, 7–11. [Google Scholar] [CrossRef]
  12. Zadeh, L.A. Fuzzy sets. Inf. Control 1965, 8, 338–353. [Google Scholar] [CrossRef]
  13. Takagi, T.; Sugeno, M. Fuzzy Identification of Systems and Its Applications Modeling and Control. IFAC Proc. Vol. 1985, 15, 116–132. [Google Scholar] [CrossRef]
  14. Demirer, N.; Zalluhoglu, U.; Marck, J.; Darbe, R. Automated steering with real-time model-based control. Int. Pet. Technol. Conf. 2020, 2020, 13–15. [Google Scholar] [CrossRef]
  15. Zhao, Y.; Zalluhoglu, U.; Marck, J.; Demirer, N.; Morari, M. Model predictive control for mud motor operation in directional drilling. Proc. Am. Control Conf. 2019, 2019, 5197–5202. [Google Scholar] [CrossRef]
  16. Kamyab, M.; Yalamarty, S.S.; Rogers, P.; Cheatham, C. Automated procedural compliance drives real time drilling optimization. SPE/IADC Drill. Conf. Proc. 2020, 2020, 3–5. [Google Scholar] [CrossRef]
  17. Cai, L.Y.; Kwan, H.K. Fuzzy classifications using fuzzy inference networks. IEEE Trans. Syst. Man Cybern. Part B Cybern. 1998, 28, 334–347. [Google Scholar] [CrossRef]
  18. Qurat-Ul, A.; Iqbal, S.; Khan, S.A.; Malik, A.W.; Ahmad, I.; Javaid, N. IoT operating system based fuzzy inference system for home energy management system in smart buildings. Sensors 2018, 18, 2802. [Google Scholar] [CrossRef] [PubMed]
  19. Feng, G. A survey on analysis and design of model-based fuzzy control systems. IEEE Trans. Fuzzy Syst. 2006, 14, 676–697. [Google Scholar] [CrossRef] [Green Version]
Figure 1. PDM Operation (CHEN et al., 2016 [2]).
Applsci 12 09883 g001
Figure 2. Fuzzy Inference System [18].
Applsci 12 09883 g002
Figure 3. System data flow.
Applsci 12 09883 g003
Figure 4. Graphical description of variable delta_CP ( Δ C P ).
Applsci 12 09883 g004
Figure 5. Graphical description of variable CP_deviation ( σ C P ).
Applsci 12 09883 g005
Figure 6. Graphical description of variable CTW_deviation ( σ w ).
Applsci 12 09883 g006
Figure 7. Graphical description of variable PDM Status.
Applsci 12 09883 g007
Figure 8. Graphical description of variable Flow Restriction.
Applsci 12 09883 g008
Figure 9. Plot for Pre-Test Case datapoints and FIS outputs.
Applsci 12 09883 g009
Figure 10. Plot for Dataset 1 datapoints and FIS outputs.
Applsci 12 09883 g010
Figure 11. Plot for Dataset 2 datapoints and FIS outputs.
Applsci 12 09883 g011
Figure 12. Plot for Dataset 3 datapoints and FIS outputs.
Applsci 12 09883 g012
Table 1. Membership functions for variable delta_CP ( Δ C P ).
Delta_CPFunction TypeLimit Points
ABCD
VHVery HighTrapezoidal3080500500
HHighTriangular03080
NNormalTriangular−30030
LLowTriangular−80−300
VLVery LowTrapezoidal−500−500−80−30
Universe of discourse−500 +500
Table 2. Membership functions for variable CP_deviation (σ_CP).
CP_DeviationFunction TypeLimit Points
ABCD
VHVery HighTrapezoidal20080030003000
HHighTriangular0200800
NNormalTriangular−30030
LLowTriangular−800−2000
VLVery LowTrapezoidal−3000−3000−800−200
Universe of discourse−3000 +3000
Table 3. Membership functions for variable CTW_deviation ( σ w ).
CTW_DeviationFunction TypeLimit Points
ABCD
VHVery HighTrapezoidal500100010,00010,000
HHighTriangular05001000
NNormalTriangular−5000500
LLowTriangular−1000−5000
VLVery LowTrapezoidal−10,000−10,000−1000−500
Universe of discourse A−10,000 +10,000
Table 4. Membership functions for variable PDM Status.
PDM StatusFunction TypeLimit PointsOutput Level Linguistic
Meaning
ABC
EHExtremely HighTriangular0.6611Motor Plugged/Stalled
VHVery HighTriangular0.330.661Motor low RPM/Stalling
HHighTriangular00.330.66Motor milling
NNormalTriangular−0.3300.33Motor working with no load
LLowTriangular−0.66−0.330Motor pressure low
VLVery LowTriangular−1−0.66−0.33Motor pressure too low
ELExtremely LowTriangular−1−1−0.66Rotor or BHA lost in hole
Table 5. Membership functions for variable Flow Restriction.
PDM StatusFunction
Type
Limit PointsOutput Level Linguistic Meaning
ABC
EHExtremely HighTriangular0.6611CT pipe or treating line clogged
VHVery HighTriangular0.330.661CT BHA may be fully clogged
HHighTriangular00.330.66CT BHA may be partially clogged
NNormalTriangular−0.3300.33Normal restriction inside CT
LLowTriangular−0.66−0.330Pin hole in CT string/Minor leak
VLVery LowTriangular−1−0.66−0.33BHA may be lost in hole or pipe parted downhole
ELExtremely LowTriangular−1−1−0.66Pipe or line parted on surface
Table 6. FIS Rules Database.
RuleInputsOutputs
#Delta_CPCP_DeviationCTW_DeviationPDM StatusFlow
Restriction
1NNN or H or VHNN
2VHVHN or H or VHNEH
3HVHN or H or VHNVH
4VHHN or H or VHNH
5HHN or H or VHNH
6LLN or H or VHNL
7VLLN or H or VHNL
8LVLN or H or VHNVL
9VLVLN or H or VHNEL
10VHVHLEHN
11HVHLVHN
12VHHLVHN
13HHLHN
14VHNLHN
15HNLNN
16LLLLN
17VLLLLN
18LVLLVLN
19VLVLLELN
20VHVHVLEHN
21HVHVLEHN
22VHHVLVHN
23HHVLVHN
24VHNVLHN
25HNVLNN
26LLVLLN
27VLLVLLN
28LVLVLVLN
29VLVLVLELN
30NVHLVHN
31NHLHN
32NNLNN
33NLLLN
34NVLLVLN
35NVHVLHN
36NHVLHN
37NNVLLN
38NLVLVLN
39NVLVLELN
Publisher’s Note: MDPI stays neutral with regard to jurisdictional claims in published maps and institutional affiliations.

