
Hydraulic Resistance Analysis Based on Cohesive Strength and Toughness of Synthetic Polymerized Rubber Gel Used as Water-Leakage Repair Material for Concrete Structures


Abstract
:1. Introduction
2. Analysis and Experimental Methods of Correlating Toughness and Hydraulic Resistance
2.1. Analysis of the Relationship between Viscosity, Cohesive Strength, Toughness, and Hydraulic Resistance
2.1.1. Cohesive Strength
2.1.2. Elongation
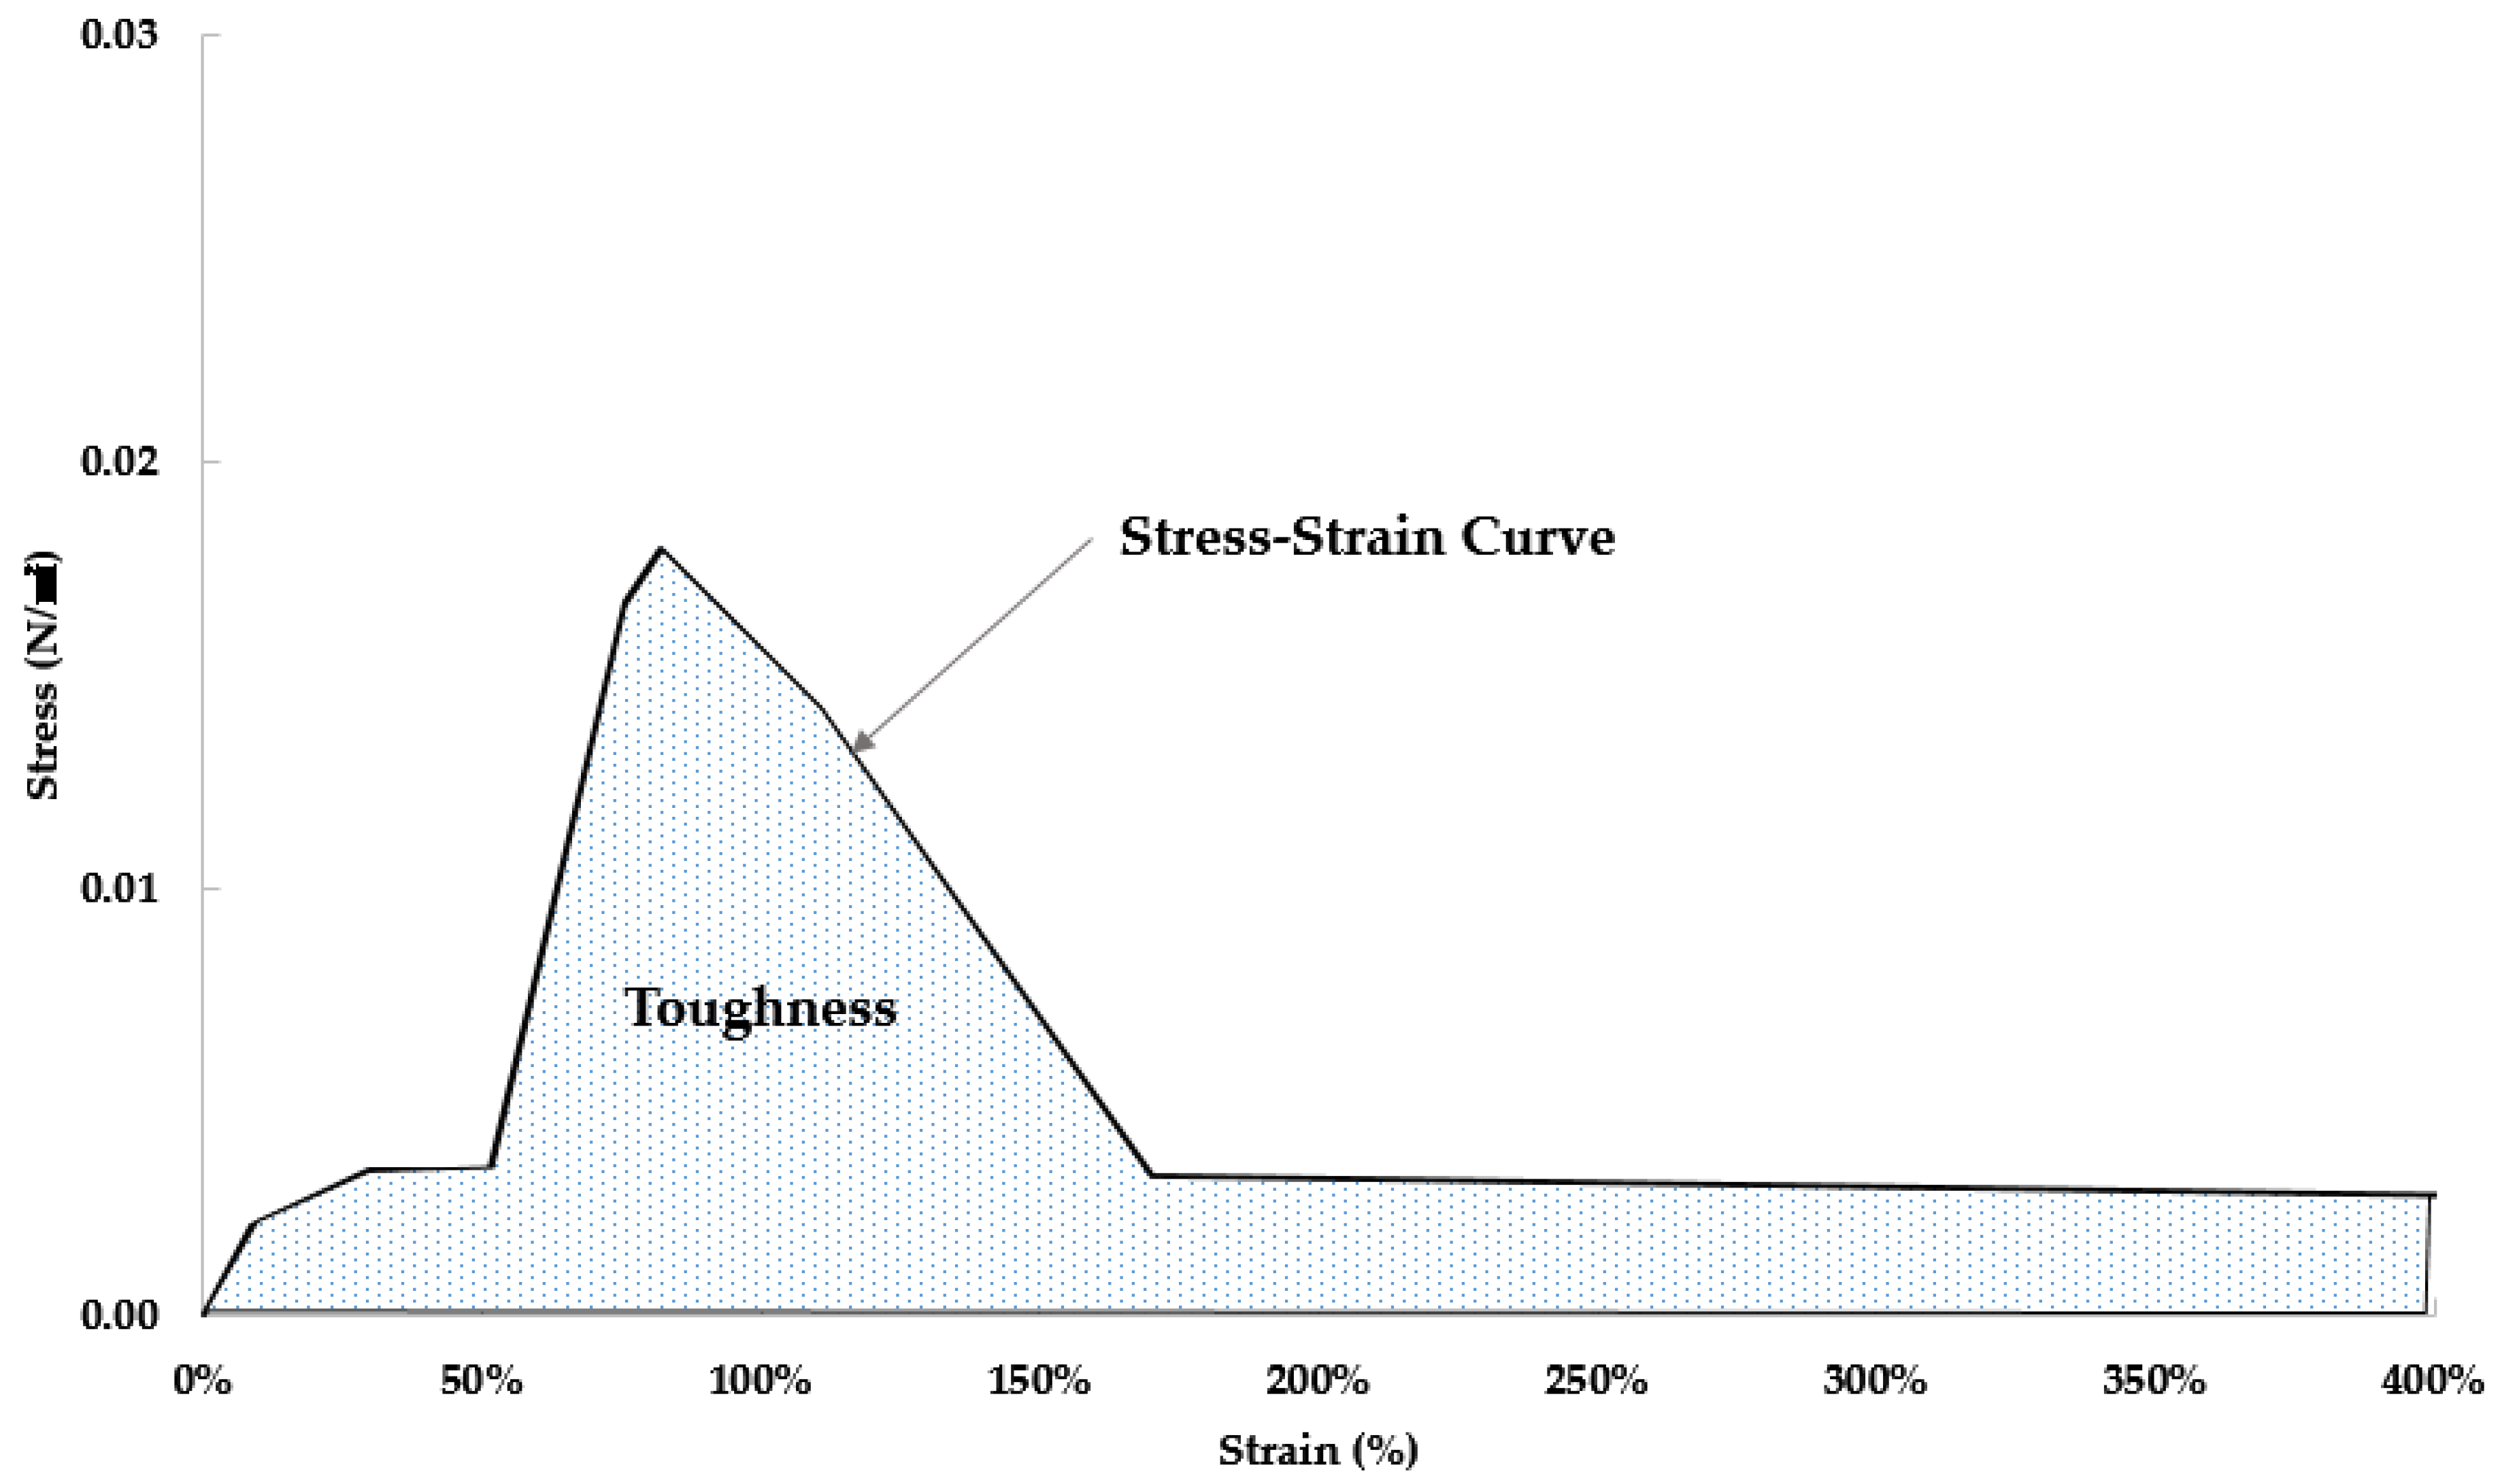
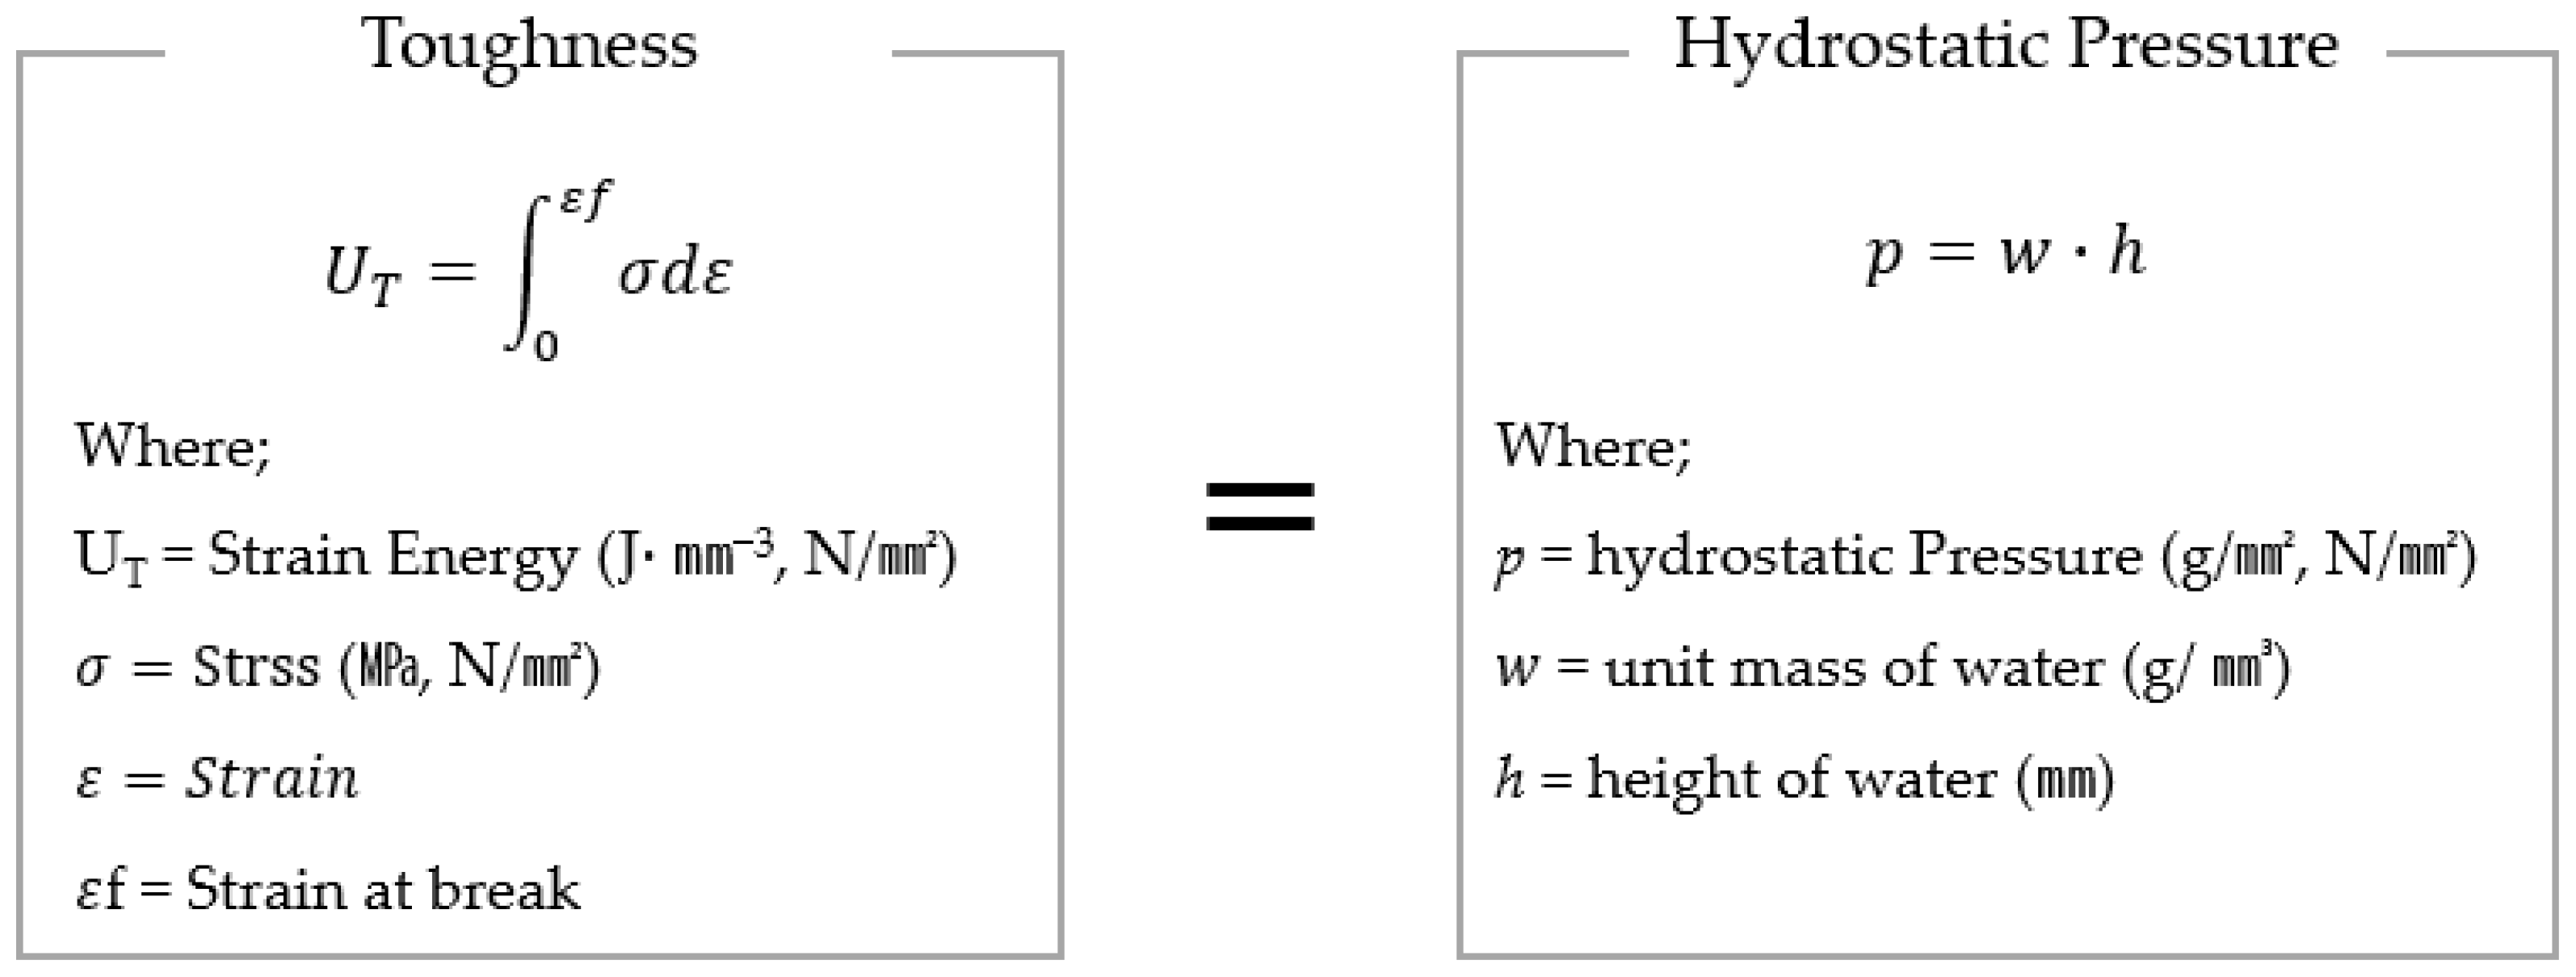
2.1.3. Toughness
2.1.4. Estimation of Water Pressure Response Performance
2.2. Materials and Equipment Used in Experiments and Analysis
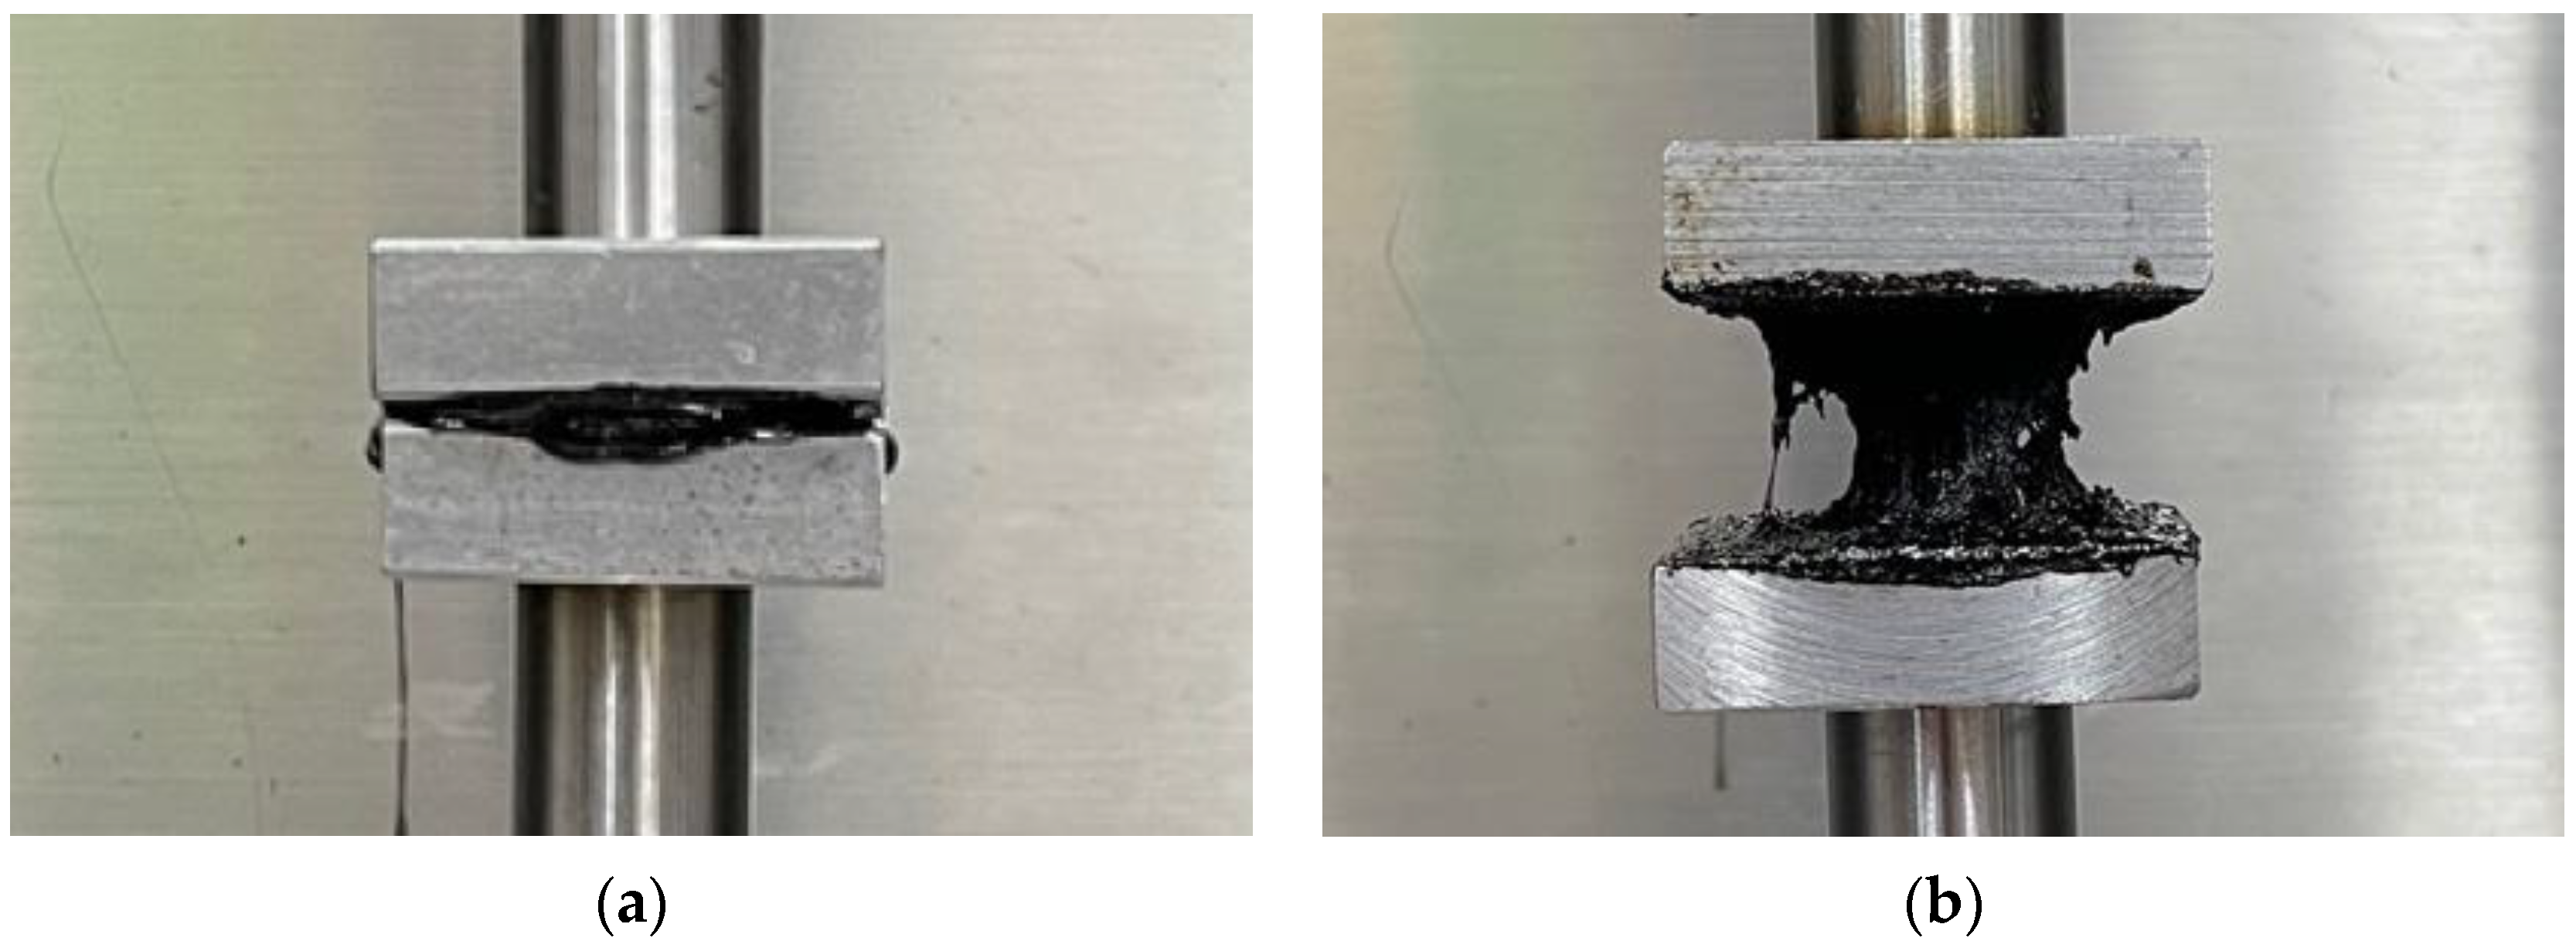
2.3. Test Method
3. Analysis and Consideration of Result
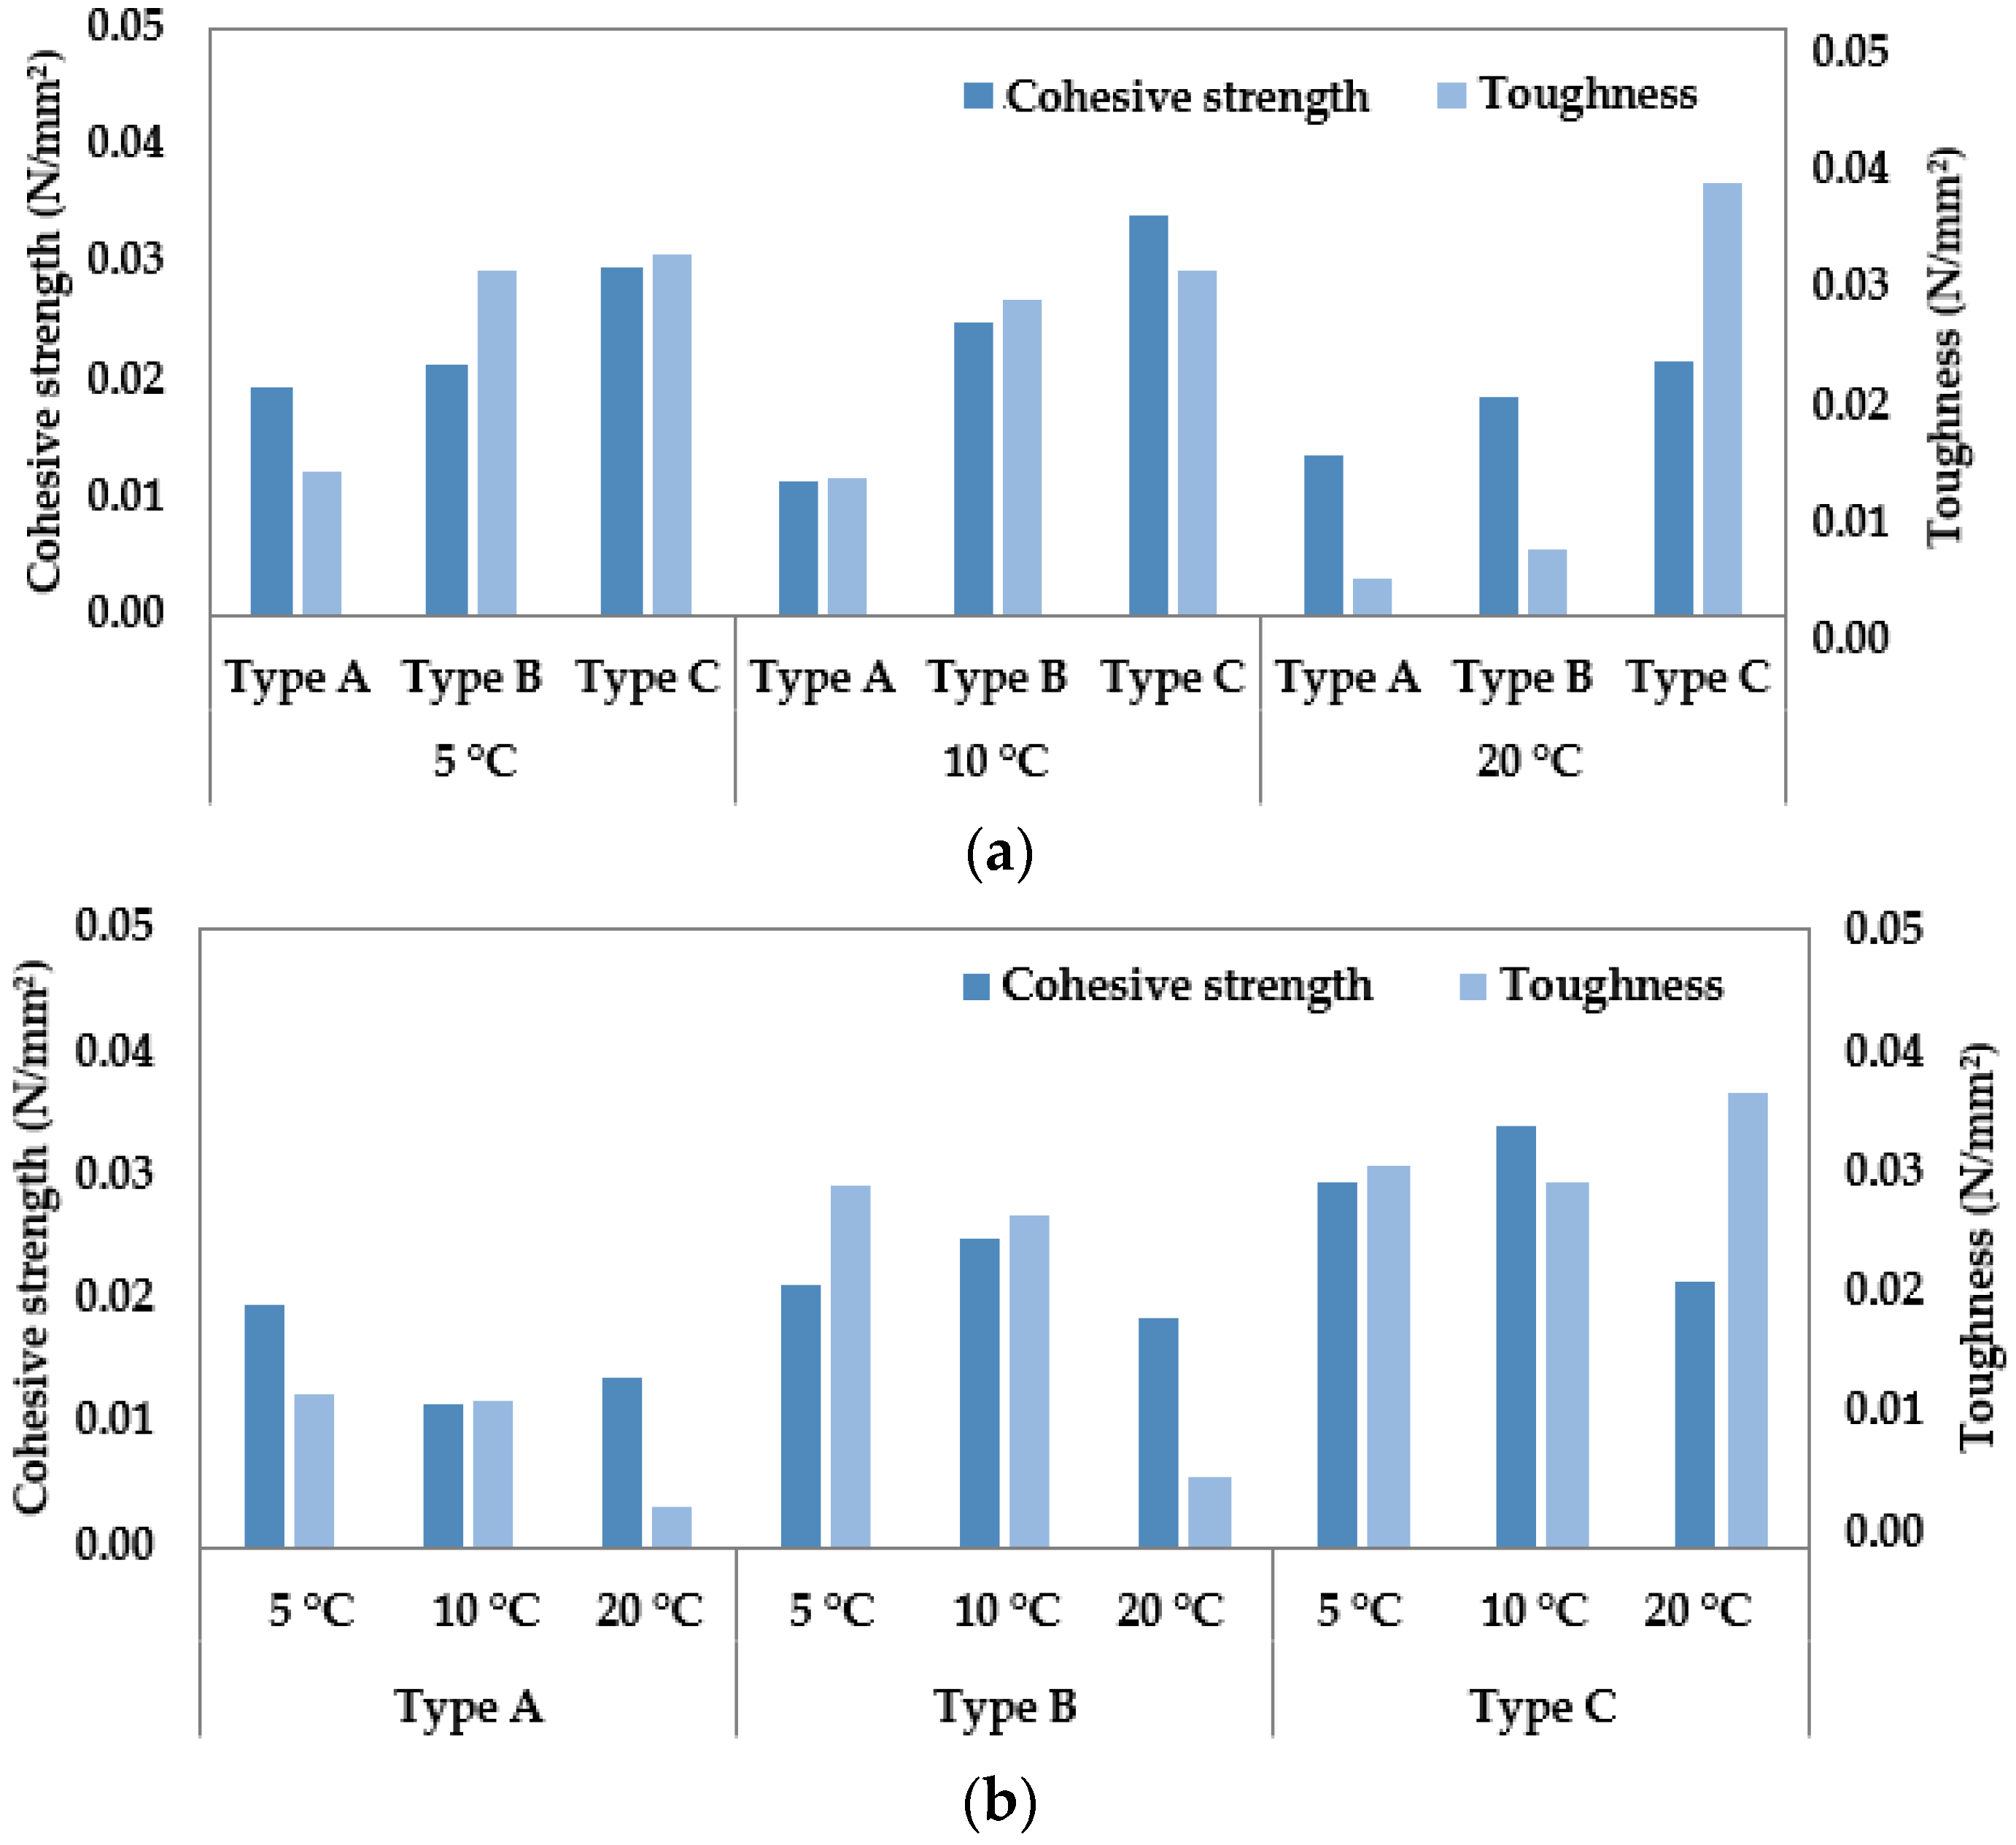
3.1. Cohesive Strength and Toughness of 2 mm Thickness
3.2. Cohesive Strength and Toughness of 10 mm Thickness
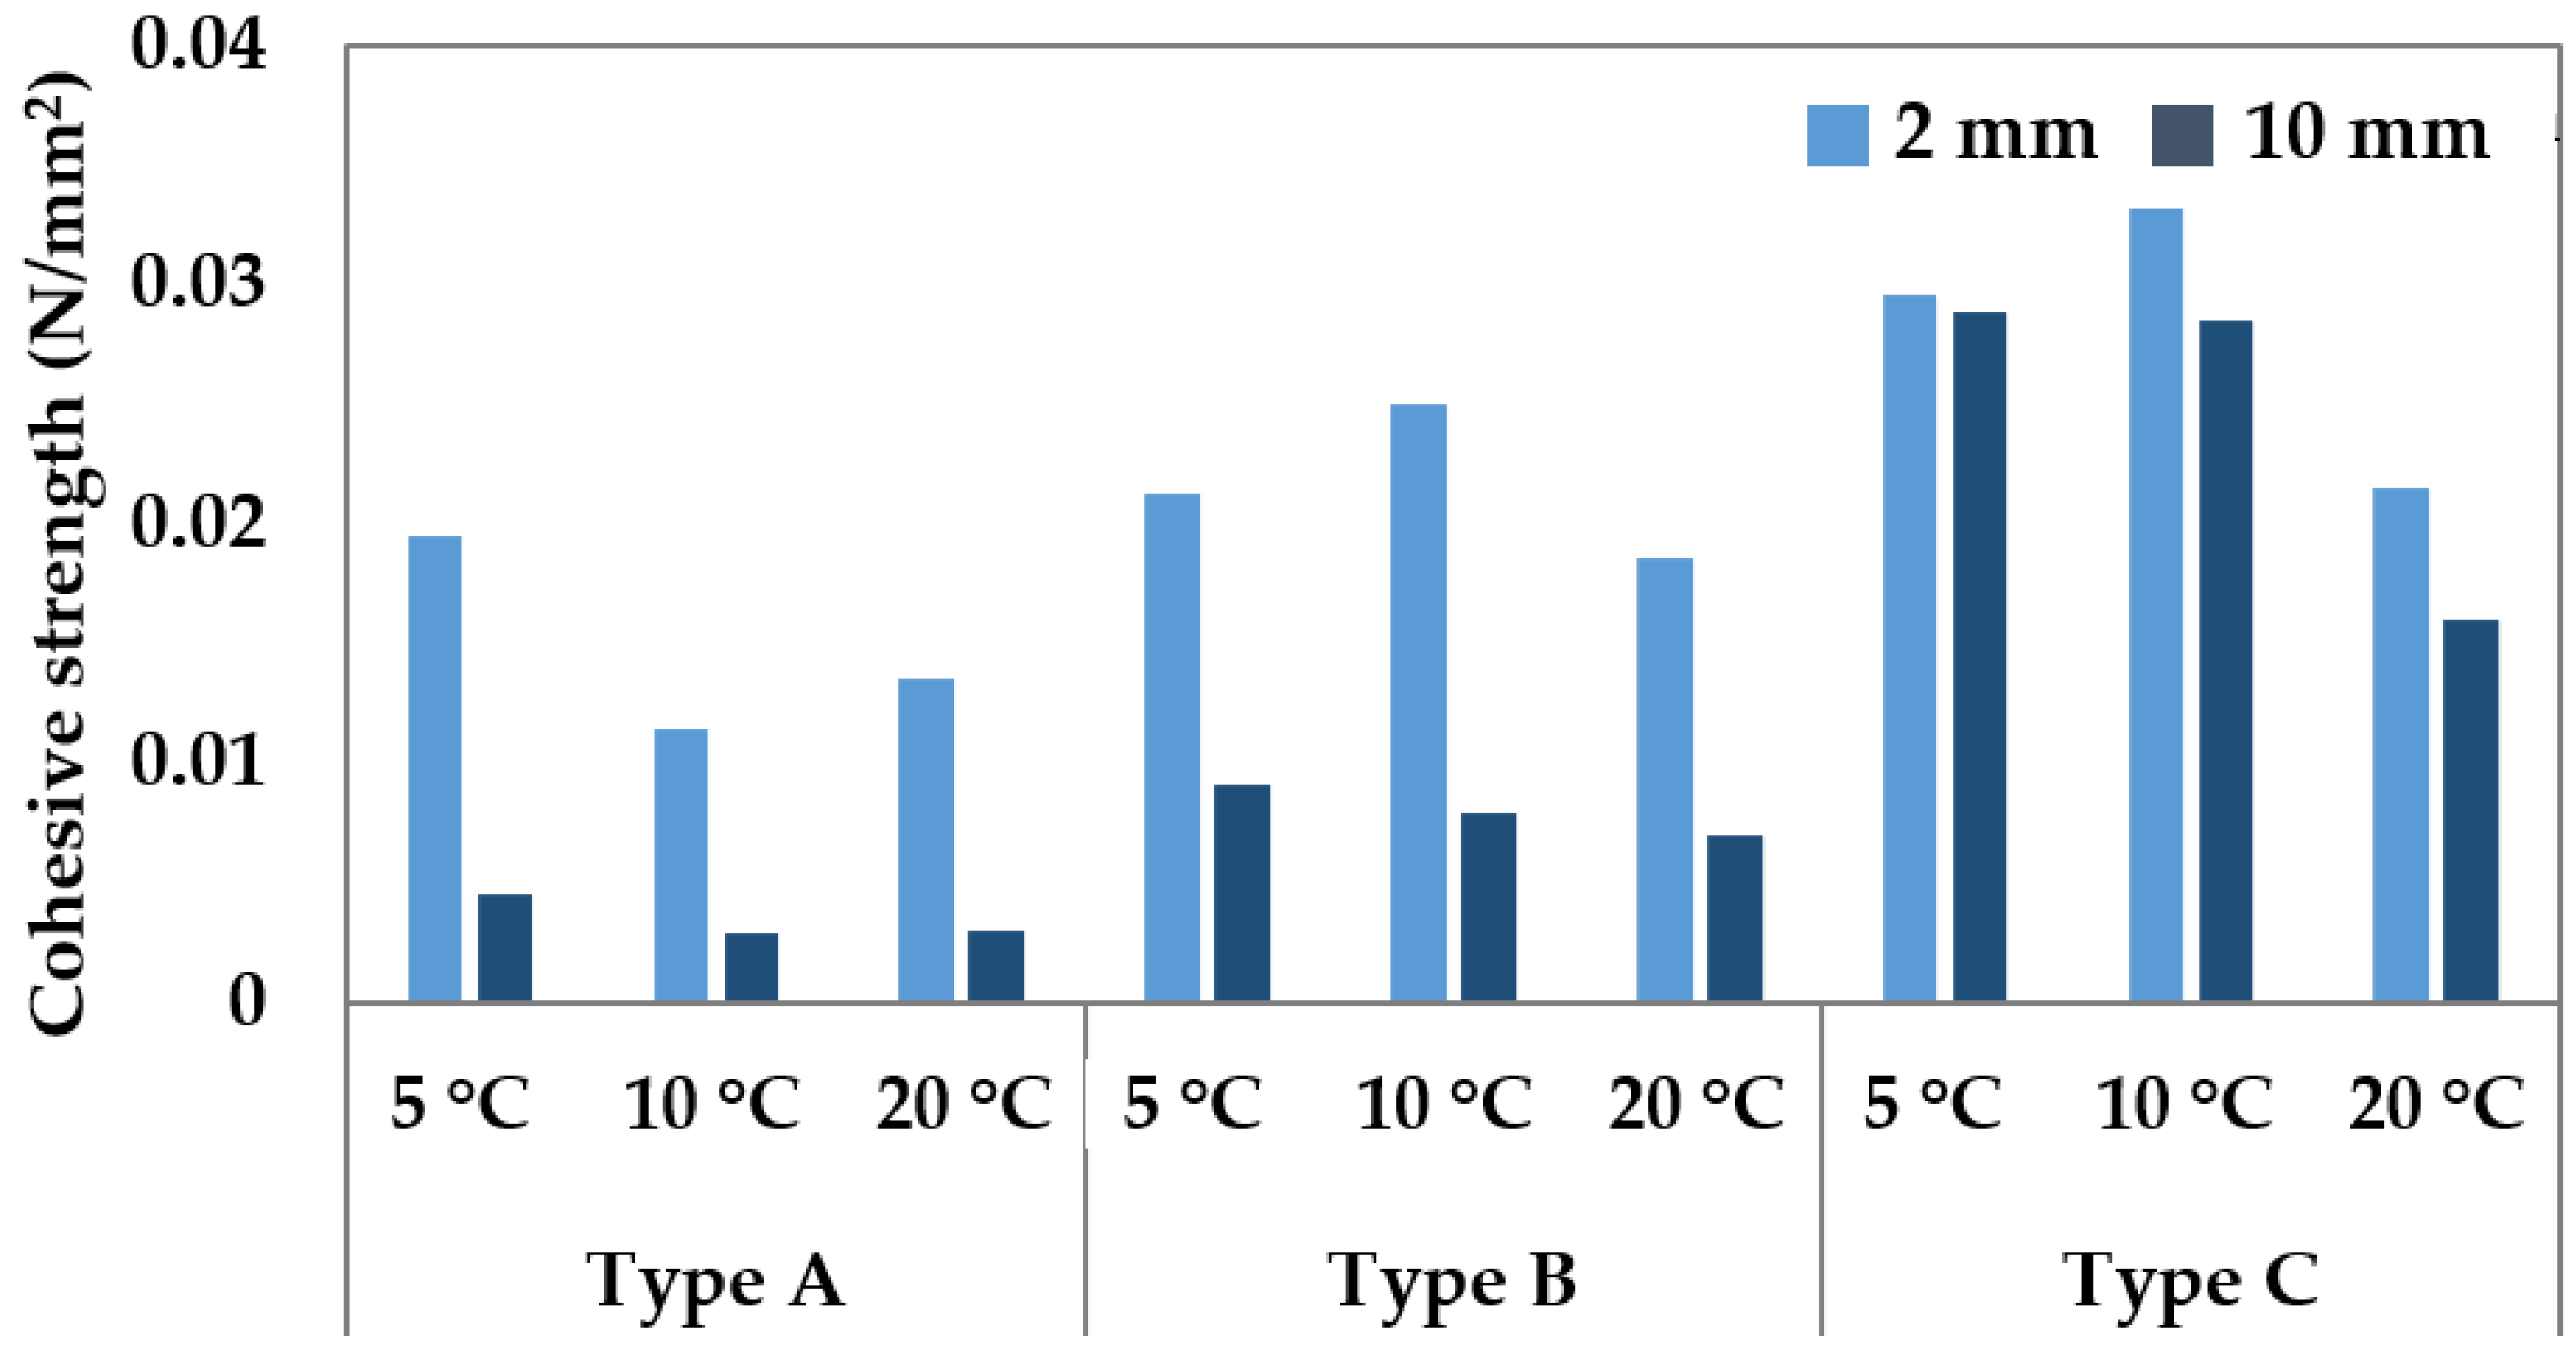
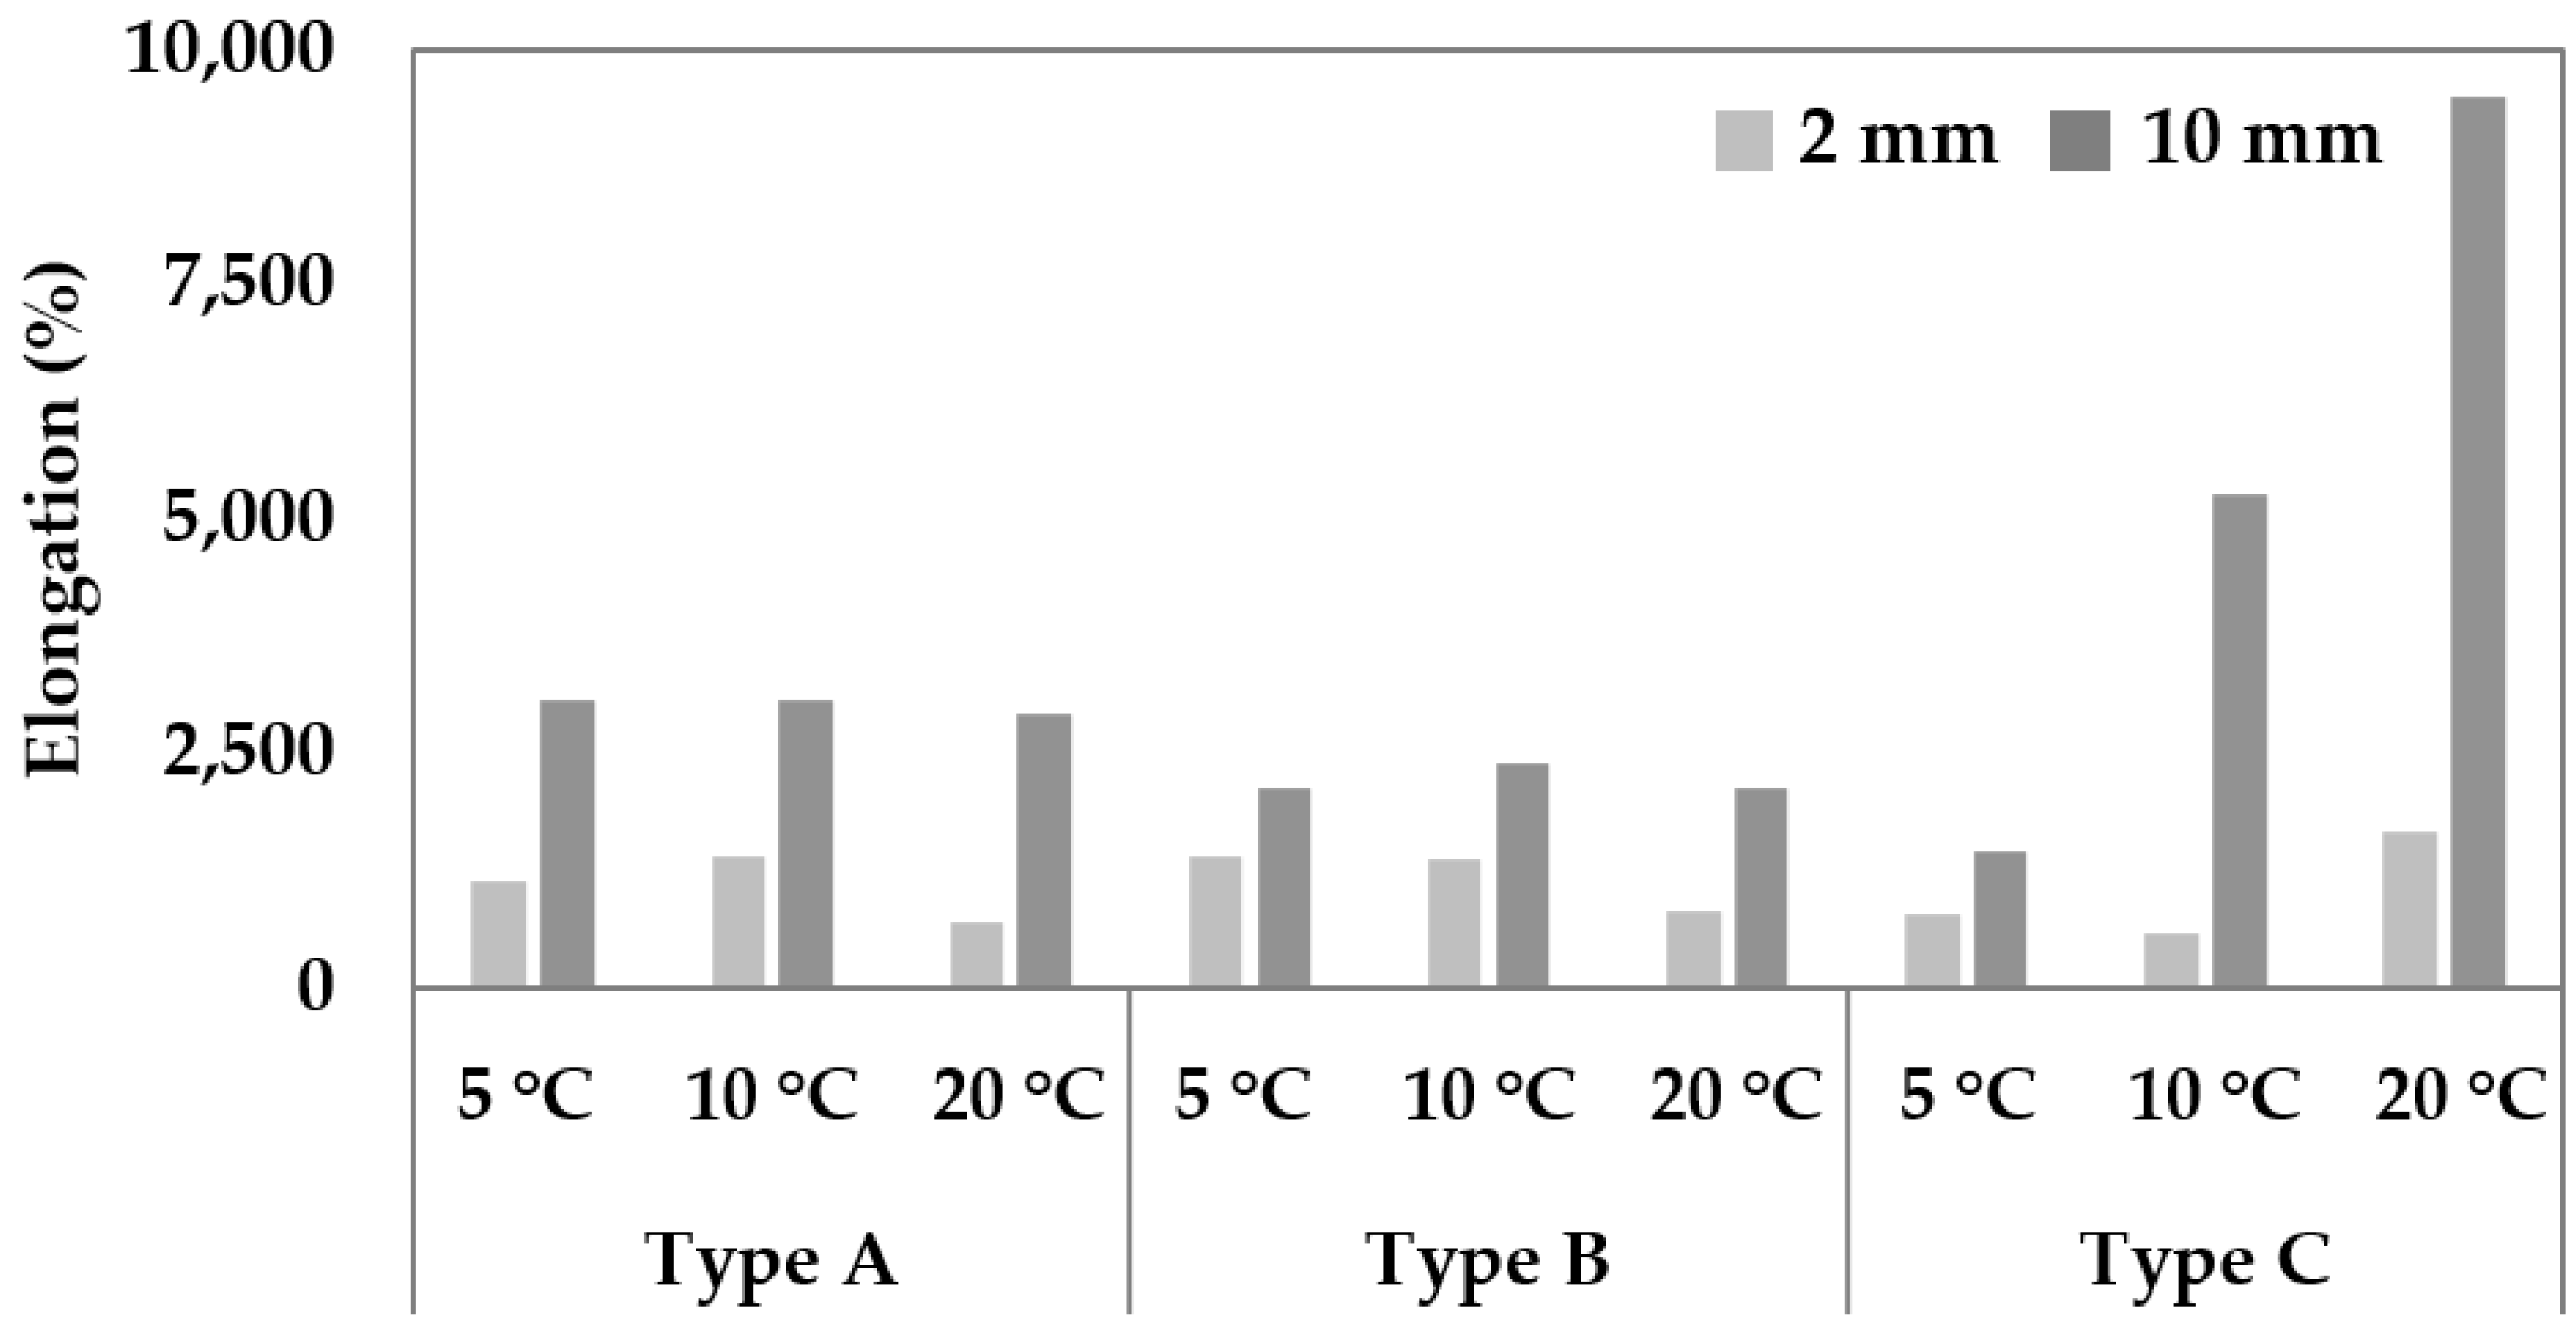
3.3. Comparison of 2 mm and 10 mm Thickness
- (1)
- Comparison of cohesive strength
- (2)
- Comparison of elongation rates
- (3)
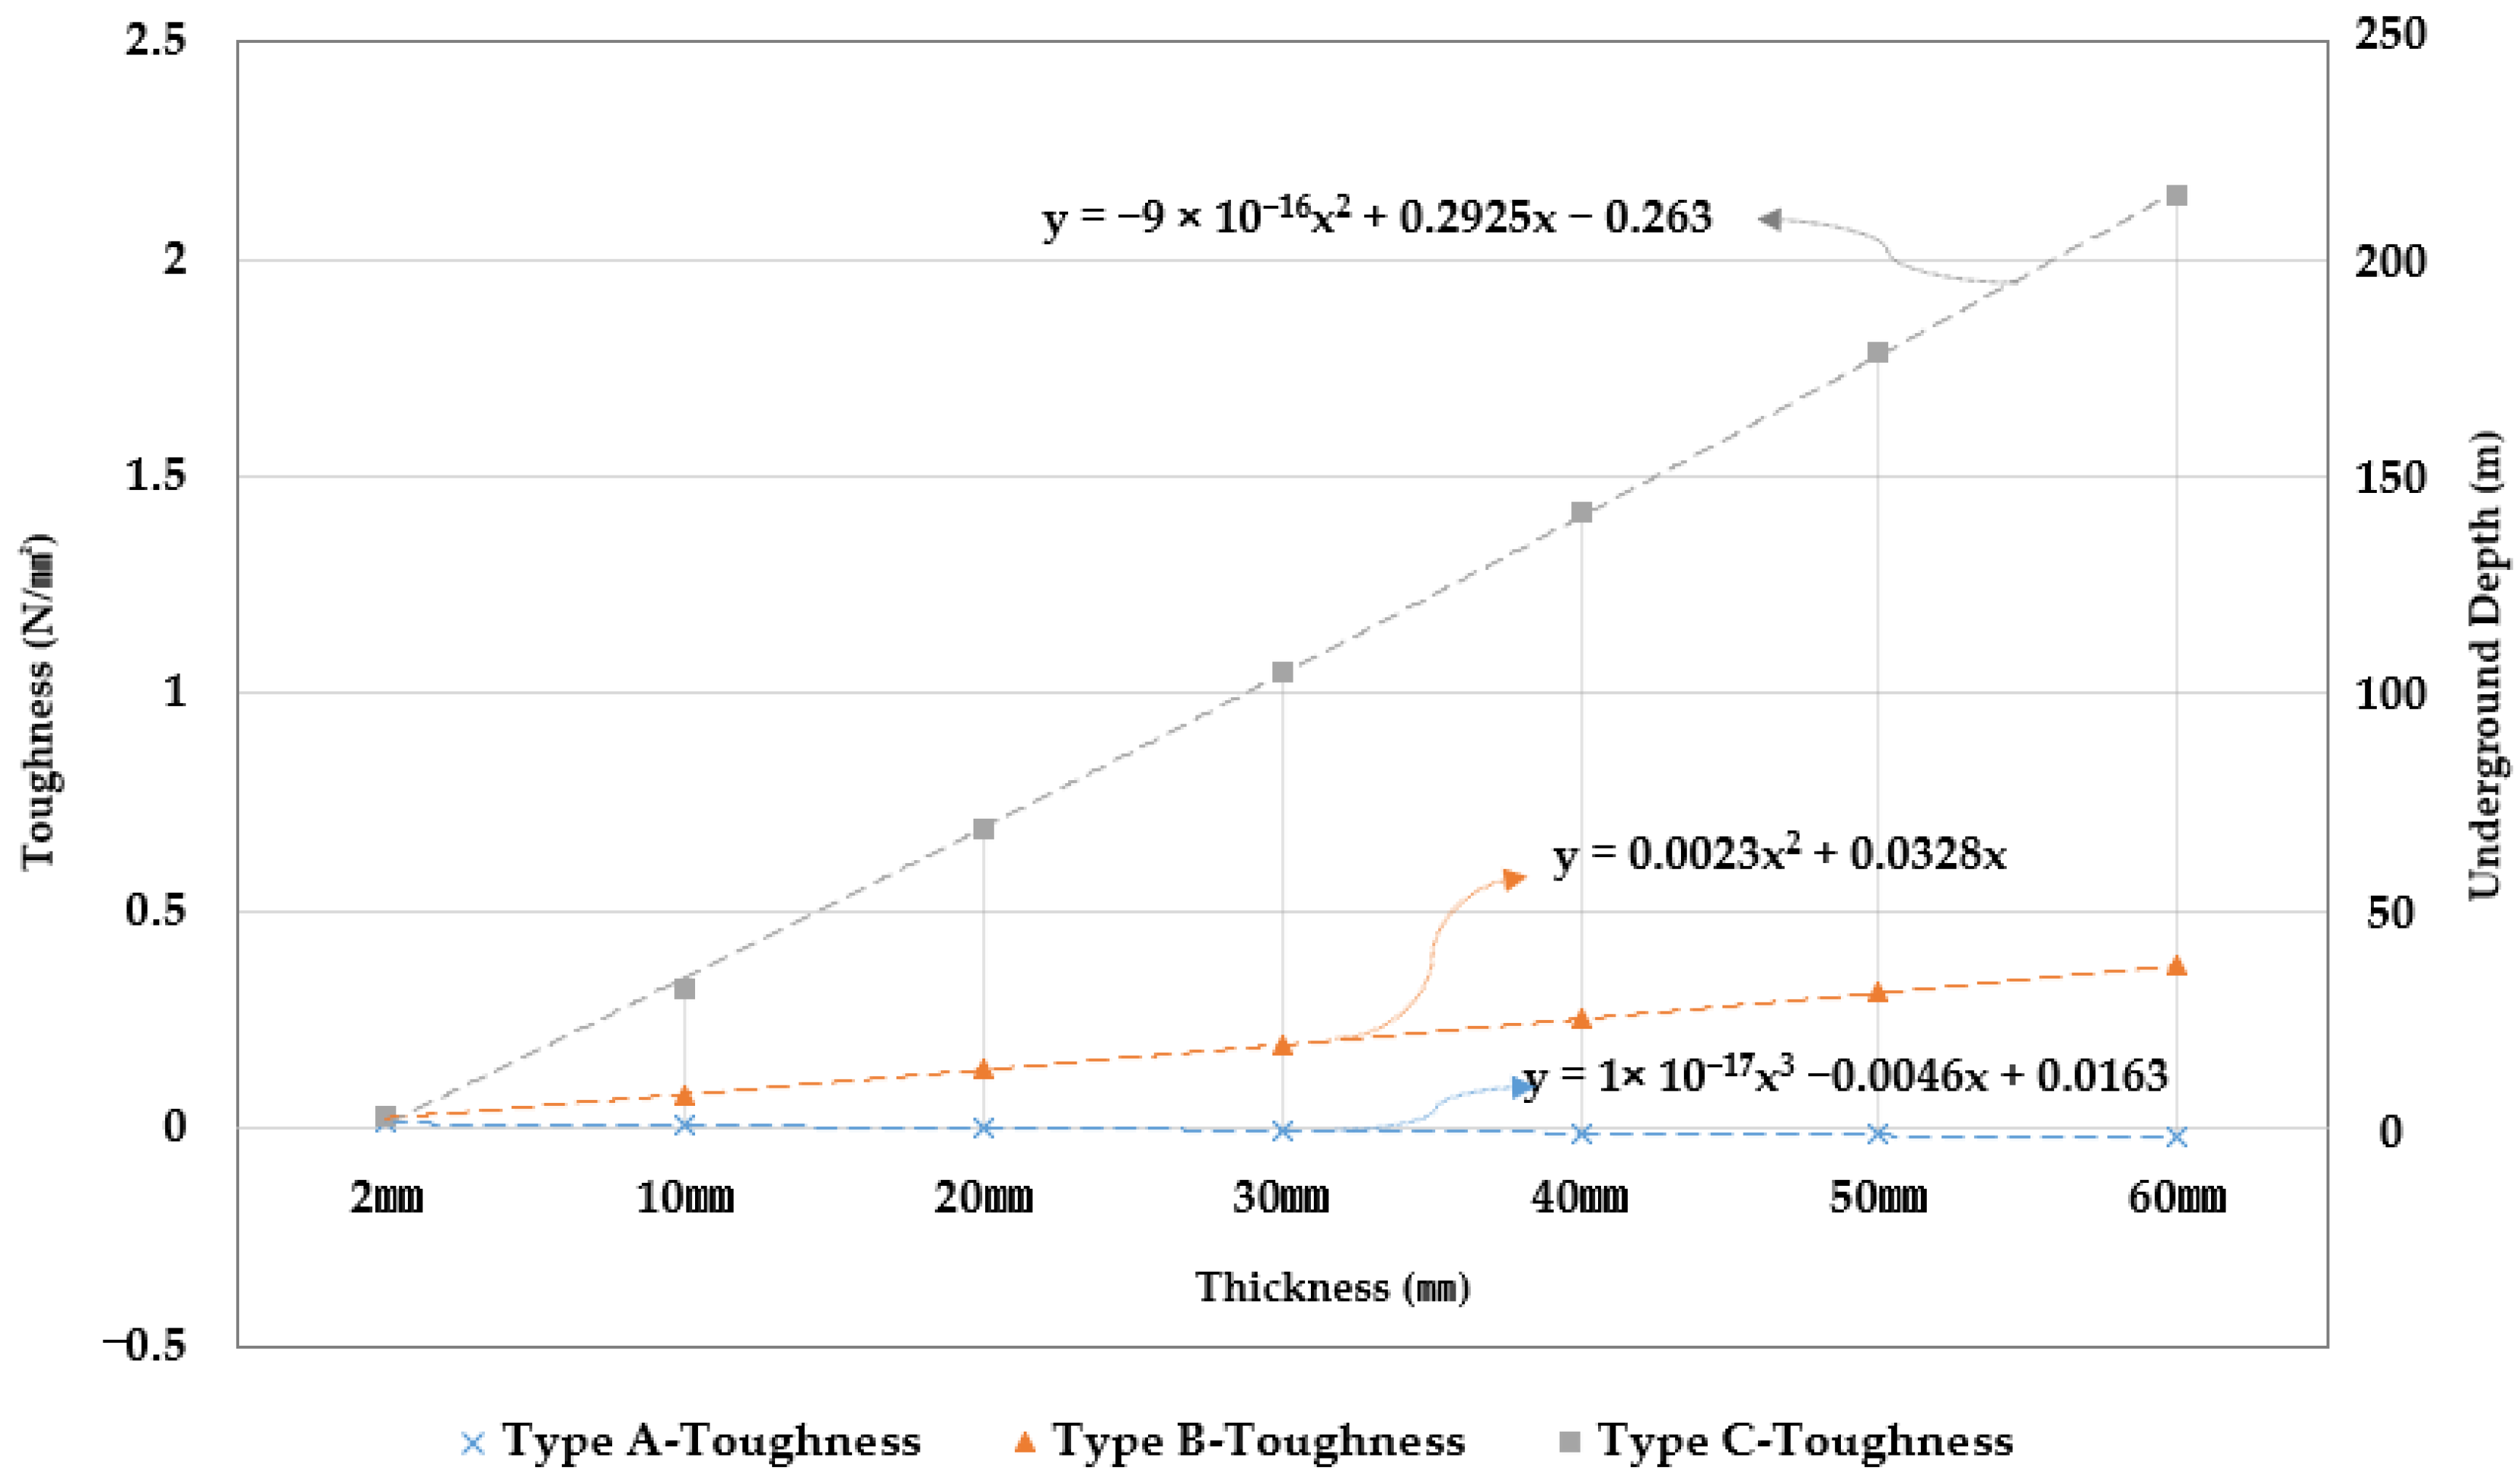
- Comparison of toughness
3.4. Prediction Result of Hydraulic Response
4. Conclusions
- (1)
- In this study, an experimental method to reproduce the behavior of cracks injected with SPRG type repair materials was presented. The adhesion and elongation of the leak repair material obtained through this experiment were interpreted as ‘toughness’ and ‘water pressure resistance’, and a theory that can be viewed as an equivalent physical force was presented;
- (2)
- Based on this method, a correlation between viscosity, cohesive strength, toughness, and hydraulic resistance of SPRG used as a leak crack repair material for concrete structures was presented. Based on this analysis, study results suggested the appropriate thickness to resist the water pressure in the underground depth for SPRG of high viscosity, medium viscosity, and low viscosity. In this regard, it was found that a thickness of about 28 mm or more was required for high-viscosity SPRG at 100 m underground, and it was found that even with the same thickness, a high-viscosity material can resist higher water pressure. Limited within the scope of this testing and the SPRG types investigated, it was found that the SPRG types from the highest hydraulic resistance to lowest hydraulic resistance is Type C > Type B > and Type A;
- (3)
- This study demonstrates that an evaluation method (test method) can be made possible to evaluate leakage repair materials and their hydraulic resistance performance in various underground water pressure conditions. Therefore, in the future, the work to use the correlation of viscosity, toughness, and water pressure resistance of the repair materials presented in this study as a practical evaluation standard will be promoted.
Author Contributions
Funding
Institutional Review Board Statement
Informed Consent Statement
Data Availability Statement
Conflicts of Interest
Abbreviations
| SPRG | Non-hardening viscoelastic synthetic polymer rubberized gel |
References
- Oh, S.-K.; Shim, J.-S. Maintenance for Leakage due to Cracking in Concrete Structures-Guidelines for Repair of Water-Leakage Cracks in Concrete Structures. J. Korea Concr. Inst. 2011, 23, 47–52. [Google Scholar]
- Chang, S.J. Advanced Technology of Waterproofing. J. Arch. Inst. Korea 2005, 49, 57–60. [Google Scholar]
- Oh, S.K.; Lee, J.H.; Song, J.Y.; Kim, S.Y. A Study on the Construction Detail of Waterproofing in Underground of Apartments. J. Korea Inst. Build. Constr. 2017, 17, 215–216. [Google Scholar]
- ISO TR 16475:2011; Guidelines for the Repair of Water-leakage Cracks in Concrete Structures. International Organization for Standardization Technical Committee 71 Subcommittee 7. International Organization for Standardization: Geneva, Switzerland, 2011.
- ISO TS 16774:2011 Parts 1–6; Guidelines for the Repair of Water-leakage Cracks in Concrete Structures. International Organization for Standardization Technical Committee 71 Subcommittee 7. International Organization for Standardization: Geneva, Switzerland, 2016.
- Kim, S.-Y.; Oh, S.-K.; Kim, B. Artificial-Crack-Behavior Test Evaluation of the Water-Leakage Repair Materials Used for the Repair of Water-Leakage Cracks in Concrete Structures. Appl. Sci. 2016, 6, 253. [Google Scholar] [CrossRef]
- Jiang, B.; Oh, K.-h.; Kim, S.-Y.; He, X.; Oh, S.-k. Technical Evaluation Method for Physical Property Changes due to Environmental Degradation of Grout-Injection Repair Materials for Water-Leakage Cracks. Appl. Sci. 2019, 9, 1740. [Google Scholar] [CrossRef]
- Lee, J.-Y.; Seo, H.-J.; Oh, K.-H.; Bo, J.; Oh, S.-K. Crack-Bridging Property Evaluation of Synthetic Polymerized Rubber Gel (SPRG) through Yield Stress Parameter Identification. Materials 2021, 14, 7599. [Google Scholar] [CrossRef] [PubMed]
- RE-Systems Group Americas. Polymer Rubber Gel Systems; Waterproof Magazine: Mapleton, UT, USA, 2014; pp. 26–29. Available online: https://www.waterproofmag.com/downloads/2014-04/WP_2014-04_Polymer_Rubber.pdf (accessed on 23 August 2021).
- Kim, S.-Y. Development of Artificial Crack Testing Method for Injection Type Repair Materials used in Leakage Cracks of Concrete Structure in Underground Environment. Ph.D. Thesis, Seoul National University of Science and Technology, Seoul, Korea, 2017. [Google Scholar]
- Eisinger, U.R.; Gutdeutsch, R.; Hammerl, C. Historical earthquake research–An example of interdisciplinary cooperation between geophysicists and historians. In Historical Earthquakes in Central Europe; Gutdeutsch, R., Grünthal, G., Musson, R.M.W., Eds.; Abhandlungen der Geologischen Bundesanstalt: Vienna, Austria, 1992; Volume 1, pp. 33–50. [Google Scholar]
- Musson, R.M.W. Intensity assignments from historical earthquake data: Issues of certainty and quality. Ann. Geofis. 1998, 41, 79–91. [Google Scholar]
- Kim, S.Y.; Kim, M.J.; Oh, S.K. A Study on the Seismic Performance Design of Waterproofing Materials Applied Single-side Walls on Underground Structures. J. Korea Inst. Struct. Maint. Insp. 2020, 24, 43–50. [Google Scholar] [CrossRef]
- KCS 41 40 13 Underground Exterior Waterproofing Construction. Available online: http://www.wiss.re.kr/bbs/board.php?bo_table=specification&wr_id=15 (accessed on 22 August 2022).
- KCS 41 40 19 Adhesive Flexible Sheet Waterproofing Construction. Available online: https://www.kcsc.re.kr/StandardCode/Viewer/848 (accessed on 16 August 2022).
- Korea Land & Housing Corporation. Establishment of Measures to Improve Quality of House Waterproofing Methods for Zero Defects in Quality Management; Public Housing Project Office: Seoul, Korea, 2017; pp. 1–3. [Google Scholar]
- Oh, S.K.; Lee, J.Y.; Choi, S.M. An Experimental Study on the Highly Adhesive Composite Waterproofing Sheet using Reclaimed Rubber. J. Archit. Inst. Korea 2014, 16, 279–284. [Google Scholar]
- Ahn, D.S. A Study on the Physical Properties Change of Synthetic Rubber Polymer Gel by Using Stirring Screw Mixer. Ph.D. Thesis, Seoul National University of Science and Technology, Seoul, Korea, 2015. [Google Scholar]
- BS 8102; 2009 Code of Practice for Protection of Below Ground Structures Against Water from the Ground. British Standards Institution: London, UK, 2009.
- ASTM D7832/D7832M-14; Standard Guide for Performance Attributes of Waterproofing Membranes Applied to Below-Grade Walls/Vertical Surfaces (Enclosing Interior Spaces). ASTM International: West Conshohocken, PA, USA, 2014. Available online: www.astm.org (accessed on 9 August 2022).
- Zakari, N.; Muhammad-Keyvanfar, A.; Muhd-Zaimi-Abd, M.; Shafaghat, A.; Mirza, J. Waterproof Performance of Concrete: A Critical Review on Implemented Approaches. Constr. Build. Mater. 2015, 101, 80–90. [Google Scholar]
- ELsawy, M.M.; Taher, M.S.; Ebraheme, A.A.; Farag, R.K.; Saleh, A.M.M. Improvement Performance of Soft Bitumen for Coating Applications. Constr. Build. Mater. 2016, 128, 47–56. [Google Scholar] [CrossRef]
- Newman, E.; Kegel, K.; Pattermann, K. Design and Construction of a Secant-Pile Cutoff Wall in Variable Ground Conditions. In Conference Paper; USSD: Louisville, Kentucky, USA, 2015. [Google Scholar]
- Blakeley, R.W.G.; Megget, L.M.; Priestley, M.J.N. Seismic performance of two full size reinforced concrete beam-column joints. Bull. N. Z. Soc. Earthq. Eng. 1975, 8, 38–69. [Google Scholar] [CrossRef]
- Kent, D.C.; Park, R. Inelastic behaviour of reinforced concrete members with cyclic loading. Bull. N. Z. Soc. Earthq. Eng. 1971, 4, 108–127. [Google Scholar] [CrossRef]
- Mestyanek, J.M. The Earthquake Resistance of Reinforced Concrete Structural Walls of Limited Ductility. Ph.D. Thesis, University of Canterbury, Christchurch, New Zealand, 1986. [Google Scholar]
- Peter, B.; Robert, E.; Rainer, K. Seismic Wave Propagation and Earth Models. 2012. Available online: https://gfzpublic.gfz-potsdam.de/rest/items/item_65558/component/file_364130/content (accessed on 23 July 2021). [CrossRef]


| Type A | Type B | Type C | ||
|---|---|---|---|---|
| Composition | Waste oil | 24% | 22.5% | 20% |
| Waste rubber | 6% | 7.5% | 10% | |
| Asphalt | 35% | 35% | 35% | |
| Tackifier | 10% | 10% | 10% | |
| Asphalt modifier | 5% | 5% | 5% | |
| Filler | 20% | 20% | 20% | |
| Total | 100% | 100% | 100% | |
| Viscosity | 1.8~2.1 million cP | 3.5~3.8 million cP | 5.0~5.3 million cP | |
| Remark | Low viscosity | Medium viscosity | High viscosity | |
| Test Condition | Temperature | Thickness | Test Speed |
| 5 °C, 10 °C, 20 °C | 2 mm, 10 mm | 20 mm/min |
| Specimen Types | Temperature (°C) | Cohesive Strength [N/mm2] | Avg. Cohesive Strength [N/mm2] | Elongation [%] | Average Elongation [%] | Toughness [N/mm2] | Average Toughness [N/mm2] |
|---|---|---|---|---|---|---|---|
| Type A | 5 | 0.0170 | 0.0195 | 1297 | 1141 | 0.0138 | 0.0123 |
| 0.0175 | 1002 | 0.0110 | |||||
| 0.0242 | 1125 | 0.0122 | |||||
| 10 | 0.012 | 0.0115 | 1221 | 1400 | 0.0105 | 0.0117 | |
| 0.0097 | 1571 | 0.0119 | |||||
| 0.0128 | 1398 | 0.0129 | |||||
| 20 | 0.0125 | 0.0136 | 106 | 695 | 0.0035 | 0.0033 | |
| 0.0134 | 849 | 0.0038 | |||||
| 0.0148 | 1129 | 0.0026 | |||||
| Type B | 5 | 0.0236 | 0.0213 | 1589 | 1409 | 0.0298 | 0.0294 |
| 0.0169 | 2013 | 0.0359 | |||||
| 0.0237 | 626 | 0.0226 | |||||
| 10 | 0.0194 | 0.0251 | 1358 | 1369 | 0.0167 | 0.0270 | |
| 0.0276 | 1373 | 0.0324 | |||||
| 0.0284 | 1377 | 0.0318 | |||||
| 20 | 0.0220 | 0.0186 | 804 | 811 | 0.0059 | 0.0057 | |
| 0.0179 | 959 | 0.0051 | |||||
| 0.0160 | 671 | 0.0060 | |||||
| Type C | 5 | 0.0327 | 0.0296 | 1602 | 806 | 0.0379 | 0.0309 |
| 0.0282 | 305 | 0.0271 | |||||
| 0.028 | 512 | 0.0276 | |||||
| 10 | 0.0375 | 0.0342 | 532 | 583 | 0.0377 | 0.0295 | |
| 0.036 | 290 | 0.0260 | |||||
| 0.0291 | 928 | 0.0247 | |||||
| 20 | 0.0251 | 0.0216 | 1881 | 1667 | 0.0392 | 0.0368 | |
| 0.0143 | 1817 | 0.0336 | |||||
| 0.0253 | 1304 | 0.0377 |
| Specimen Types | Temperature (°C) | Cohesive Strength [N/mm2] | Avg. Cohesive Strength [N/ mm2] | Elongation [%] | Average Elongation [%] | Toughness [N/ mm2] | Average Toughness [N/ mm2] |
|---|---|---|---|---|---|---|---|
| Type A | 5 | 0.0051 | 0.0046 | 3009 | 3075 | 0.0243 | 0.0192 |
| 0.0050 | 3348 | 0.0172 | |||||
| 0.0037 | 2870 | 0.0160 | |||||
| 10 | 0.0029 | 0.0030 | 3341 | 3076 | 0.0073 | 0.0071 | |
| 0.0029 | 3009 | 0.0066 | |||||
| 0.0033 | 2879 | 0.0074 | |||||
| 20 | 0.0033 | 0.0031 | 2844 | 2920 | 0.0063 | 0.0067 | |
| 0.0025 | 2931 | 0.0048 | |||||
| 0.0036 | 2986 | 0.0089 | |||||
| Type B | 5 | 0.0102 | 0.0092 | 1648 | 2127 | 0.1422 | 0.1229 |
| 0.0085 | 2276 | 0.1243 | |||||
| 0.0088 | 2456 | 0.1021 | |||||
| 10 | 0.0083 | 0.0080 | 2184 | 2412 | 0.0785 | 0.0747 | |
| 0.0071 | 2960 | 0.0794 | |||||
| 0.0087 | 2093 | 0.0661 | |||||
| 20 | 0.0063 | 0.0071 | 2093 | 2147 | 0.0374 | 0.0352 | |
| 0.0081 | 2316 | 0.0363 | |||||
| 0.0069 | 2032 | 0.0321 | |||||
| Type C | 5 | 0.0286 | 0.0289 | 517 | 1465 | 0.2461 | 0.2062 |
| 0.0417 | 476 | 0.2222 | |||||
| 0.0163 | 3402 | 0.1503 | |||||
| 10 | 0.0252 | 0.0286 | 4680 | 5254 | 0.3236 | 0.3220 | |
| 0.0191 | 6445 | 0.3204 | |||||
| 0.0415 | 4637 | 0.3218 | |||||
| 20 | 0.0177 | 0.0161 | 10443 | 9490 | 0.2570 | 0.2703 | |
| 0.0153 | 7828 | 0.2913 | |||||
| 0.0152 | 10200 | 0.2627 |
| Specimen Types | Thickness | Temperature (°C) | Avg. Cohesive Strength [N/ mm2] | Average Elongation [%] | Average Toughness [N/mm2] |
|---|---|---|---|---|---|
| Type A | 2 mm | 5 °C | 0.0195 | 1141 | 0.0123 |
| 10 °C | 0.0115 | 1400 | 0.0117 | ||
| 20 °C | 0.0136 | 695 | 0.0033 | ||
| 10 mm | 5 °C | 0.0046 | 3075 | 0.0192 | |
| 10 °C | 0.003 | 3076 | 0.0071 | ||
| 20 °C | 0.0031 | 2920 | 0.0067 | ||
| Type B | 2 mm | 5 °C | 0.0213 | 1409 | 0.0294 |
| 10 °C | 0.0251 | 1369 | 0.027 | ||
| 20 °C | 0.0186 | 811 | 0.0057 | ||
| 10 mm | 5 °C | 0.0092 | 2127 | 0.1229 | |
| 10 °C | 0.008 | 2412 | 0.0747 | ||
| 20 °C | 0.0071 | 2147 | 0.0352 | ||
| Type C | 2 mm | 5 °C | 0.0296 | 806 | 0.0309 |
| 10 °C | 0.0342 | 583 | 0.0295 | ||
| 20 °C | 0.0216 | 1667 | 0.0368 | ||
| 10 mm | 5 °C | 0.0289 | 1465 | 0.2062 | |
| 10 °C | 0.0286 | 5254 | 0.322 | ||
| 20 °C | 0.0161 | 9490 | 0.2703 |
| Specimen Type | Thickness (mm) | Temperature (°C) | Average Toughness [N/mm2] | Expected Resistance Capacity Relative to Underground Depth [m] |
|---|---|---|---|---|
| Type A | 2 | 5 | 0.0123 | 1.2 |
| 10 | 0.0117 | 1.2 | ||
| 20 | 0.0033 | 0.3 | ||
| 10 | 5 | 0.0192 | 1.9 | |
| 10 | 0.0071 | 0.1 | ||
| 20 | 0.0067 | 0.1 | ||
| Type B | 2 | 5 | 0.0294 | 2.9 |
| 10 | 0.0270 | 2.7 | ||
| 20 | 0.0057 | 0.6 | ||
| 10 | 5 | 0.1229 | 12.3 | |
| 10 | 0.0747 | 7.5 | ||
| 20 | 0.0352 | 3.5 | ||
| Type C | 2 | 5 | 0.0309 | 3.1 |
| 10 | 0.0295 | 3.0 | ||
| 20 | 0.0368 | 3.7 | ||
| 10 | 5 | 0.2062 | 20.6 | |
| 10 | 0.3220 | 32.2 | ||
| 20 | 0.2703 | 27.0 |
Publisher’s Note: MDPI stays neutral with regard to jurisdictional claims in published maps and institutional affiliations. |
© 2022 by the authors. Licensee MDPI, Basel, Switzerland. This article is an open access article distributed under the terms and conditions of the Creative Commons Attribution (CC BY) license (https://creativecommons.org/licenses/by/4.0/).
Share and Cite
Seo, H.; Oh, K.; Lee, J.; Bo, J.; Kim, B.; Oh, S. Hydraulic Resistance Analysis Based on Cohesive Strength and Toughness of Synthetic Polymerized Rubber Gel Used as Water-Leakage Repair Material for Concrete Structures. Appl. Sci. 2022, 12, 9814. https://doi.org/10.3390/app12199814
Seo H, Oh K, Lee J, Bo J, Kim B, Oh S. Hydraulic Resistance Analysis Based on Cohesive Strength and Toughness of Synthetic Polymerized Rubber Gel Used as Water-Leakage Repair Material for Concrete Structures. Applied Sciences. 2022; 12(19):9814. https://doi.org/10.3390/app12199814
Chicago/Turabian StyleSeo, Hyunjae, Kyuhwan Oh, Jongyong Lee, Jiang Bo, Byoungil Kim, and Sangkeun Oh. 2022. "Hydraulic Resistance Analysis Based on Cohesive Strength and Toughness of Synthetic Polymerized Rubber Gel Used as Water-Leakage Repair Material for Concrete Structures" Applied Sciences 12, no. 19: 9814. https://doi.org/10.3390/app12199814
APA StyleSeo, H., Oh, K., Lee, J., Bo, J., Kim, B., & Oh, S. (2022). Hydraulic Resistance Analysis Based on Cohesive Strength and Toughness of Synthetic Polymerized Rubber Gel Used as Water-Leakage Repair Material for Concrete Structures. Applied Sciences, 12(19), 9814. https://doi.org/10.3390/app12199814