

Study of the Subsidence Width Influence on the Geotextile Control of a Subgrade Collapse Based on a Half-Symmetric Model Test


Abstract
:1. Introduction
2. Research Methods
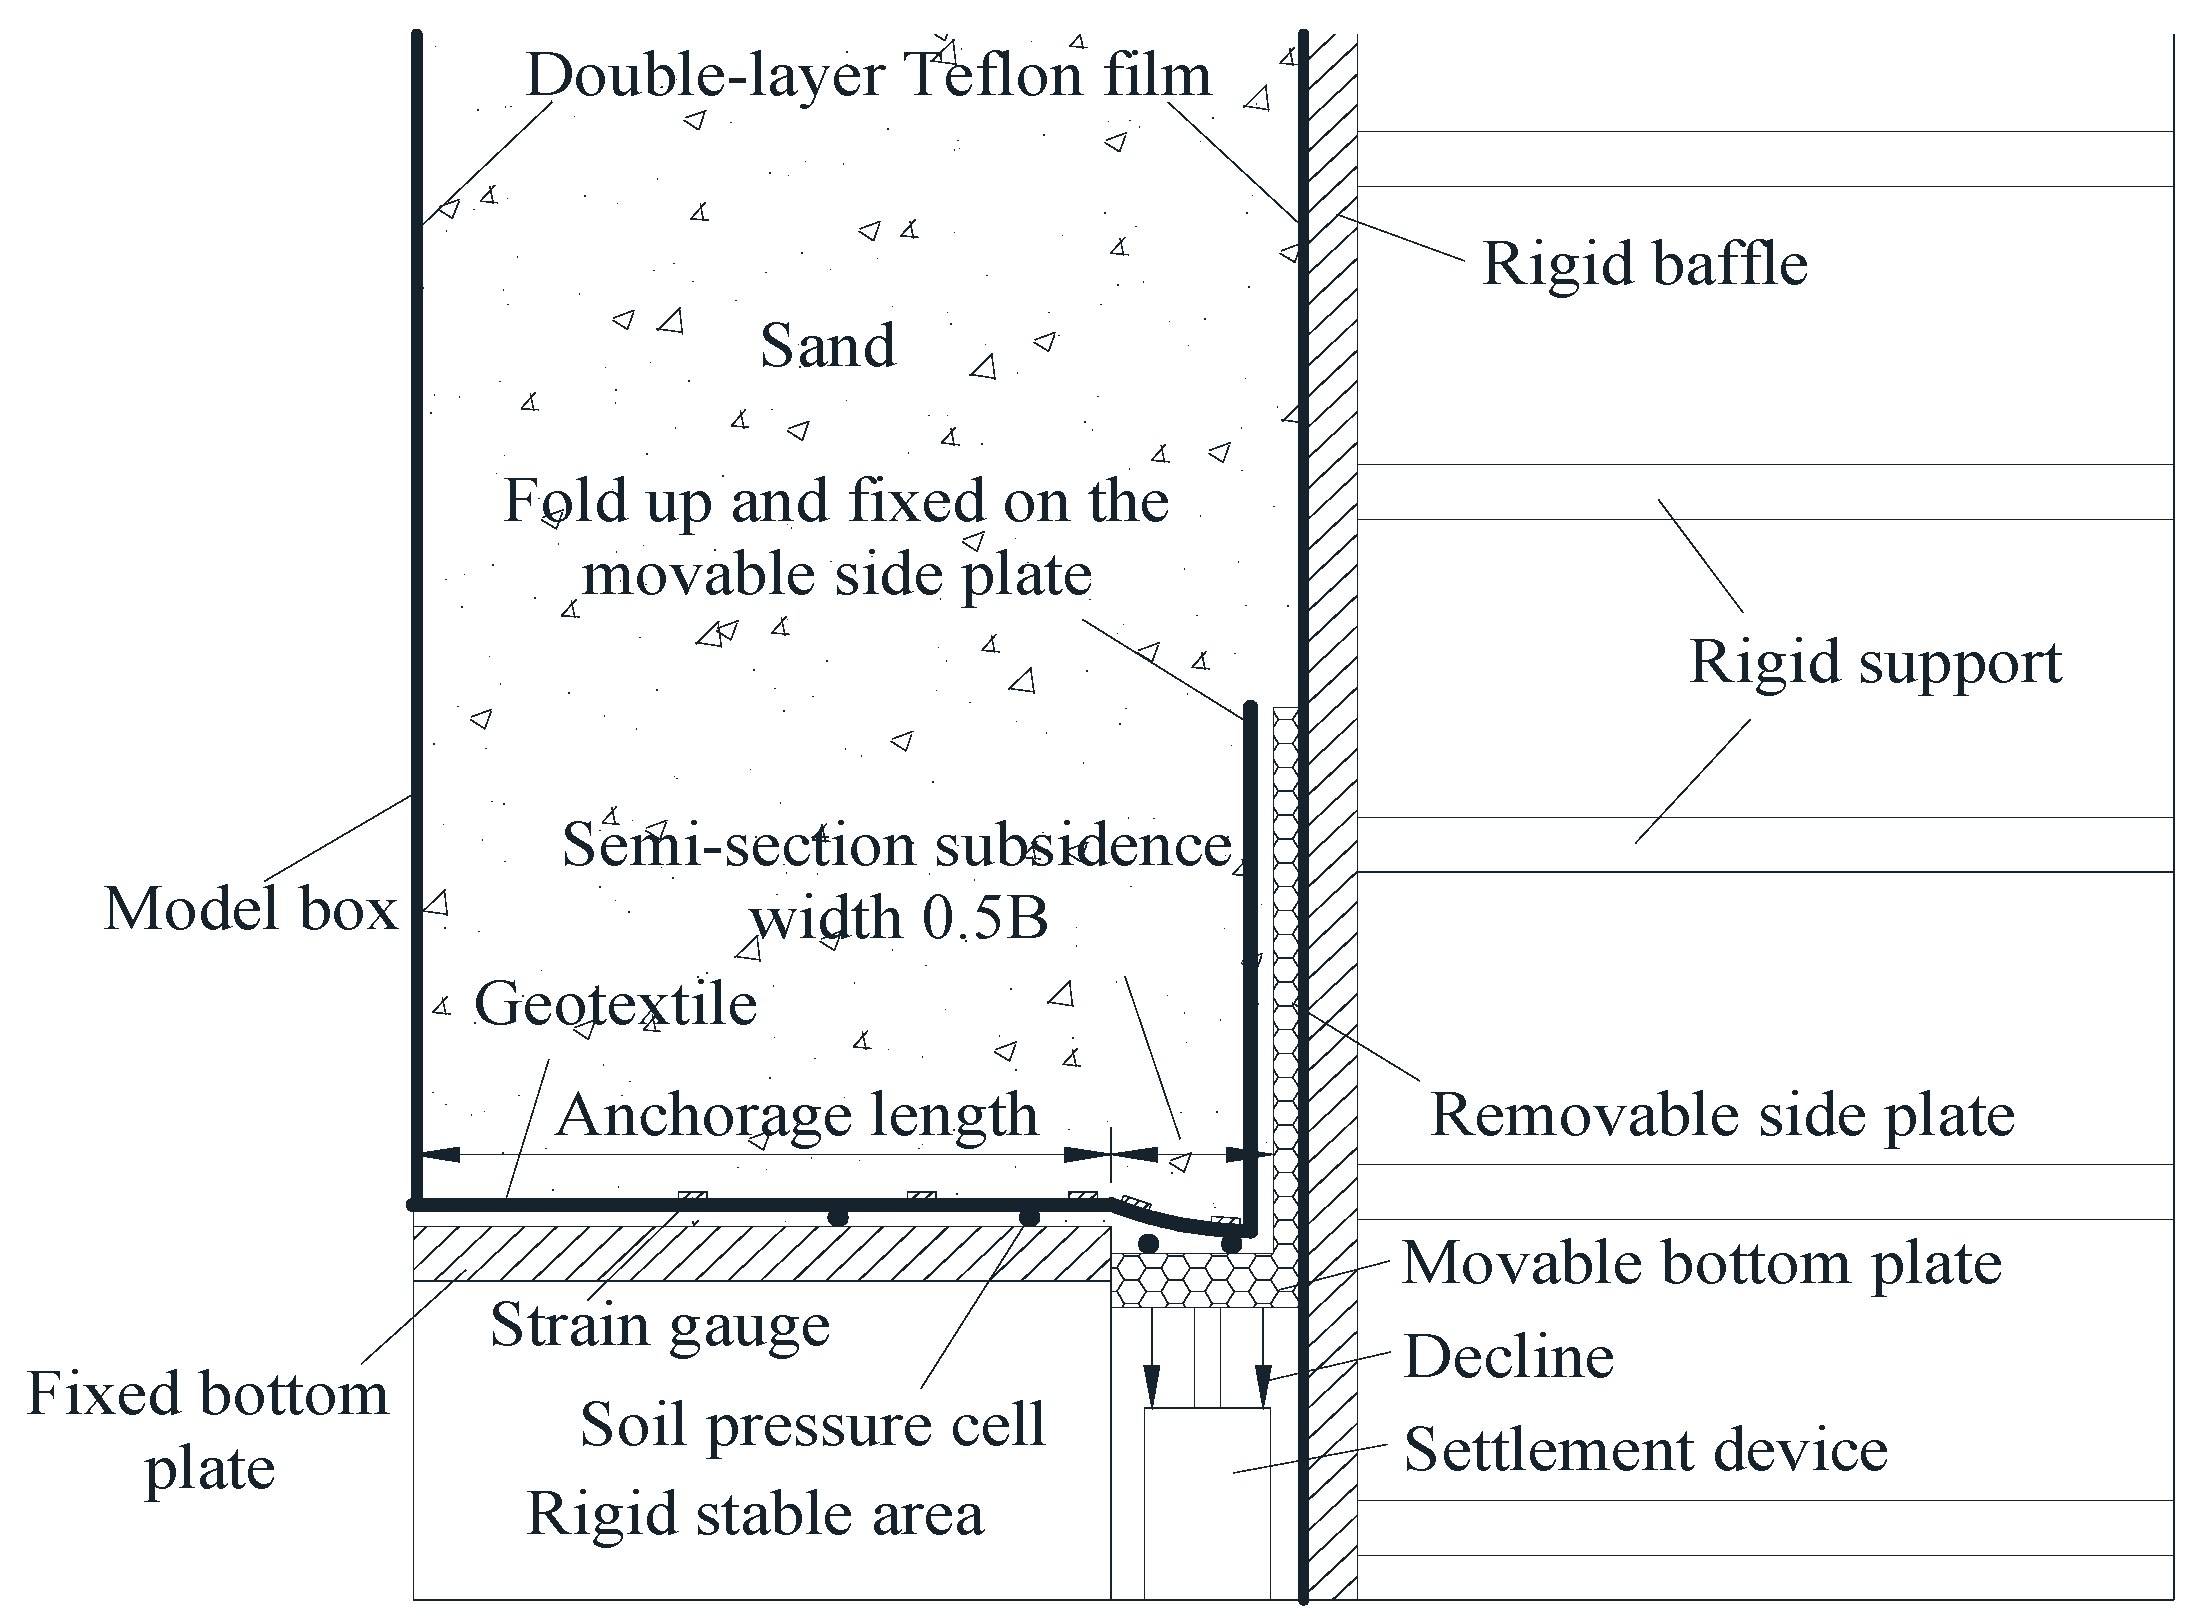
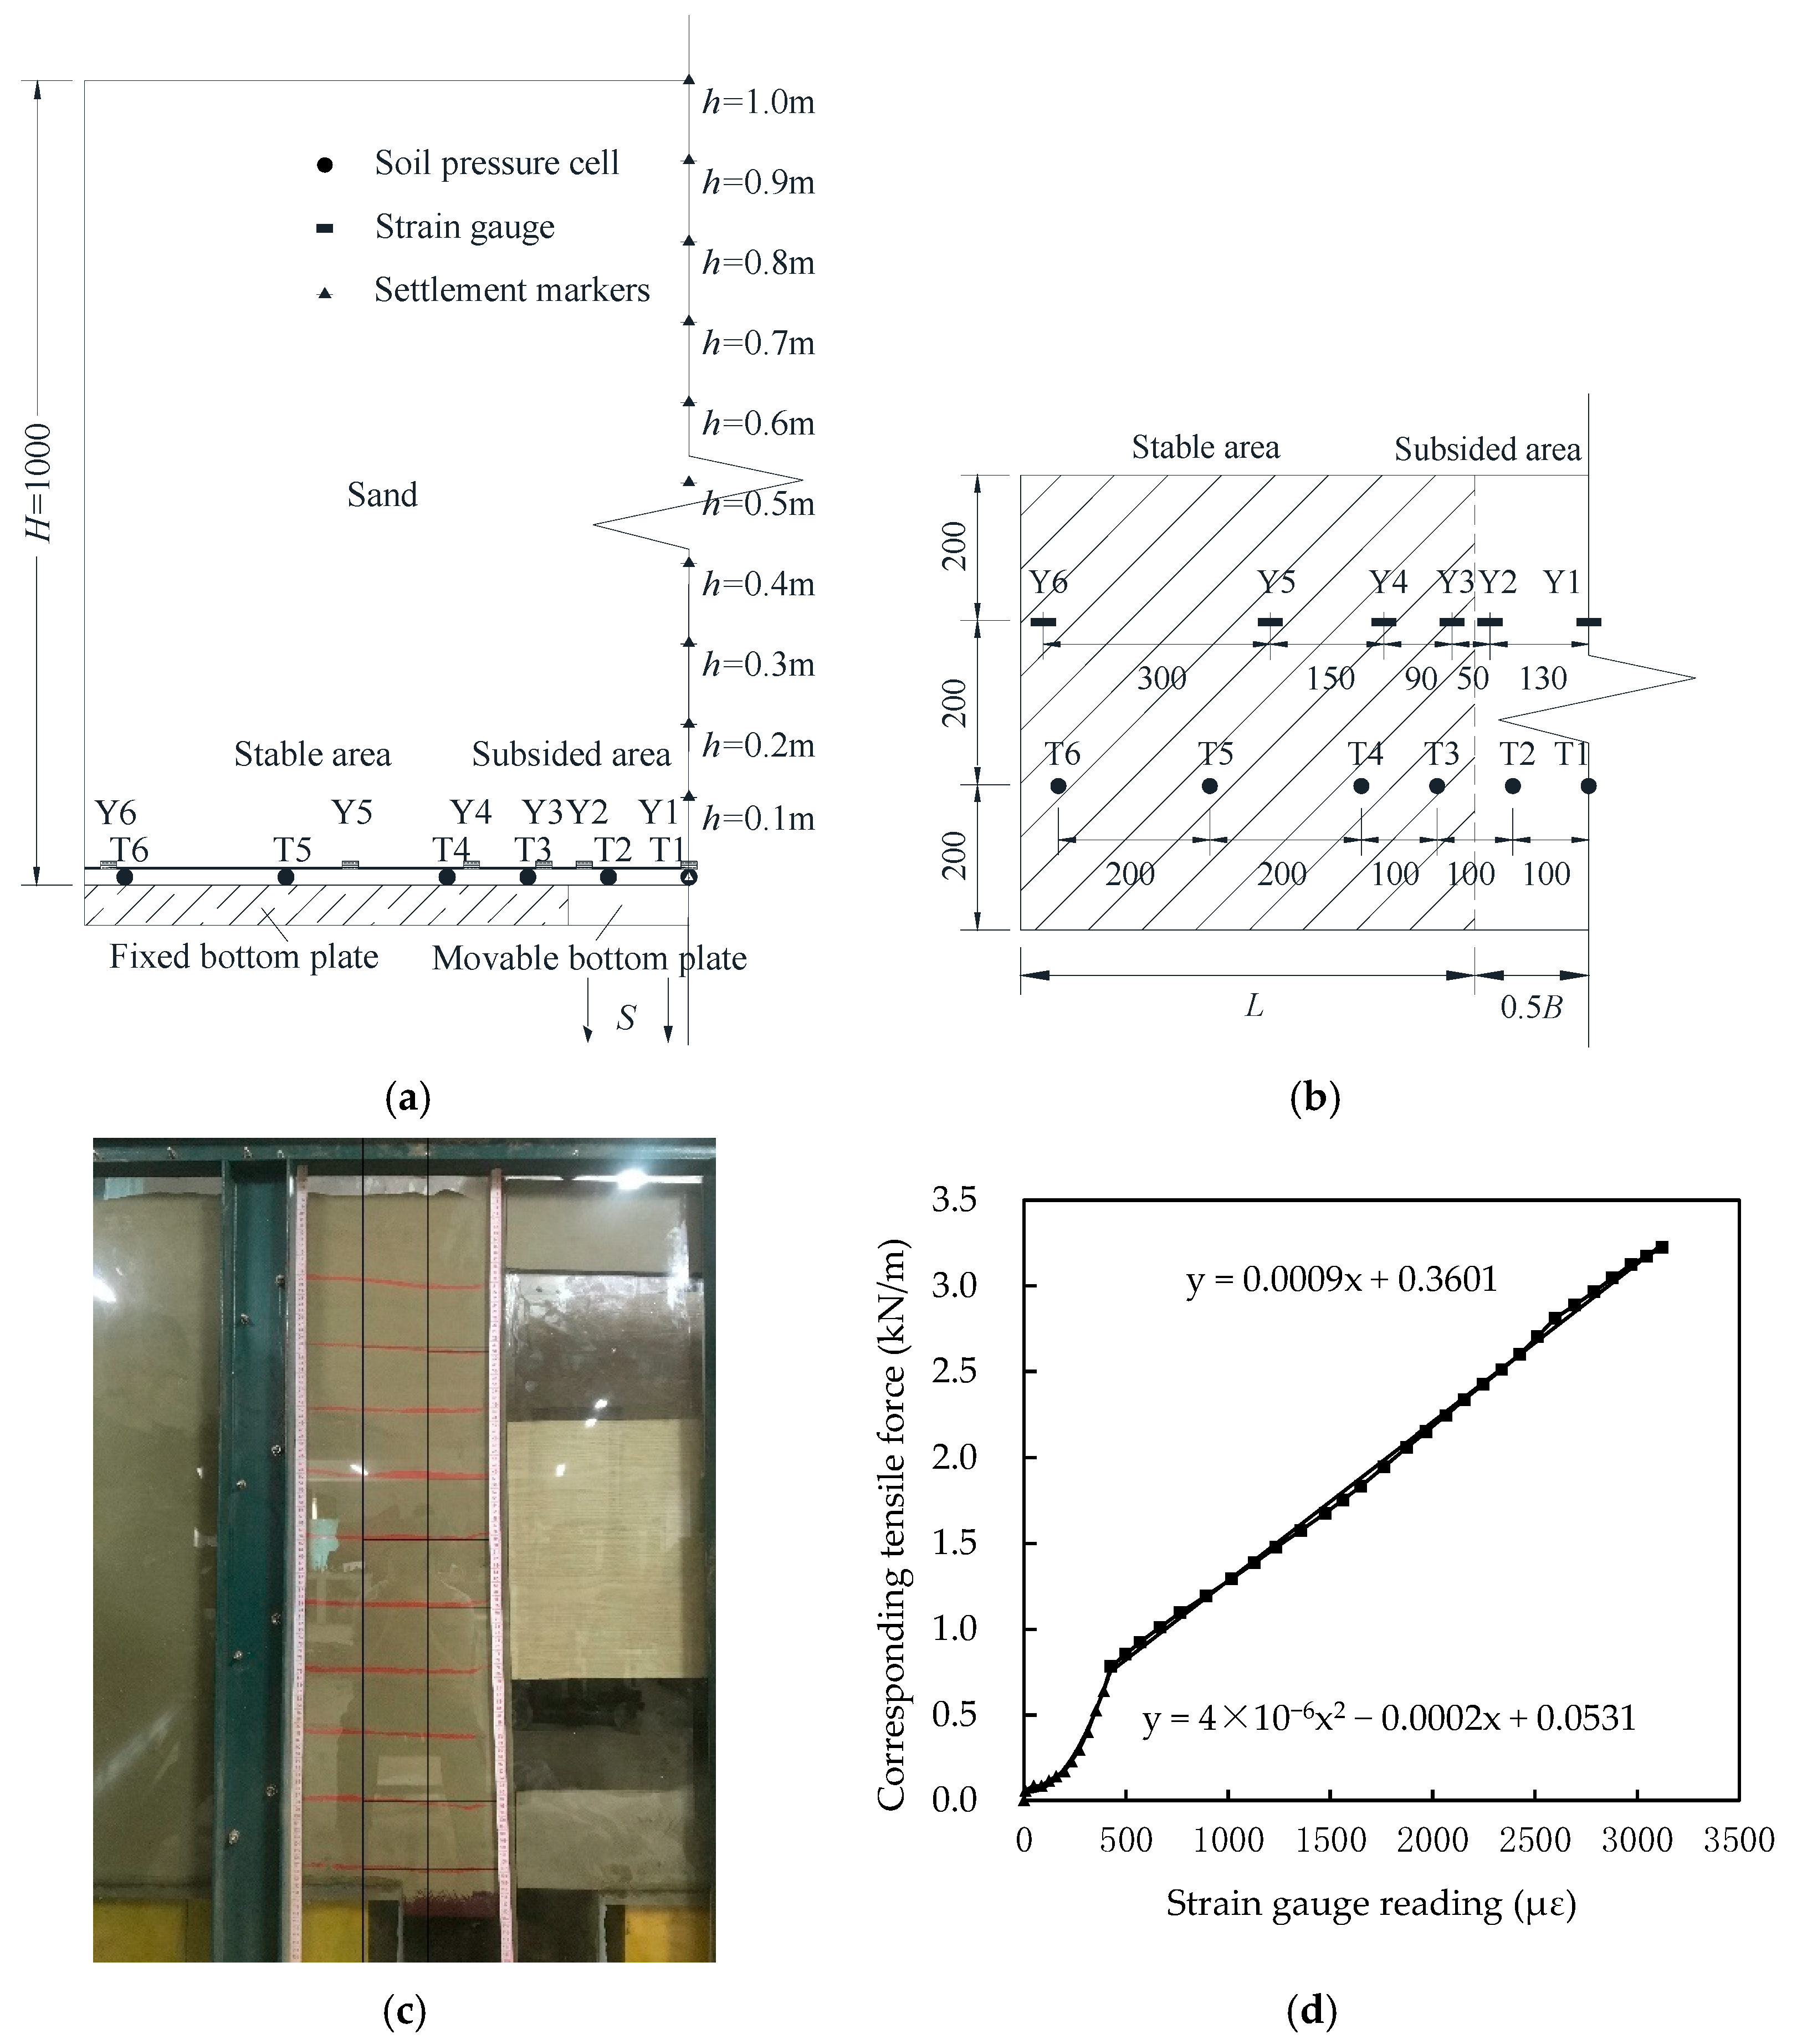
2.1. Model Test
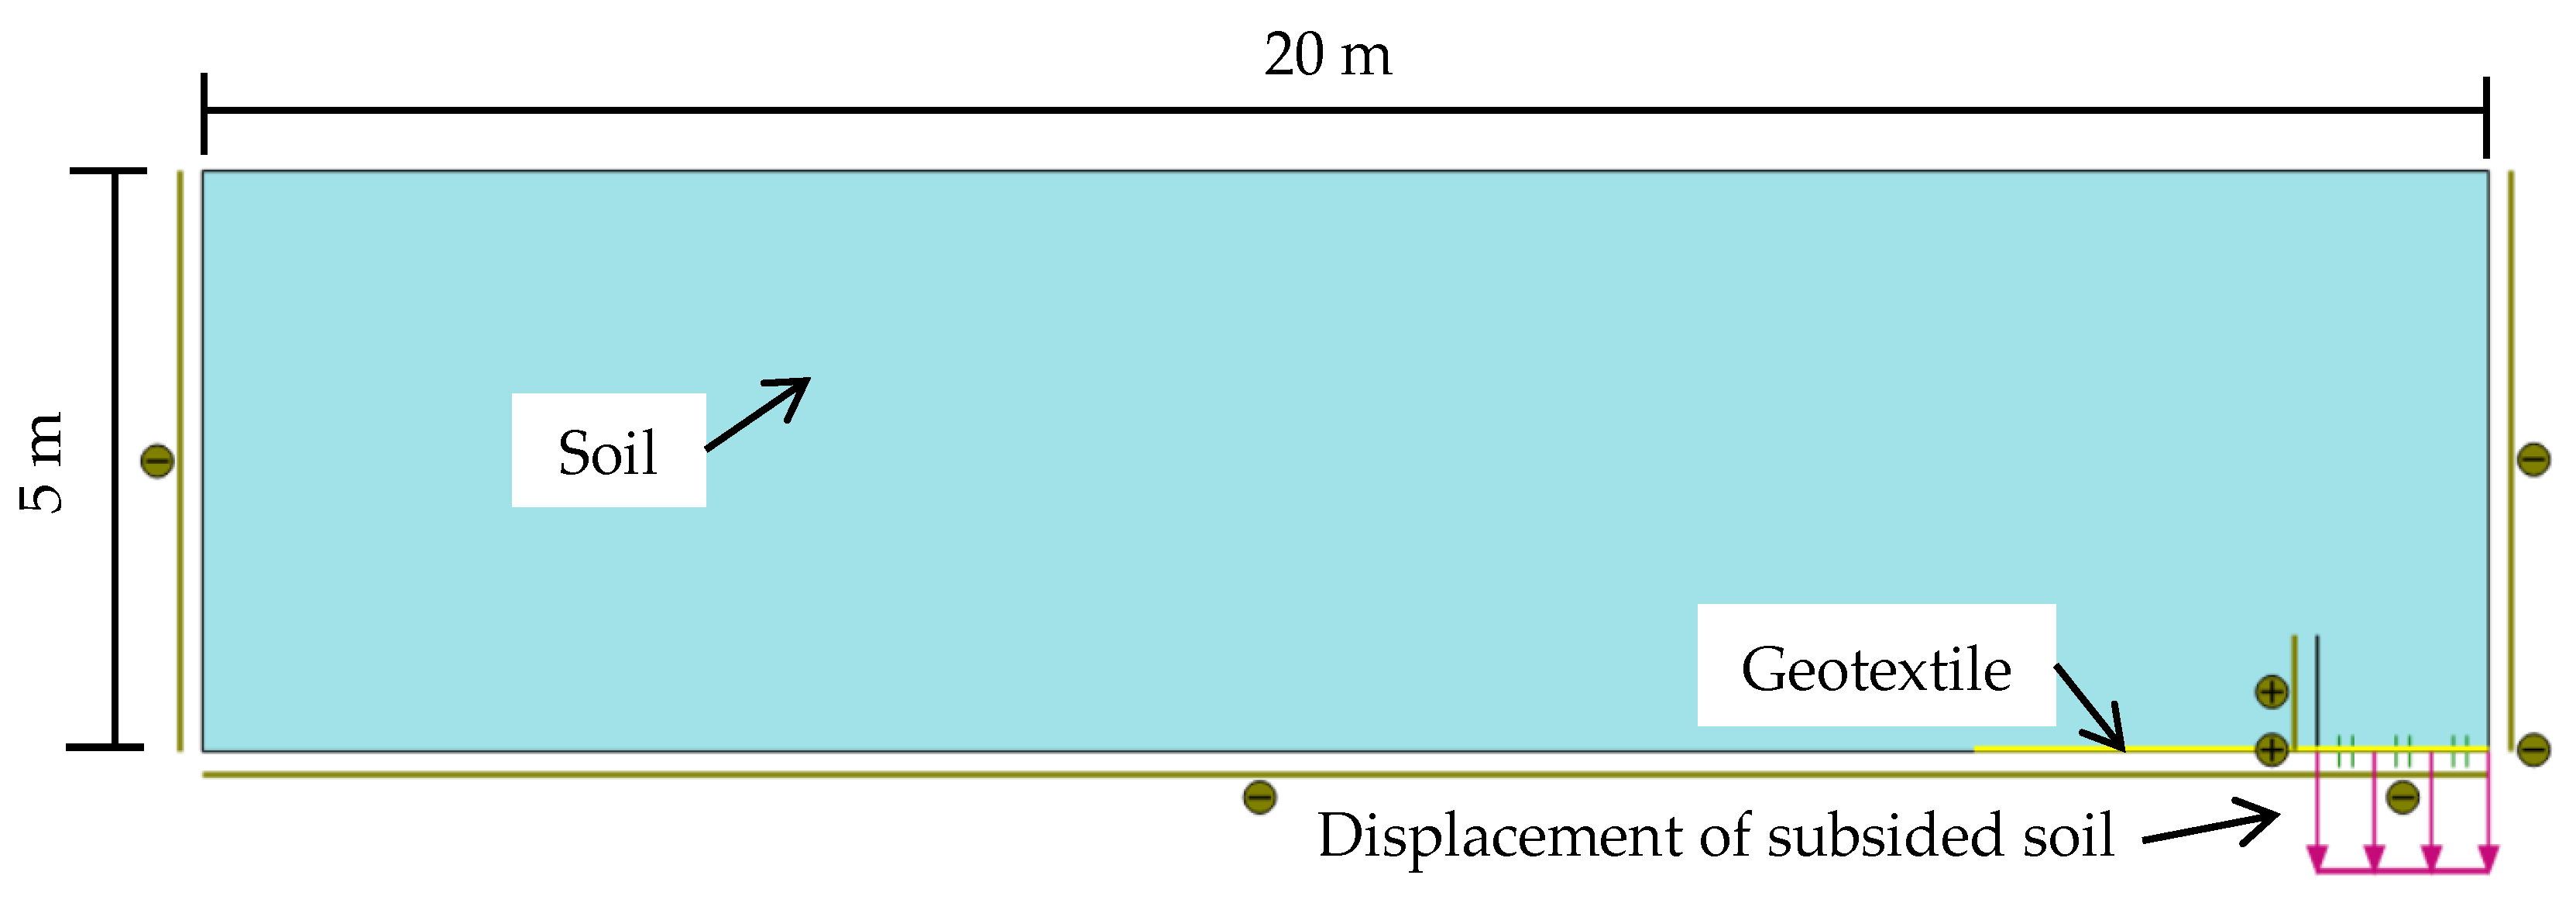
2.2. Numerical Modeling
3. Experiment Results and Analysis
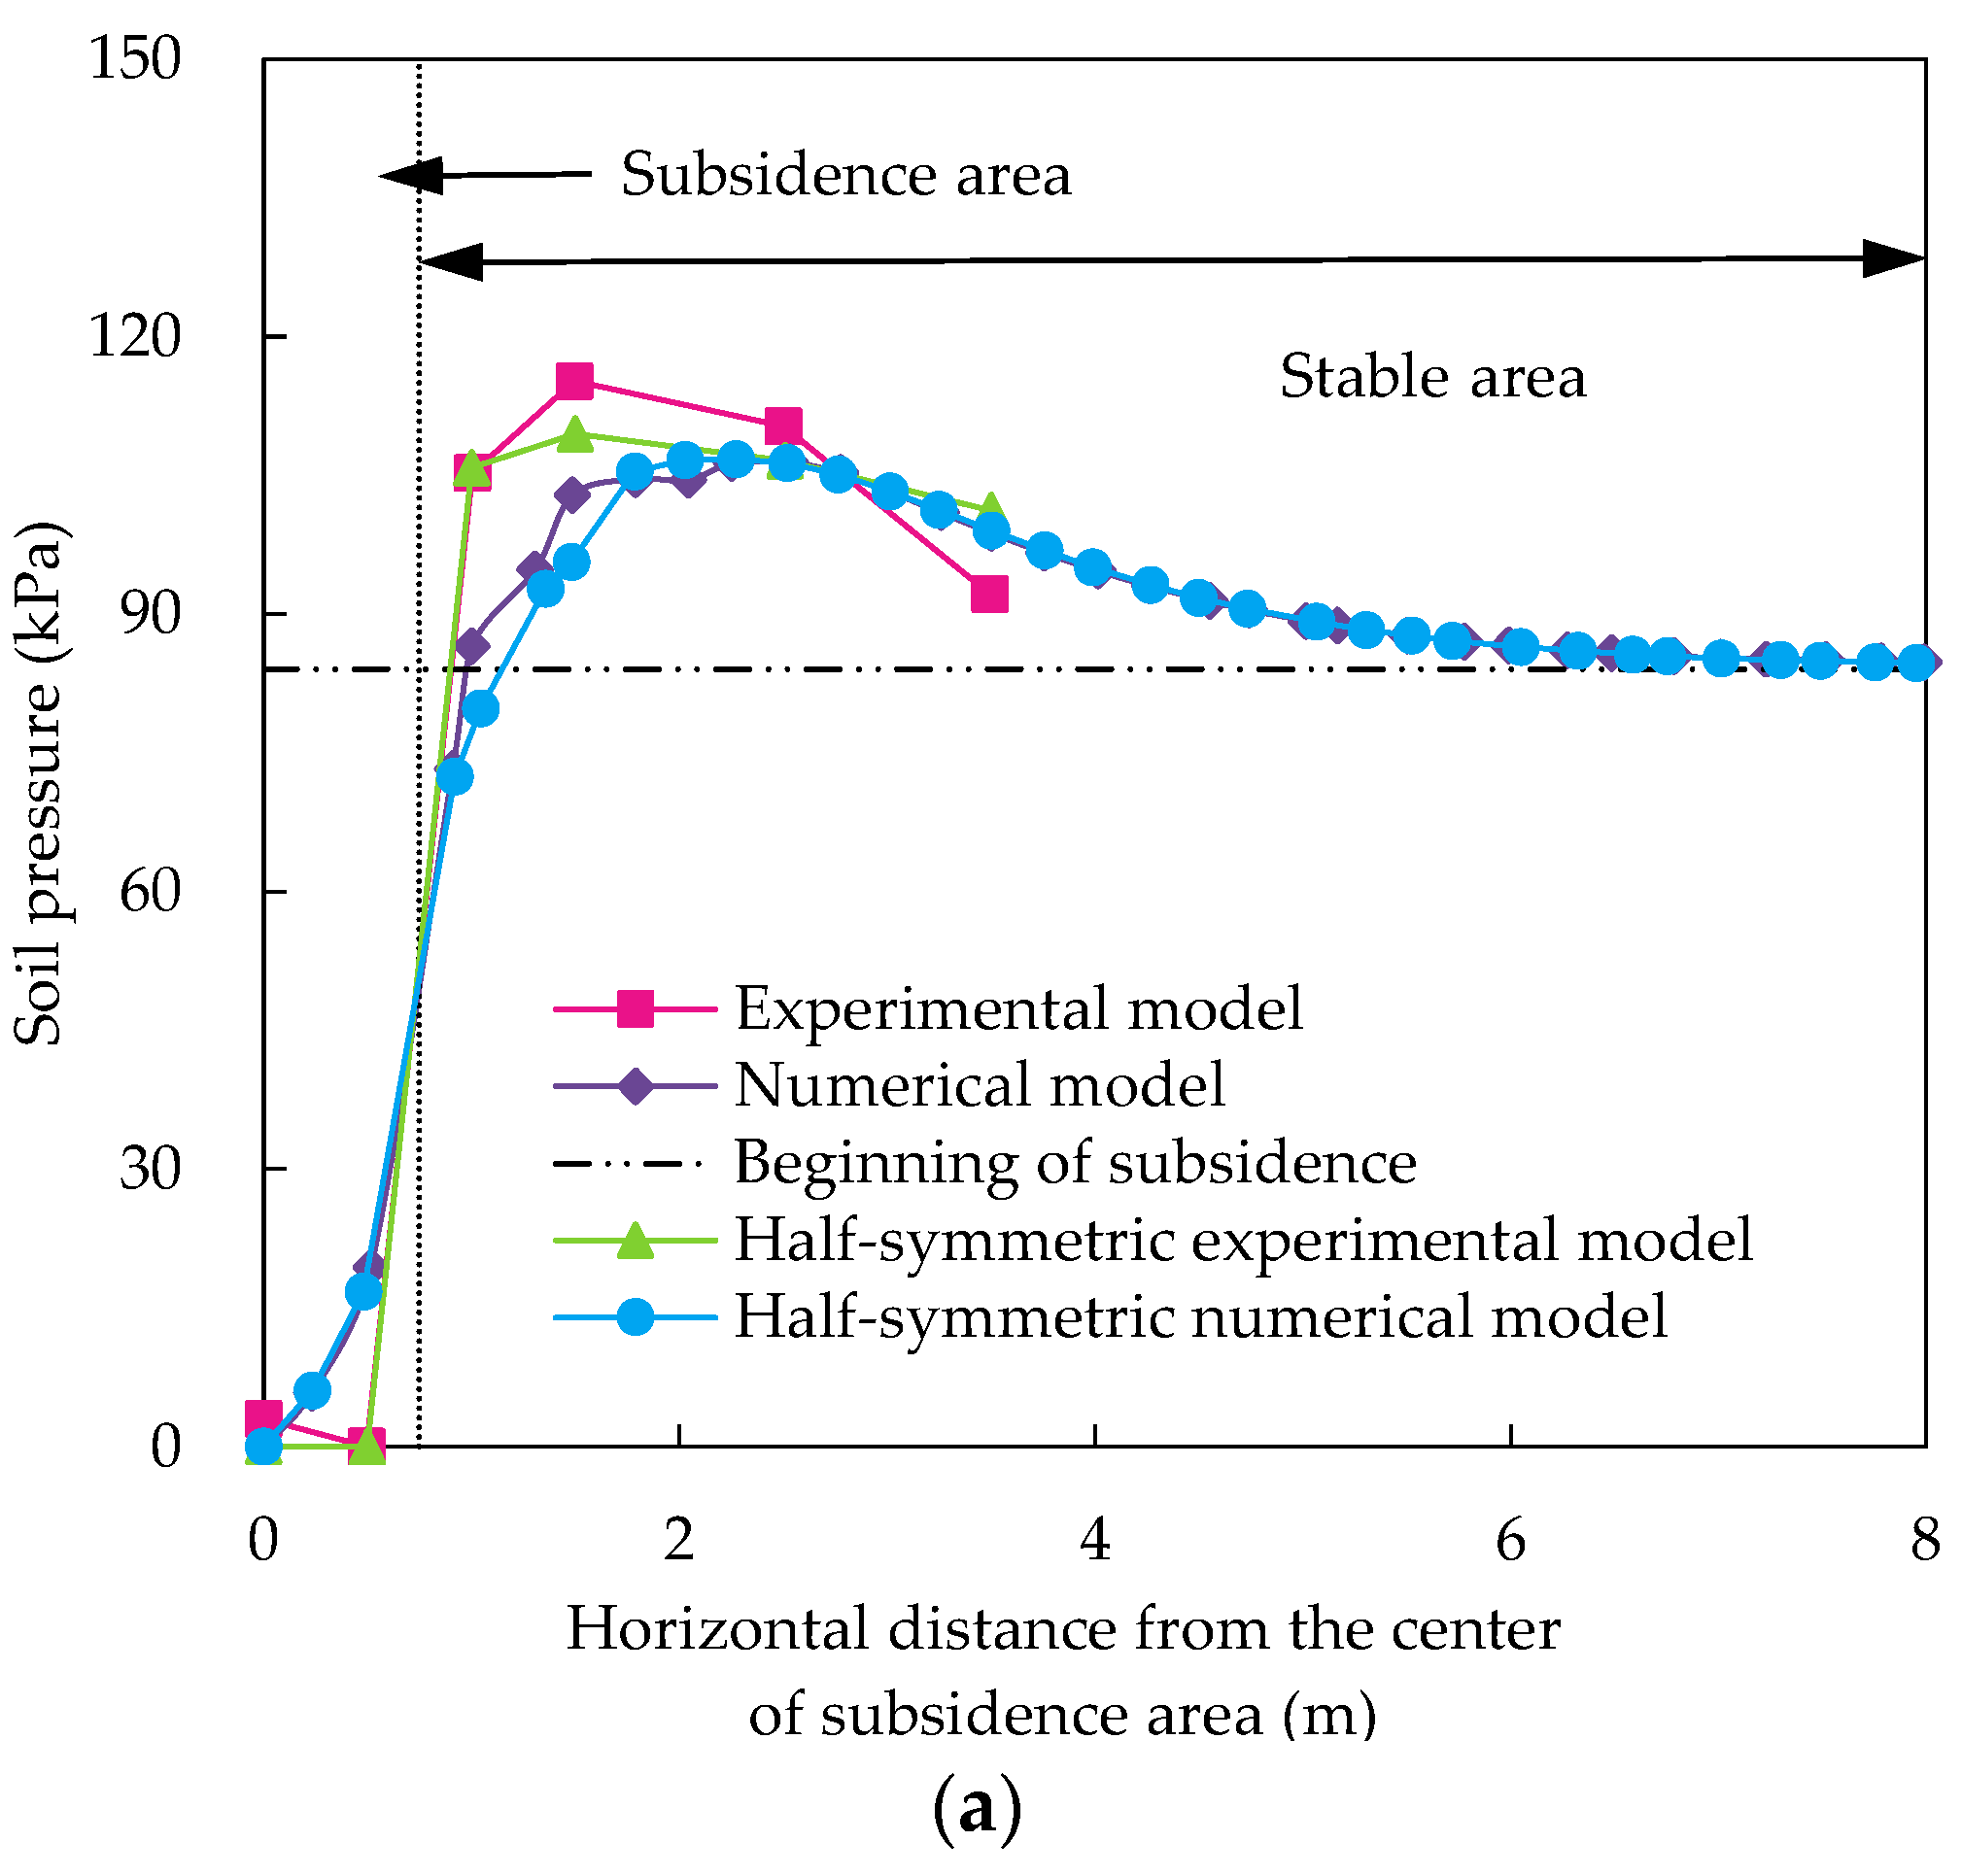
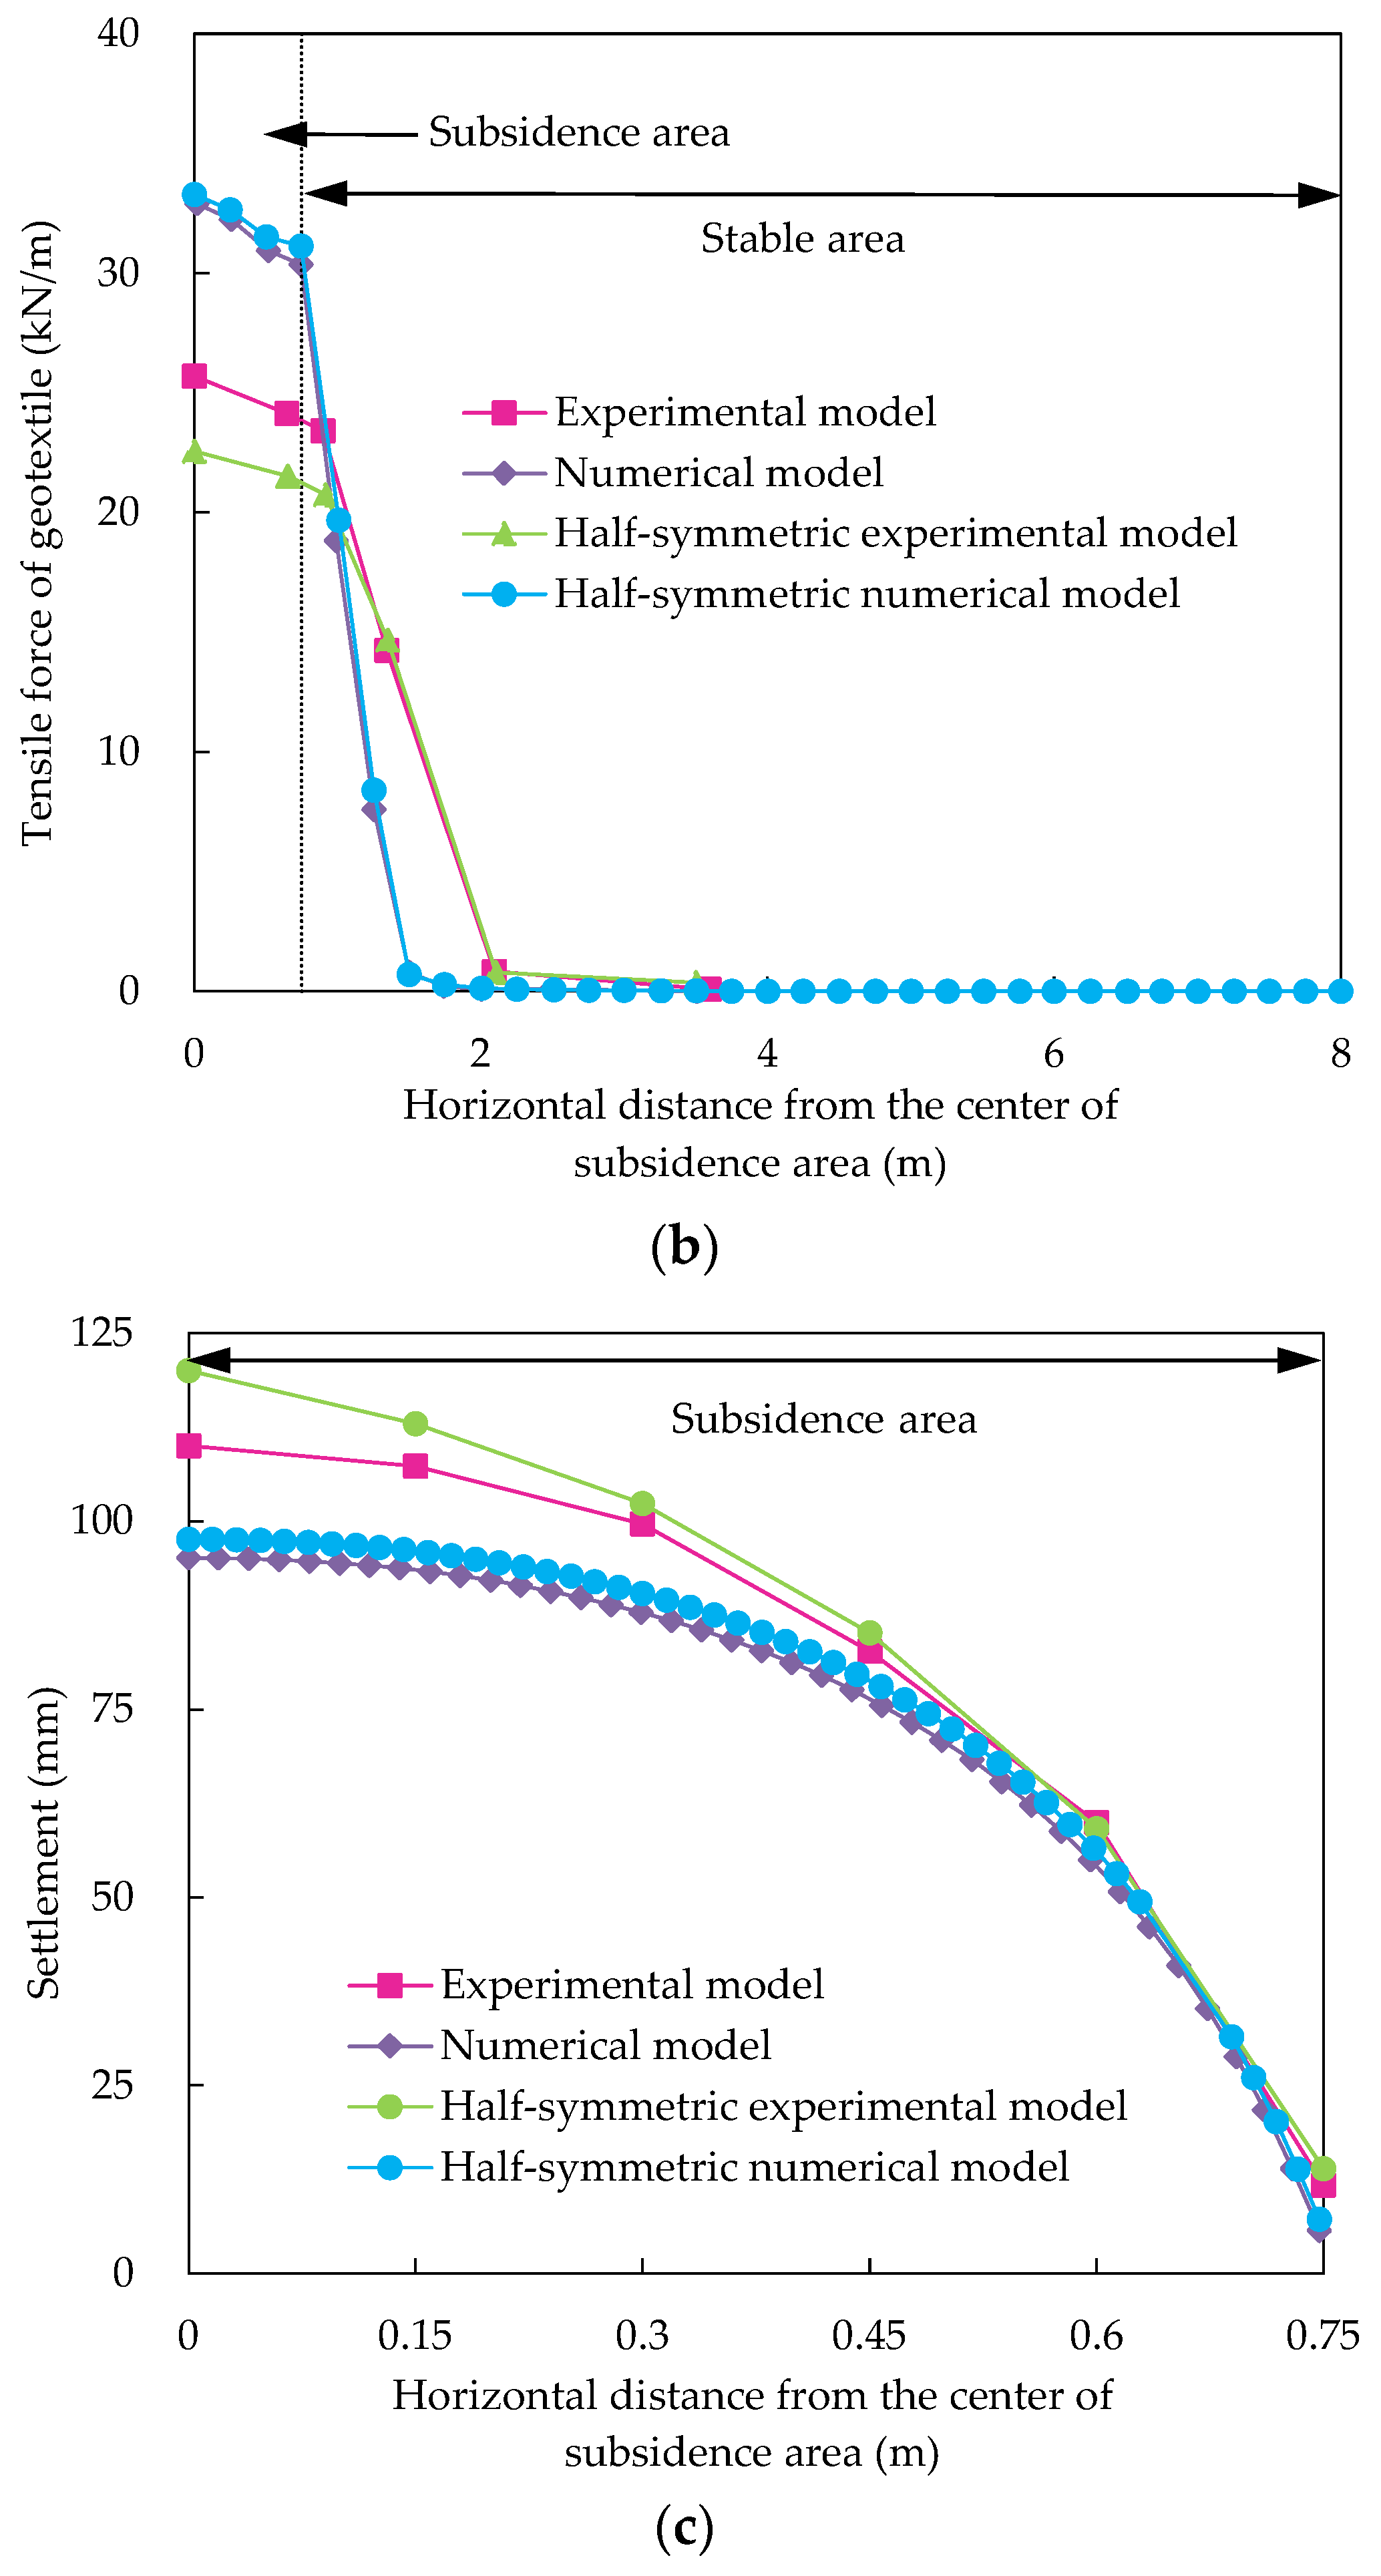
3.1. Validation of the Half-Symmetric Model and the Numerical Modeling
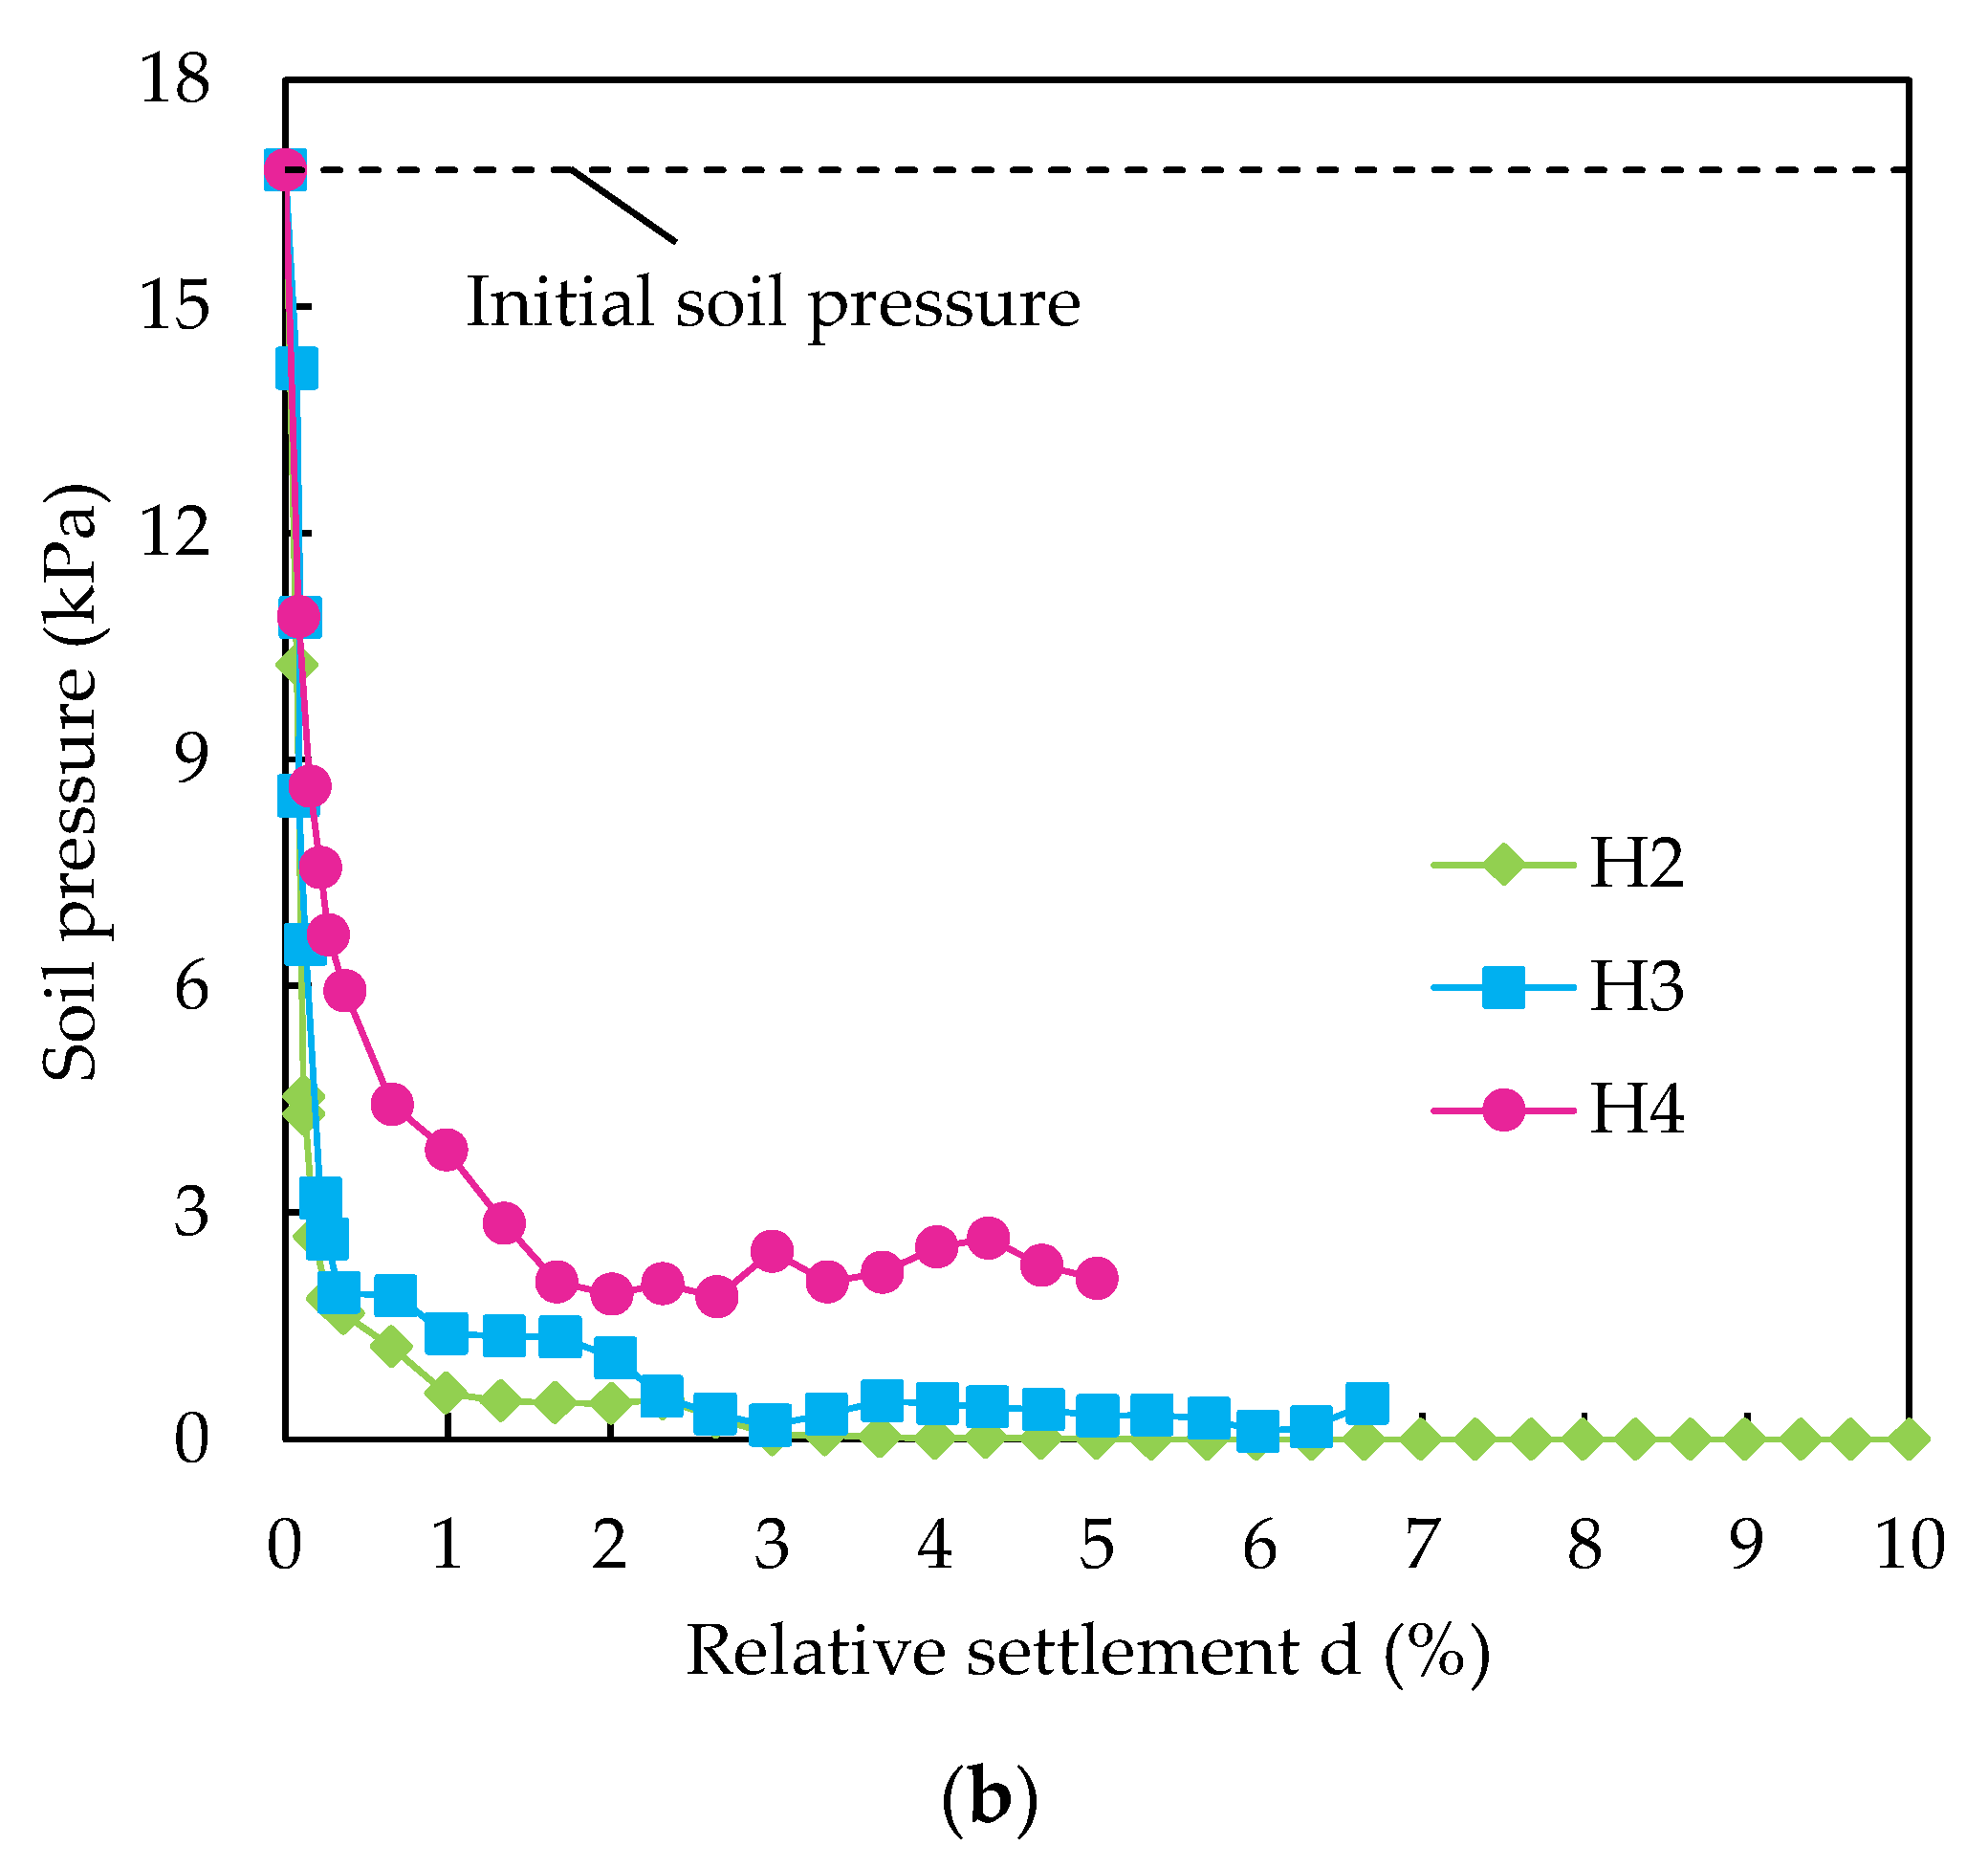
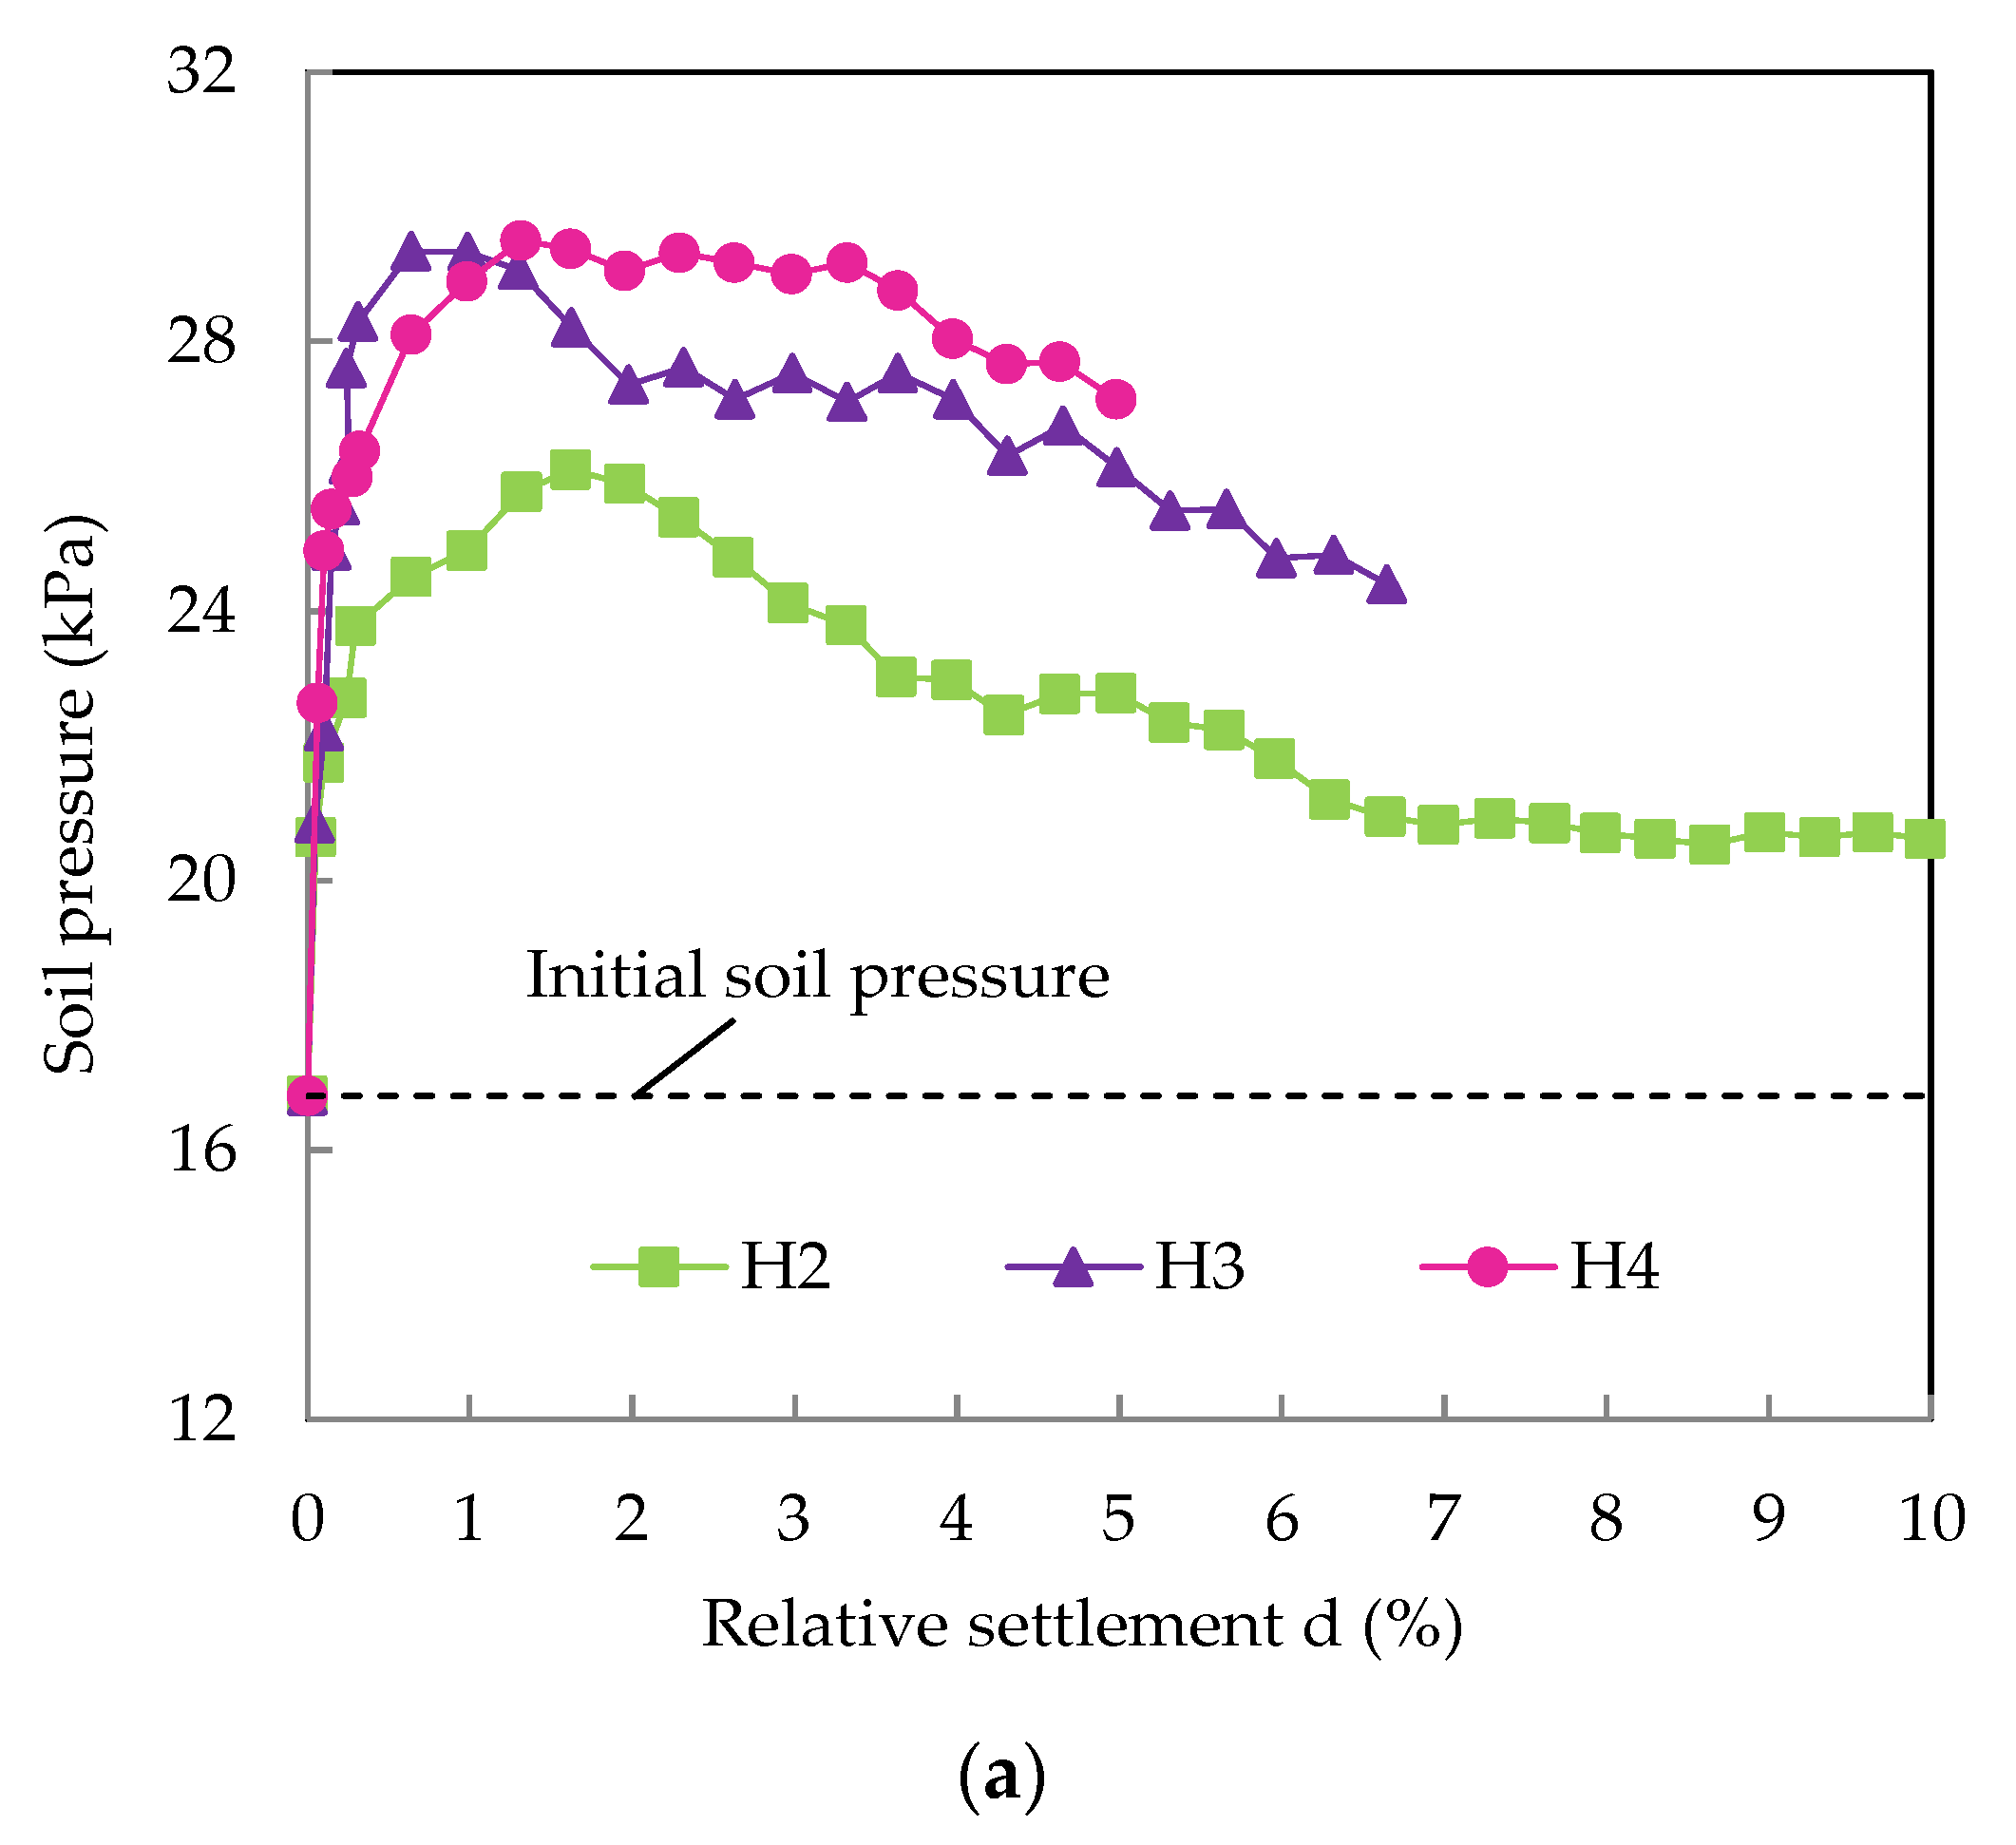
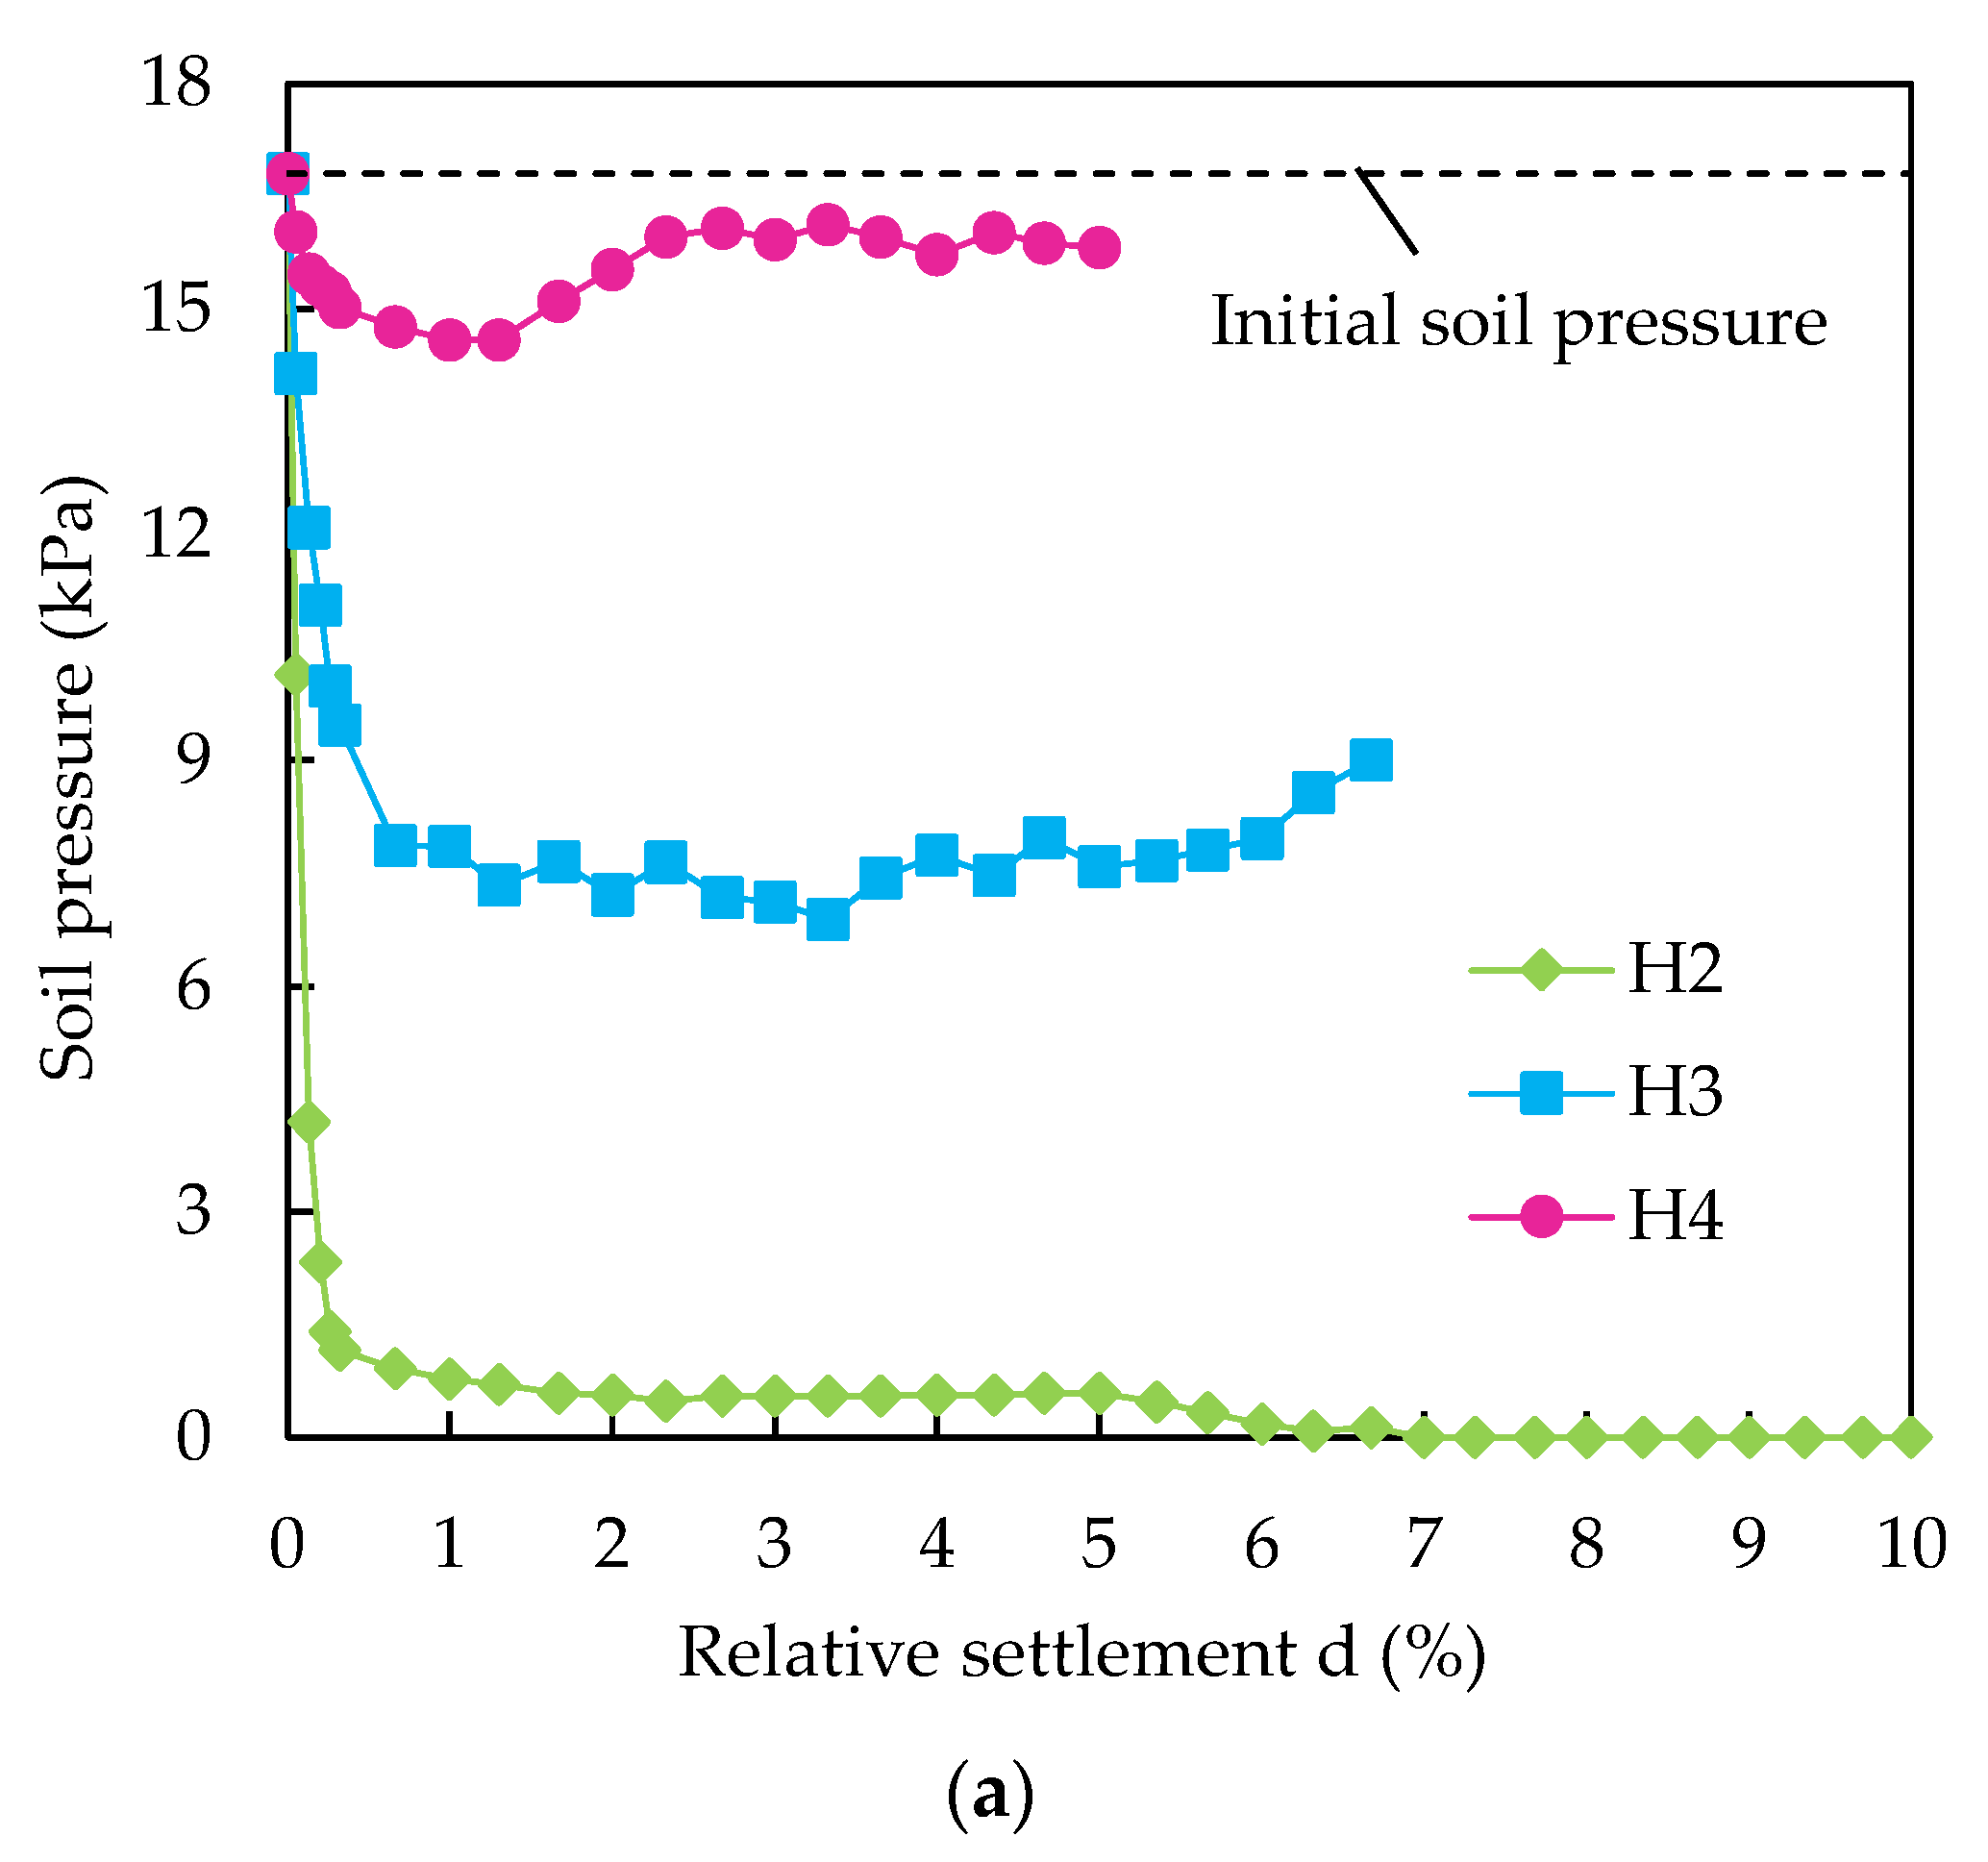
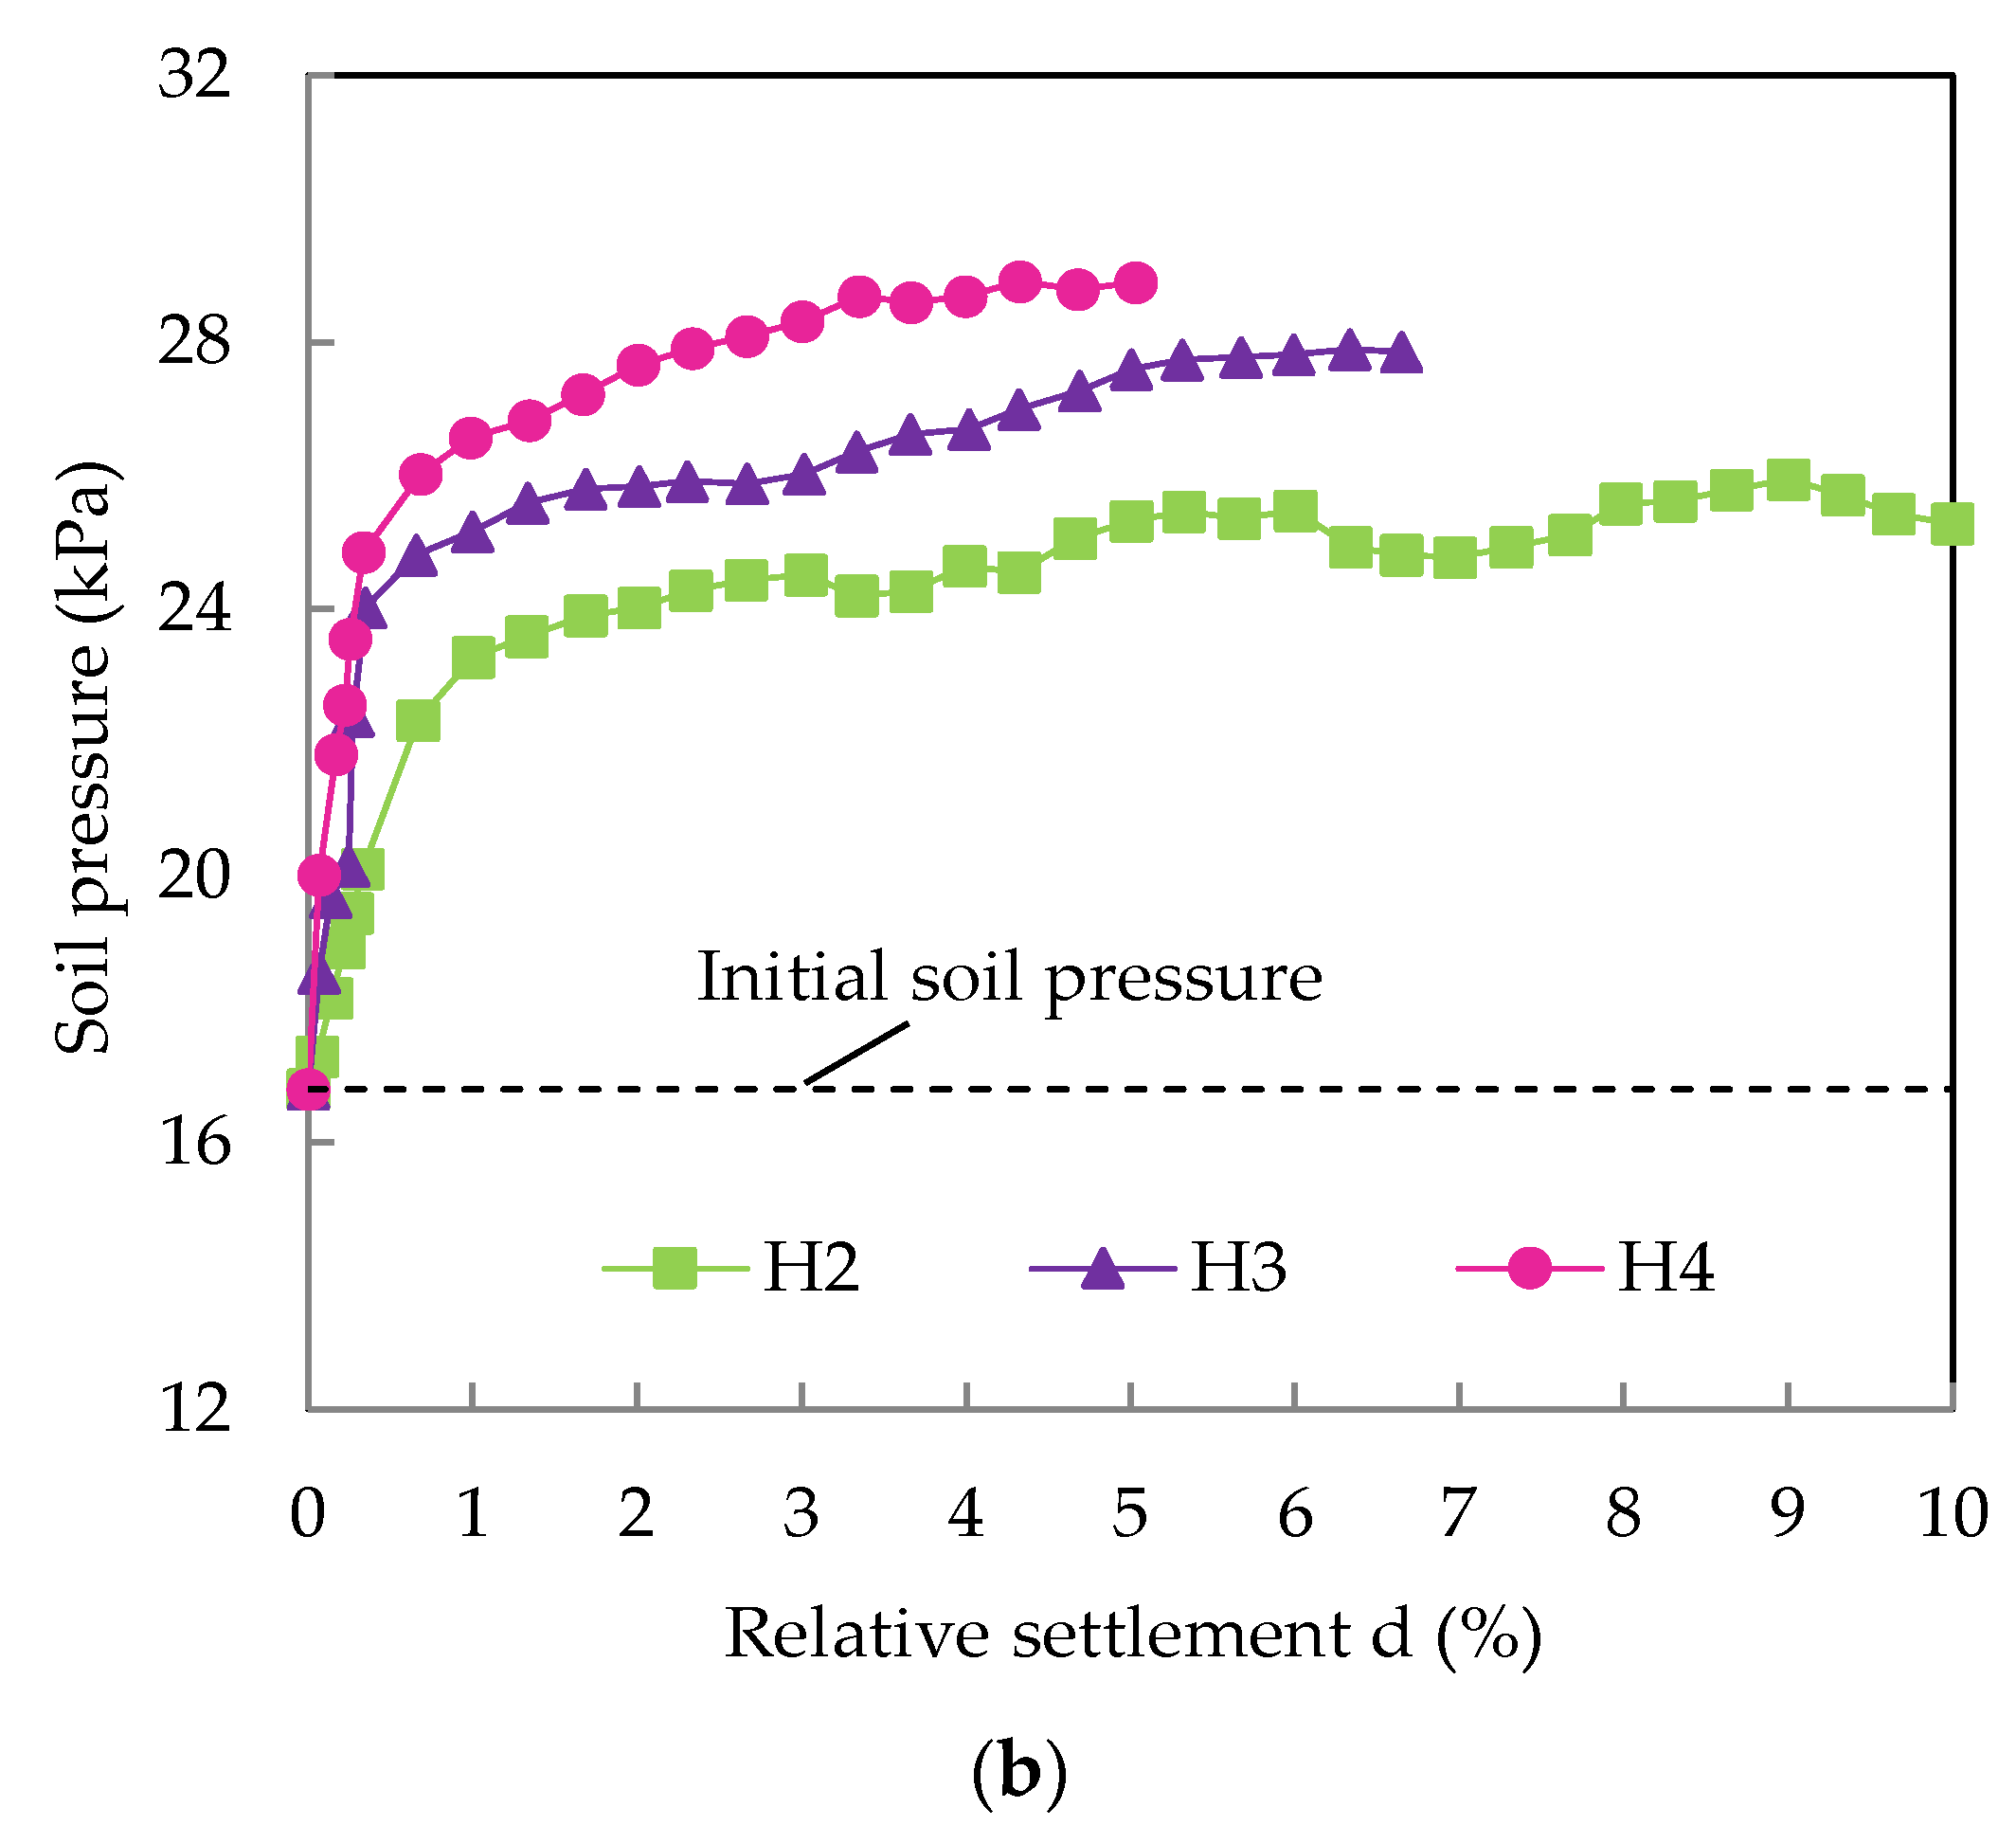
3.2. Analysis of the Soil Pressure
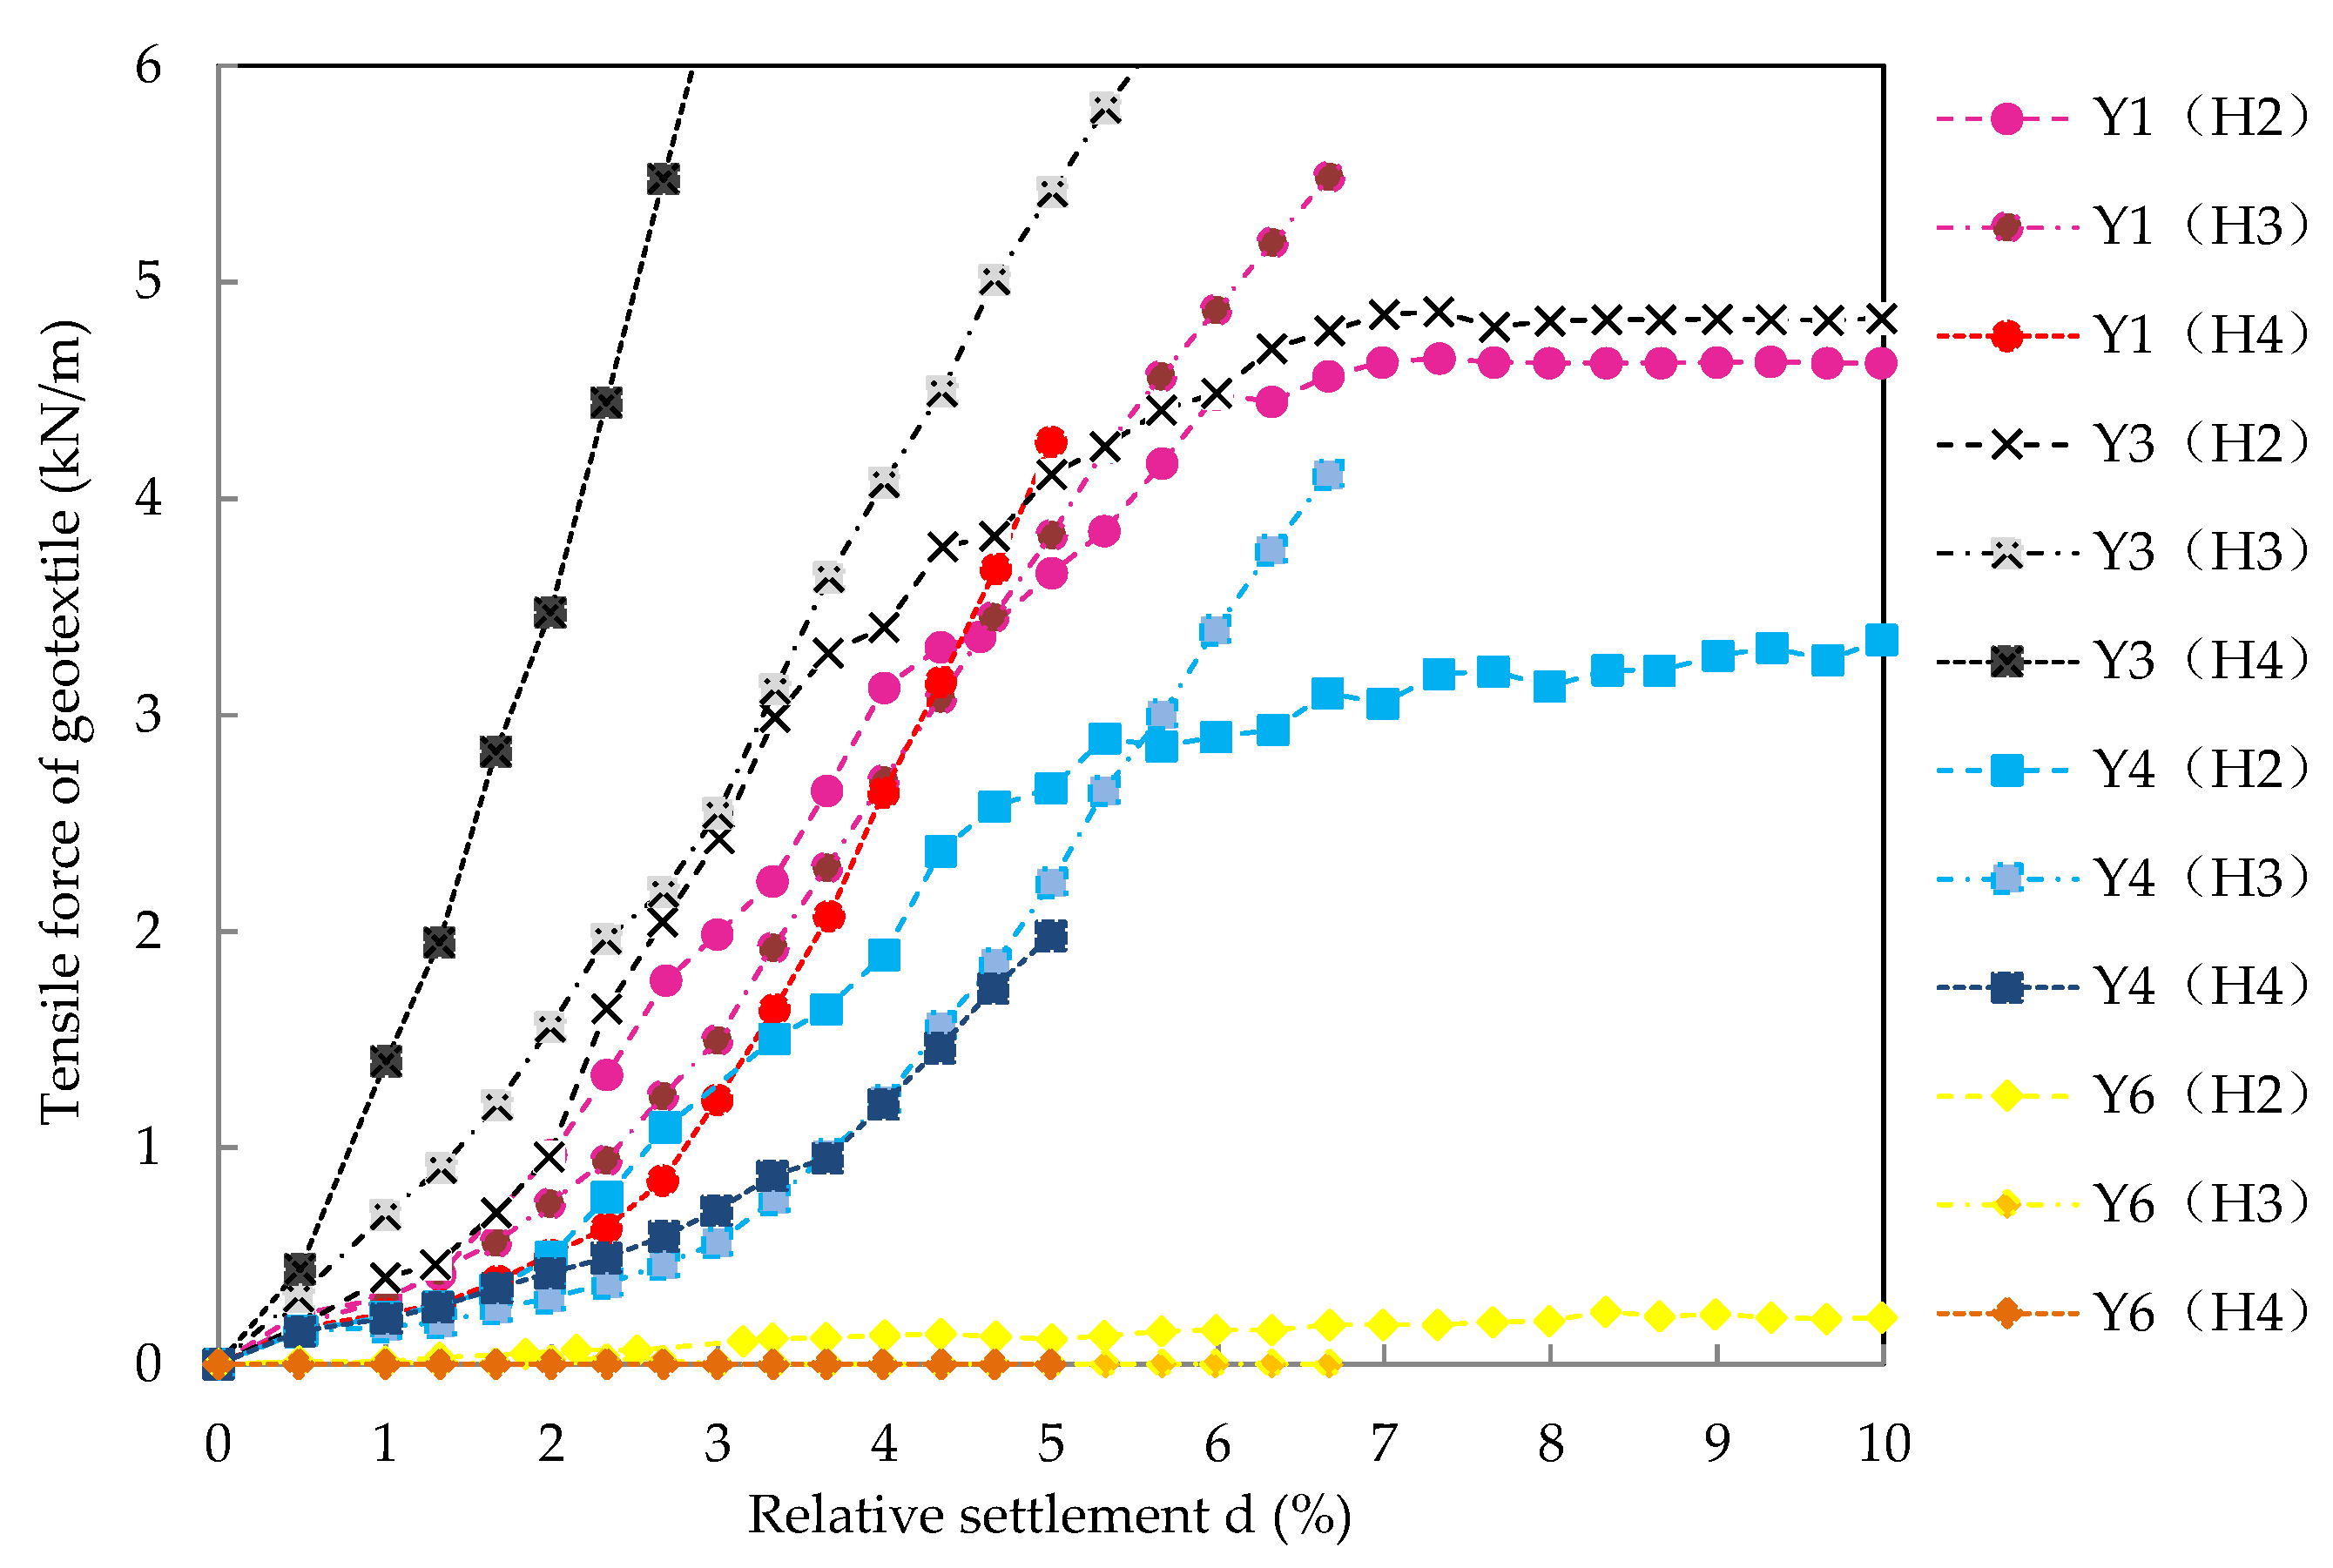
3.3. Analysis of the Geotextile of the Tensile Force
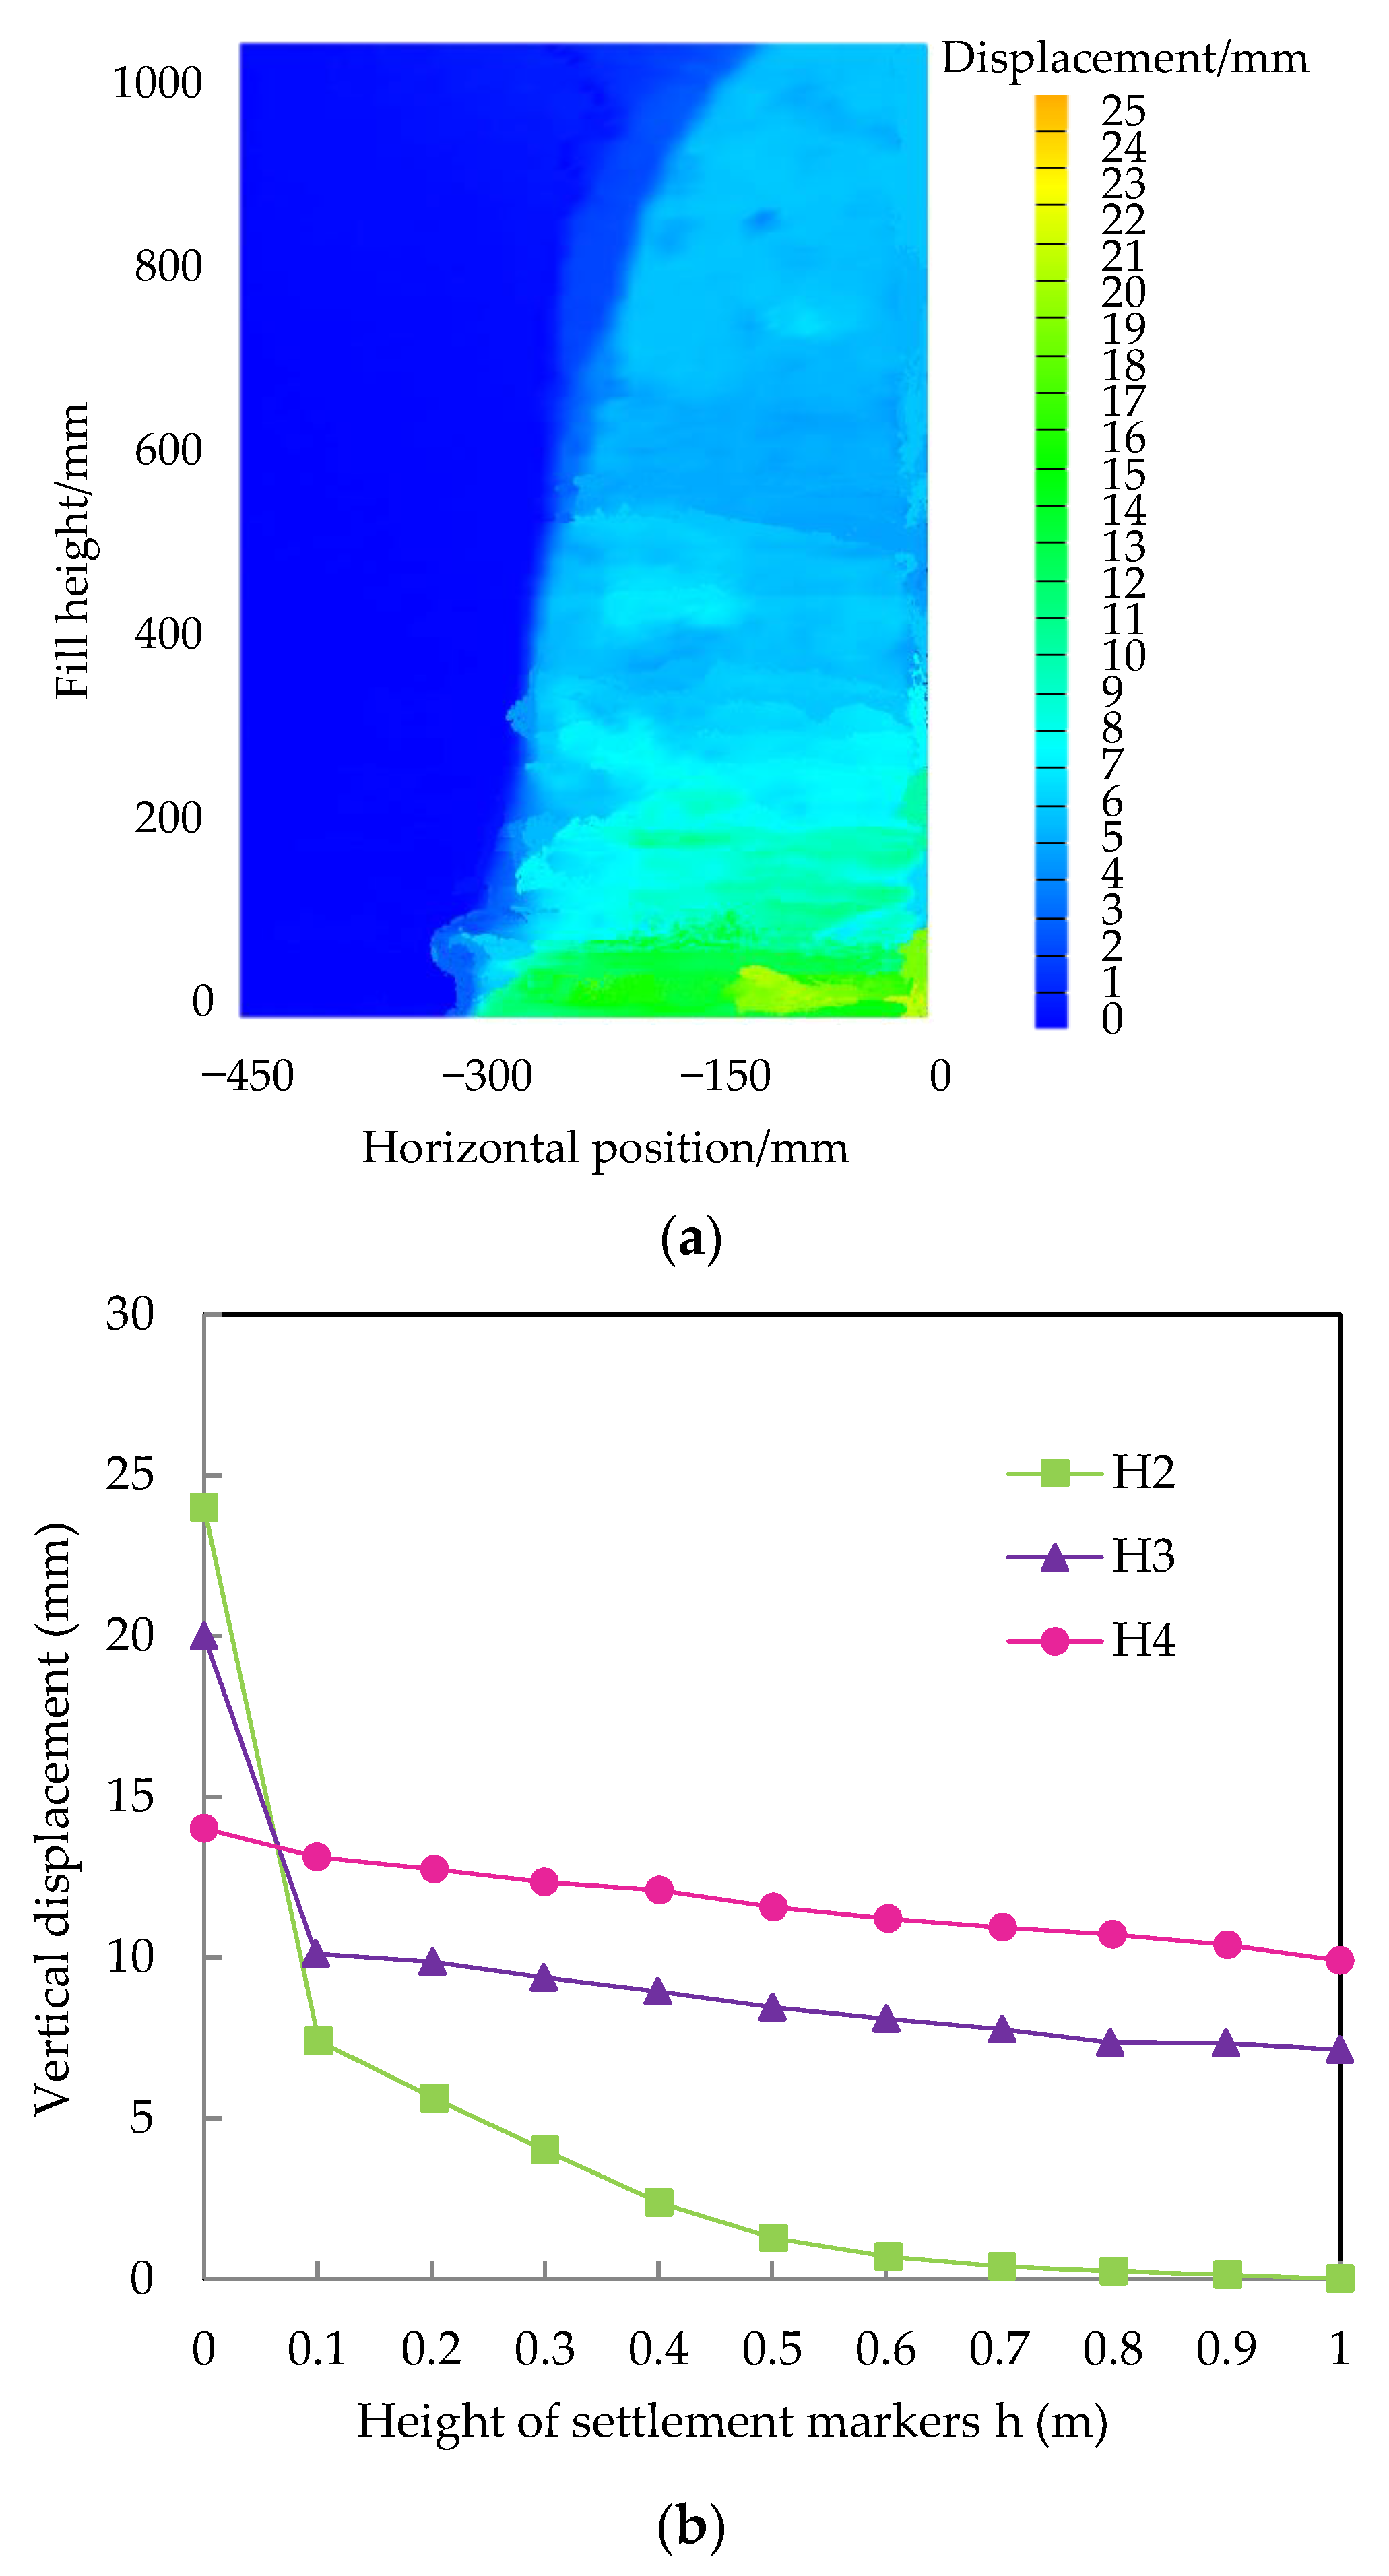
3.4. Analysis of Soil Displacement
4. Effect of the Subsidence Width in the Numerical Model
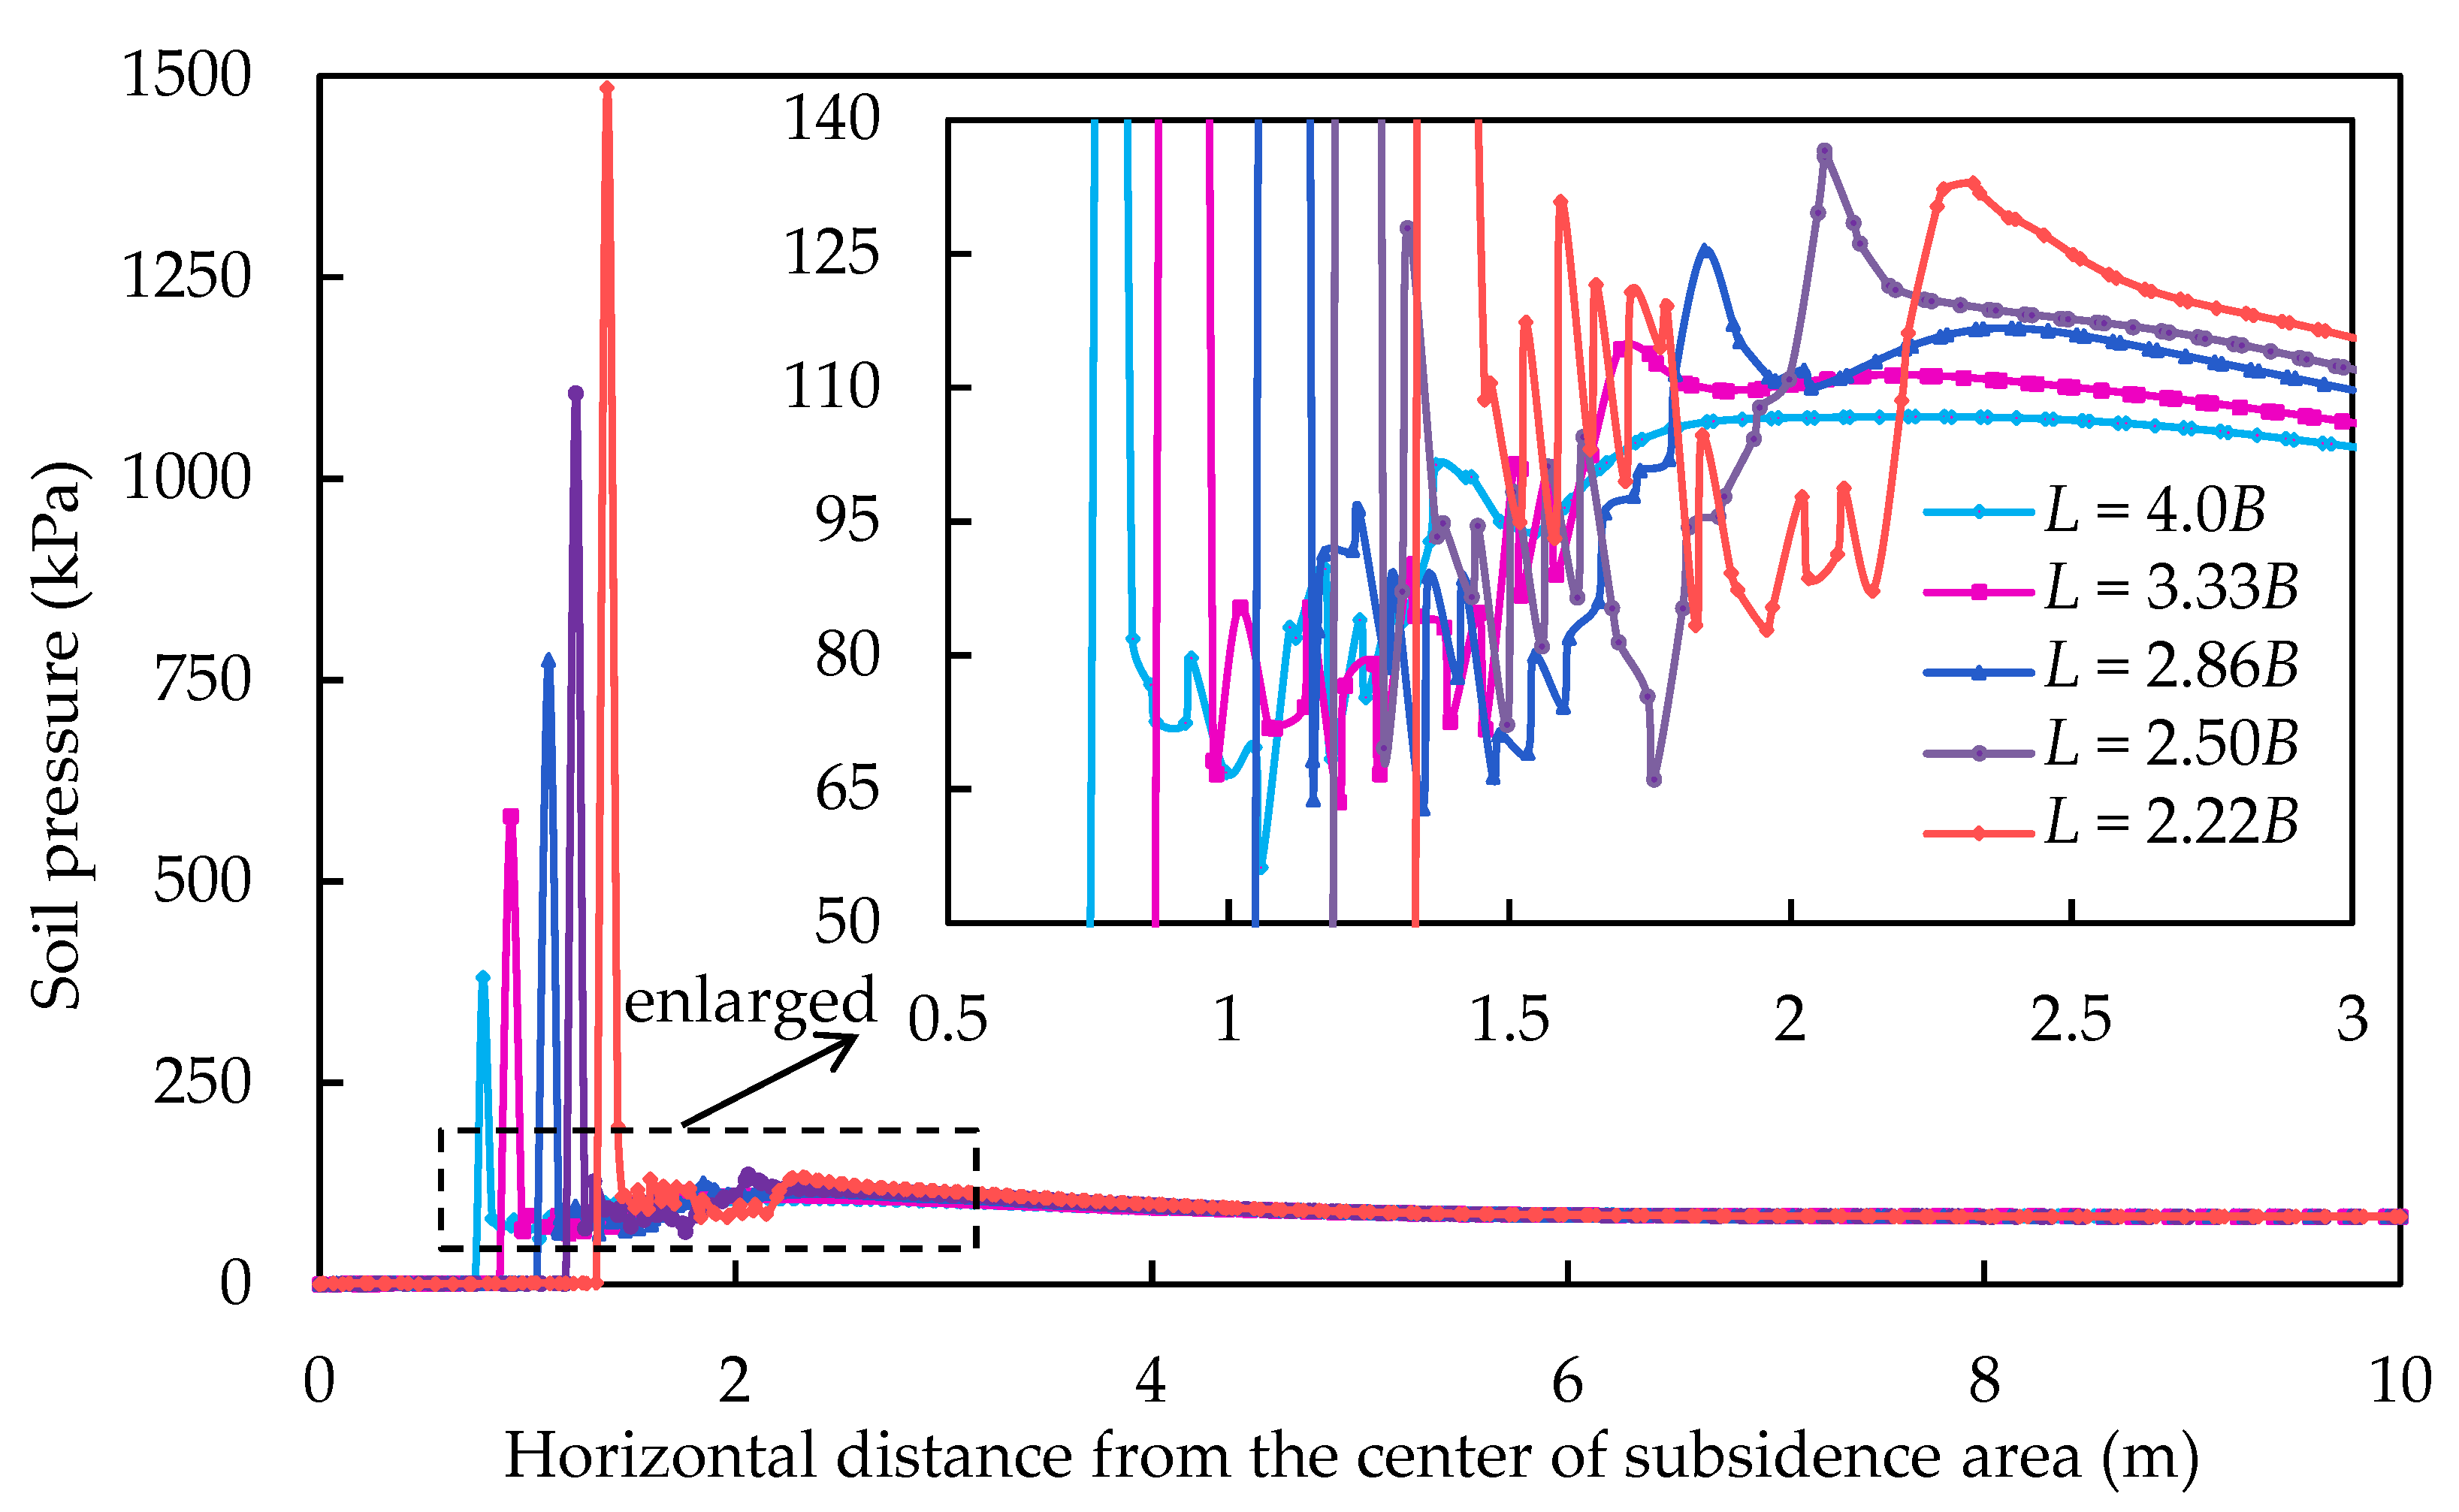
4.1. Analysis of the Soil Pressure
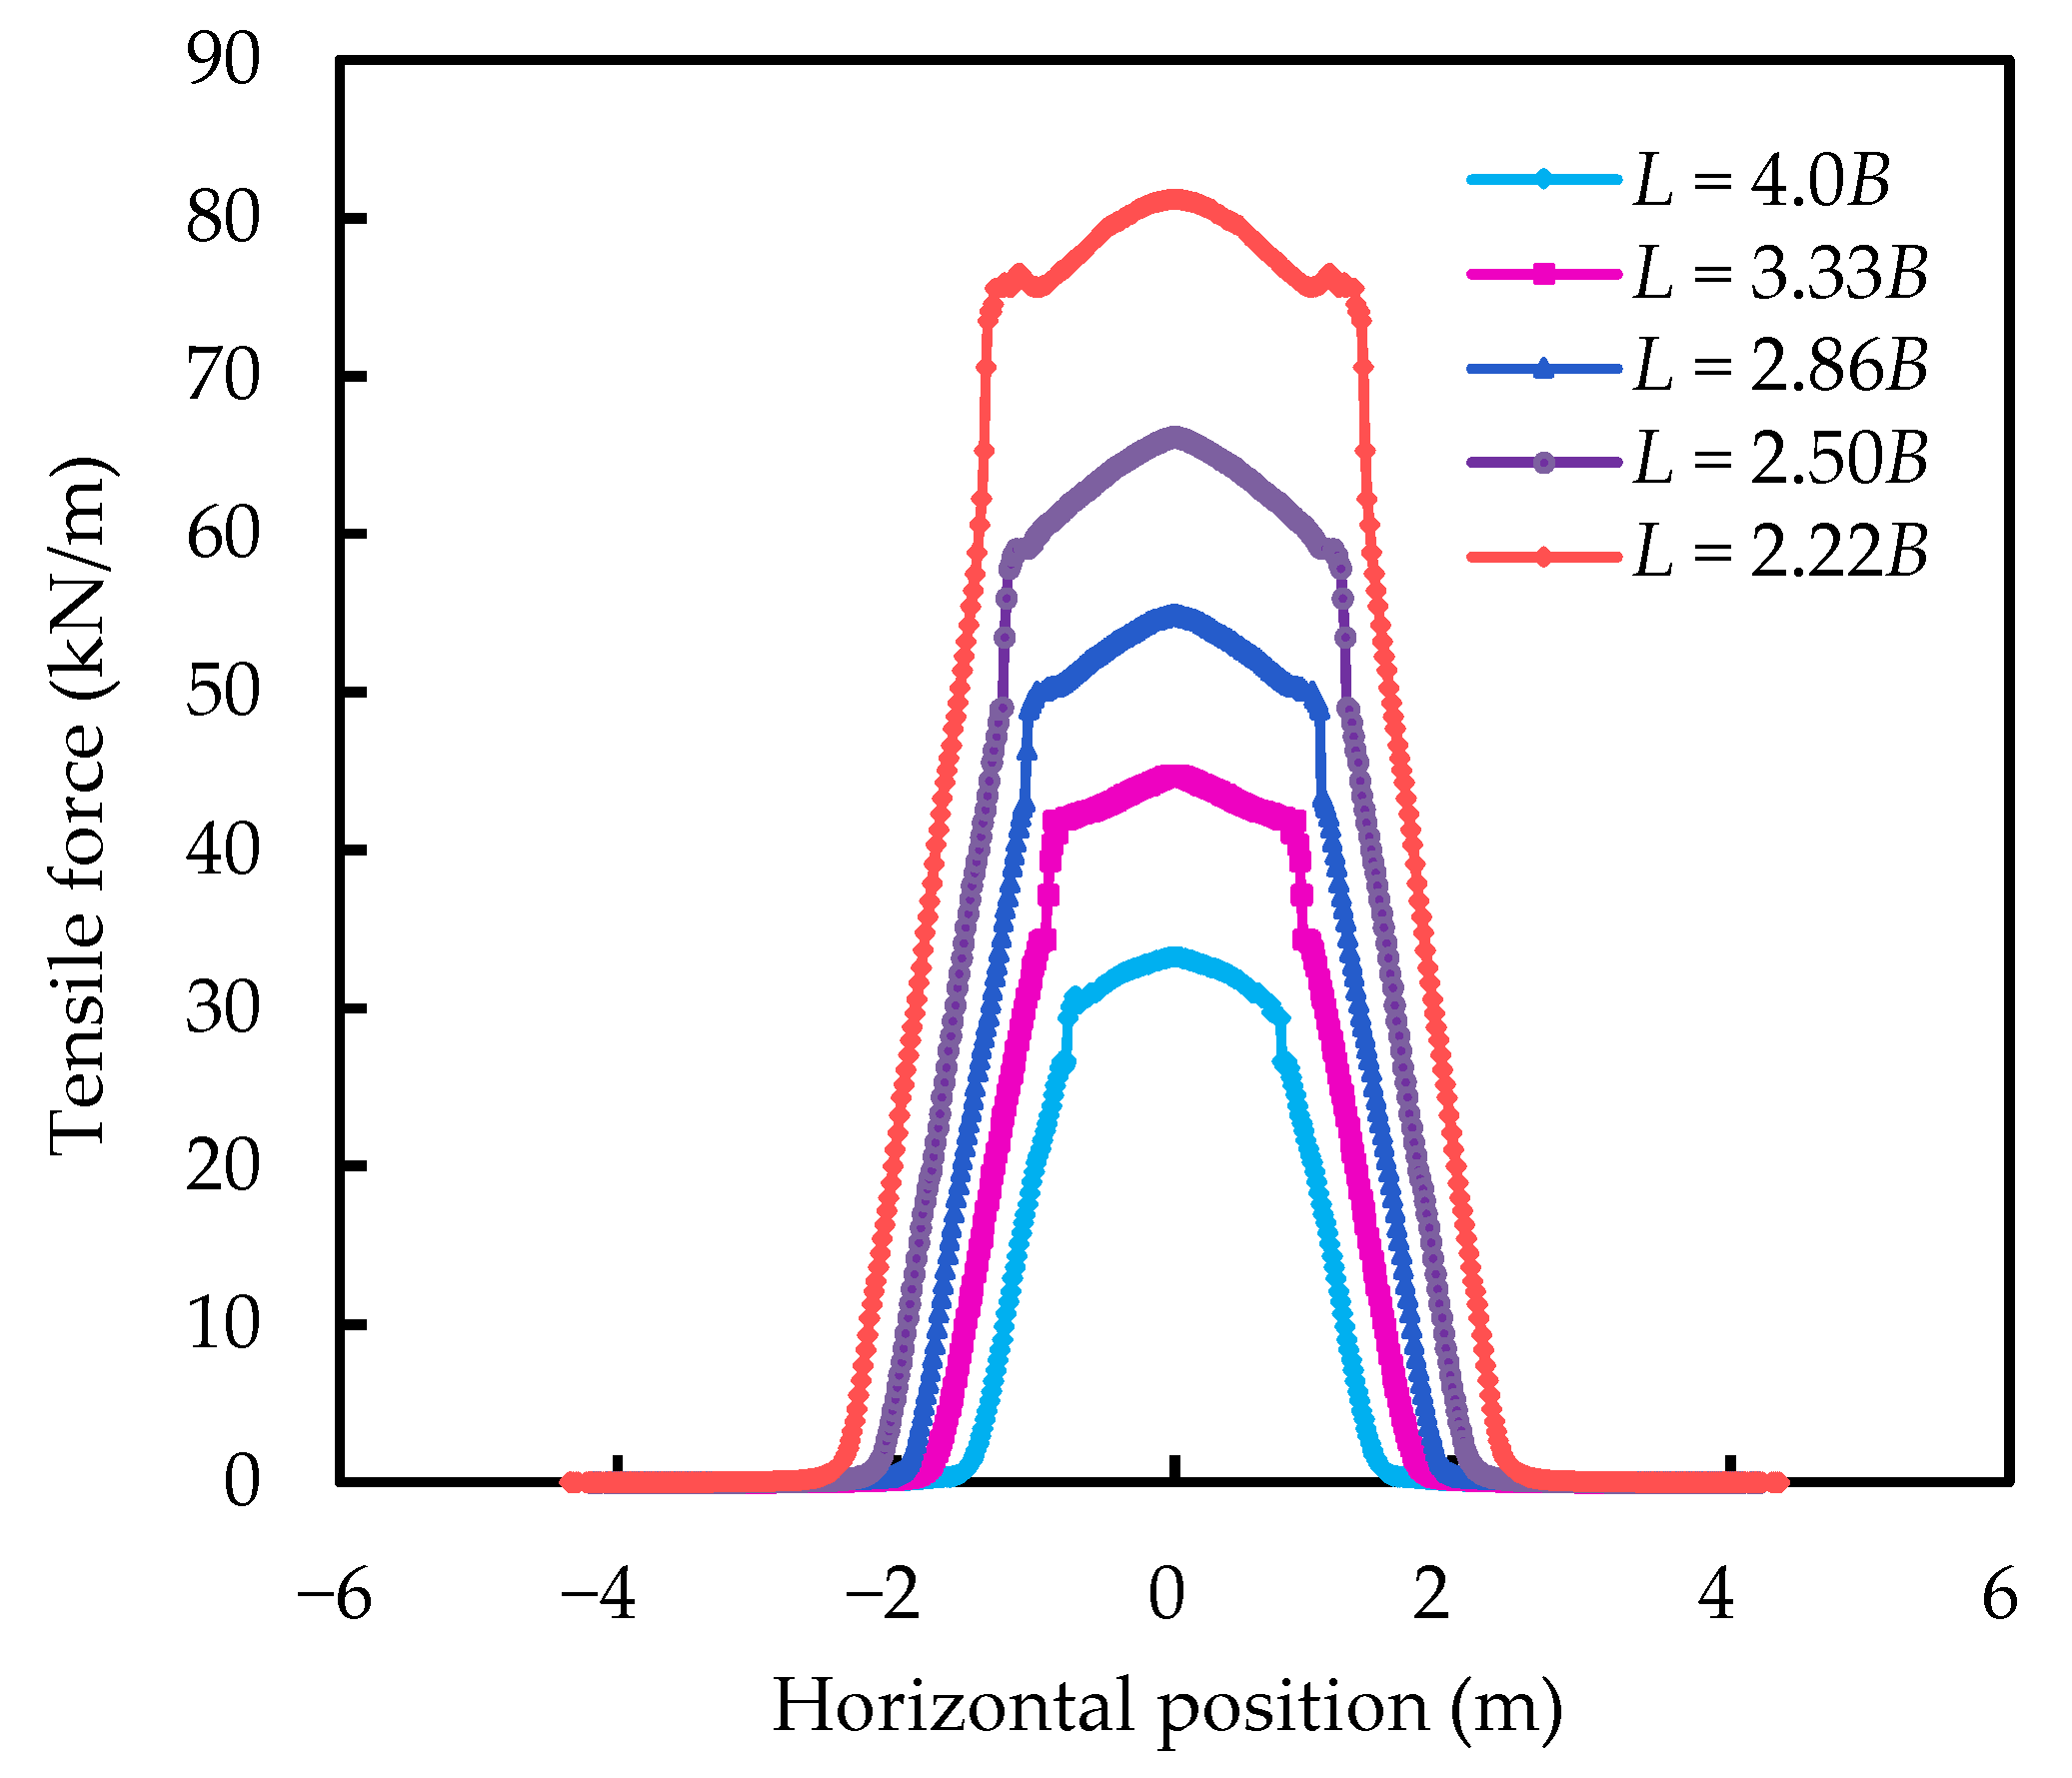
4.2. Analysis of the Geotextile of the Tensile Force
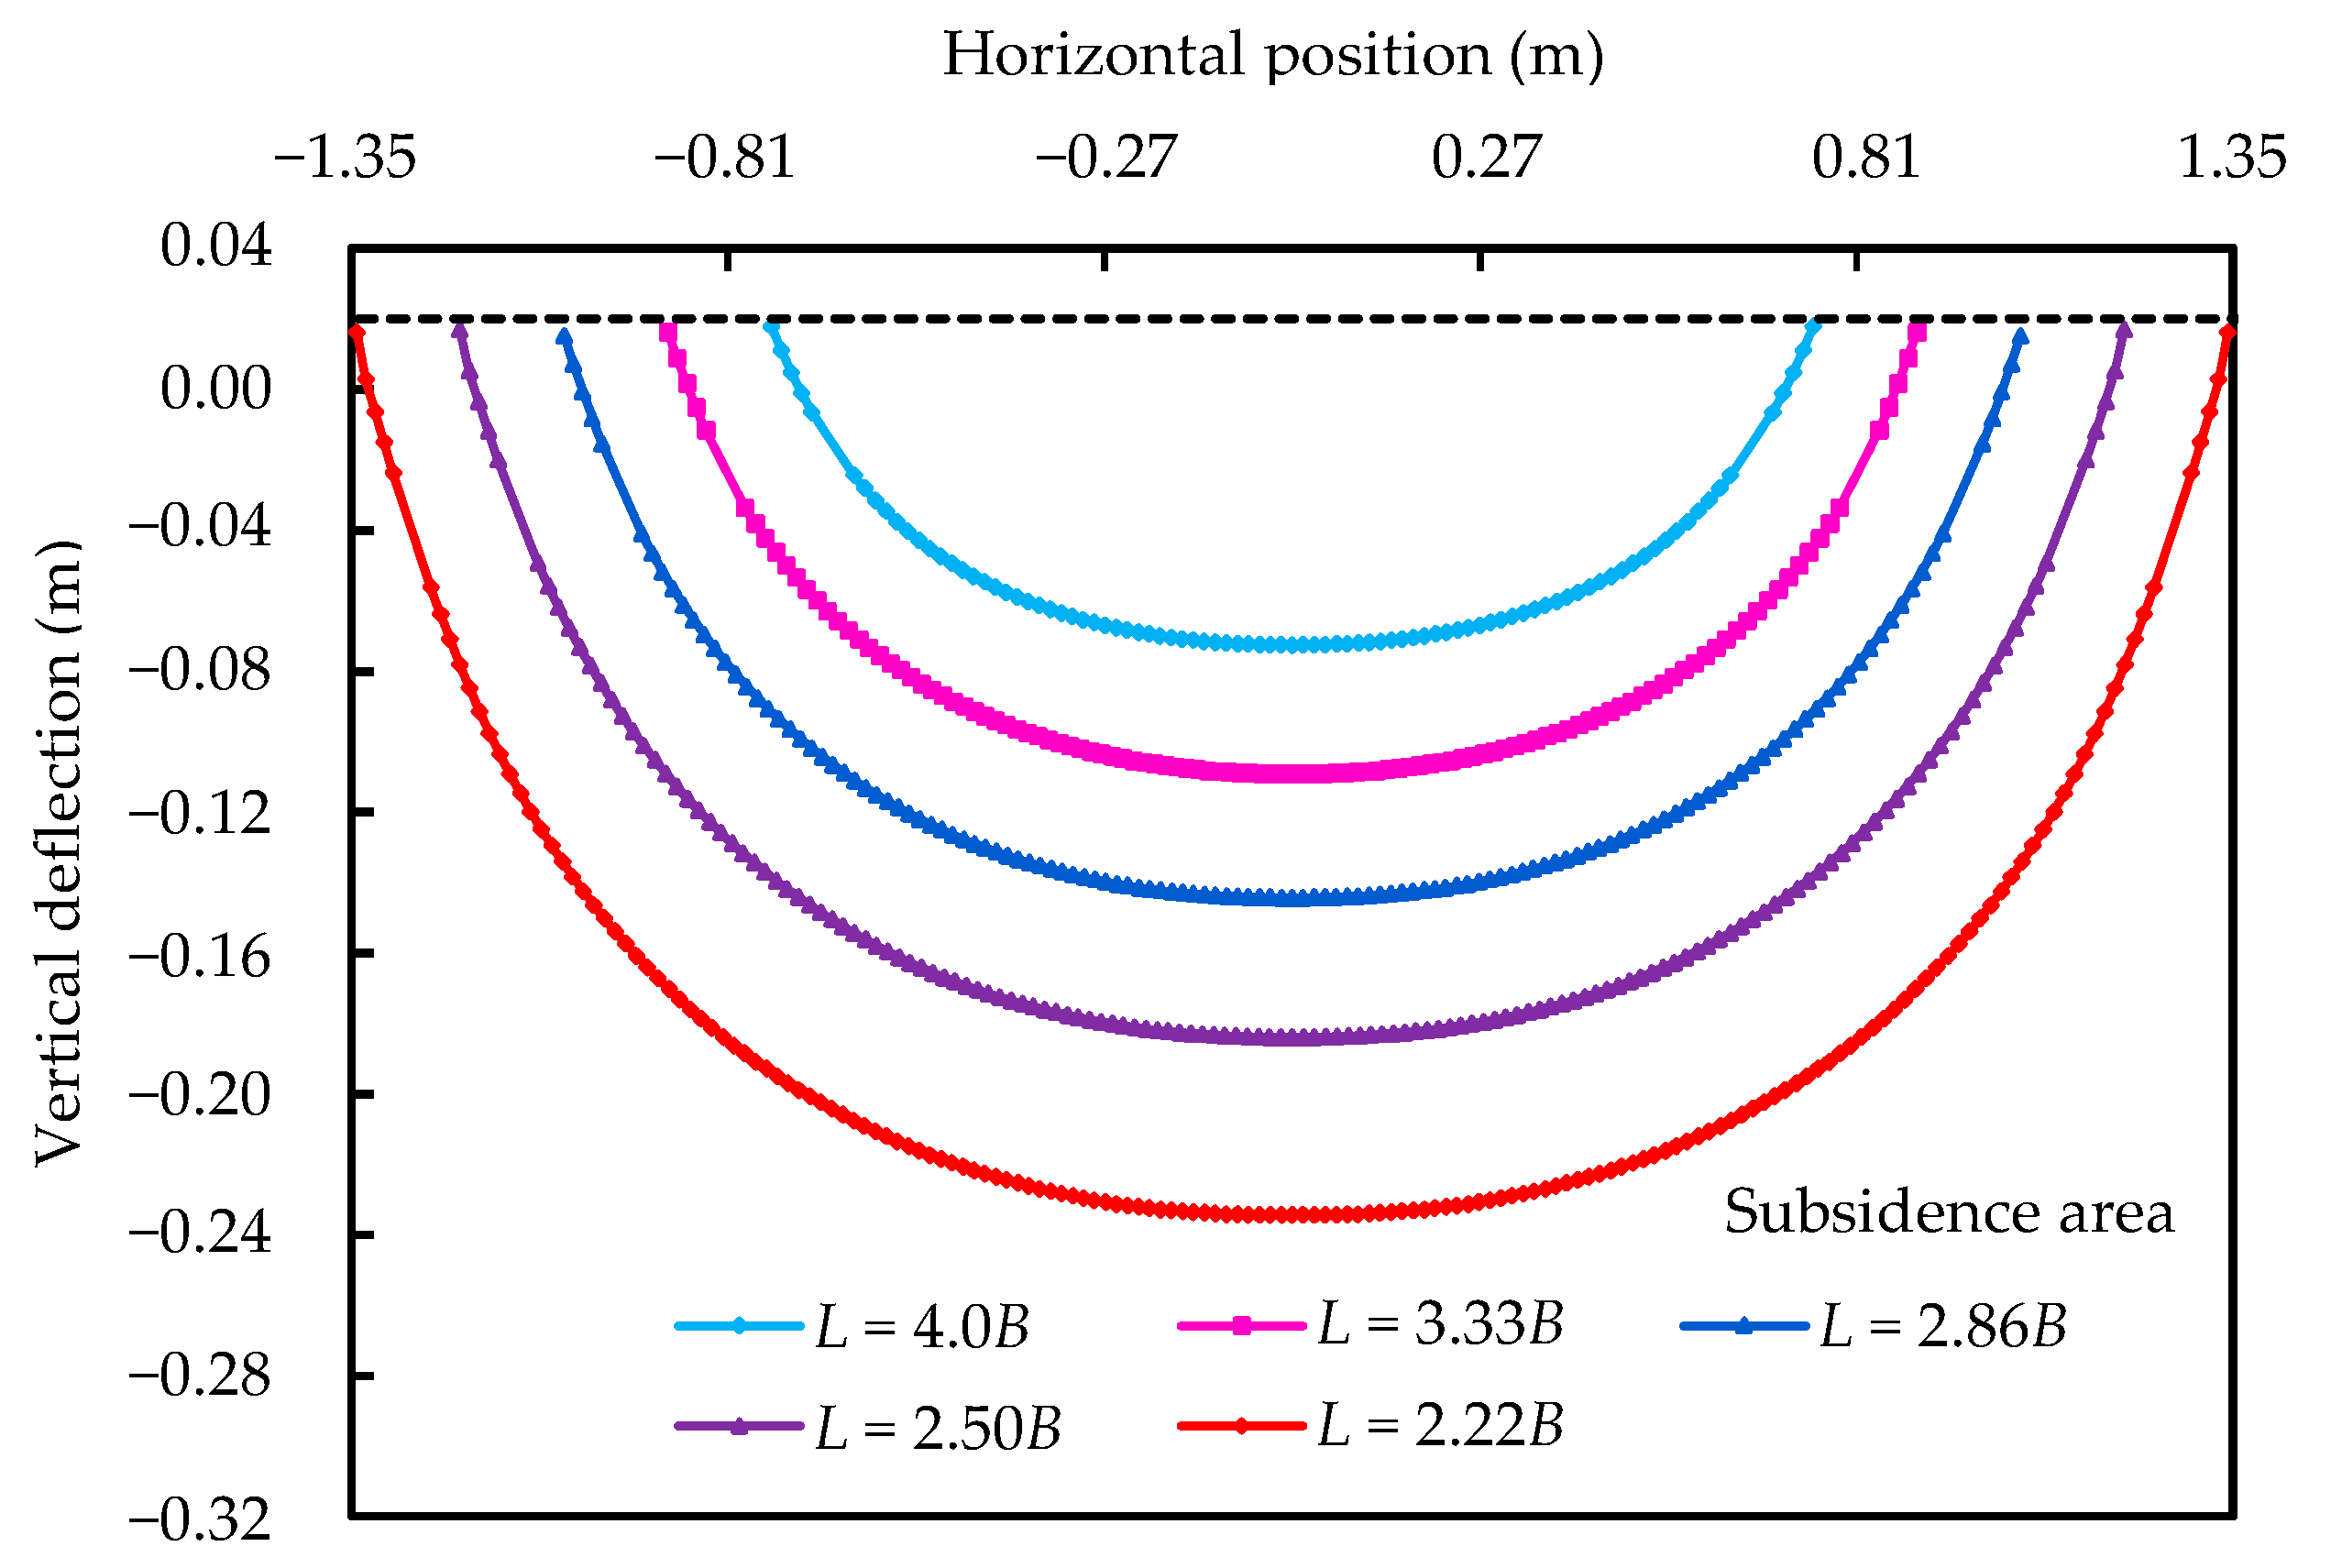
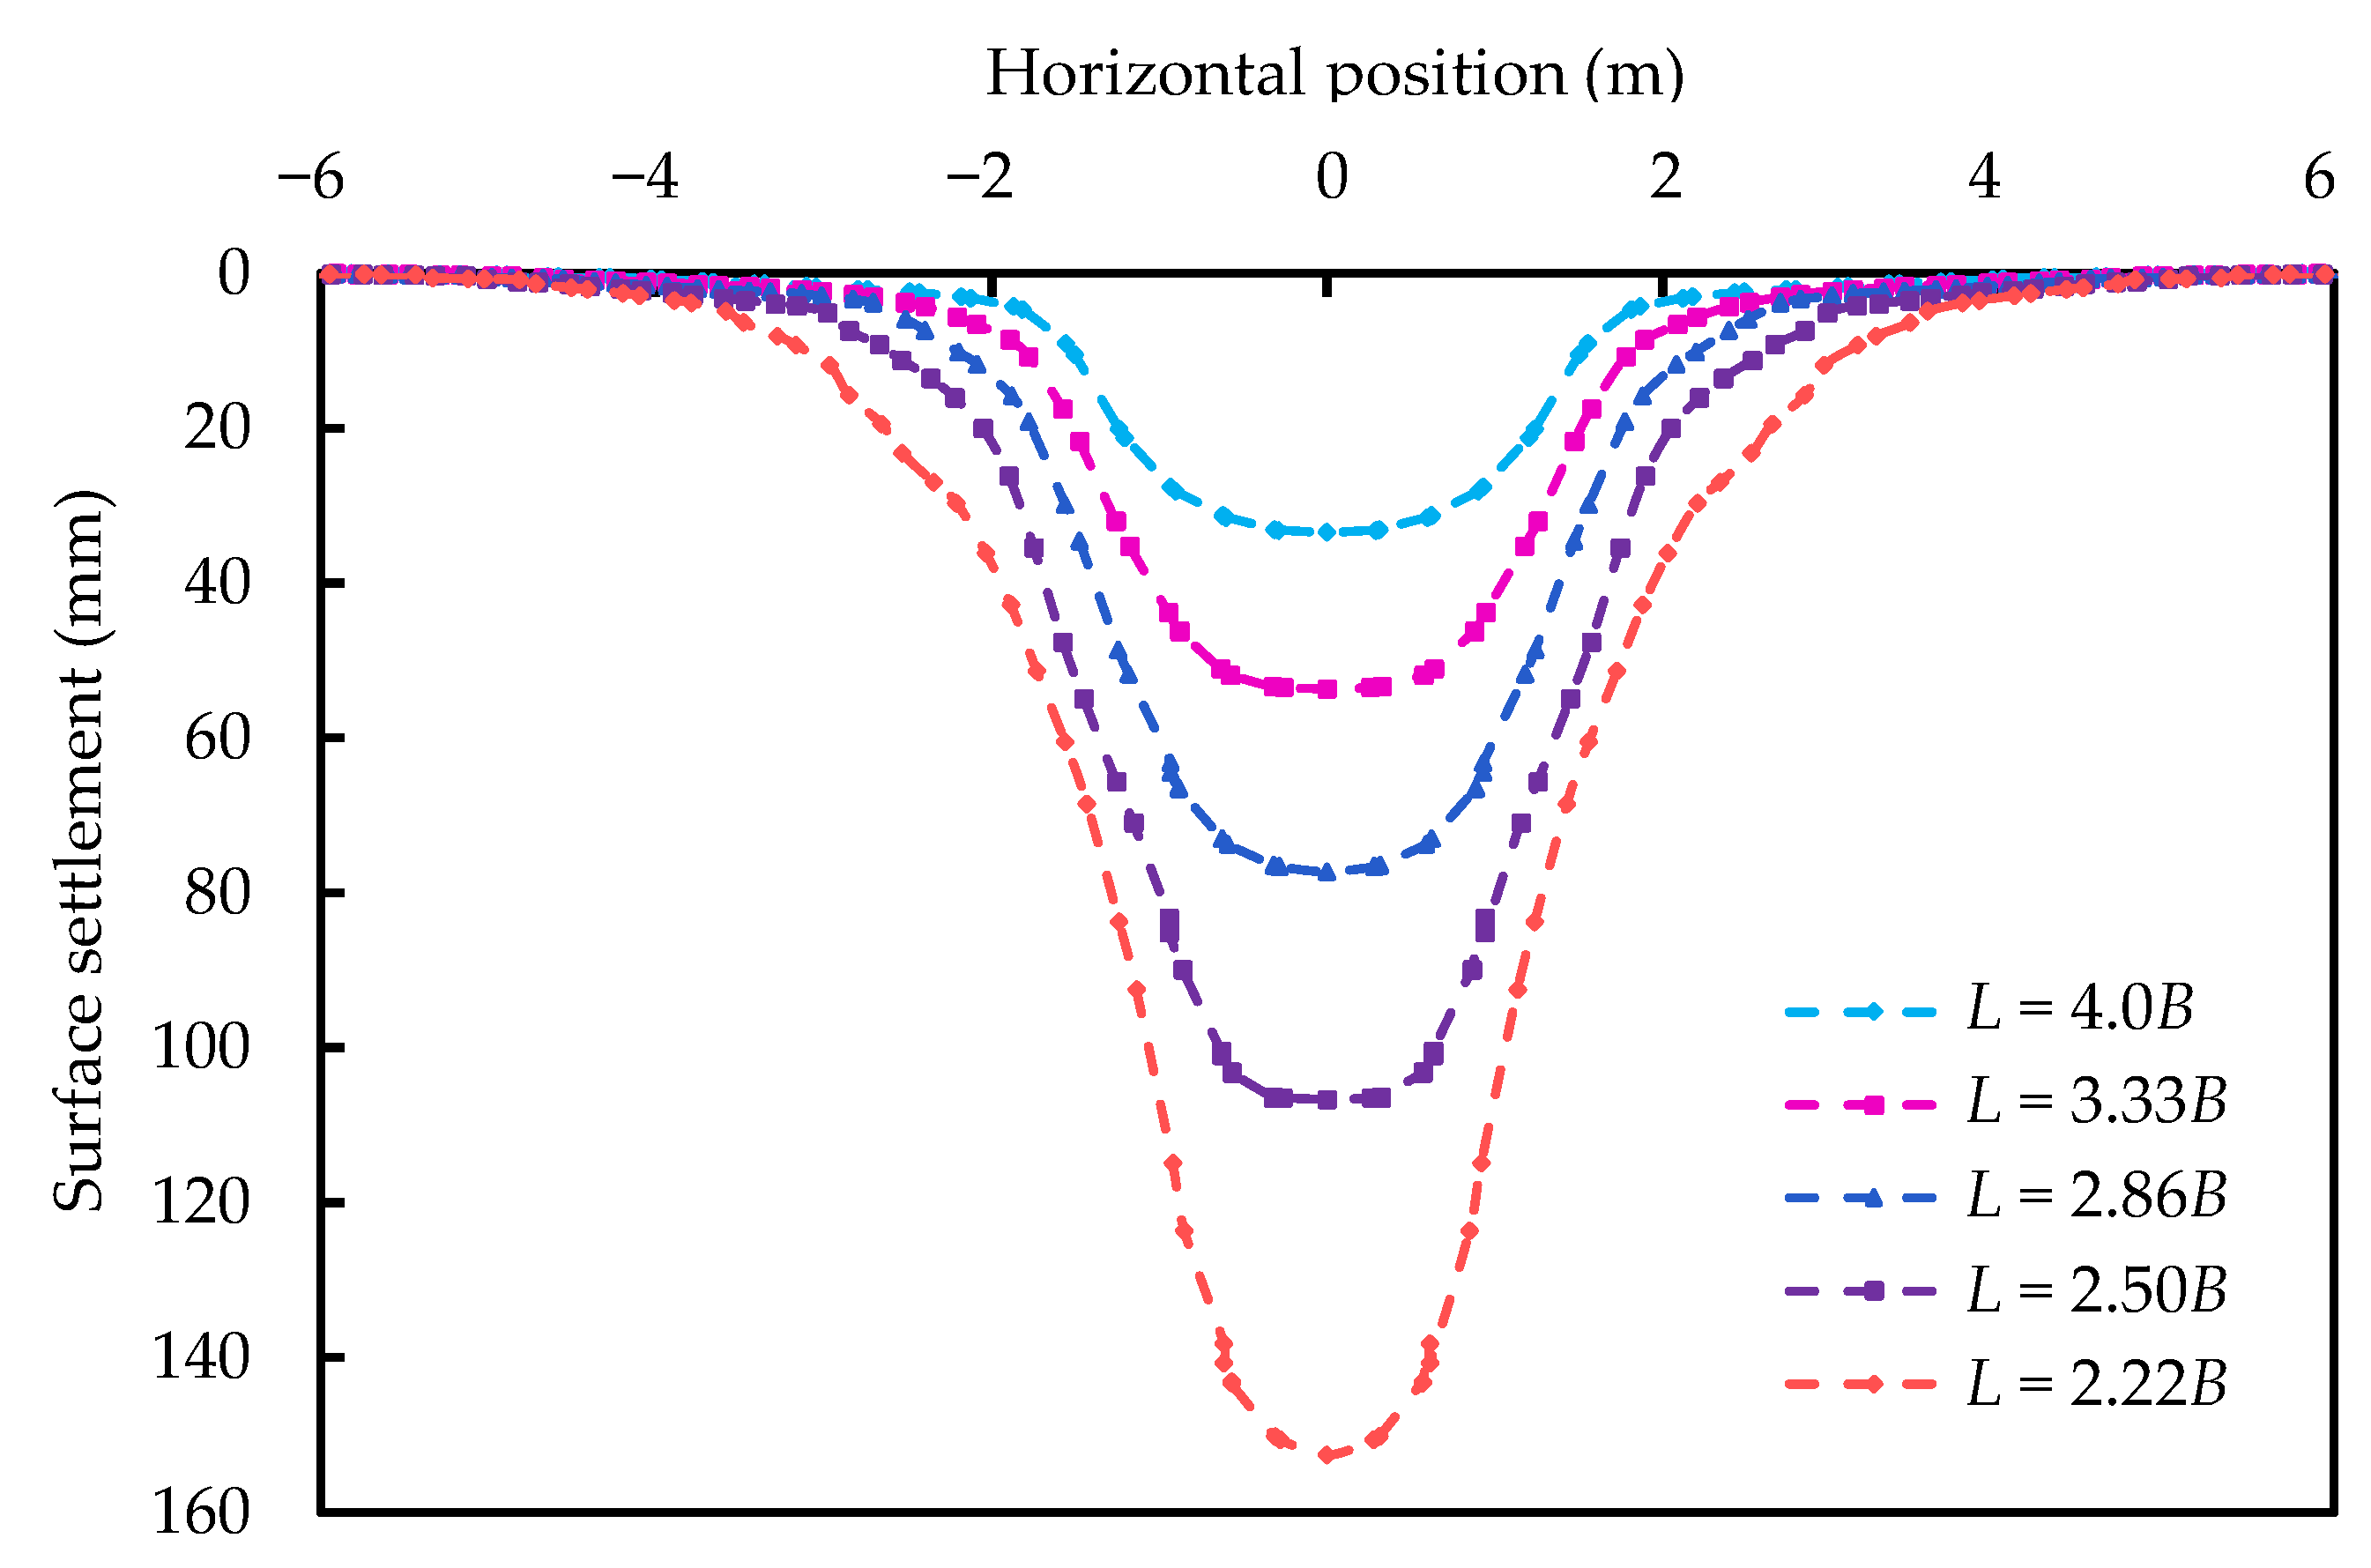
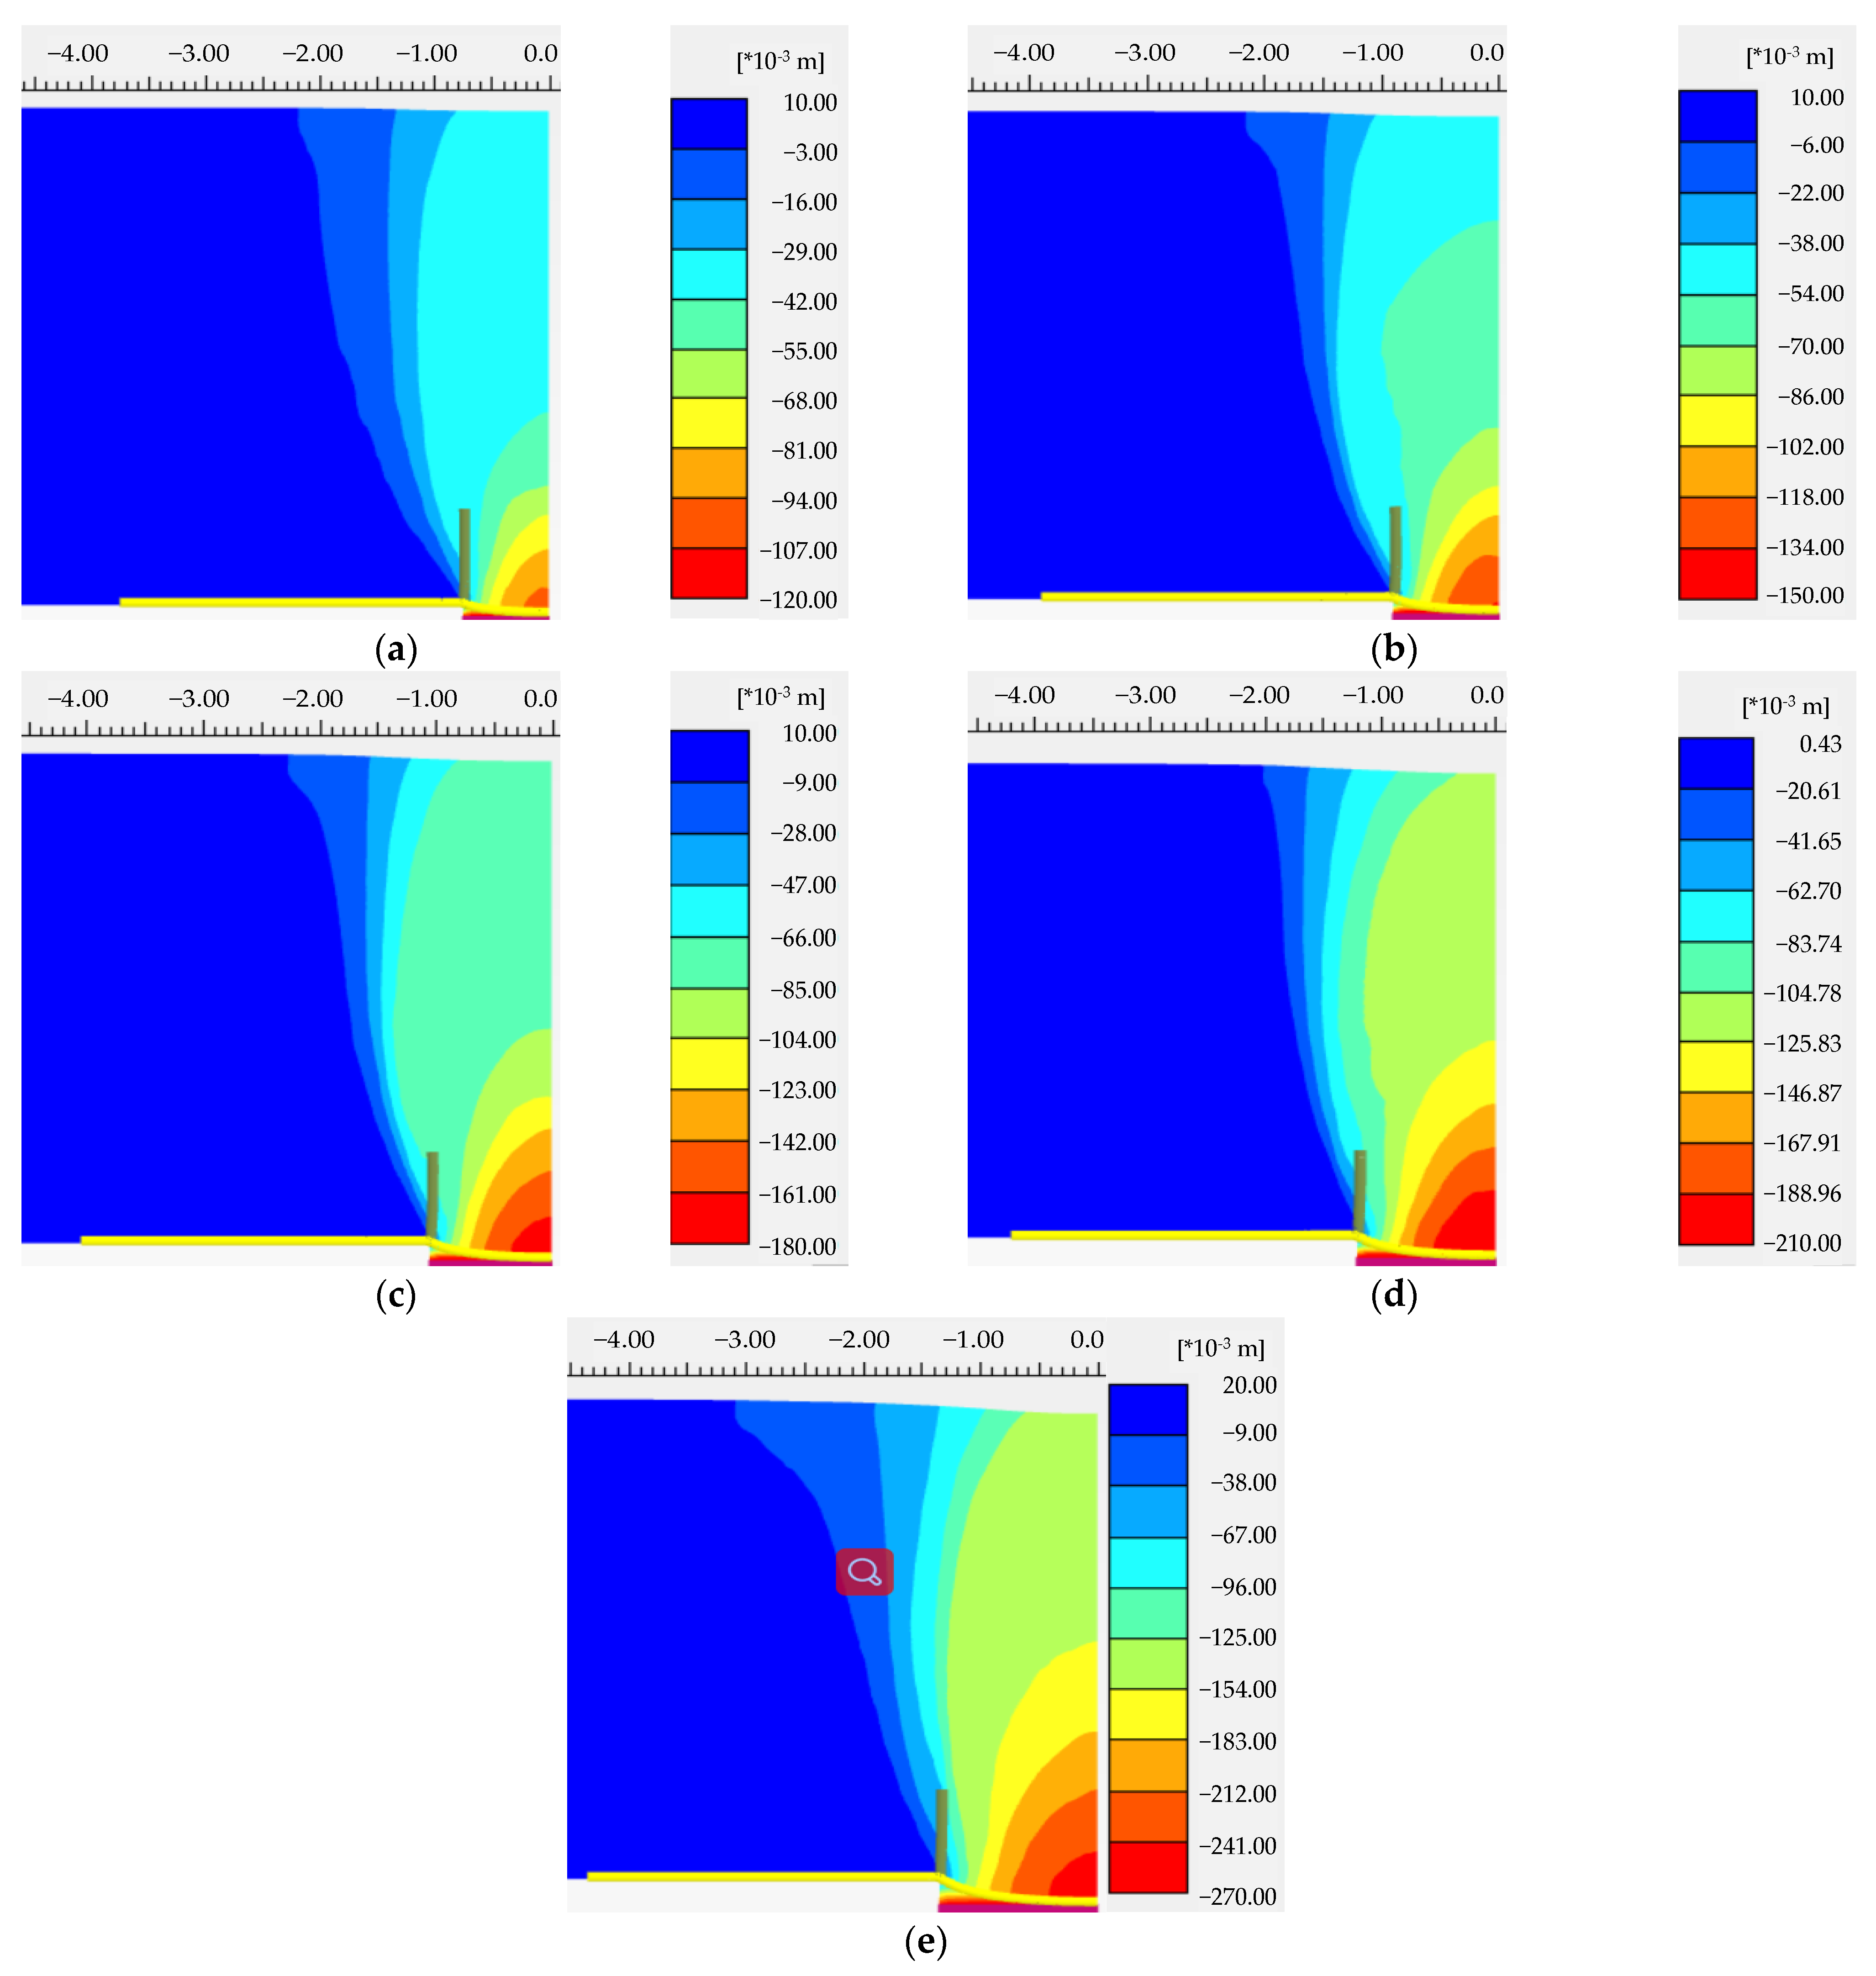
4.3. Analysis of the Soil Displacement
5. Conclusions
Author Contributions
Funding
Institutional Review Board Statement
Informed Consent Statement
Data Availability Statement
Conflicts of Interest
References
- Yan, F.Y.; Qiu, W.G.; Sun, K.G.; Jiang, S.H.; Huang, H.Y.; Hong, Y.Q.; Hou, Z.H. Investigation of a large ground collapse, water inrush and mud outburst, and countermeasures during subway excavation in Qingdao: A case study. Tunn. Undergr. Space Technol. 2021, 117, 104127. [Google Scholar] [CrossRef]
- Song, K.I.; Cho, G.C.; Chang, S.B. Identification, remediation, and analysis of karst sinkholes in the longest railroadunnel in South Korea. Eng. Geol. 2012, 135, 92–105. [Google Scholar] [CrossRef]
- Carbonel, D.; Rodriguez-Tribaldos, V.; Gutierrez, F.; Galve, J.P.; Guerrero, J.; Zarroca, M.; Roque, C.; Linares, R.; McCalpin, J.P.; Acosta, E. Investigating a damaging buried sinkhole cluster in an urban area (Zaragoza city, NE Spain) integrating multiple techniques: Geomorphological surveys, DInSAR, DEMs, GPR, ERT, and trenching. Geomorphology 2014, 229, 3–16. [Google Scholar] [CrossRef]
- Zhou, W.F.; Lei, M.T. Summary editorial for karst hydrogeology: Advances in karst collapse studies. Environ. Earth Sci. 2018, 77, 803. [Google Scholar] [CrossRef]
- Zhang, N.; Shen, J.S.; Lin, C.; Arulrajah, A.; Chai, J.C. Investigation of a large ground collapse and countermeasures during mountain tunnelling in Hangzhou: A case study. Bull. Eng. Geol. Environ. 2019, 78, 991–1003. [Google Scholar] [CrossRef]
- Billi, A.; De Filippis, L.; Poncia, P.P.; Sella, P.; Faccenna, C. Hidden sinkholes and karst cavities in the travertine plateau of a highly-populated geothermal seismic territory (Tivoli, central Italy). Geomorphology 2016, 255, 63–80. [Google Scholar] [CrossRef]
- Li, B.; Feng, Z.; Wang, G.Z.; Wang, W.P. Processes and behaviors of block topple avalanches resulting from carbonate slope failures due to underground mining. Environ. Earth Sci. 2016, 75, 694. [Google Scholar] [CrossRef]
- Jiao, Y.Y.; Wang, Z.H.; Wang, X.Z.; Adoko, A.C.; Yang, Z.X. Stability assessment of an ancient landslide crossed by two coal mine tunnels. Eng. Geol. 2013, 159, 36–44. [Google Scholar] [CrossRef]
- Jones, C.J.F.P.; Cooper, A.H. Road construction over voids caused by active gypsum dissolution, with an example from Ripon, North Yorkshire, England. Environ. Geol. 2005, 48, 384–394. [Google Scholar] [CrossRef]
- Zhao, P.; Yuan, S.; Li, L.P.; Ge, Q.; Liu, J.; Du, L.H. Experimental study on the multi-impact resistance of a composite cushion composed of sand and geofoam. Geotext. Geomembr. 2021, 49, 45–56. [Google Scholar] [CrossRef]
- Galve, J.P.; Gutierrez, F.; Guerrero, J.; Alonso, J.; Diego, I. Optimizing the application of geosynthetics to roads in sinkhole-prone areas on the basis of hazard models and cost-benefit analyses. Geotext. Geomembr. 2012, 34, 80–92. [Google Scholar] [CrossRef]
- Keller, G.R. Application of geosynthetics on low-volume roads. Transp. Geotech. 2016, 8, 119–131. [Google Scholar] [CrossRef]
- Zornberg, J.G.; Azevedo, M.; Sikkema, M.; Odgers, B. Geosynthetics with enhanced lateral drainage capabilities in roadway systems. Transp. Geotech. 2017, 12, 85–100. [Google Scholar] [CrossRef]
- Rehman, Z.U.; Khalid, U. Reuse of COVID-19 face mask for the amelioration of mechanical properties of fat clay: A novel solution to an emerging waste problem. Sci. Total Environ. 2021, 794, 148746. [Google Scholar] [CrossRef]
- Rehman, Z.U.; Khalid, U. Optimization of COVID-19 face mask waste fibers and silica fume as a balanced mechanical ameliorator of fat clay using response surface methodology. Environ. Sci. Pollut. Res. 2022, 29, 17001–17016. [Google Scholar] [CrossRef]
- Bricancon, L.; Villard, P. Design of geosynthetic-reinforced platforms spanning localized sinkholes. Geotext. Geomembr. 2008, 26, 416–428. [Google Scholar] [CrossRef]
- Villard, P.; Gourc, J.P.; Giraud, H. A geosynthetic reinforcement solution to prevent the formation of localized sinkholes. Can. Geotech. J. 2000, 37, 987–999. [Google Scholar] [CrossRef]
- Fu, H.Y.; Yin, M.M.; He, W. Study of design theory of geosynthetics for treating road sinkhole collapse hazard in karst terrain. Rock Soil Mech. 2011, 32, 2983–2988. (In Chinese) [Google Scholar]
- Mehrjardi, G.T.; Khazaei, M. Scale effect on the behaviour of geogrid-reinforced soil under repeated loads. Geotext. Geomembr. 2017, 45, 603–615. [Google Scholar] [CrossRef]
- Huckert, A.; Briancon, L.; Villard, P.; Garcin, P. Load transfer mechanisms in geotextile-reinforced embankments overlying voids: Experimental and analytical approaches. Geotext. Geomembr. 2016, 44, 442–456. [Google Scholar] [CrossRef]
- Eekelen, S.J.M.V.; Bezuijen, A.; Lodder, H.J.; Tol, A.F.V. Model experiments on piled embankments. Part I. Geotext. Geomembr. 2012, 32, 69–81. [Google Scholar] [CrossRef]
- Chawla, S.; Shahu, J.T. Reinforcement and mud-pumping benefits of geosynthetics in railway tracks: Model tests. Geotext. Geomembr. 2016, 44, 366–380. [Google Scholar] [CrossRef]
- King, D.J.; Bouazza, A.; Gniel, J.R.; Rowe, R.K.; Bui, H.H. Serviceability design for geosynthetic reinforced column supported embankments. Geotext. Geomembr. 2017, 45, 261–279. [Google Scholar] [CrossRef]
- Villard, P.; Huckert, A.; Briancon, L. Load transfer mechanisms in geotextile-reinforced embankments overlying voids: Numerical approach and design. Geotext. Geomembr. 2016, 44, 381–395. [Google Scholar] [CrossRef]
- Huckert, A.; Garcin, P.; Villard, P.; Brianon, L.; Auray, G. Experimental and numerical approaches of the design of geotextile reinforced embankments prone to sinkholes. In Proceedings of the 10th International Conference on Geosynthetics, Berlin, Germany, 21–25 September 2014. [Google Scholar]
- Briancon, L.; Villard, P.; Chevalier, B. New developments in the modeling and the design of geosynthetic reinforcements of platforms subjected to localized sinkholes. In Proceedings of the Advances in Analysis, Modeling & Design, GeoFlorida, West Palm Beach, FL, USA, 20–24 February 2010; pp. 664–671. [Google Scholar]
- Wu, D.; Luo, C.; Li, Y.K.; Yang, Y.X.; Liang, Y.H.; Wu, J.J. Application of a geotextile in the treatment of post-subsidence in Karst Areas. Appl. Sci. 2021, 11, 11826. [Google Scholar] [CrossRef]
- Zhang, J.; Liu, S.W.; Pu, H.F. Evaluation of an improved technique for geosynthetic-reinforced and pile-supported embankment. Adv. Mater. Sci. Eng. 2015, 2015, 612760. [Google Scholar] [CrossRef]
- Feng, S.Y.; Xu, R.Q.; Cheng, K.; Yu, J.L.; Jia, Q.J. Centrifuge model test on the performance of geogrid-reinforced and pile-supported embankment over soft soil. Soil Mech. Found. Eng. 2020, 57, 244–251. [Google Scholar] [CrossRef]
- Wu, D.; Wu, J.J.; Xu, C.; Chen, X.J.; Huang, X. Model test of geotextiles in controlling the collapse of karst roadbed. Rock Soil Mech. 2020, 41, 1–11. (In Chinese) [Google Scholar]
- Wu, D.; Luo, C.; Wu, J.J. Model tests of geotextile in collapse treatment of karst subgrade. In Proceedings of the 6th International Conference on Hydraulic and Civil Engineering, Xi’an, China, 11–13 December 2020; Volume 643, p. 012058. [Google Scholar]
- Wu, D.; Liang, Y.H.; Luo, C.; Wu, J.J. Influence of collapse width on the effect of geotextile in controlling subgrade collapse based on symmetrical semisection model tests. In Proceedings of the 6th International Conference on Hydraulic and Civil Engineering, Xi’an, China, 11–13 December 2020; Volume 643, p. 012006. [Google Scholar]
- Wang, L.P.; Zhang, G.; Zhang, J.M. Centrifuge model tests of geotextile-reinforced soil embankments during an earthquake. Geotext. Geomembr. 2011, 29, 222–232. [Google Scholar] [CrossRef]
- British Standard 8006; Code of Practice for Strengthened/Reinforced Soils and Other Fills. British Standard Institution: London, UK, 2010.


| Variation | Test No. | Subsidence Width, B (mm) | Anchorage Length of the Geotextile, L (mm) | Anchorage Ratio, L/B | Buried Depth of the Geotextile, H (mm) |
|---|---|---|---|---|---|
| Subsidence width | H1 | 300 | 1200 | 4.0 | 1000 |
| H2 | 150 | 600 | 4.0 | 1000 | |
| H3 | 300 | 600 | 2.0 | 1000 | |
| H4 | 600 | 600 | 1.0 | 1000 |
| Parameters of Sand | Density, t/m3 | Maximum Dry Density, t/m3 | Moisture Content, % | Internal Friction Angle, ° | Cohesion, kPa | Relative Density of Sand, t/m3 |
|---|---|---|---|---|---|---|
| Li-River sand | 1.61 | 1.68 | 1.03 | 32.8 | 0.20 | 2.63 |
| Weight of Per Unit Area, g/m2 | Thickness, mm | Tensile Strength, kN/m | Tensile Stiffness, kN/m |
|---|---|---|---|
| 60 | 0.16 | 3.22 | 48 |
| Variation | Numerical Model | Subsidence Width, B (mm) | Anchorage Length of Geotextile, L (mm) | Anchorage Ratio, L/B | Buried Depth of Geotextile, H (mm) | Tensile Stiffness of Geotextile, EA/(kN·m−1) |
|---|---|---|---|---|---|---|
| Subsidence width | P1 | 1500 | 6000 | 4.0 | 5000 | 3000 |
| P2 | 3000 | 6000 | 2.0 | 5000 | 3000 | |
| P3 | 6000 | 6000 | 1.0 | 5000 | 3000 | |
| P4 | 750 | 3000 | 4.0 | 5000 | 3000 | |
| P5 | 900 | 3000 | 3.33 | 5000 | 3000 | |
| P6 | 1050 | 3000 | 2.86 | 5000 | 3000 | |
| P7 | 1200 | 3000 | 2.50 | 5000 | 3000 | |
| P8 | 1350 | 3000 | 2.22 | 5000 | 3000 | |
| P9 | 1500 | 3000 | 2.0 | 5000 | 3000 | |
| P10 | 3000 | 3000 | 1.0 | 5000 | 3000 |
| Anchorage Ratio, L/B | Maximum Subgrade Collapse, ds (mm) | Deformation Range of the Pavement, Ds (m) | The Ratio of the Maximum Subgrade Collapse to the Deformation Range of Pavement, ds/Ds |
|---|---|---|---|
| 4.0 | 33.46 | 12.24 | 0.27% |
| 3.33 | 53.59 | 12.42 | 0.43% |
| 2.86 | 77.24 | 13.04 | 0.59% |
| 2.50 | 106.64 | 13.34 | 0.80% |
| 2.22 | 152.57 | 17.44 | 0.87% |
Publisher’s Note: MDPI stays neutral with regard to jurisdictional claims in published maps and institutional affiliations. |
© 2022 by the authors. Licensee MDPI, Basel, Switzerland. This article is an open access article distributed under the terms and conditions of the Creative Commons Attribution (CC BY) license (https://creativecommons.org/licenses/by/4.0/).
Share and Cite
Wu, D.; Liang, Y.; Yang, Y.; Wu, J. Study of the Subsidence Width Influence on the Geotextile Control of a Subgrade Collapse Based on a Half-Symmetric Model Test. Appl. Sci. 2022, 12, 9504. https://doi.org/10.3390/app12199504
Wu D, Liang Y, Yang Y, Wu J. Study of the Subsidence Width Influence on the Geotextile Control of a Subgrade Collapse Based on a Half-Symmetric Model Test. Applied Sciences. 2022; 12(19):9504. https://doi.org/10.3390/app12199504
Chicago/Turabian StyleWu, Di, Yihuai Liang, Yanxin Yang, and Jianjian Wu. 2022. "Study of the Subsidence Width Influence on the Geotextile Control of a Subgrade Collapse Based on a Half-Symmetric Model Test" Applied Sciences 12, no. 19: 9504. https://doi.org/10.3390/app12199504
APA StyleWu, D., Liang, Y., Yang, Y., & Wu, J. (2022). Study of the Subsidence Width Influence on the Geotextile Control of a Subgrade Collapse Based on a Half-Symmetric Model Test. Applied Sciences, 12(19), 9504. https://doi.org/10.3390/app12199504