Article

Potential of Computer-Aided Engineering in the Design of Ground-Improvement Technologies

1
Graduate School of Engineering and Science, Shibaura Institute of Technology, 3-7-5 Toyosu, Koto-ku, Tokyo 135-8548, Japan
2
College of Engineering, Shibaura Institute of Technology, 3-7-5 Toyosu, Koto-ku, Tokyo 135-8548, Japan
3
Department of Civil Engineering, Kasetsart University, 50 Ngamwongwan Rd., Chatuchak, Bangkok 10900, Thailand
*
Authors to whom correspondence should be addressed.
Appl. Sci. 2022, 12(19), 9675; https://doi.org/10.3390/app12199675
Submission received: 3 September 2022 / Revised: 20 September 2022 / Accepted: 22 September 2022 / Published: 26 September 2022

Abstract

:
The progress status of jet-grouting construction during the construction phase is difficult to verify and even after the completion of construction, it can be verified only by empirical methods. This study attempted to recreate a realistic simulation result of the middle-pressure jet-grouting method by establishing a computer-aided engineering (CAE) system from the planning/design stage of the ground model and verifying the validity of the construction process after the model was analyzed by the moving particle semi-implicit (MPS) method. The governing parameters for the ground were determined by the MPS simulation of the unconfined compression test. The construction simulation was analyzed and the results were validated by visual confirmation of the related phenomena, such as the soil-improved body formation and mud discharge. To verify the accuracy of the mud discharge phenomenon, three different probe regions were set above the model ground and the amount of mud discharge generated in each region was computed before drawing an overall conclusion of the study. A soil-improvement body of approximately 0.38 m3 was observed to have formed at the end of the study and the highest mud discharge particle number measured, for instance, was 896. This study is expected to serve as a guideline for further studies on simulation-based research.

1. Introduction

Jet-grouting technology is a popular ground-improvement method, which has found its wide application in improvements in social infrastructure, such as railways, ports, roads, and water and sewer systems [1,2,3,4,5,6,7]. This technology was first developed in Japan in 1970 for cylindrical soil-improvement body formation by spraying cement slurry, as a single-pipe-type high-pressure jet-grouting method [8,9,10,11,12,13,14,15,16,17]. The single-pipe-type high-pressure jet-grouting method sprays the cement grout at high pressure from one or more nozzles attached at the end of a single-pipe jet-grouting string and forms the cylindrical soil-improvement body. The ground is cut because of its high pressure and, at the same time, is mixed with the cement slurry, which on hardening, forms the cylindrical-shaped soil-improvement body. This technology has been upgraded in recent years, such that the higher-quality cylindrical soil-improvement body can be developed from a relatively low-pressure cement slurry jet. This is achieved by using silica sand or mechanical agitation, which will facilitate the mixing of the sprayed cement slurry with the cut ground (see Figure 1). Komaki et al. [18,19] successfully put this middle-pressure jet-grouting method to practical use. The sophistication of the design itself and the lack of an authentic performance evaluation method is the biggest problem encountered in ground-improvement methods. First of all, this whole construction mechanism is conducted on the in situ ground and is invisible to the naked eye. Next, the whole construction process is a complicated mechanism and, up to now, it has been put into practical use by making speculations experimentally and empirically and, finally, by checking the quality of soil-improvement body formation after construction. During the construction phase, it is impossible to confirm the construction status visually and proving its validity is difficult. However, if only this construction could be analytically verified, based on the mechanical theory, it would contribute to an explanation of the construction mechanism, the optimization of the construction method, and an improvement in the visualization technology for the improved body construction. Inazumi et al. [20] attempted to visualize and evaluate jet-grouting construction for two different middle-pressure jet-grouting methods and succeeded in the visualization of the construction status during and after the construction but made suggestions of requirements in further research.
In this study, a computer-aided engineering (CAE) system was applied to design a ground model and simulate the performance of a middle-pressure jet-grouting method by moving particle semi-implicit (MPS)-CAE method [21,22,23], which can tackle conditions, including ground failure phenomena and high-velocity fluids. An attempt was made to evaluate and verify the authenticity of a columnar soil-improvement body formation status using the jet-grouting method at middle pressure using the “Particleworks” software.

2. CAE_MPS Method

2.1. Computer-Aided Engineering (CAE)

This is the general term coined for technology that deals with simulating and analyzing prototypes subjected to different site conditions on a computer after the analyzing model has been created by computer-aided design (CAD) [24,25,26,27]. This may also refer to computer-aided engineering works or a tool that utilizes computer technology to study product design, manufacturing, and process design. This technology can be utilized to visualize the condition of stress and others, which are normally hidden inside the ground during the construction process in the geotechnical engineering field. Thus, it can help understand the mechanism that occurs during the construction phase and take appropriate action to guide the process to the desirable outcome without needing to conduct expensive and difficult experiments. This technology allows for exporting of the visual data in the simulation so that even third parties can easily grasp the progress that has been achieved. In this study, the authors attempted to determine the potential of CAE in the design of ground-improvement technologies by using 3D CAD and MPS. The study was focused on the recreation and visualization of the jet-grouting method under middle jet pressure.

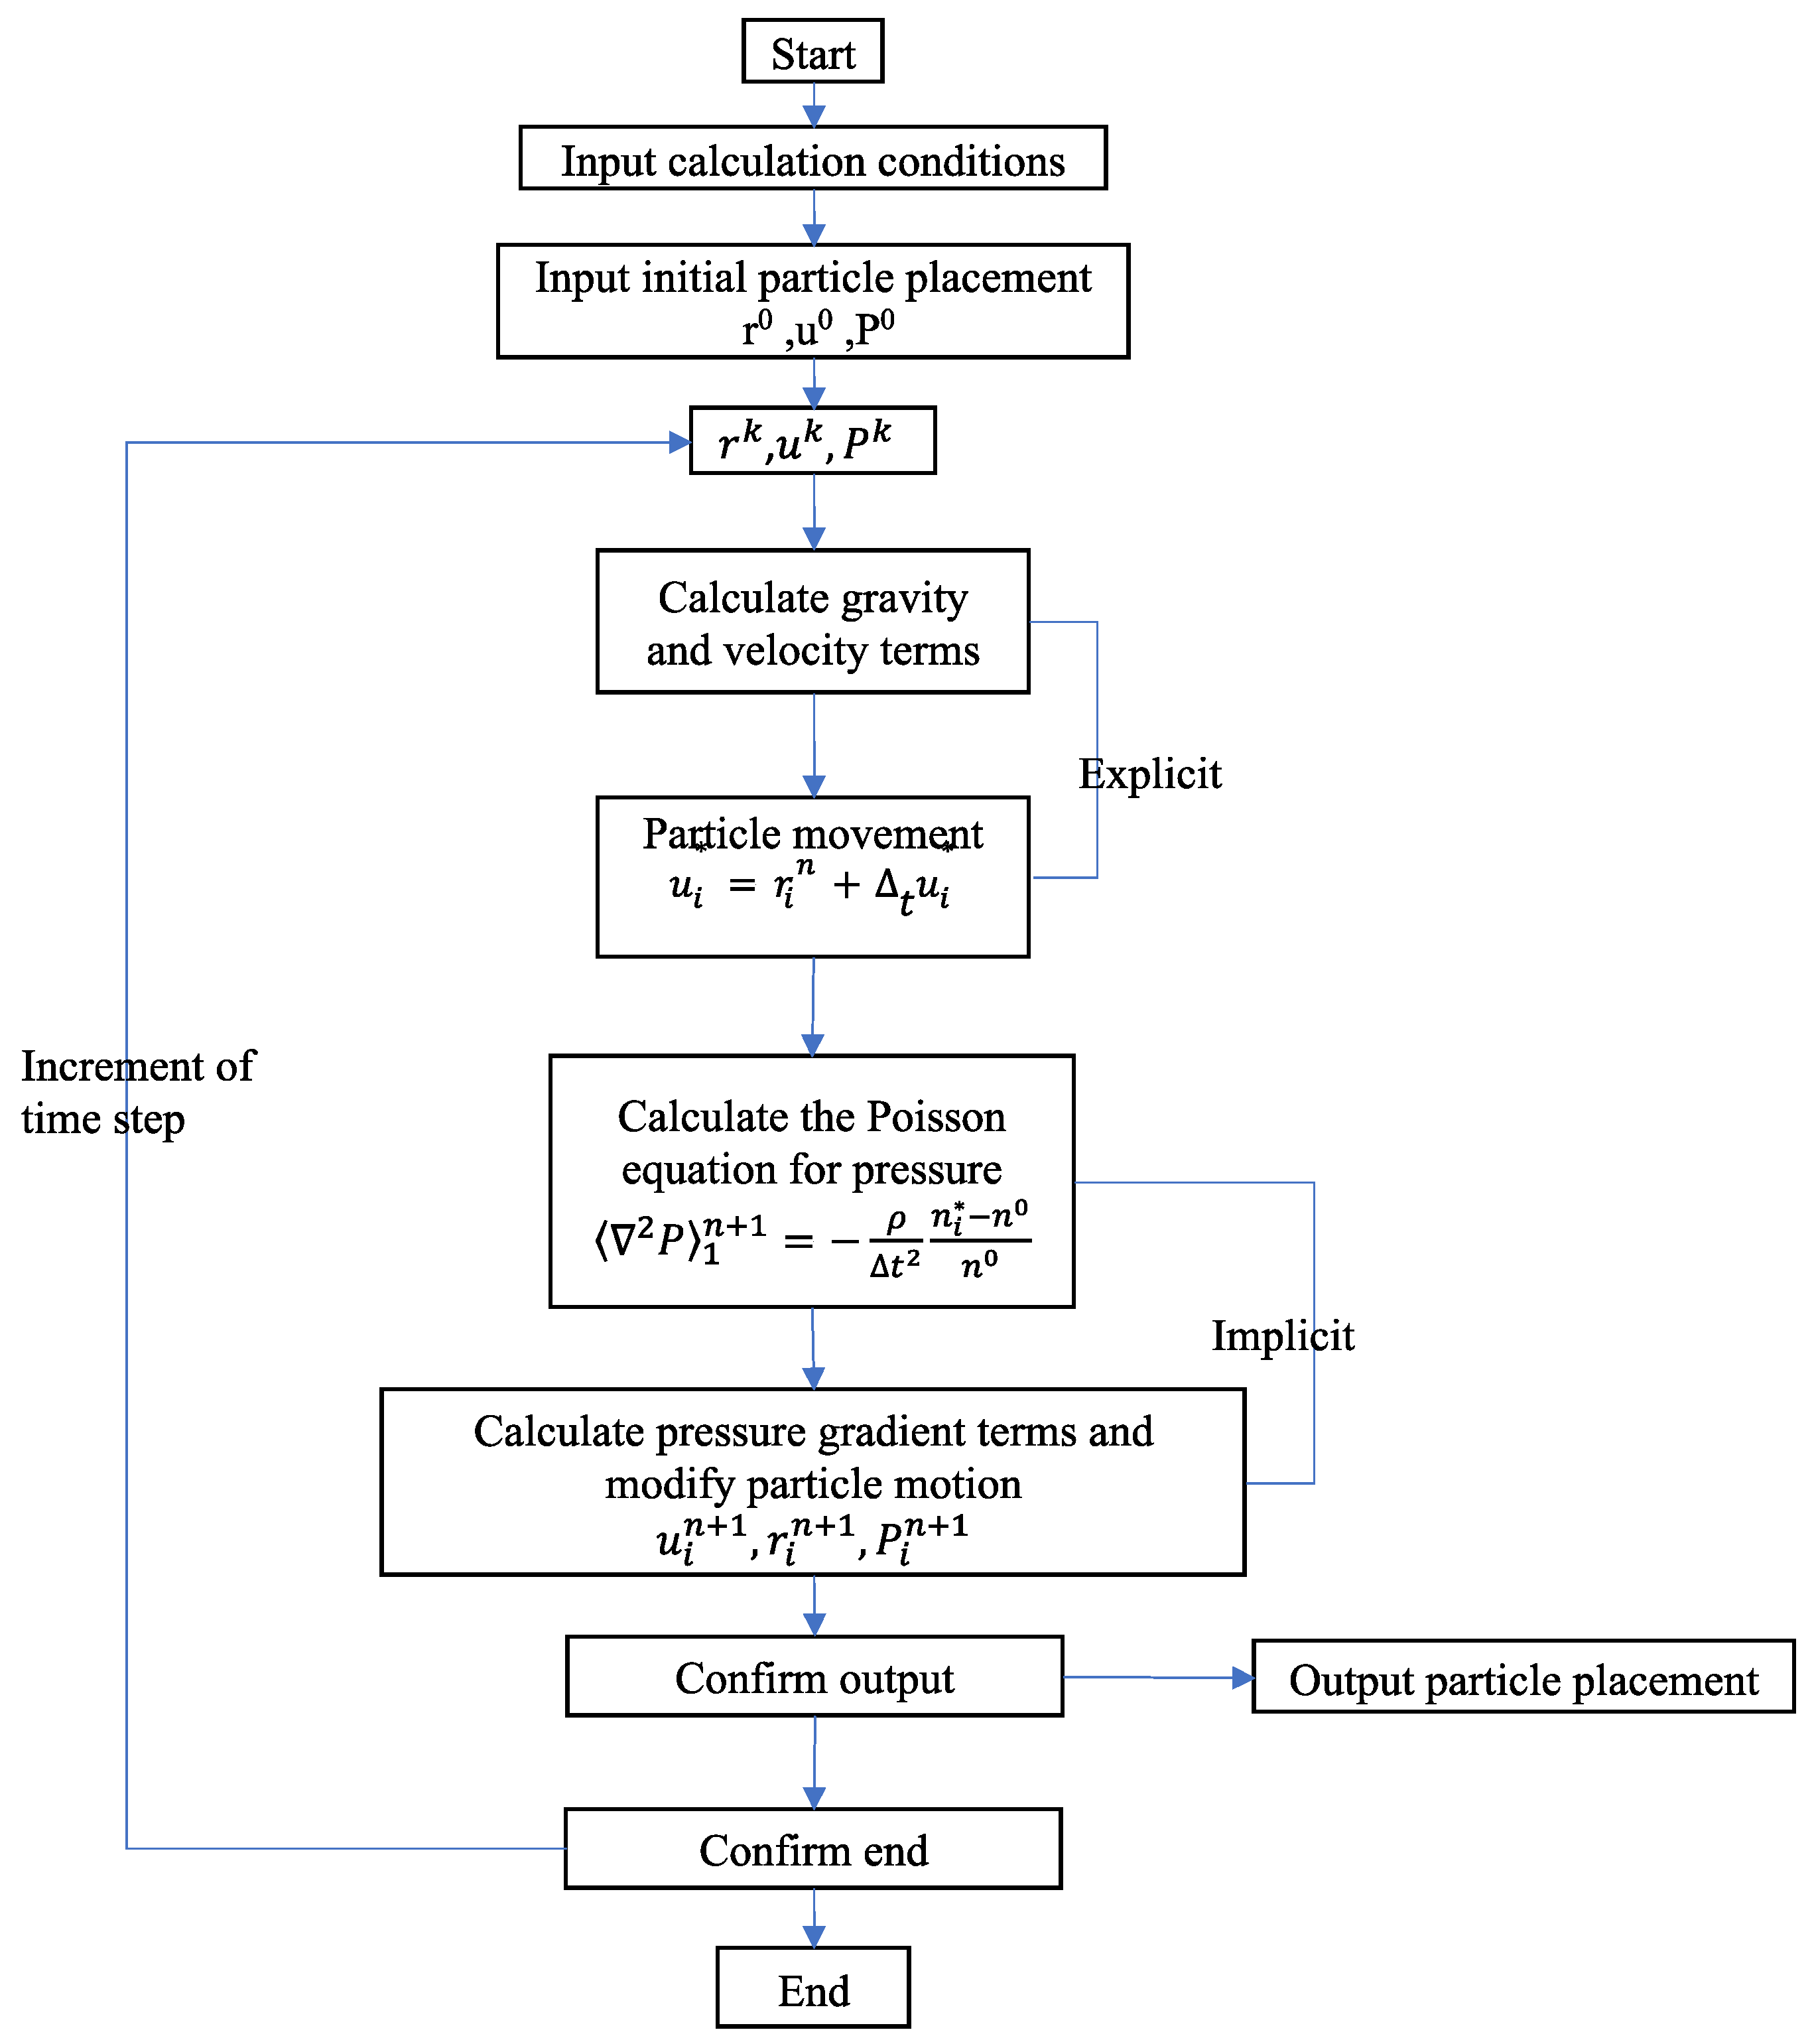
2.2. Particle Methods and Moving Particle Semi-Implicit (MPS) Method

The space is divided into grids and each grid is assigned a physical quantity as a variable for calculation in the grid method, e.g., finite element method (FEM) and the difference method (DM) [28]. Meanwhile, the PM discretizes the continuum as particles and it will move with each physical quantity in a Lagrangian manner at each calculation point. Literature review [29] shows the application of the distinct element method (DEM) in the calculation of movement by each particle, in which the interaction forces between particles are expressed by using friction coefficient, spring constant, damping constant, and so on.
In this study, the authors applied the MPS method [21,22,23] to analyze fluid particle behavior. For the incompressible flow used in the analysis, the governing equations are the mass conservation law of Equation (1) and Navier’s stroke law of Equation (2) with surface tension considered.
D ρ D t = 0
D u D t = 1 ρ P + ϑ 2 u + g + 1 ρ σ k δ n
where u is the velocity vector, ρ is the density of the fluid,   D u D t   is the rate of change in velocity vector, D ρ D t is the rate of change in density, P is the pressure, ϑ is the kinematic viscosity coefficient, g is the gravity vector, σ is the surface tension coefficient, k is the curvature, δ is the delta function for the surface tension acting on the surface, and n is the unit vector in the direction perpendicular to the surface.
In the MPS method, each differential operator (slope, divergence, and Laplacian) of the governing equation, as shown in Equation (2), is discretized by a weighting function [21,22,23]. The weighting function for the governing operator depends on the interparticle distance ( r ) and the influence radius ( R ) , which is equivalent to 2.1- to 4.1-times the interparticle distance in each particle interaction model.
The weighting function ( w ) is expressed by Equation (3); it is a function of distance r between particles and the effective radius ( R ) of the support domain.
w ( r ) = { R r 1 ( 0 r R ) 0 ( R r ) }
The sum of the weight functions in the support domain is commonly known as the particle number density ( n i ); it is defined as Equation (4).
n i = j i w i j
where w i j = w ( r i j ,   R ) is the weight function between particles ( i ) and ( j ). The particle number density, when the particles are located on a regular grid whose grid size is the same as the diameter of the particles, is called the criterion of the particle number density ( n * ).
In the derivative models for the traditional MPS method, the differential operators for the gradient, Laplacian, and divergence of a particle ( i ) are formulated as Equations (5)–(7).
< > i = d n * j i i j r i j 2 x i j w i j
< 2 > i = 2 d n * λ i j i i j w i j
< . Φ > i = d n * j i i j . x i j r i j 2 w i j
where Φ is an arbitrary vector, is an arbitrary scalar, and λ is a coefficient in the Laplacian model, which is defined as Equation (8).
λ i ¯ = j i w i j r i j 2 j i w i j
Figure 2 shows the basic calculation algorithm chart for the MPS method.

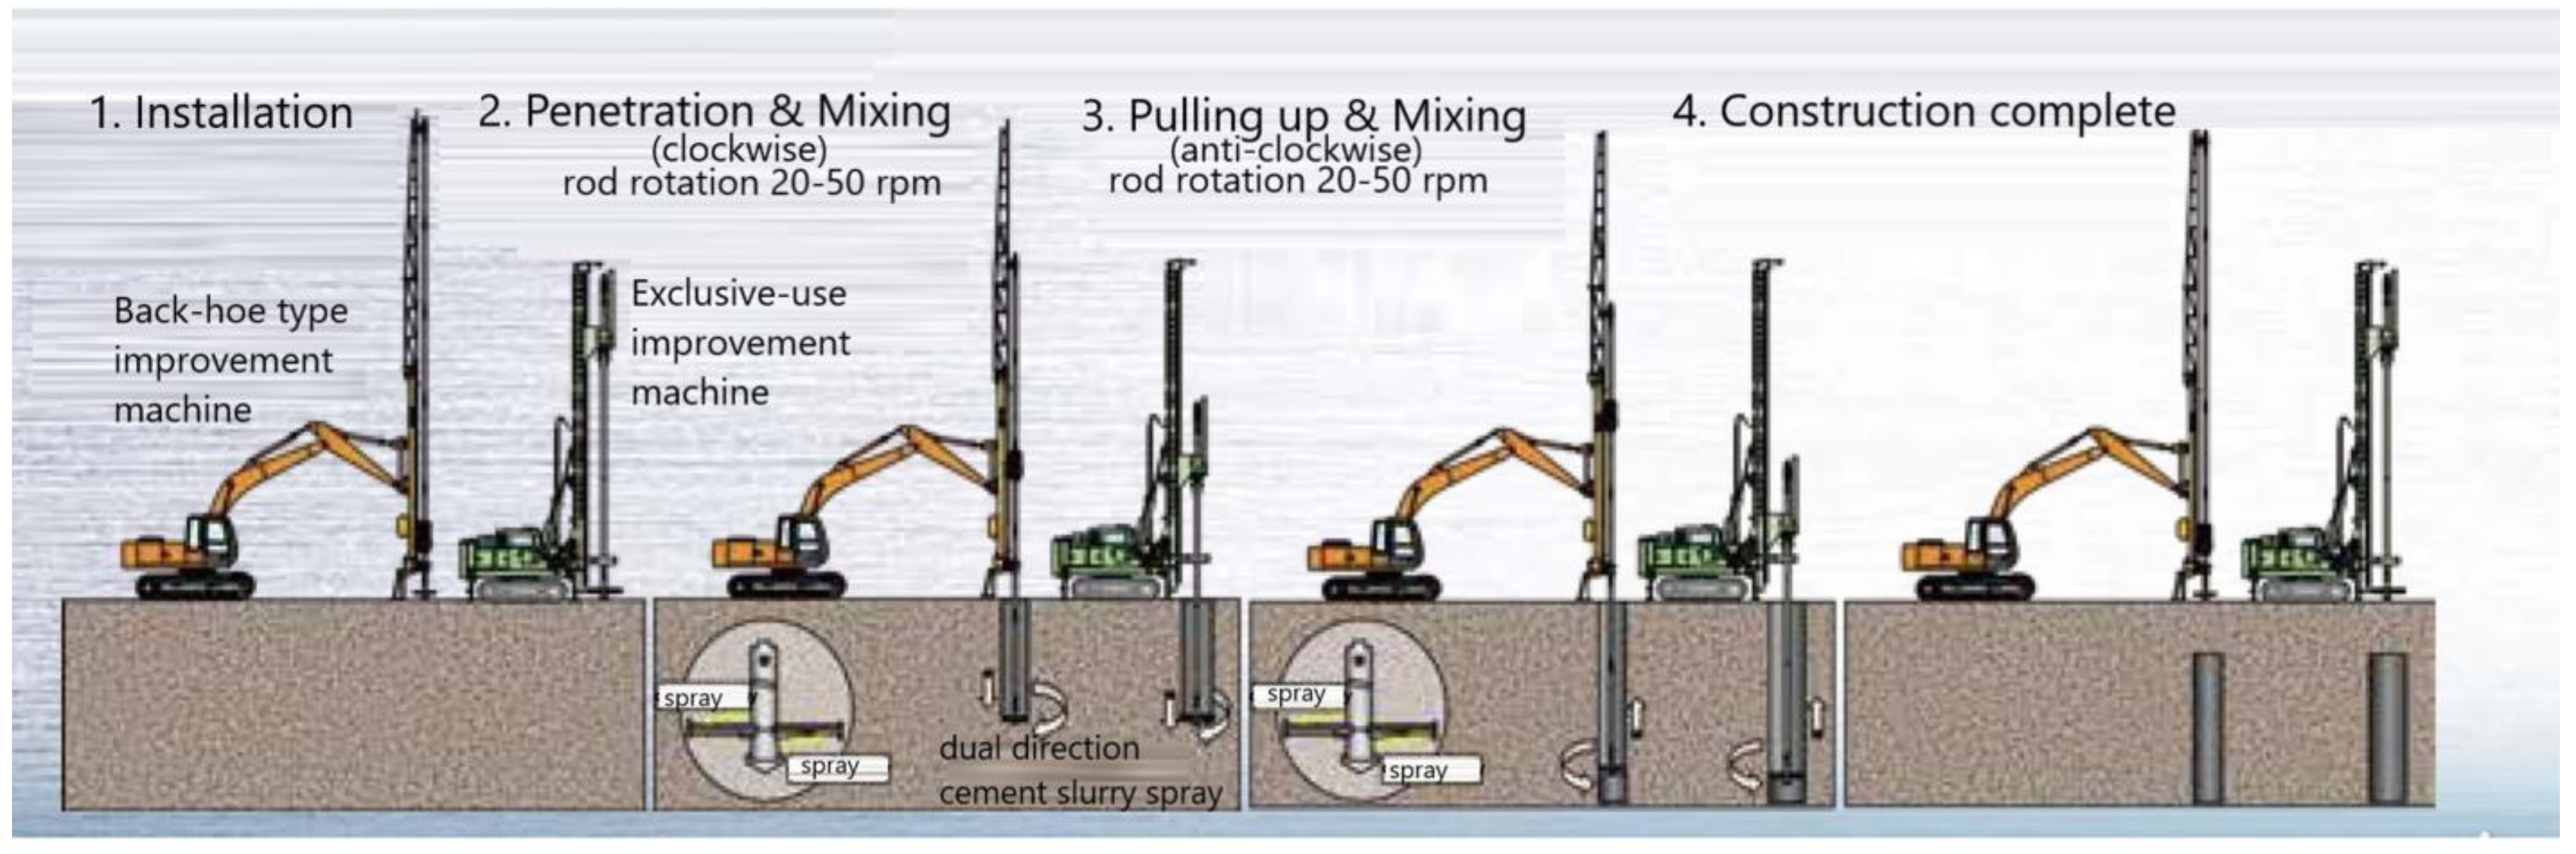
3. Outline of Middle-Pressure Jet-Grouting Method

This method is an innovative technology that uses jets with pressure values less than 20 MPa [18,19,20], but the equivalent or higher quality of soil-improved body formation can be achieved compared to the traditionally used high-pressure jet-grouting method. Komaki et al. [18] proposed the first middle-pressure jet-grouting method, containing a single-pipe rod with a jet nozzle, as shown in Figure 1, in which the ground is loosened by spraying a horizontal water jet while the rod is penetrating the ground. The rod is then pulled up and the cement slurry starts spraying at middle pressure in a counter-clockwise direction, producing a maximum 1 m diameter columnar soil-improved body. Komaki et al. [19] proposed the second method that uses a special mixing blade with an escape prevention plate at the end, attached to the rod for facilitating the mixing of soil and cement slurry mechanically that has been sprayed at middle pressure.
This ground-improvement method allows for the selection of one or both of the methods introduced by Komaki et al. [18,19]. Reduction in the surrounding soil displacement and promoting the soil discharge will help in the formation of a maximum-diameter columnar soil-improved body [30,31]. Thus, a sample confirmation test for a full-length columnar soil-improved body was conducted after a full-scale experiment and construction. The quality of construction was then verified by unconfined compression tests and others, but it was not analytically verified. Therefore, the authors attempted to analytically verify it for the middle-pressure jet-grouting method by applying the MPS-CAE method.

4. Methodology

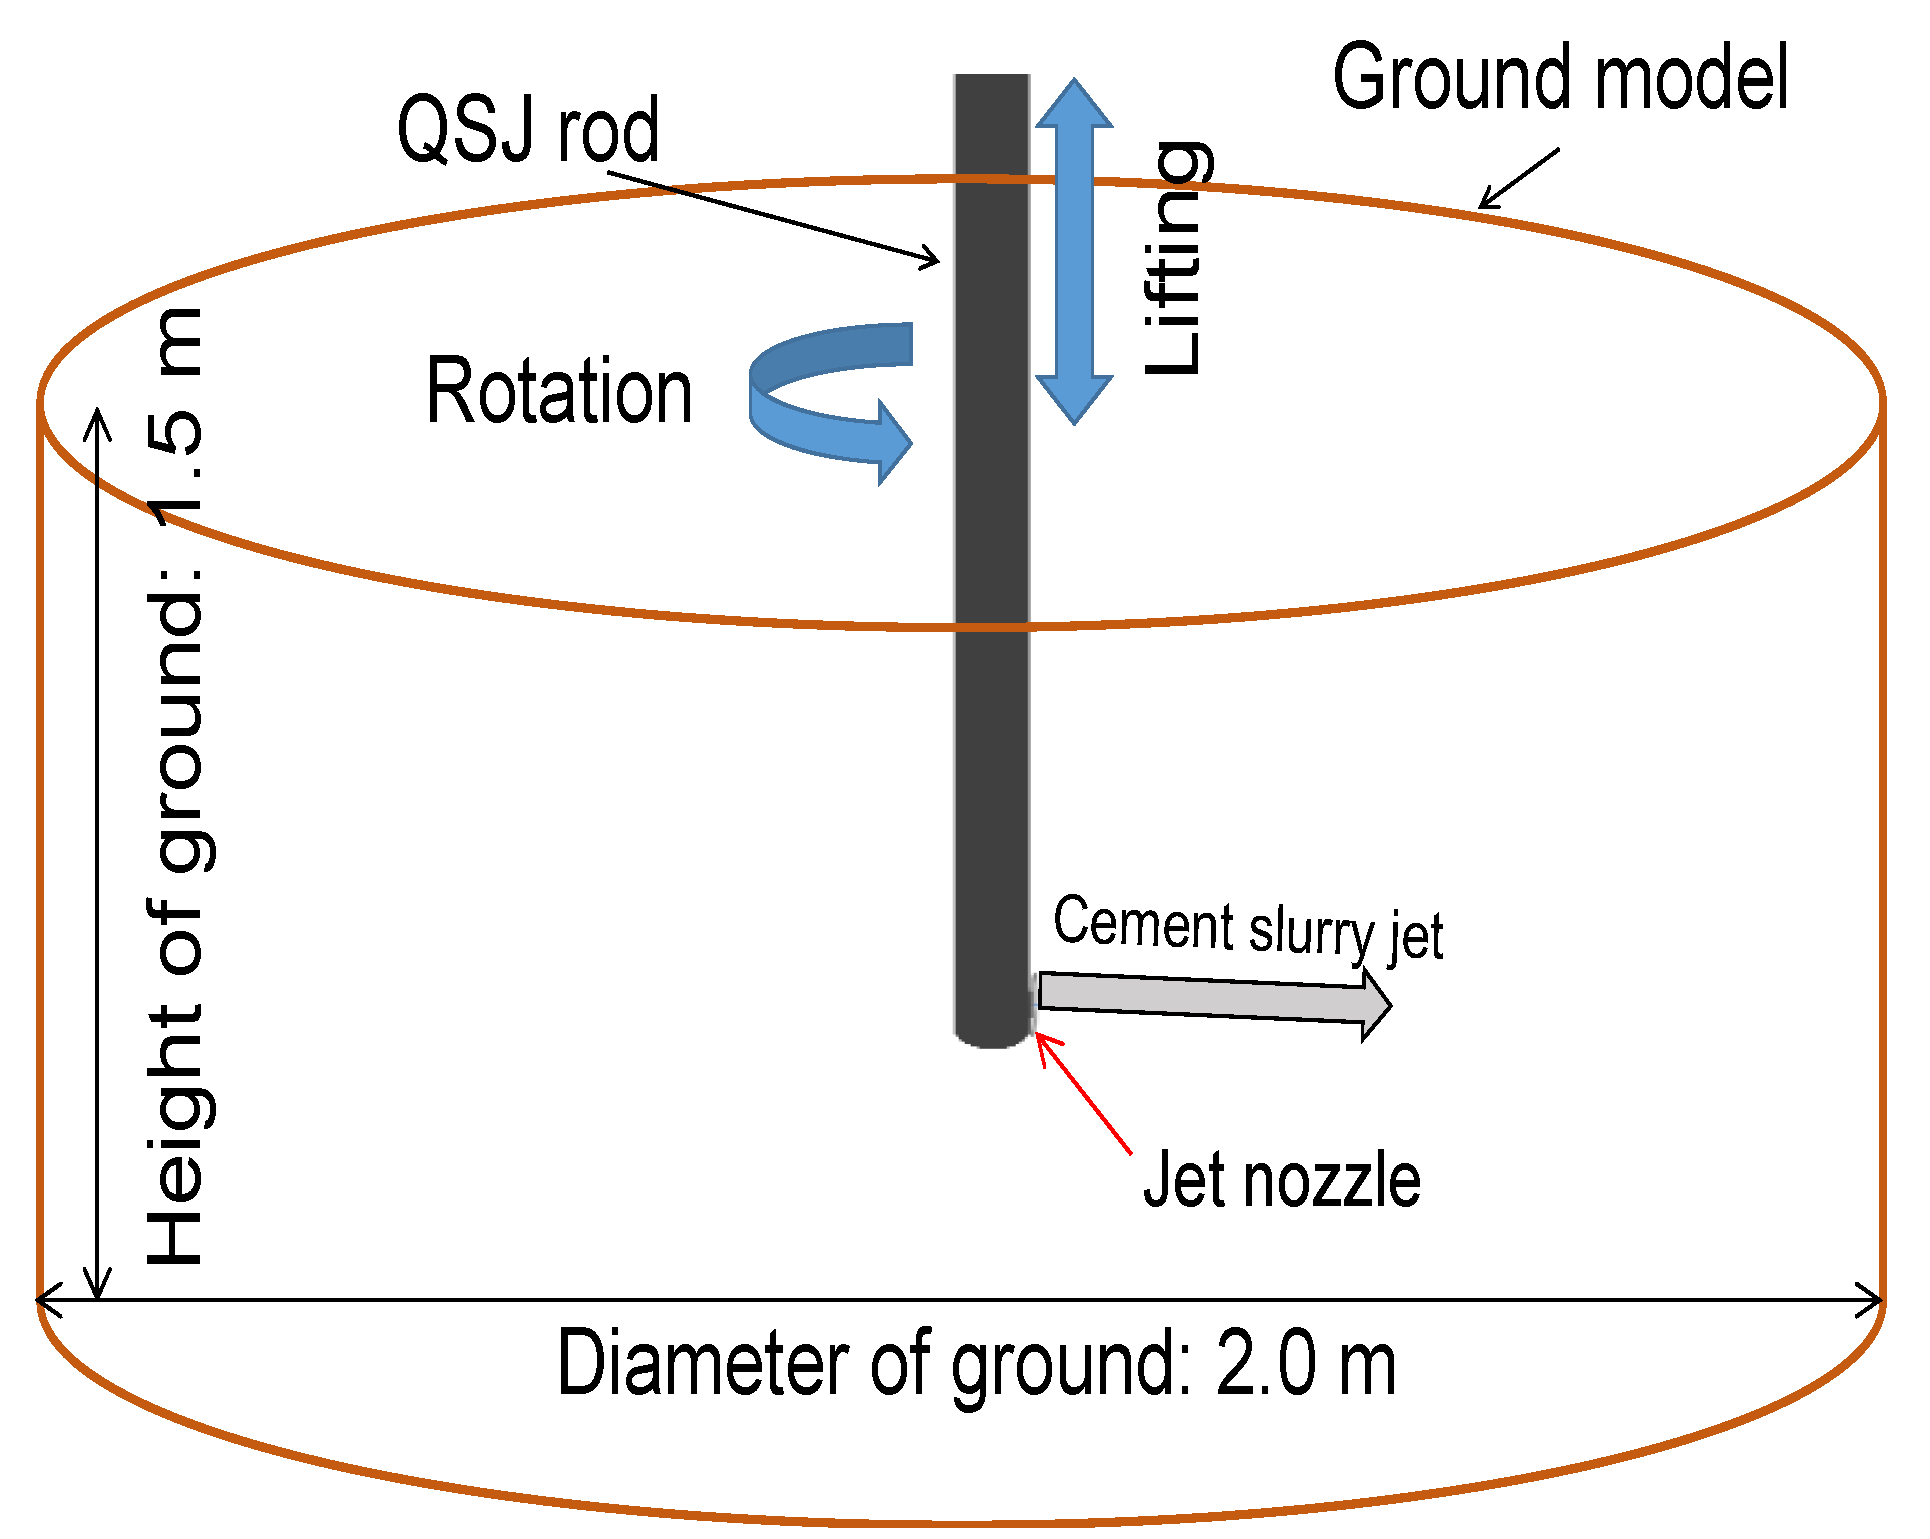
4.1. Ground Modelling

Figure 3 shows the actual-scale models for the jet-grouting method, created as the analytical models with the help of three-dimensional AutoCAD. The dimension of the cylindrical ground model spans a 2 m diameter and 1.5 m height and the jet material is expected to be sprayed in a horizontal direction from the jet nozzle at the bottom.

4.2. Analysis Conditions

Table 1 shows the analysis conditions for the jet-grouting construction. Water is sprayed for the first 20 s while digging continues until the desired depth is reached. Then, the injection fluid is switched to cement grout and the jet-grouting string is pulled upward while spraying cement grout. The total time of the cement grout spraying is 58 s and the height retracted upward is only 0.5 m and not up to the surface level.

4.3. Material Parameters

Table 2 shows the values of material parameters for water, cement slurry, and ground particles used in the analysis.
The water is a Newtonian fluid, so the general values of Newtonian fluid were used for the water particles. Meanwhile, the ground particles and cement slurry were assumed to be Bingham fluids, with the plastic viscosity value for cement slurry being measured by a B-type viscometer.
For cement slurry, other values can be measured by standard tests. Since the cement slurry was assumed to be a Bingham fluid, it should possess a certain value of a yield point, at which it finally starts to flow from the stationary state. The water–cement ratio was taken as 1 so the cement slurry will flow before the application of any additional stress. This implies that the yield point for the sample cement slurry is equivalent to 0.
The value of the material parameters for ground particles was set by the reproducible analysis of an unconfined compression test with the input value for Bingham fluid [32,33]. Since Bingham fluid has the property of not flowing until the shear stress exceeds the yield stress, it can be assumed that the Bingham fluid will remain in an immobile state until the shear stress exceeds the yield stress value. However, the analysis for the strain ratio value of 0 becomes impossible so a bi-viscosity model [34] was adopted as a coping method, which treats the fluid as a highly viscous fluid in case the shear stress value is lower than the yield stress value. Equations (9) and (10) express the constitutive equation in the case of flowing and in the mobile state, respectively.
T i j = P δ i j + 2 ( η p + τ y Π ) ε ˙ i j ν p                         Π > Π c
T i j = P δ i j + 2 ( η p + τ y Π c ) ε ˙ i j ν                         Π < Π c
where η p is the plastic viscosity, P is the pressure, τ y is the yield value, ε ˙ i j ν p is the strain ratio when flowing, ε ˙ i j ν is the strain ratio when immobile, and Π c is the yield reference value for the fluid state and the immobile state. It should be noted that Π c is expressed by Equations (11) and (12), respectively, using the flow limit strain rate.
Π = 2 ε ˙ i j ε ˙ i j
Π c = ( 2 π c ) 2
where π c is the flow limit strain ratio.

4.4. Setting Probe Region and Boundaries

Figure 4 and Figure 5 show the probe boundaries set on the top of the ground model from the top and front views, respectively, to calculate the mud discharge quantity at the beginning and end of the simulation. Three different cylindrical discs, with diameters 1.8 m, 1.6 m, and 1 m, a height of 0.1 m, and a width of 0.1 m, each were set just above the top of the model ground and the numbers of cement particles, water particles, and soil particles accumulated at the end of the simulation were computed. The probe regions with diameters of 1.8 m, 1.6 m, and 1.4 m are indicated in red, green, and black, respectively.

5. Results and Discussion

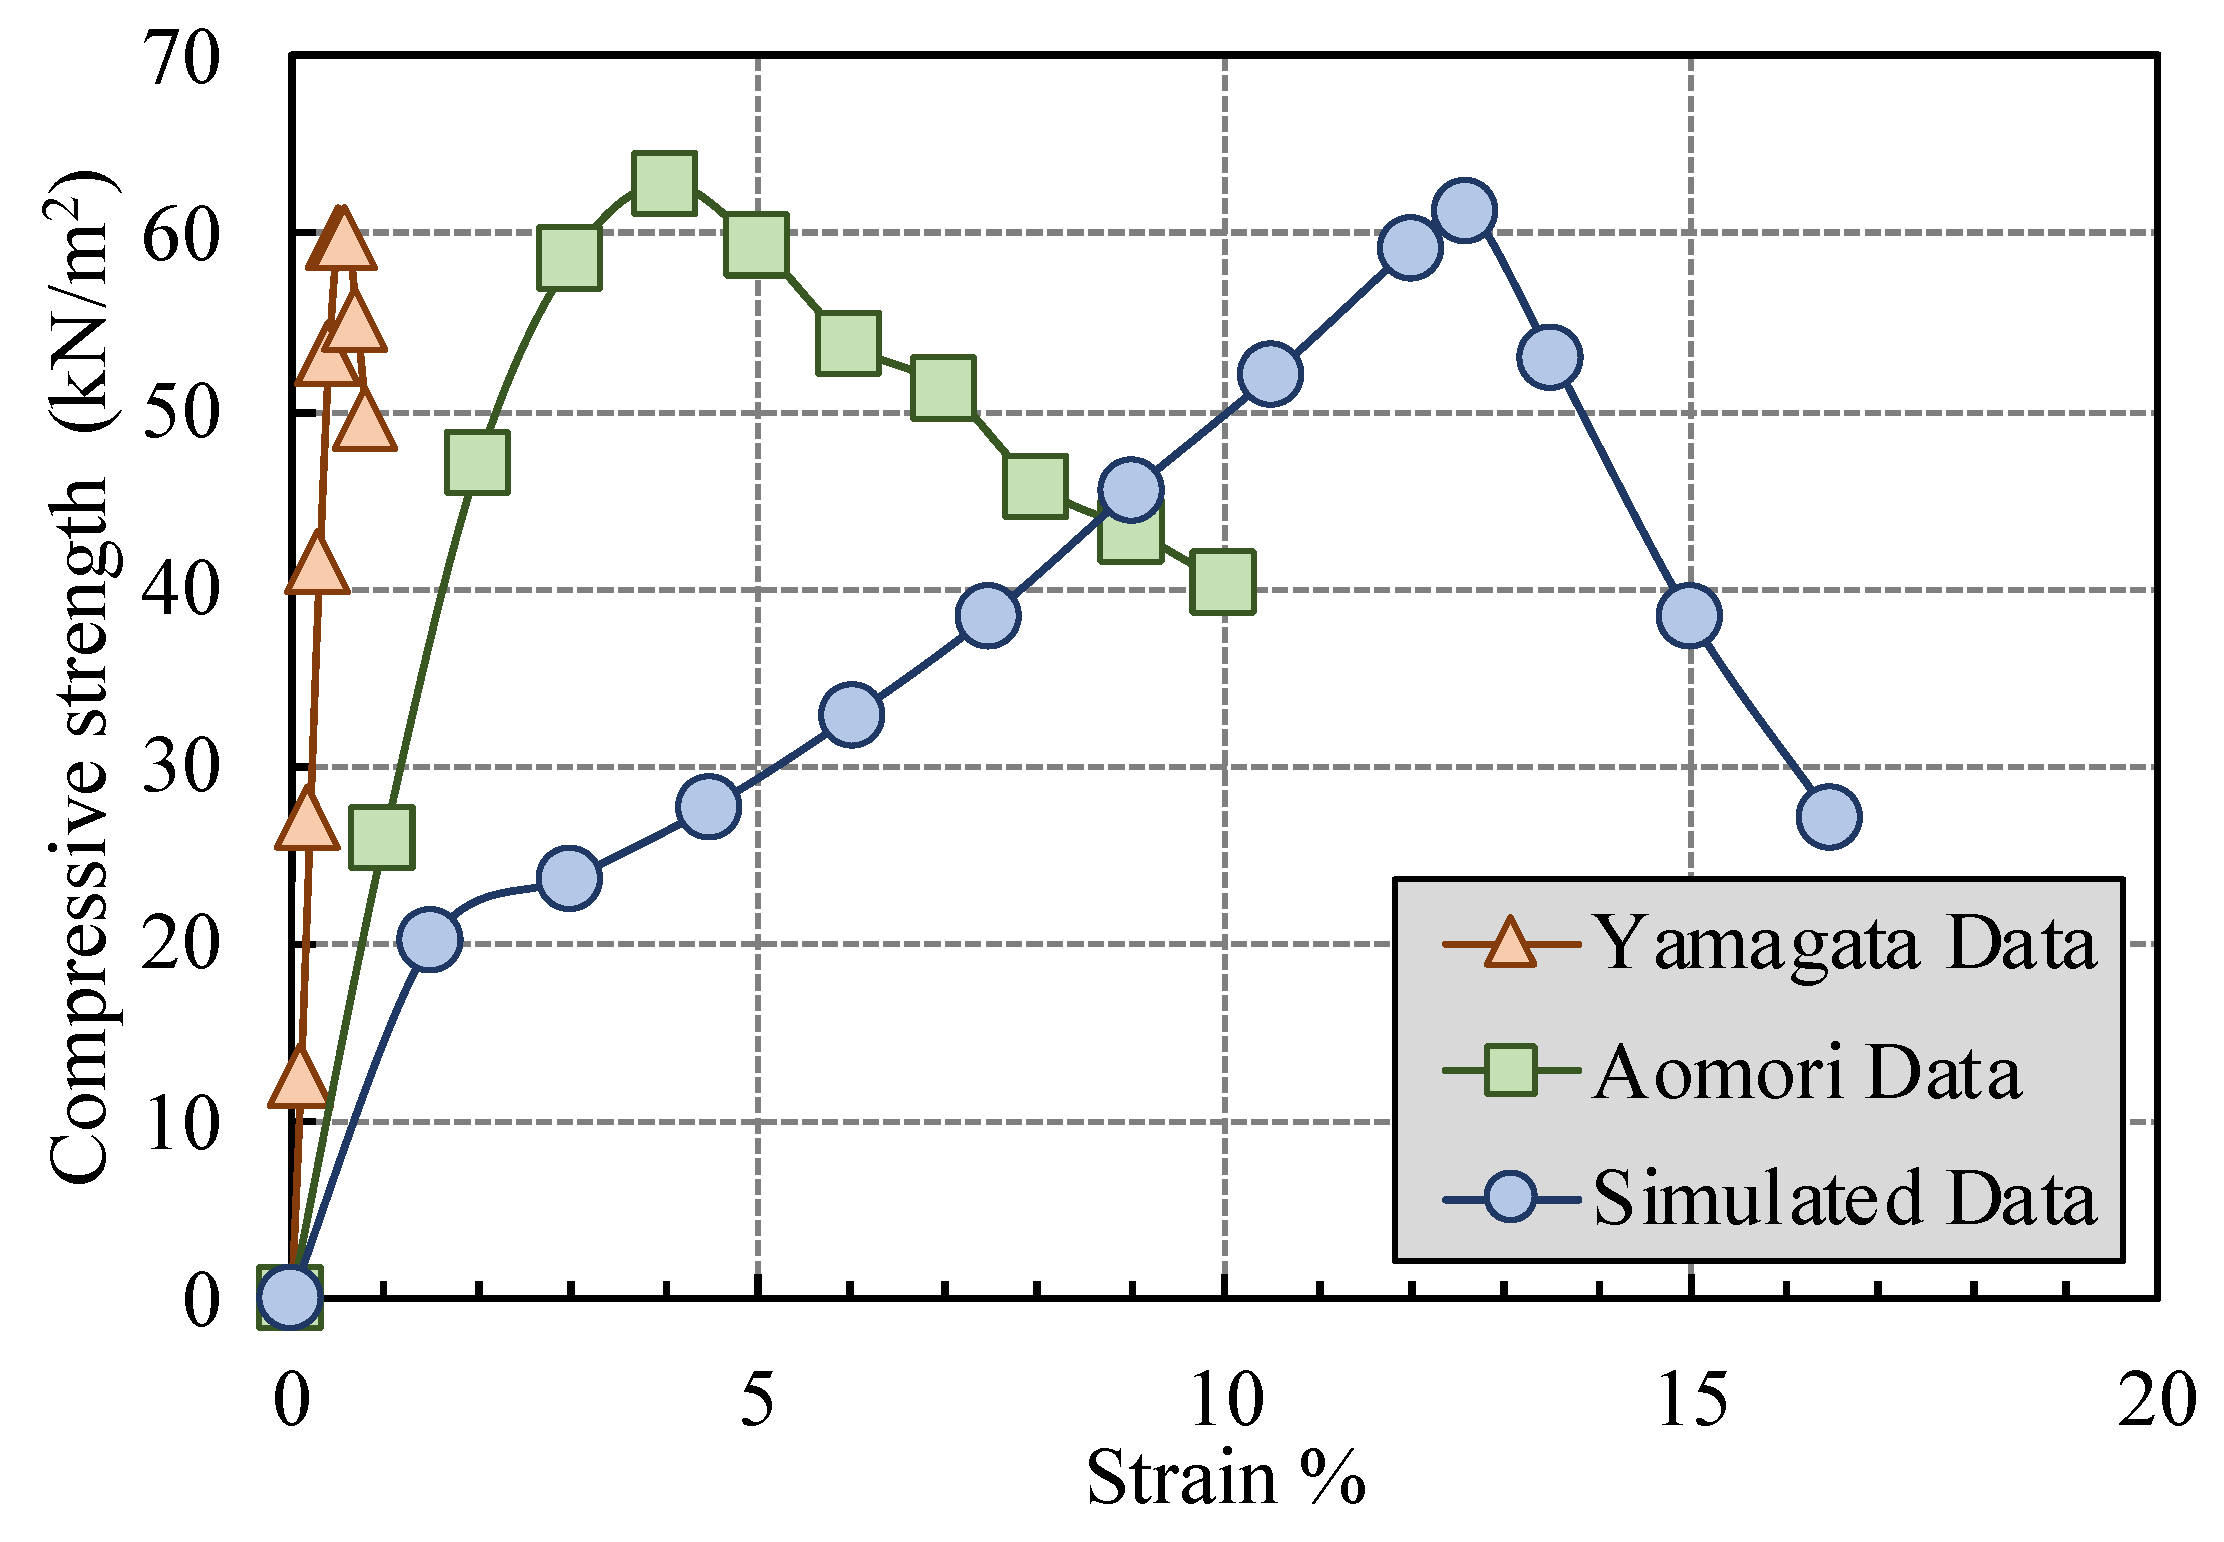
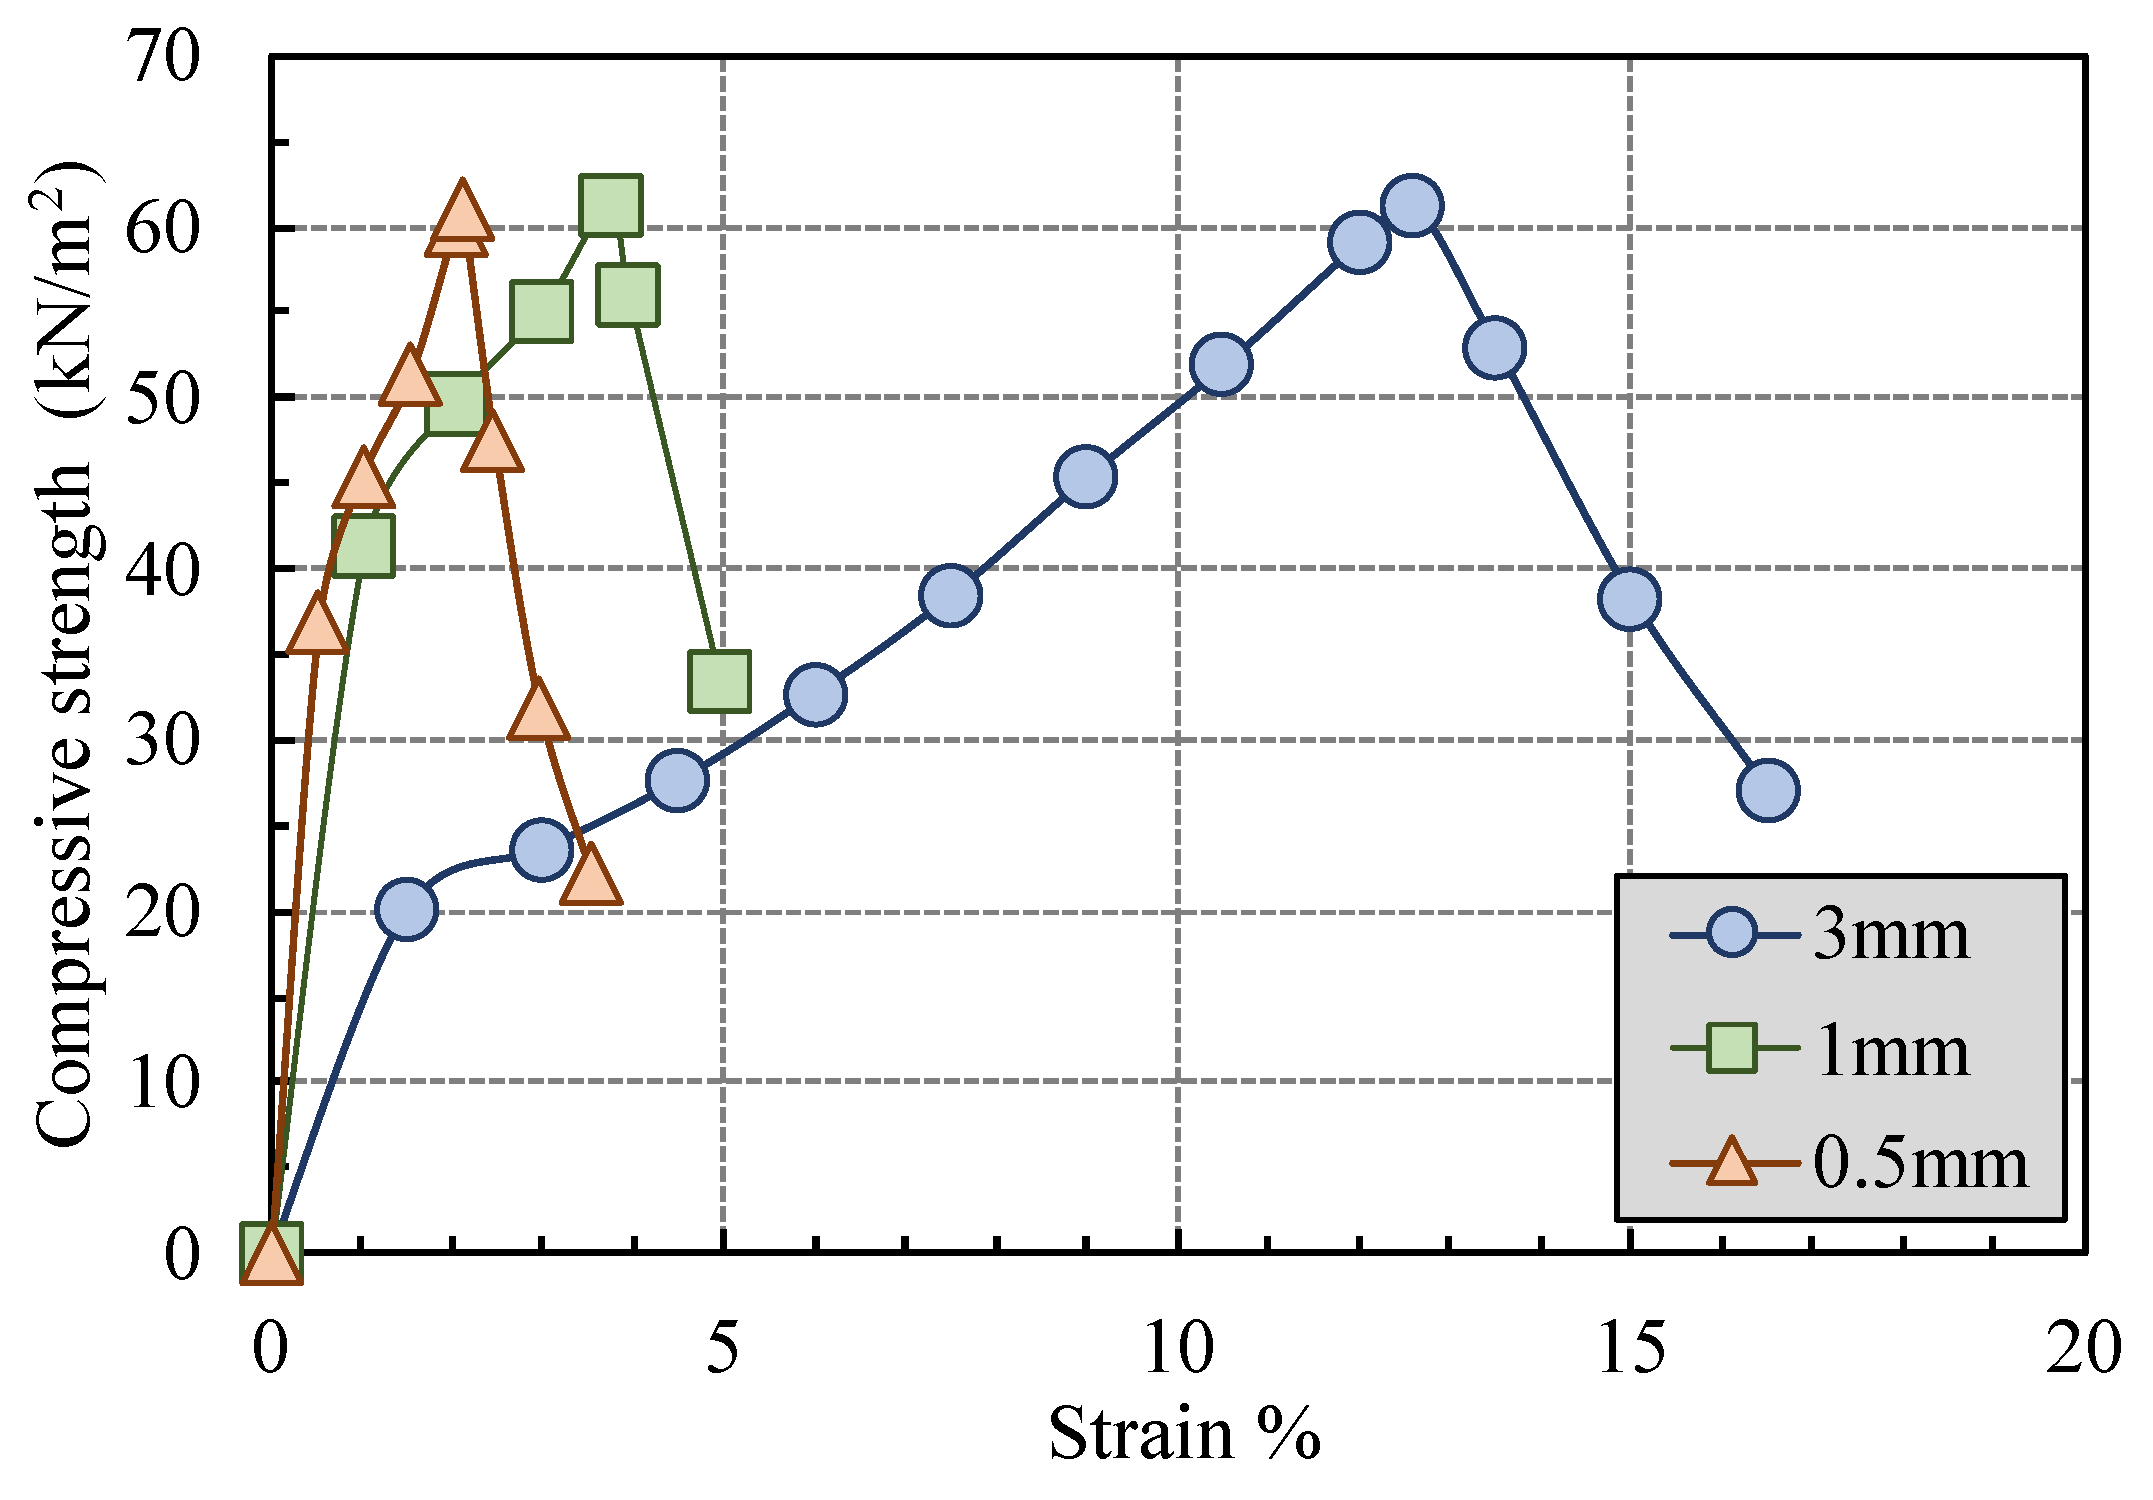
5.1. Validation of Analytical Ground Model

Figure 6 shows the results of the stress–strain curve obtained by the simulation of the unconfined compression tests for the material parameters given in Table 2, compared with the two sets of real unconfined compression test data. The simulated result shows the soil yields at a compressive strength of 61.24 kN/m2 when 12.5% strain is experienced. The output compressive strength result in comparison with known data is approximately equal. The green/square plots are the results of the unconfined compression tests for the soil sample from Tsugaru City in Aomori Prefecture. The sample was extracted from a depth of 7 to 7.85 m below the ground and is silty soil with an average soil diameter of 0.0036 mm. The soil sample yielded at 64.69 kN/m2 when it experienced a total strain of 4.73%. The triangular/orange plots are the results of the unconfined compression tests for the soil sample from Mikawa Town in Yamagata Prefecture. The core sample was taken from a depth of 4 to 4.7 m below the ground. The soil sample is sandy soil with an average soil diameter of 0.034 mm. The result shows that the soil sample yielded a value of 61.55 kN/m2 when it experienced a total strain of 0.55%. The main reason for higher strain in the simulated sample might be an assumption of the unrealistic sample of 3 mm soil particles possessing compressive strength of 60 kN/m2.
A detailed parametric study was conducted to recreate the most accurate ground model. It was found that the simulation result for different densities, but all other parameters kept the same, produced the same yield value and strain ratio, though the soil particle size and plastic viscosity considered during the simulation had an influence on the output result. Figure 7 shows the stress–strain relation comparison for three different sizes of soil. For the 0.5 mm soil sample, a yield value of 61.07 kN/m2 and 2.11% strain value were obtained at 5500 Pa·s input plasticity viscosity. For the 1 mm soil sample, a yield value of 61.03 kN/m2 and a strain value of 3.8% were obtained at 9000 Pa·s input plasticity viscosity. For a 2 mm soil sample, when compared to a 3 mm soil sample, the parametric change was negligible but the calculation time increased by 1.5-times. Meanwhile, for the 1 mm and 0.5 mm samples, the calculation times increased by 2- and 42-times, respectively. Although the lower soil particle-sized model was more accurate, the simulation might have failed due to the high calculation load, so this study was conducted with the 3 mm soil sample.

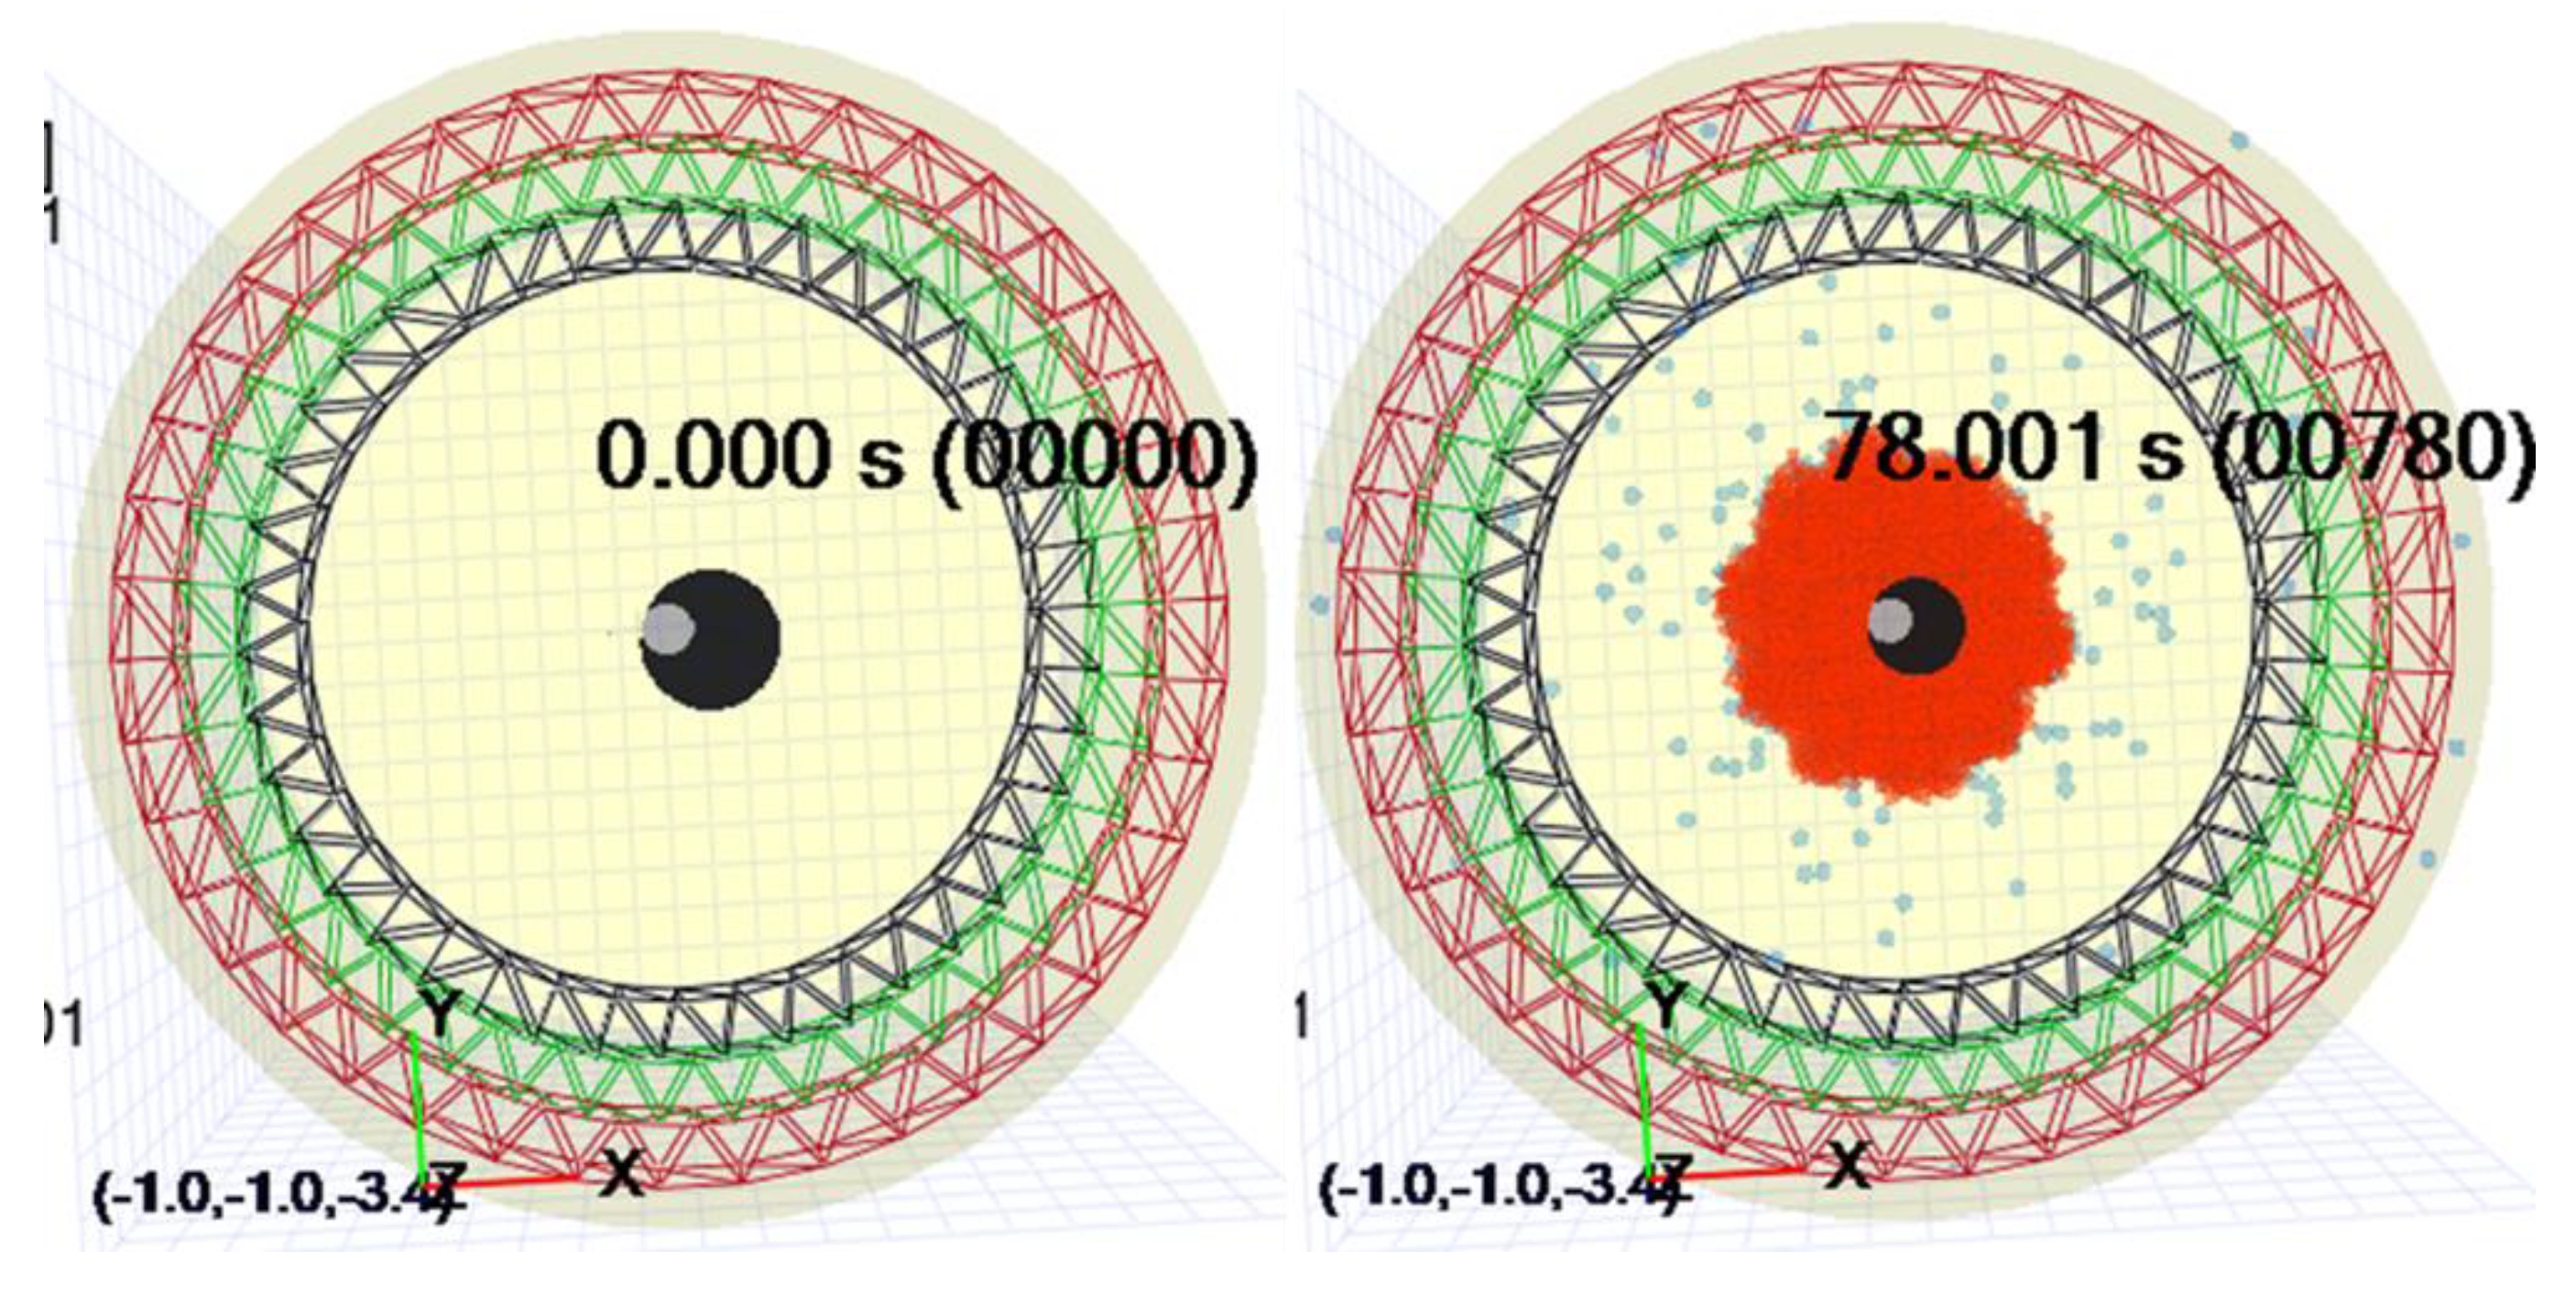
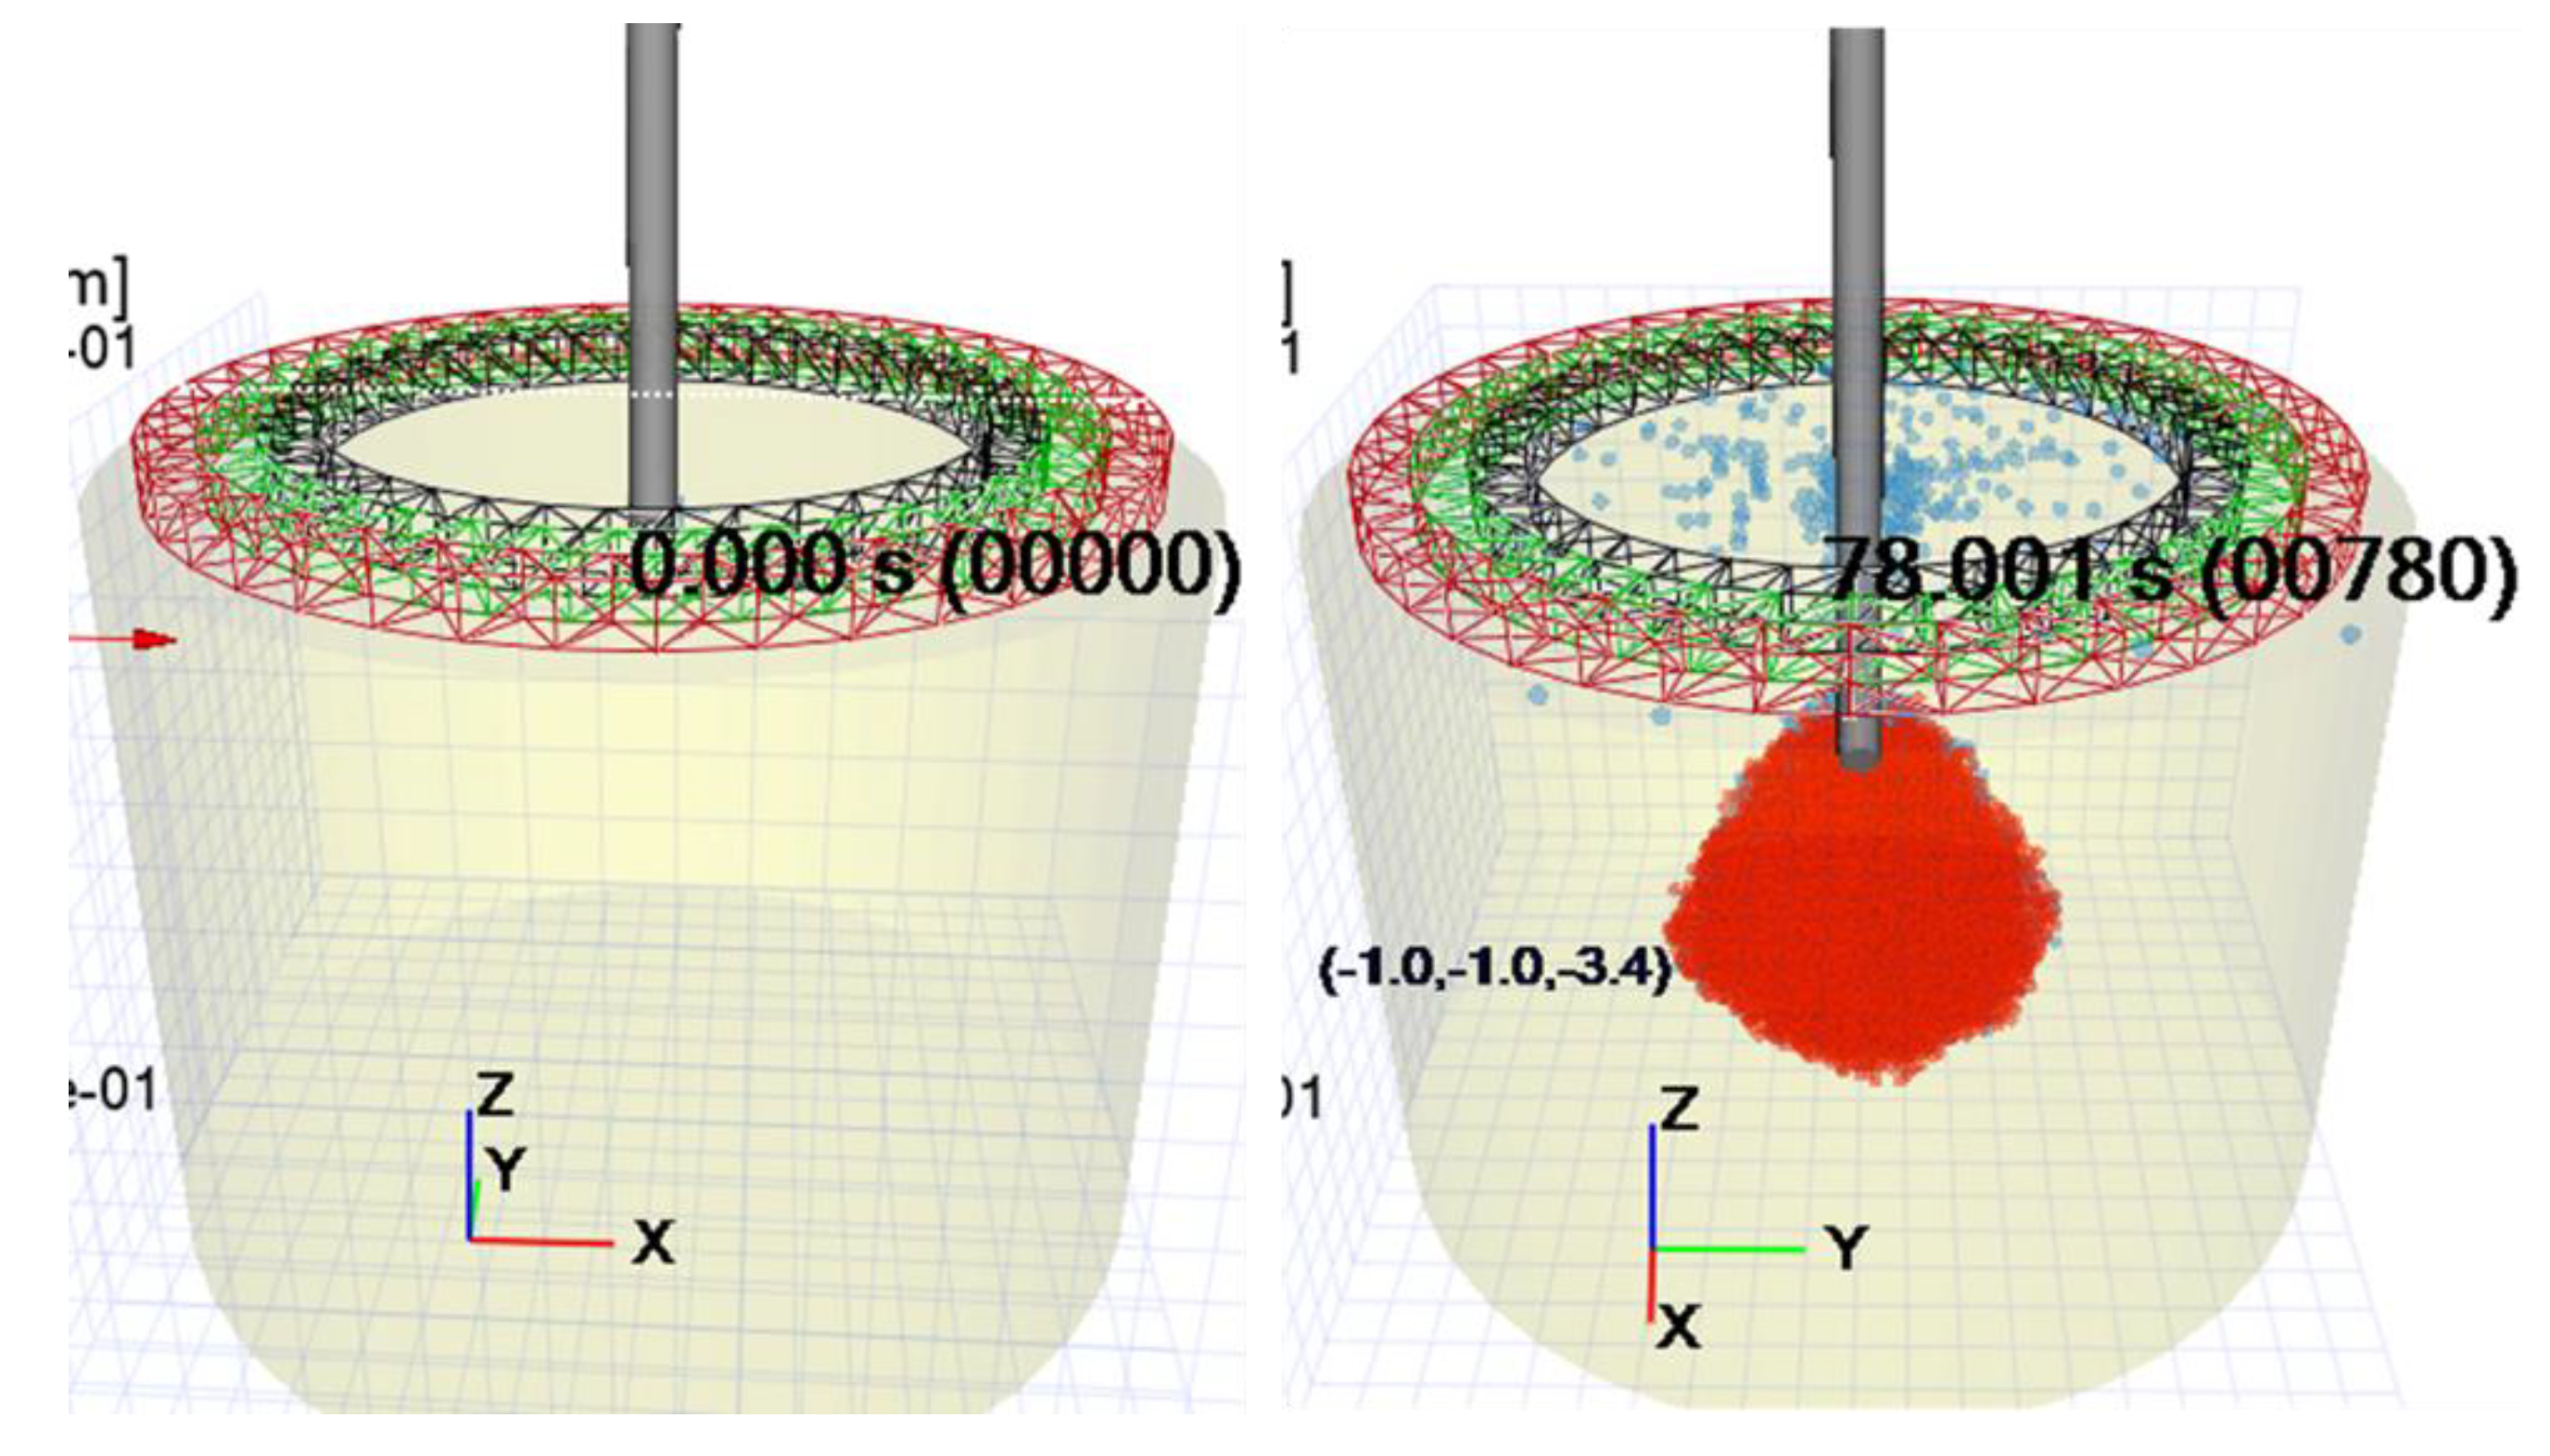
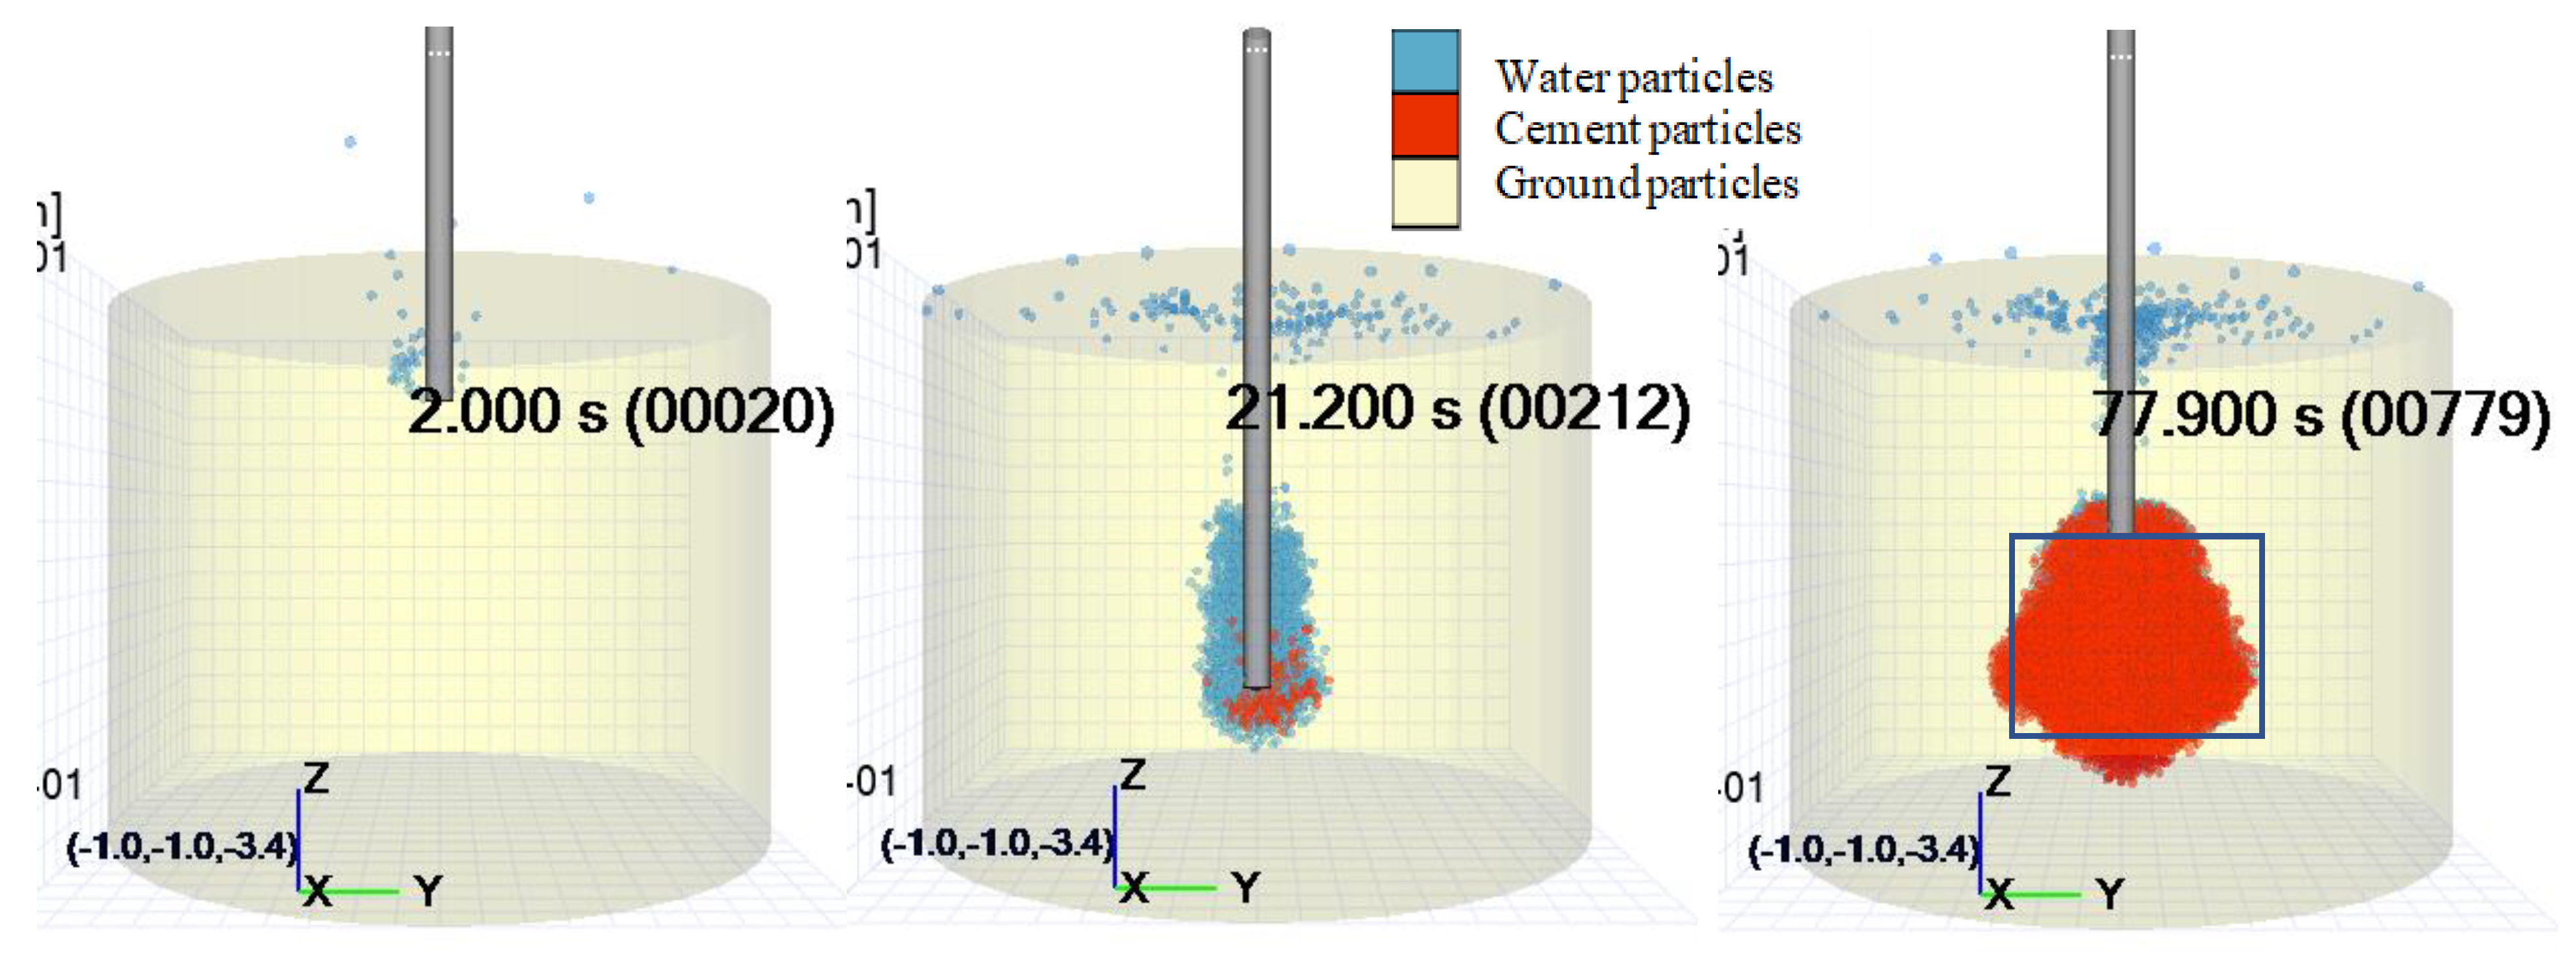
5.2. Reproduction of Development Situation of Columnar Soil-Improved Body

Figure 8 shows the development progress of a columnar soil-improved body. The ground particles are shown in transparent yellow, the water particles in light blue, and the slurry particles in red. Water starts spraying at about 2 s and continues until it reaches the maximum depth of 1 m within 20 s.
Blue particles can be confirmed to be moving to the surface and scattered into open space as mud discharge. Cement-grout-spraying starts when the jet-grouting string reaches the desired maximum depth of 1 m and is pulled upward, rotating in a counter-clockwise direction. It can be confirmed that water particles scoured below the 1 m depth, although soil-improvement body formation at this depth is not intended. At 78 s, when the rod reaches the desired height of 0.5 m below the surface, the construction simulation is completed. Cement grout was sprayed for 0.5 m height only, but it can be confirmed to have spread beyond with uneven distribution.
The main objective of creating a realistic jet-grouting construction simulation was successful, as this study was able to recreate the realistic phenomenon of mud discharge and the formation of the soil-improved body. Generally, mud discharge observation and soil-improvement diameter measurement are conducted as a verification method for a jet-grouting method in real situations. As for the content of mud discharge, it should be a mixture of water, soil particles, and a certain amount of cement grout. In this simulation, water particles and a few cement particles were ejected as mud discharge. The soil particle ejection might have not been visually confirmed because of its visuality setting in the simulation. As for the soil-improvement body diameter, the target design shape is shown by the blue rectangular frame in Figure 8. A maximum diameter of 0.9 m and minimum diameter of 0.6 m were observed within the target zone, whereas a total height of 0.86 m soil-improved body was formed with 0.1 m height and 0.5 m average diameter above the target zone and 0.26 m height and 0.5 m average diameter below the target zone. It is expected that more accurately controlled soil-improved body shape and size can be formed by amending the construction specifications.
The probable reasons for forming the soil-improved body below the target area might be the permeation of the cement slurry particles and heavy accumulation of the cement slurry at the lower portion. Since water particles had already scoured the ground below the lowest point of drilling, they simply percolated to the soil below when the cement slurry was sprayed. Next is the accumulation of sprayed cement slurry particles, which percolated in a downward direction due to the influence of gravity rather than moving in the radial direction. Meanwhile, the probable reasons for forming the soil-improved body above the target might be the vertical movement of the mud discharge and the presence of a higher amount of cement particles at the center. The mud discharge phenomenon likely stimulated loose particles to move in upward directions but cement particles being comparatively heavier, settled along the midway, resulting in soil-improvement body formation beyond the target zone. Further, since there was a heavy accumulation of cement particles at the center because of the longer spraying time, the number of cement particles carried in the upward direction might have increased proportionately, resulting in the formation of a soil-improved body above the target area. However, it is expected that soil-improved body formation range can be effectively controlled by changing the specifications for the cement slurry spraying, such as changing the total time of the spraying, the velocity of the rod pulling in an upward direction, etc.

5.3. Computation of Mud Discharge Quantity

Table 3 shows the numbers of soil particles, water particles, and cement slurry particles collected at different time periods during the simulation. The measurement was conducted for all three probe regions and the obtained data were compared with each other.
Figure 9 shows the patterns of the total mud discharge particles accumulating at each time frame in different probe regions. Particles keep accumulating throughout the process and attain the maximum value at the end of the process. However, the same cannot be said for the cement particles or the water particles. The number of cement particles ejected as mud discharge is found to be 0 at all times, while the number of water particles keeps changing slightly at the given times. Next, the highest number of particles is not maintained at all times by either probe region. There are cases when each probe region contains the highest number of particles at a certain time frame. For the probe region of 1.8 m diameter, the particle number is highest at 50 s and 60 s, at 40 s and 78 s for the probe region of 1.6 m diameter, and at 20 s and 30 s for the probe region of 1.4 m diameter.
From the visual confirmation, it can be confirmed that only a very small amount of the cement particles moved toward the surface and what seems like a large number of water particles moved toward the surface. However, the computation data conflict with the visual information as it clearly states that more ground particles were ejected and only a very small amount of water particles was ejected. In a real case scenario, fluid mixtures of water, soil, and some cement grout are ejected as mud discharge. The mixing of these substances causes the solution to change in color and state of matter. The previously solid/semi-solid/powder soil particles are mixed with fluids (water and cement grout) and change into a paste or a thick fluid depending upon various case scenarios. In this simulation, no such distinct situations were observed but, what initially seemed like water particles only were ground particles mixed with water particles and were ejected mostly. Regarding the validity of the ground particles being higher in the ejected particles, it can be considered as true because there is no doubt that the cement grout was filled into the space previously occupied by the soil. The only logical explanation is that the replaced soil was ejected as mud discharge. The fluctuation in water particles at any time hints that the reading shows the amount of mud discharge particles accumulated at that time frame rather than the cumulative mud discharge particles.
In jet-grouting construction, based on the empirical rule, the quantity of the mud discharge is equivalent to 1.2-times the amount of fluid injected during the construction. This includes both the water particles during drilling and the cement grout particles during the formation of the soil-improved body. The water was injected at 80 L/min for 20 s and the cement grout at 90 L/min for 58 s; thus, the total injected amount was about 0.113 m3. However, the maximum number of particles collected in a probe region at the 78 s time frame accounts for 0.000024 m3 only but the theoretical volume displaced by soil improvement body formation is approximately 0.38 m3, implying very small readings of particle accumulation. For 35% of cement grout content in the soil-improvement body, the volume displaced is almost equal to 1.2-times the injected volume, which seems more convincing. The reading might have been low because the data suggest the number of particles present at any given instant, rather than the total accumulated quantity and a lot of them scattered outside the probe region by the end time. Plus, the calculation of water particles that were mixed with the ground particles was not included.

6. Conclusions

This simulation was successful in recreating the realistic jet-grouting construction phenomenon and can be used as a guideline for future research. The major conclusions that can be drawn from this research are listed below.
Ground modeling by reverse unconfined compression test was successful and the correct parameters for the ground, which are difficult to measure, were successfully determined.
Mud discharge phenomenon was recreated and the diameter of the soil-improvement body formation was also measured, so the overall jet-grouting construction simulation was successful.
All of the probe region that was set in this study to calculate the mud discharge volume was found to be of insufficient area as the mud discharge particles accumulated in either probe region was very low.
Although this simulation was successful, there still remain a few uncertainties that need to be answered. Firstly, this study was carried out by making assumptions and a parameter setting, such that the calculation load becomes low, such as soil particle size as 3 mm, total construction time period of 78 s when it just finishes the cement slurry spray, etc. Since this study already established more accurate parameters for the ground, the next study should be a simulation using those parameters. However, this will result in a very high calculation load for the simulation and the chance of failing to simulate itself cannot be denied. However, it might be avoided by opting to reduce the simulation duration and/or precision, changing construction specifications, etc. Next is the calculation of mud discharge to verify the successful formation of the soil-improvement body. The probe region set in this study was found to be insufficient, so the next study should be the simulation of increased probe region boundary and compute the total amount of mud discharge particles accumulated or it should be the determination of the total number of cement particles in the soil-improvement body formation and compute the total volume of soil displaced by it.

Author Contributions

Conceptualization, S.I. and S.N.; methodology, S.I.; validation, S.I.; formal analysis, S.S.; investigation, S.S.; resources, S.S. and S.I.; data curation, S.S. and S.N.; writing—original draft preparation, S.S.; writing—review and editing, S.N. and S.I.; visualization, S.N. and S.I.; supervision, S.N. and S.I.; project administration, S.I. All authors have read and agreed to the published version of the manuscript.

Funding

This research received no external funding.

Institutional Review Board Statement

Not applicable.

Informed Consent Statement

Not applicable.

Data Availability Statement

Not applicable.

Conflicts of Interest

The authors declare no conflict of interest.

References

  1. Burke, G.K. Jet grouting systems: Advantages and disadvantages. In Proceedings of the GeoSupport 2004: Innovation and Cooperation in the Geo-Industry, Orlando, FL, USA, 29–31 January 2003; pp. 875–886. [Google Scholar]
  2. Harada, K.; Ohbayashi, J.; Matsumoto, J.; Kubo, Y.; Akima, T. New ground improvement technologies under restricted conditions in Japan. In Proceedings of the 15th Asian Regional Conference on Soil Mechanics and Geotechnical Engineering, Kyushu, Japan, 9–13 November 2015; Volume 2, pp. 1165–1170. [Google Scholar] [CrossRef]
  3. Pinto, A.; Tomásio, R.; Marques, G. Ground improvement with jet grouting solutions at the new cruise terminal in Lisbon, Portugal. Procedia Eng. 2016, 143, 1495–1502. [Google Scholar] [CrossRef]
  4. You, W.; Lin, L.; Jingpei, L.; De’an, S. Jet-grouting in ground improvement and rotary grouting pile installation: Theoretical analysis. Geomech. Eng. 2020, 21, 279–288. [Google Scholar] [CrossRef]
  5. Wang, Z.F.; Bian, X.; Wang, Y.Q. Numerical approach to predict ground displacement caused by installing a horizontal jet grout column. Mar. Georesources Geotechnol. 2017, 35, 970–977. [Google Scholar] [CrossRef]
  6. Ma, X.; Zhang, X.; Li, X.; Wang, X.; Zhao, X. Impacts of free-floating bikesharing system on public transit ridership. Transp. Res. Part D Transp. Environ. 2019, 76, 100–110. [Google Scholar] [CrossRef]
  7. Chen, X.; Wu, S.; Shi, C.; Huang, Y.; Yang, Y.; Ke, R.; Zhao, J. Sensing data supported traffic flow prediction via denoising schemes and ANN: A comparison. IEEE Sens. J. 2020, 20, 14317–14328. [Google Scholar] [CrossRef]
  8. Modoni, G.; Croce, P.; Mongiovì, L. Theoretical modelling of jet grouting. Géotechnique 2016, 56, 335–347. [Google Scholar] [CrossRef]
  9. Modoni, G.; Lidia, W.; Joanna, B.; Gaspare, G.; Angelo, L. Numerical analysis of submerged flows for jet grouting. Ground Improv. 2016, 169, 42–53. [Google Scholar] [CrossRef]
  10. Nakanishi, W.; Nakazawa, J. The process of development on jet grouting methods and their future. Soil Mech. Found. Eng. 2006, 54, 10–12. [Google Scholar]
  11. Njock, A.; Guy, P.; Shen, S.L.; Modoni, G.; Arulrajah, A. Recent advances in horizontal jet grouting (HJG): An overview. Arab. J. Sci. Eng. 2018, 43, 1543–1560. [Google Scholar] [CrossRef]
  12. Njock, P.G.A.; Chen, J.; Modoni, G.; Arulrajah, A.; Kim, Y.H. A review of jet grouting practice and development. Arab. J. Geosci. 2018, 11, 459. [Google Scholar] [CrossRef]
  13. Pinto, A.; Falcão, J.; Pinto, F.; Ribeiro, J. Ground improvement solutions using jet grouting columns. In Proceedings of the 16th International Conference on Soil Mechanics and Geotechnical Engineering, Osaka, Japan, 12–16 September 2005; pp. 1249–1252. [Google Scholar] [CrossRef]
  14. Shen, S.L.; Njock, P.G.A.; Zhou, A.; Lyu, H.M. Dynamic prediction of jet grouted column diameter in soft soil using Bi-LSTM deep learning. Acta Geotech. 2021, 16, 303–315. [Google Scholar] [CrossRef]
  15. Shen, S.L.; Wang, Z.F.; Yang, J.; Ho, C.E. Generalized approach for prediction of jet grout column diameter. J. Geotech. Geoenvironmental Eng. 2013, 139, 2060–2069. [Google Scholar] [CrossRef]
  16. Zhang, W.; Hong, L.; Li, Y.; Zhang, R.; Goh, A.T.C.; Liu, H. Effects of jet grouting slabs on responses for deep braced excavations. Undergr. Space 2021, 6, 185–194. [Google Scholar] [CrossRef]
  17. Zhang, W.; Li, Y.; Goh, A.T.C.; Zhang, R. Numerical study of the performance of jet grout piles for braced excavations in soft clay. Comput. Geotech. 2020, 124, 103631. [Google Scholar] [CrossRef]
  18. Komaki, T.; Fukada, S.; Shimano, A.; Nakanishi, Y. Efficient of mechanical mixing method with middle pressure injection by high performance fluidizing agent. In Proceedings of the 13th National Symposium on Ground Improvement, Kyoto, Japan, 24–26 October 2018; pp. 375–378. [Google Scholar]
  19. Komaki, T.; Fukada, S.; Sumi, K.; Nakanishi, Y.; Tanaka, N. Demonstration experiment of evolution technology by combination mixing slurry of middle pressure injection total system. In Proceedings of the 53th Japan National Conference on Geotechnical Engineering, Takamatsu, Japan, 24–26 July 2018; pp. 835–836. [Google Scholar]
  20. Inazumi, S.; Shakya, S.; Komaki, T.; Nakanishi, Y. Numerical analysis on performance of middle-pressure jet grouting method for ground improvement. Geosciences 2021, 11, 313. [Google Scholar] [CrossRef]
  21. Hattori, M. An attempt to apply mathematical foundation of Moving Particle Simulation to the MPS software “Particleworks”. Proc. Symp. Educ. Appl. Inf. Technol. 2015, 9, 59–62. [Google Scholar]
  22. Shakibaeini, A.; Jin, Y.C. MPS mesh-free particle method for multiphase flows. Comput. Methods Appl. Mech. Eng. 2012, 229–232, 13–26. [Google Scholar] [CrossRef]
  23. Tanaka, M.; Cardoso, R.; Bahai, H. Multi-resolution MPS method. J. Comput. Phys. 2018, 359, 106–136. [Google Scholar] [CrossRef]
  24. Chang, K.H. Product Design Modeling using CAD/CAE: The Computer Aided Engineering Design Series; Elsevier: Amsterdam, The Netherlands, 2014. [Google Scholar]
  25. Hamri, O.; Léon, J.C.; Giannini, F.; Falcidieno, B. Software environment for CAD/CAE integration. Adv. Eng. Softw. 2010, 41, 1211–1222. [Google Scholar] [CrossRef]
  26. Inazumi, S.; Kuwahara, S.; Jotisankasa, A.; Chaiprakaikeow, S. MPS-CAE simulation on dynamic interaction between steel casing and existing pile when pulling out existing piles, International Journal of GEOMATE: Geotechnique. Constr. Mater. Environ. 2020, 18, 68–73. [Google Scholar] [CrossRef]
  27. Pan, Z.; Wang, X.; Teng, R.; Cao, X. Computer-aided design-while-engineering technology in topdown modeling of mechanical product. Comput. Ind. 2016, 75, 151–161. [Google Scholar] [CrossRef]
  28. Yang, P.; Zang, M.; Zeng, H. DEM-FEM simulation of tire-sand interaction based on improved contact model. Comput. Part. Mech. 2020, 7, 629–643. [Google Scholar] [CrossRef]
  29. Inazumi, S.; Komaki, T.; Nakanishi, Y.; Hashida, H.; Suzuki, M. Qualities evaluation on high pressure Jet mixing ground improvement methods by distinct element method (DEM). In Proceedings of the 13th National Symposium on Ground Improvement, Kyoto, Japan, 24–26 October 2018; pp. 211–216. [Google Scholar]
  30. Shimano, A.; Yamazaki, J.; Shinsaka, T. The study about work progress control of jet grouting method. In Proceedings of the 12th National Symposium on Ground Improvement; JSMS: Tokyo, Japan, 2016; pp. 455–458. [Google Scholar]
  31. Shinsaka, T.; Yamazaki, J.; Nakanishi, Y.; Komiya, K. Quality control and shape control techniques in jet grouting. In Proceedings of the IFCEE 2018: Innovations in Ground Improvement for Soils, Pavements, and Subgrades, Orlando, FL, USA, 5–10 March 2018. [Google Scholar] [CrossRef]
  32. Güllü, H. A new prediction method to rheological behavior of grout with bottom ash for jet grouting columns. Soils Found. 2017, 57, 384–396. [Google Scholar] [CrossRef]
  33. Güllü, H.; Cevik, A.; Ezzi, A.K.M.A.; Gülsan, M.E. On the rheology of using geopolymer for grouting: A comparative study with cement-based grout included fly ash and cold bonded fly ash. Constr. Build. Mater. 2019, 196, 594–610. [Google Scholar] [CrossRef]
  34. Kamalova, Z.; Hatanaka, S. Moving particle simulation for a simplified permeability model of pervious concrete. Comput. Concr. 2019, 24, 571–578. [Google Scholar]
Figure 1. Mechanical agitation and mixing jet-grouting construction.
Applsci 12 09675 g001
Figure 2. Calculation algorithm flowchart for MPS.
Applsci 12 09675 g002
Figure 3. Conceptual jet-grouting method model.
Applsci 12 09675 g003
Figure 4. Top views of probe region at beginning and end.
Applsci 12 09675 g004
Figure 5. Front views of probe region at beginning and end.
Applsci 12 09675 g005
Figure 6. CAE-MPS simulation results compared to known data.
Applsci 12 09675 g006
Figure 7. Comparison of simulation results for different soil sizes.
Applsci 12 09675 g007
Figure 8. Reproduction of development condition of the soil-improved body.
Applsci 12 09675 g008
Figure 9. Total mud discharge particles for each probe region.
Applsci 12 09675 g009
Table 1. Analysis conditions.
Target MaterialGround
Ground Model Dimension2 m ø1.5 m Height
Jet materialsWater *1Cement slurry *2
Spraying time20 s58 s
Penetration length while blanking (m)0.50 *2
Penetration length while improving soil (m)0.50.5
Jet amount (L/min)8090
Jet pressure (MPa)9.418.0
Jet velocity (m/s)137.5155.0
Penetration velocity while blanking (m/min)3.0-
Penetration velocity while improving soil (m/min)3.0-
Lifting velocity while improving soil (m/min)-0.52 *2
Rotation speed (rpm)20 *120
*1 during penetration; *2 during pulling up.
Table 2. Material parameters.
MaterialDensity
(kg/m3)
w/cYield Value
(Pa)
Plastic Viscosity
(Pa·s)
Yield Parameter
(-)
Surface Tension (N/m)Fluid Model
Water1000----0.10Newtonian fluid
Cement slurry15001.0100.280.00010.10Bingham fluid
Ground1600-60000170000.00010.002Bingham fluid
Table 3. Numbers of individual mud discharge particles.
Time after the Start of Construction (s)203040506078
Number of particles for probe diameter of 1.8 mCement grout000000
Ground64168462591596859
Water540455
Number of particles number for probe diameter of 1.6 mCement grout000000
Ground209320532533538892
Water443444
Number of particles for probe diameter of 1.4 mCement grout000000
Ground364440466466498878
Water876888
Publisher’s Note: MDPI stays neutral with regard to jurisdictional claims in published maps and institutional affiliations.

