Abstract
Stainless steel cladded rebars were successfully prepared by clean-interface assembly and vacuum hot-rolling process. The interfacial microstructure and properties of the clad rebars were investigated by scanning electron microscope (SVM), transmission electron microscope (TEM), and electron probe X-ray microanalyser (EPMA). The results demonstrated that owing to the diffusion of carbon, decarburised (roughly 50 μm) and composite zones (roughly 60 μm) formed on each side of the composite interface. The decarburized zone features a single ferrite texture, hence, a relatively low micro-hardness of 138HV while, due to the large amount of martensite formed within it, the composite zone has a relatively high micro-hardness of 218HV. The salt spray test showed that the corrosion rate of the clad rebars is close to that of the round stainless bars, and is approximately one-tenth that of the carbon rebars. In addition, a layered multipass welding process was used to produce a cladding joint, which was determined to have a tensile strength greater than the standard value of the parent material and excellent corrosion resistance.
1. Introduction
Most reinforced concrete undergoes severe corrosion damage after only 20 years of use [1,2]. In 2014, China had a whopping 93,500 bridges in need of maintenance, accounting for about 14.6% of the total number of bridges [3]. In 2016, road maintenance costs in the EU amounted to US $27 billion [4]. The cost of maintaining bridges in the United States exceeded $120 billion in 2019 [5,6].
Researchers at home and abroad have made tremendous efforts to improve the corrosion resistance of concrete structures [7,8,9,10,11,12]. Stainless steel clad rebar is receiving increasing attention owing to its excellent corrosion resistance and low cost. The US company STELAX produced a clad rebar with an outer layer of 316L by compressing iron filings and hot-rolling process. The carbon steel core bar was fused from iron filings with the intent to reuse them and, when the South Dakota Department of Transportation tested the performance of their product, large holes were discovered between the cladding and base layers [13,14].
Sawicki prepared the cladded steel rebar with X2CrNi18-10 as the cladding and C45E as the base layer using the explosive compounding method. In this process, the cladded blank is initially combined through the shock formed by the explosion and the high temperature. Then, the cladded steel bar is rolled by hot rolling. However, this process is environmentally polluting, and the composite interface contains impurities [15,16]. Nakasuji K et al. prepared the stainless steel cladded bar with the drawing hot-rolling process. To begin with, the rod is sleeved into the stainless steel tube, and then a mechanical bond is formed initially between the carbon steel rod and the stainless steel tube after the blank is pressed with a drawing machine. Finally, it is rolled and formed using a rotary reducer. For such a process, a drawing process and supporting facilities should be added to the existing steel bar production line, which might lower the production efficiency [17]. Pak et al. produced clad rebars using laser-fusion cladding and a hot-rolling process, and investigated the influence of the welding process and welding materials on the chemical composition and mechanical properties of the rebars [18]. However, during the cladding process, serious oxidation occurred at the composite interface, which affected the quality of the bimetallic metallurgical bonding. Liu et al. proposed a clad rebar rolling process based on metal deposition [19]. However, this process presents problems, such as high cost, long billet-making time, and impracticality on a large scale. Feng et al. used an MMS-200 thermal simulator to study the influence of different degrees of deformation and deformation temperatures on the microstructure and mechanical properties of the composite interface of clad rebars, and proposed a series of processing parameters suitable for their production [20]. However, the rolling effect of the above parameters was unknown. Zhang et al. proposed a cladded steel rolling process based on iron scrap recycling; unlike the process adopted by the US STELAX company, the process first places iron filings mixed with metal adhesives into the stainless steel tube, and then assembles the composite blank through processes, such as cold pressing, heating, hot pressing, film stripping, and sealing, etc. At last, it is formed via hot-rolling. However, it is worth noting that the downside of the process is that composite steel’s mechanical properties are still to be determined, since the scholar failed to test the mechanical properties of composite steel [21]. Muralimohan et al. used nickel as an intermediate layer to composite carbon steel and stainless steel [22]. Their experimental results showed that a strong metallurgical bond between stainless and carbon steel was formed. However, this method is only at the laboratory stage.
With the aim of solving the problems of weak metallurgical bonding of the composite interface of the clad rebar, facile oxidation of the interface during the preparation of the billet group, and facile mixing of impurities between the bimetallic layers, this paper presents a process for the preparation of clad rebars based on clean-interface assembly and vacuum hot-rolling. The interfacial microstructure, element diffusion, and properties of the clad rebar were also investigated in this study. The process starts with surface-treated carbon steel sleeved into a stainless steel tube, which is then vacuumed, sealed by welding, and finally hot-rolled into the desire shape. In 2020, the research team achieved industrial mass production of clad rebars at Liuzhou Iron and Steel Works using the process described above (Table 1 shows the price of each corrosion resistant steel component). The production cost was only one-third of the stainless steel rebar. In July 2021, the clad rebars rolled using the above process were successfully used in the construction of the Longmen Cross-Sea Bridge in Guangxi, China.

Table 1.
Prices of different corrosion resistant steel bars.
2. Materials and Experimental Procedure
2.1. Selection of Inner and Outer Material
The base and cladding layers of the clad rebars were composed of 20MnSiV and 316L stainless steel, respectively. The selection basis for base materials is as follows: 20MnSiV is characterized by low carbon content and high strength, which finds a wide application in the production of carbon steels; the selection basis for cladding materials is as follows: 316L belongs to austenitic stainless steel, which possesses favourable plasticity, as well as superior corrosion resistance. Table 2 shows the chemical compositions of 20MnSiV and 316L stainless steel.

Table 2.
Chemical compositions of 20MnSiV and 316L stainless steel (mass %).
2.2. Introduction to Net-Interface Grouping and Rolling Process for Clad Rebars
2.2.1. Clean-Interface Assembly Forming Process
Figure 1 shows the clean-interface assembly forming process.

Figure 1.
Clean-interface assembly forming process flow.
To ensure a solid metallurgical bond between the carbon steel mandrel and stainless steel tube, the billets need to be cleaned before the mandrel is set into the tube. The cleaning procedure was carried out as follows. First, the outer surface of the carbon steel mandrel and the inner surface of the stainless steel tube were de-rusted and cleaned of flying burrs, and then the surfaces of the billets were cleaned with acetone. Figure 2 shows the surface profile of the carbon steel mandrel before and after the cleaning process. After purification, the size of the carbon steel mandrel was Φ142 mm × 9000 mm, and the size of the stainless steel tube was Φ159 mm × 8 mm × 9000 mm.
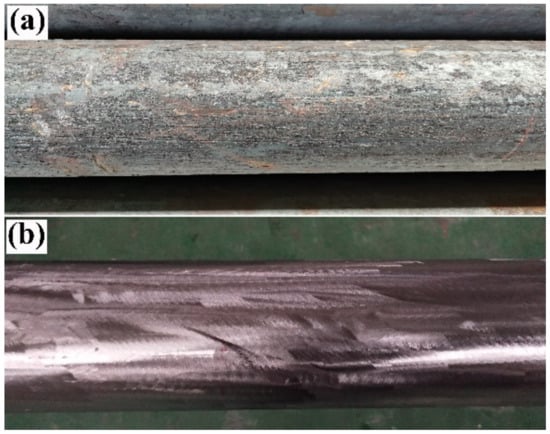
Figure 2.
Image of the surface of a carbon steel mandrel before and after cleaning: (a) before cleaning; (b) after cleaning.
After the billet was cleaned and treated, the carbon steel mandrel was snapped into the stainless steel tube using a top-entry device, and the billet was vacuumed and end-welded to finalise the assembly of the composite billet. Figure 3 shows a schematic of the composite billet.
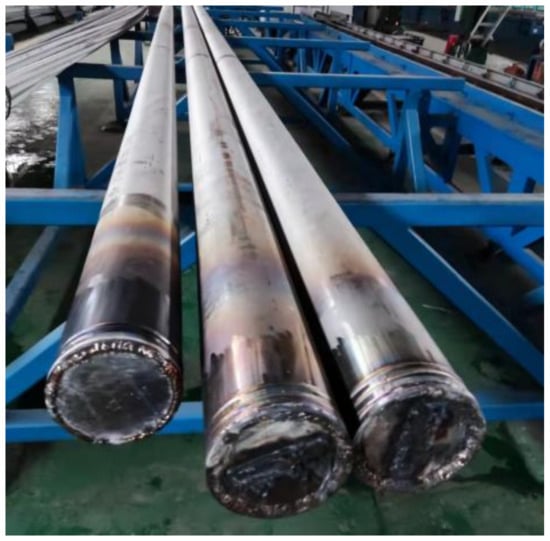
Figure 3.
Schematic of the composite billet.
2.2.2. Rolling Process of Clad Rebar
The clad rebar was rolled at a steel mill in Guangxi, China. The outer diameter of the billet was Φ159 mm, and the size of the finished rebar was Φ25 mm. The billet underwent a total of 14 rolling passes. Figure 4 shows the layout of the rolling line.

Figure 4.
Layout of Φ25 mm clad rebar rolling line.
The 14 mills are distributed horizontally and vertically, with 6 roughing mills, 4 medium mills, and 4 finishing mills. Figure 5 shows a physical view of the medium and finishing mills. After roughing, the “head” of the billet is cut off with the first flying shear, and after medium rolling, the “tail” of the billet is cut off with the second flying shear. Figure 6 shows a schematic of a composite billet with cut ends.
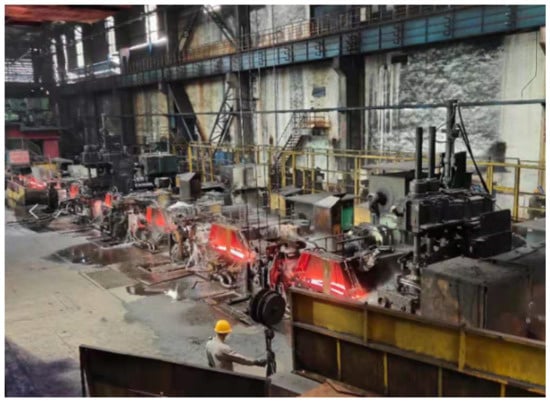
Figure 5.
Photo of medium finishing mill.
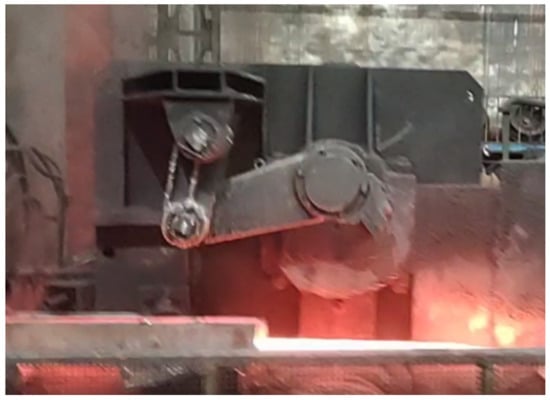
Figure 6.
Schematic of the cut end of a composite billet.
To ensure uniform heating of the composite billet in the vacuum state, the billet was heated at 1250 °C for 3 h. According to the temperature sensor, the initial rolling temperature of the composite billet was 1063 °C, and the temperature of the cooling bed was 1045 °C. After rolling, the clad rebars were air-cooled to room temperature.
2.3. Microstructural Study and Performance Testing
Here, CAD software was used to measure the cladding thickness of the reinforcement bars. First, a DFK 38GX267 camera was used to capture images of the end and shaft faces of the clad rebars; these images were imported into CAD, and the cladding thicknesses of the rebars were measured using the CAD annotation tool.
Sandpaper and a metallographic polishing flannel were used to grind and polish the rebar until both the stainless and carbon steels reached the leaching standard. Afterwards, an ethanolic solution of nitric acid (4%) was used to corrode the carbon steel side, and the mixed reagents with a volume ration of HNO3:HCL3:H2O = 1:3:4 were applied to corrode the stainless steel side. Finally, the corroded specimen was placed under a BH200M optical microscope for observation.
Microscope specimens ≈4 μm in length and 50 nm in thickness were prepared using the focused ion beam technique, and the microstructure at the composite interface was observed using transmission electron microscopy (TEM, Talos f200×, Thermo Fisher Scientific, Waltham, MA, USA) at an accelerating voltage of 5 kV and a beam-shift current of 0.8 nA. The elemental distribution on both sides of the composite interface was analysed using an EPMA-8050G electron probe (Shimadzu, Tokyo, Japan). A HVT-10Z Vickers hardness tester (Jinan Huayin Test Instrument Co., Jinan, Shandong, China) was used to test the microhardness of the composite interface, where the test load was 0.5 kg. A HUT106A universal testing machine (Shenzhen Wance Testing Machine Co., Shenzhen, Guangdong, China) was used to test the tensile properties of the clad rebars; the tensile rate was 2 mm/min. After the tensile test, the tensile fractures of the clad rebars were manually sawed off, and the microscopic morphology of the tensile fractures was observed using a TESCAN VEGA3 scanning electron microscope (Tescan, Brno, South Moravia, Czech Republic). A ZFWY-50 bending tester (Shanghai Bairoe Test Instrument Co., Pudong New Area, Shanghai, China) was used to test the bending performance of the clad rebar. After the bending test, the specimen was cut in half using a wire cutter and inspected to determine if the base cladding had become detached.
Salt spray corrosion testing was performed on the rebars using a LYW-075 salt spray corrosion chamber (Shanghai Yiheng Technology Instrument Co., Fengxian, Shanghai, China) according to ISO 9227-2017 and the following experimental parameters: corrosion medium, 5% NaCl solution; solution pH, 6.8–7.2; corrosion chamber temperature, 35 °C; and spray volume 1.5–2.5 mL/(90 cm2 h). After the corrosion experiment, the surface of the reinforcement was descaled according to ISO 8407-2009. The descaling solution parameters are listed in Table 3. The surface area of the rebar was determined using an ATOS optical scanner (Daum Optical Technology Co., Lower Saxony, Brunswick, Germany) and ScanBox software.

Table 3.
Classification of solutions used to remove rust from reinforcement bars.
Figure 7 shows is a schematic of the shear jig. The bond strength of the clad rebar was tested by cutting it into the specified size, placing it into a shear jig and locking it in place. Then, the shear jig was placed under a HUT106A universal testing machine, with the indenter of the tester driving the trapezoidal slider downwards to ensure shearing of the stainless steel from the carbon steel base. Finally, the bond strength of the clad rebar was calculated from the shear force.

Figure 7.
Schematic of the shear jig: (a) Profile of the bond-strength test specimen; (b) schematic of the shear jig operation; (c) schematic of the bonding strength test.
3. Results and Discussion
3.1. Analysis of Cladding-Thickness Uniformity
Figure 8 shows an image of the end face and shaft face of the clad rebar. As can be seen, the composite interface of the clad rebar is tightly bonded, with no holes or cracks visible to the naked eye, and the thickness of the cladding is relatively evenly distributed; the minimum thickness is 0.5 mm, far exceeding the value of 0.18 mm specified by the Chinese National Standard GB/T 36707-2018.
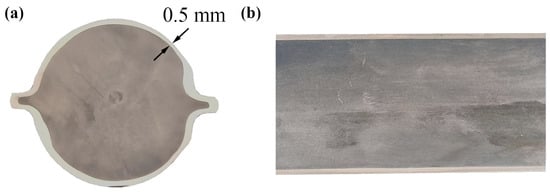
Figure 8.
Images of the end face and axis of the clad rebar: (a) end face; (b) axis face.
3.2. Composite-Interface Metallographic Analysis
Figure 9 shows the metallographic organisation of the composite interface of the clad rebar. Evidently, the composite interface is well bonded and free of fine oxide distribution owing to the clean-interface assembly technique proposed in this paper. In addition, the composite interface is slightly wavy as a result of the interfacial destabilisation of the clad rebar under high temperature, high pressure, high velocity, and large deformation [23,24].
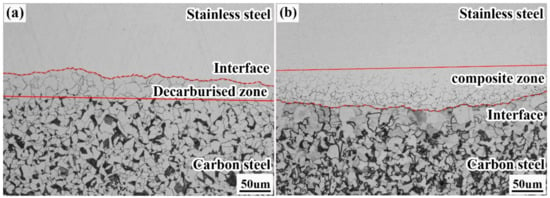
Figure 9.
Metallographic organisation of the composite interface of the clad rebar: (a) carbon steel side; (b) stainless steel side.
Figure 9a shows the metallographic organisation of the carbon steel side, where a pure ferrite region ≈50 μm in width appears; this region is known as the decarburised zone. The main reason for the formation of the decarburised zone is that the carbon content of 20MnSiV is 0.22%, while that of 316L is only 0.021%, generating a significant concentration difference between the two sides of the composite interface. Therefore, during the rolling process, carbon diffuses from the carbon steel side to the stainless steel side, resulting in a decarburisation zone on the former side.
Careful observation also reveals that the grain size of the decarburised zone is significantly larger than that of the carbon steel matrix, as the reduction in carbon content accelerates the growth rate of austenite grains [25,26]. In the post-rolling cooling process, the decarburised zone only forms a single ferrite, so all the ferrite grains inherit the grain size of the original austenite, which is coarser.
Figure 9b depicts the metallographic organisation of the stainless steel side, where a grain region ≈50 μm in width appears; this region is known as the composite zone. The main reason for the formation of the composite zone is atomic arrangement disorder at the grain boundaries of stainless steel and a greater number of crystal defects [27], causing the carbon to preferentially diffuse at the stainless steel grain boundaries and react with chromium to form chromium-rich carbides, resulting in chromium-poor grain boundaries. In the subsequent corrosion process, the chromium-poor region at the grain boundary acts as an anode and is corroded first. Thus, the stainless steel grain boundary in this zone was observed using electron microscopy.
3.3. Diffusion Analysis of Composite Interface Elements
To further investigate the distribution pattern of each element on the composite interface, a line sweep of the composite interface area was carried out using an electron probe, where the line-sweep length was 150 μm. Figure 10 shows the results of the electron probe analysis of the composite interface. It can be seen from the figure that C, Fe, Ni, Cr all diffused obviously at the composite interface, and the diffusion distance of Cr (≈35 μm) is significantly larger than that of Ni (≈10 μm). This phenomenon can be explained by the following two reasons: (1) the difference in the concentration of Cr on both sides of the composite interface is greater than that of Ni, so Cr has greater kinetic energy while diffusing, and (2) the diffusion coefficient of C is greater than that of Ni [28].
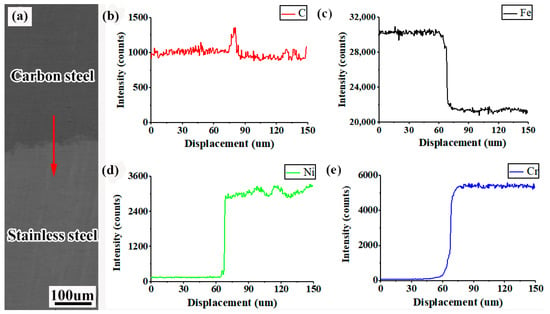
Figure 10.
Composite interface electron-probe results: (a) EPMA line-sweep position; (b) C; (c) Fe; (d) Ni; (e) Cr.
In addition, Figure 10b clearly reveals that the C in the diffusion process undergoes an “uphill” phenomenon. This is because C diffusion to the stainless steel side will react with Cr to form carbon–chromium compounds, which reduce the activity of C and slow the diffusion rate. However, under the action of chemical potential, C originating from the carbon steel side steadily diffuses to the stainless steel side, giving rise to the uphill phenomenon. A similar phenomenon was observed by Liu et al. in their study of elemental diffusion in composite plates [29].
3.4. Microstructural Analysis of the Composite Interface
Figure 11 shows TEM images of the microstructure of the composite interface. In Figure 11a, the composite interface boundary is wavy, which is consistent with the results obtained by metallographic electron microscopy. Figure 11b shows a bright-field TEM image of the composite interface, where a certain amount of lath-like tissue appears in the near-composite interface area of the stainless steel (i.e., the composite zone), which is not austenite according to the microscopic morphological analysis. Figure 11c shows the microscopic morphology of the stainless steel grain boundary precipitates; the length of the precipitates is ≈100 nm. With the help of diffraction-spot calibration, crystal plane data calculation, and database matching, the precipitates were finally determined to be CrC (shown in Figure 11d). The causes of the formation of the carbon–chromium compounds which have been described in detail above.
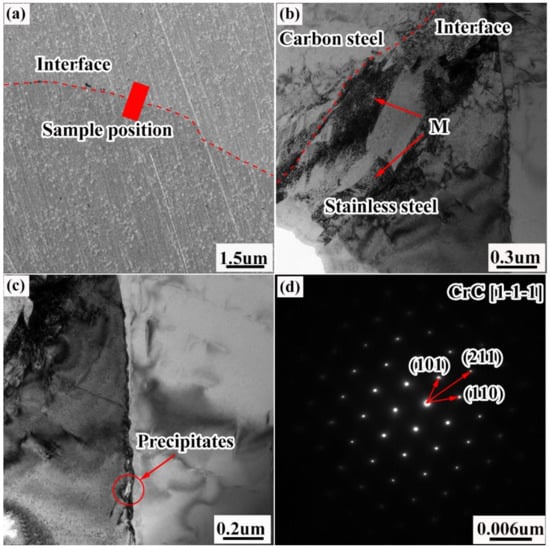
Figure 11.
TEM images showing the microstructure of the composite interface: (a) transmission sampling position; (b) bright-field TEM image of the composite interface; (c) microscopic morphology of the stainless steel grain-boundary precipitates; (d) electron-diffraction image of the precipitates.
Stainless steel mainly consists of the following two types of alloying elements: the first type are austenite-stable elements, including C, Ni, and Mn, which promote the formation and stabilisation of austenite to room temperature, and the second type are austenite-unstable elements (e.g., Cr, Si, Mo, and Nb), which promote the transformation of austenite to ferrite [30]. When elements of both types are present, the type of stainless steel tissue can be determined by calculating the Cr and Ni equivalents of each element, combined with Schaeffler phase diagram (shown in Figure 12) [31]. The formulae for the calculation of the Cr and Ni equivalents are shown in Equations (1) and (2), as follows:
Creq = 100 × (Cr + Mo + 1.5 Si + 0.5 Nb)
Nieq = 100 × (Ni + 30 C + 0.5 Mn)
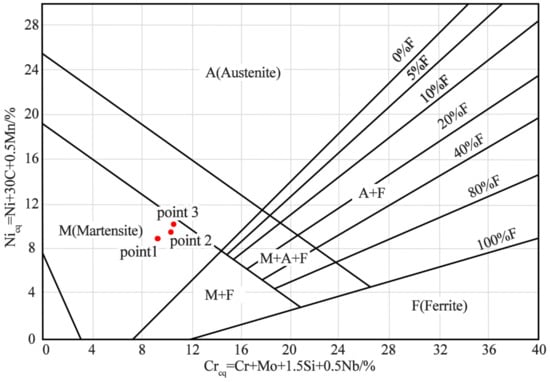
Figure 12.
Schaeffler phase diagram.
The slatted tissue was spot-swept by the energy spectrometer, and Table 4 shows the elemental composition of the three test points and the corresponding Cr and Ni equivalents.

Table 4.
Elemental compositions of the test points and corresponding Cr and Ni equivalents.
The Cr and Ni equivalents of the three test points are marked in the Schaeffler diagram. All three points lie in the martensitic region, so the slatted tissue can be identified as martensitic. Martensite forms mainly because Ni, Mn, and other alloying elements on the carbon steel side diffuse during the rolling process, making the C curve of the composite zone move to the right, thus, reducing the critical transformation rate of martensite, which can be induced by air cooling [19]. In addition, several dislocations were found within the martensite. This is due to the aggregation of dislocations at the composite interface owing to high temperature, high pressure, high speed, and large deformation; these dislocations are not effectively released during the transformation of austenite into martensite.
3.5. Microhardness Analysis of the Composite Interface
Figure 13 shows the results of the microhardness test on the composite interface. As can be clearly seen from the graph, there is a variation in microhardness on both sides of the composite interface. On the carbon steel side, the microhardness first decreases and then increases, with the minimum hardness value (at 138 HV) occurring ≈25 μm from the composite interface. On the stainless steel side, the microhardness initially increases and then decreases, finally tending to stabilise, with a maximum hardness of 218 HV at a distance of ≈20 μm from the composite interface. In addition, from Figure 14b, the hardness value of the carbon steel substrate is ≈160 HV, which is slightly less than that of the stainless steel substrate (170 HV).
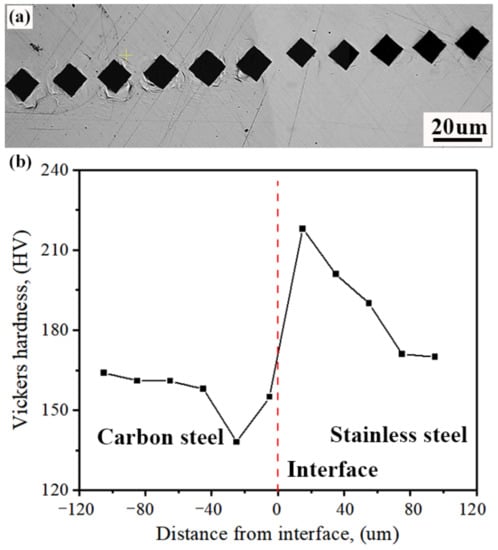
Figure 13.
Results of microhardness tests on composite interfaces: (a) location of test points; (b) microhardness variation curve.
The microhardness variation pattern of the composite interface is closely related to the organisation of the area. Combined with the analysis given in Section 3.1 and Section 3.3, it can be seen that the minimum value of microhardness occurs in the decarburised zone on the carbon steel side, which is a pure ferrite phase, and the hardness of ferrite is much lower than pearlite. The microhardness maximum occurs in the composite zone on the stainless steel side, where a large amount of martensite is formed, as well as carbon–chromium compounds, which are much harder than the matrices of austenitic stainless steels.
3.6. Analysis of the Clad Rebar Tensile Properties
The tensile properties of the clad rebar were evaluated, and Table 5 summarizes the results of the tests. The yield strength, tensile strength, and elongation of the clad rebars are 480 MPa, 655 MPa, and 30.2%, respectively, which are much higher than the values specified in the Chinese National Standard GB/T 36707-2018 (Rel = 400 MPa, Rm = 540 MPa, and A = 16%).

Table 5.
Tensile performance of clad rebar.
Figure 14 shows the fracture morphology of the tensile specimen. Figure 15a shows that the composite interface was still tightly bonded after the specimen had been stretched, and no obvious cracks appeared. This indicates that the bonding force on the composite interface of the clad rebar is greater than the tangential tearing force caused by the inconsistent deformation of the inner and outer material during tensioning, allowing the composite interface to form a strong metallurgical bond.
Figure 14b shows the microscopic morphology of the composite interface. Combined with the results provided in Section 3.1, the tensile fracture can be divided into four zones, as follows: the stainless steel matrix zone, the composite zone, the decarburised zone, and the carbon steel matrix zone. Figure 14c shows the microscopic morphology of the stainless steel matrix zone, where a large number of equiaxed dimples appear. These dimples are small (≈3–5 μm) and dense, and are a typical indication of ductile fracture. Figure 14d shows the microscopic morphology of the composite zone, which are river-like patterns and precipitates which form a large amount of the second phase. Figure 14g shows that the second phase mainly consists of chromium–carbon compounds. The carbide is a brittle phase prone to dislocation plugging and stress concentration during plastic deformation, leading to brittle fractures in the composite zone. Figure 14e shows the microscopic morphology of the decarburised zone, which exhibits a ripple pattern characteristic of “serpentine slip”, a type of ductile fracture. Figure 14f shows the microscopic morphology of the carbon steel matrix area, which contains several ridged structures known individually as a “tearing edge”. Multiple tough dimples of various sizes were distributed between the tearing edges, some of which contained inclusion particles. Energy spectroscopy (Figure 14h) revealed that the main component of the inclusions was sulphide.
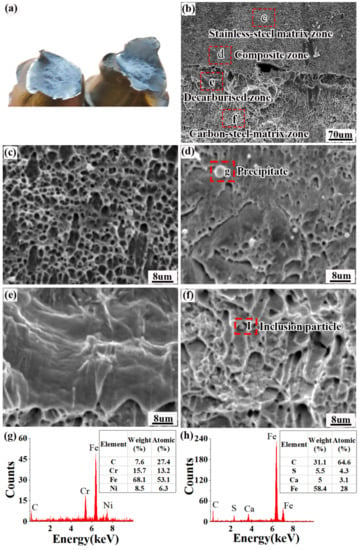
Figure 14.
Tensile specimen fracture morphology: (a) macroscopic morphology of the tensile fracture; (b) microscopic morphology of the composite interface; (c) microscopic morphology of the stainless steel matrix zone; (d) microscopic morphology of the composite zone; (e) microscopic morphology of the decarburised zone; (f) microscopic morphology of the carbon steel matrix zone; (g) compositional analysis of precipitates from the composite zone; (h) compositional analysis of precipitates from the carbon steel matrix.
3.7. Analysis of the Clad Rebar Bonding Properties
The bond strength of the composite interface is one of the key performance indicators of the clad rebar. In this paper, the composite interface bonding performance was tested using a specific shear fixture (shown in Figure 7). The tests were repeated nine times, and Table 6 shows the test results.

Table 6.
Clad rebar bonding performance test results.
As can be seen from Table 6, there is little fluctuation in the result of the clad rebar bonding performance test and, thus, the repeatability and reliability of the test are ensured. The average value of the nine tests is 420.42 MPa, far larger than the 210 MPa set forth by ASTMA 264.
Figure 15 shows the shear fracture profile of the clad rebar. As can be seen from Figure 15a,b, there is an apparent slip on the fracture and the width of the specimen enlarged to 3.8 mm from 3 mm. Figure 15c is the shear stress–strain curve of the clad rebar. As can be seen from the curve, the specimen experienced a long period of plastic deformation before fracture, which was also why the width of the specimen increased. Figure 15d shows the microscopic morphology of the carbon steel side. There are more local shear bands and tear strips on the carbon steel side; this is due to the fact that the carbon steel is near the composite interface and its phase is ferritic, which has a low strength and is prone to tearing and slip deformation under shear load. Figure 15e depicts the microscopic morphology of the stainless steel side, where a certain number of cleavage planes exist owing to the close proximity of the stainless steel to the composite interface; its phase is martensite, which can lead to composite interface brittle fracture during the shear load application process. In addition, a number of dimples appeared on the fractures of both the carbon steel and stainless steel sides. Differing from the tensile fracture, shear dimples were formed under the effect of shear stress and, thus, had a parabolic shape, showing an exactly opposite orientation in comparison with those of the carbon steel and stainless steel sides. Figure 15f,g depict the results of the spot sweep at the tear strip and the tough fossa, respectively, revealing small amounts of Cr and Ni elements on the carbon steel side, which was caused by the diffusion of the concentration gradient of Cr and Ni elements towards the carbon steel side. The results of the spot sweep demonstrated that the fracture occurred at the bonding interface.
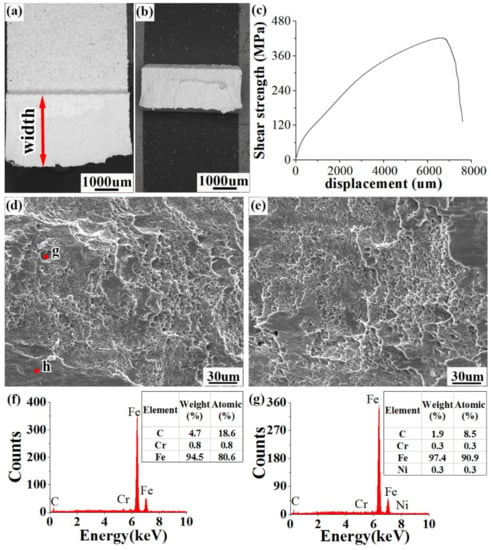
Figure 15.
Shear fracture profiles of clad rebars: (a) macroscopic profile on the carbon steel side; (b) macroscopic profile on the stainless steel side; (c) load displacement curve of the shear specimen; (d) microscopic profile on the carbon steel side; (e) microscopic profile on the stainless steel side; and (f,g), EDS point-sweep analysis.
3.8. Analysis of the Clad Rebar Bending Performance
A wire cutter was used to cut the specimen in half; Figure 16 shows the surface of the halved specimen. As can be seen, regardless of whether it was bent forwards or backwards, the composite interface did not detach.
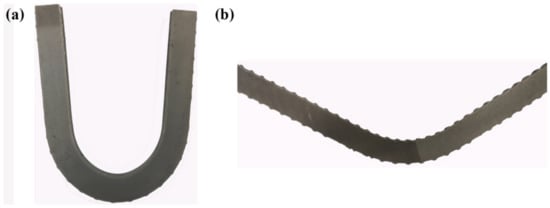
Figure 16.
Shape of the bent specimen post-cut: (a) forward-bent shape; (b) reverse-bent shape.
3.9. Analysis of Clad Rebar End-Seal Technology
To ensure that the end face of the clad rebar can be effectively protected against corrosion, three types of clad rebar end-sealing techniques are proposed in this paper, namely weld sealing, epoxy sealing, and sleeve sealing. The welding seal was welded by means of argon arc welding with a wire material of 316L, a welding current of 210 A, and a welding voltage of 23 V. The epoxy resin seal was applied by hand; two coats of resin were applied 6 h apart. After sealing the steel ends, they were placed in a corrosion chamber and subjected to a salt spray corrosion test for 30 d. At the end of the experiment, the steel was soaked to remove the rust.
Figure 17 shows the shape of the end face of the rebar after rust removal. Figure 17a shows that after 30 days of corrosion, most of the epoxy resin on the end face of the rebar had peeled off, indicating that the adhesion of the epoxy resin is poor under hot and humid conditions, and cannot provide long-term effective protection of the end face of the rebar. Figure 17b shows the end profile of the sleeve seal. A large amount of crevice corrosion occurred at the sleeve joint, which was caused by the presence of receding grooves on the surface of the reinforcement, preventing an effective seal from being formed between the sleeve and the reinforcement. Figure 17c shows the shape of the end face without the seal treatment. As can be clearly seen, severe lamellar corrosion occurred at the end face, and corrosion pits of various sizes formed. Surprisingly, no obvious pits or rust pits were found at the end face of the welded seal (Figure 17d), indicating that the end face had good corrosion resistance after the seal was welded.
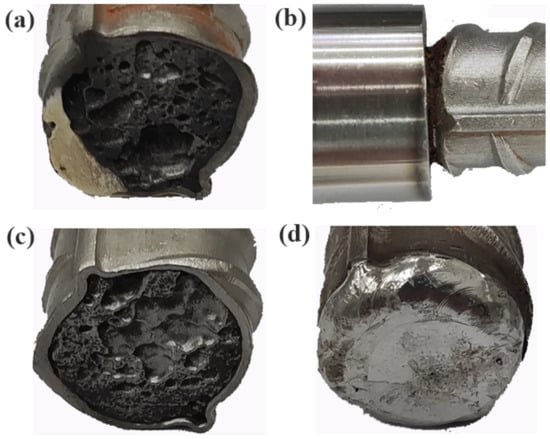
Figure 17.
End profiles of reinforcement after descaling: (a) end profile with epoxy seal; (b) surface profile at sleeve joint; (c) end profile without seal treatment; (d) end profile with welded seal.
Figure 18 shows a diagram of the corrosion depth on the end face of the reinforcement. The corrosion depth of the end faces decreases as follows: unsealed end face (2.96 mm) > epoxy-sealed end face (1.92 mm) > thread-sealed end face (0.68 mm) > weld-sealed end face (0 mm). Special attention needs to be paid to the fact that the composite interface is more seriously corroded than the carbon steel base, the reason for which is that there will be electrochemical corrosion on the composite interface in the conditions of high humidity, heat, and salt spray while, under the same circumstances, the rate of electrochemical corrosion will be much higher than that of chemical corrosion.
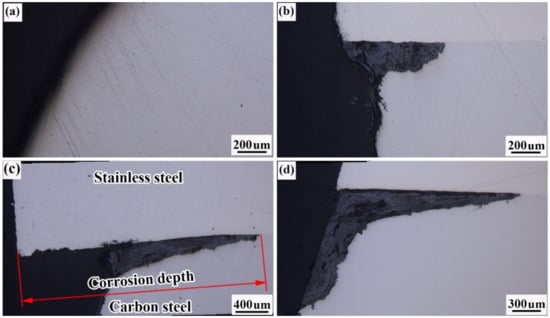
Figure 18.
Schematic of corrosion depths on reinforcement ends: (a) epoxy seals; (b) sleeve joints; (c) without sealing treatment; (d) welded seals.
3.10. Analysis of Clad Rebar Corrosion-Resistance
To effectively evaluate the corrosion resistance of the clad rebars, we selected clad rebars, epoxy-resin rebars, galvanised rebars, carbon rebars, and 316L stainless steel round bars (stainless steel round bars were used instead as stainless steel rebars could not be sourced commercially) for the salt spray corrosion experiments; the rebar dimensions were Φ25 × 500 mm. The corrosion time was 42 d; every 7 d, a set of specimens was removed and analysed. The ends of the clad rebars were weld-sealed before the corrosion experiments were initiated. Figure 19 shows the surface morphology of each specimen before corrosion.
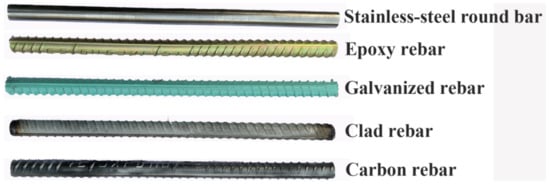
Figure 19.
Surface morphology of each specimen before corrosion.
Figure 20 shows the surface morphology of each specimen after corrosion. As can be seen from the diagram, a rust layer was visible on the surface of the carbon reinforcement after 7 days of corrosion. After 21 days of corrosion, the horizontal and vertical ribs of the carbon rebars disappeared. Epoxy reinforcement did not change significantly in the early stages of corrosion but, as the corrosion progressed, the resin at the ends of the cladding began to fall off, and corrosion products were gradually deposited.
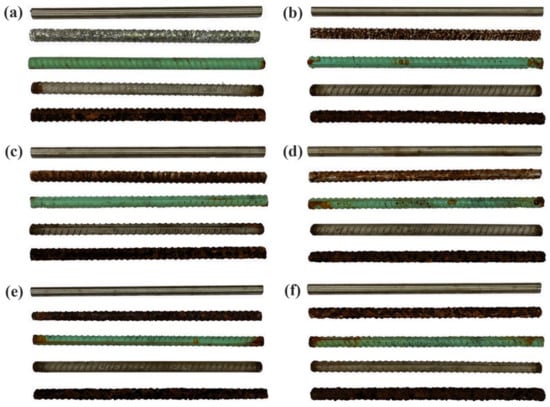
Figure 20.
Surface profile of each specimen after various corrosion times: (a) 7 d; (b) 14 d; (c) 21 d; (d) 28 d; (e) 35 d; (f) 42 d.
Compared with the corrosion of the epoxy rebar, the galvanised rebar corrosion was more serious. After 7 d, the galvanised layer of the rebar peeled off in a large area, and after 14 d, a large amount of yellow rust appeared on the surface of the rebar. After 35 d, the galvanised layer on the surface of the rebar disappeared; at this point, the surface morphology of the galvanised rebar was similar to that of the carbon steel. In stark contrast to the other rebars, both the 316L stainless steel round bar and clad rebars demonstrated good corrosion resistance, without any obvious pitting or cracking of their surfaces during the corrosion process.
At the end of the corrosion experiment, the rebars were de-rusted, dried, and weighed, and the corrosion rate for each rebar was calculated using Equation (3), as follows:
where R is the weight-loss rate of the reinforcement, g/(mm2 h), G0 is the mass (g) of the reinforcement before corrosion, G1 is the mass (g) of the reinforcement after rust removal, S is the surface area (mm2) of the reinforcement, and t is the corrosion time (h).
Figure 21 shows the corrosion rate curves of the rebars. As can be seen, the corrosion rates of the carbon rebars and galvanised rebars increase and then decrease as the corrosion time increases. The reason for this is that, at the later stage of the corrosion, the rust layer of the rebars can effectively isolate the contact between the corrosive medium and the substrate, so as to slow down the process of corrosion. A comparison between the clad rebars and the stainless steel round bars shows that the variation curves almost coincide, indicating that the corrosion resistance of the clad rebars is similar to that of the stainless steel round bars. The corrosion rates of the rebars decrease in the following order: carbon rebar > galvanised rebar > epoxy rebar > clad rebar > stainless steel round bar. The corrosion rates for the carbon reinforcement and clad rebar are ≈2.2 g/(m2 h) and ≈0.22 g/(m2 h), respectively, a difference of 10-fold.
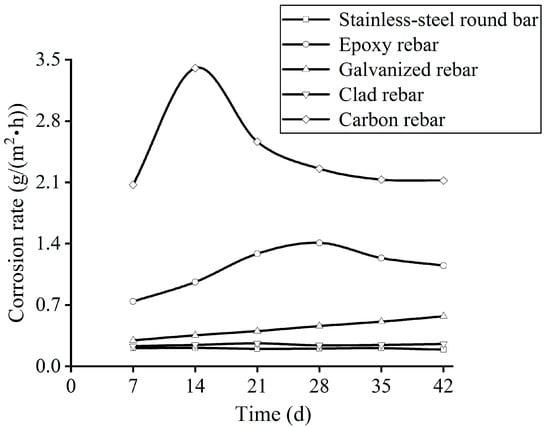
Figure 21.
Corrosion rate variation curves the rebars.
3.11. Analysis of Clad Rebar Connection Techniques
To ensure the reliability and corrosion resistance of the clad rebar connection joints, this paper proposes a layered multipass welding process. Figure 22 shows a schematic of the clad rebar weld, which can be divided into two passes, as follows: the first mainly involves welding of the base layer of the reinforcement, and the second mainly involves welding of the cladding of the reinforcement. The welding process parameters are given in Table 7.
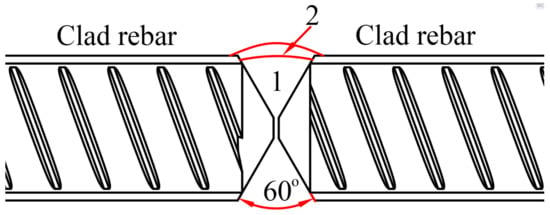
Figure 22.
Schematic of clad rebar welding.

Table 7.
Welding process parameters for clad rebar.
Figure 23 shows the tensile fracture of the welded-joint specimen. As evident from the figure, the specimen fractured at the base material, and the fracture showed significant necking. Table 8 shows the results of the tensile test of the welded-joint specimen. Compared with the Chinese national standard GB/T 36707-2018, the yield strength, compressive strength, and elongation of the specimens are greater than the standard values of the parent steel (Rel = 400 MPa, Rm = 540 MPa, and A = 16%).

Figure 23.
Schematic of tensile fracture of welded-joint specimens.

Table 8.
Tensile test results of welded-joint specimens.
Next, the welded-joint specimens were subjected to a salt spray corrosion test for 30 d. Figure 24 shows the surface morphology of the specimen after rust removal, which reveals the absence of corrosion pits and cracks in the welding-joint surface, indicating that the joint has good corrosion resistance.

Figure 24.
Surface profile of the specimen after rust removal.
4. Conclusions
(1) The composite interface of the clad rebar is well bonded and free of holes and inclusions. The entire composite interface can be divided into the following four zones: the carbon steel matrix zone, decarburised zone, composite zone, and stainless steel matrix zone. A large amount of martensite was found in the composite zone, and CrC precipitates were detected at the grain boundaries. The minimum value and the maximum value of the hardness of clad rebar was found in the decarburization zone at 138 HV and the recombination zone at 218 HV, respectively.
(2) The diffusion distance of chromium was ≈35 μm, and that of nickel was ≈10 μm, as determined using EPMA. In addition, the uphill phenomenon occurred during the diffusion of carbon;
(3) The tensile strength, bond strength, and minimum thickness of the clad rebar all exceeded the specified values. The reinforcement did not detach from the composite interface after forwards and reverse bending;
(4) After welding and sealing, the clad rebar ends exhibited good corrosion resistance. In terms of corrosion rate, carbon rebar > galvanised rebar > epoxy rebar > clad rebar ≈ stainless steel round bar. The corrosion rate of the clad rebar was approximately one-tenth that of the carbon reinforcement.
(5) A layered multipass-type welding process is proposed. The welded joints produced using this process were determined to have a tensile strength greater than the standard value of the parent material, as well as good corrosion resistance.
(6) The drawback of this paper is that it fails to investigate the service life and rolling parameters of clad steel bars, which is expected to be improved in subsequent studies.
Author Contributions
Conceptualization, Z.L.; methodology, Z.L. and J.T.; software, Z.L.; validation, Z.L., L.Z. and J.T.; formal analysis, Z.L.; investigation, Z.L.; resources, Z.L. and J.T.; data curation, Z.L. and Y.Z.; writing—original draft preparation, Z.L.; writing—review and editing, Z.L. and J.T.; visualization, Z.L.; supervision, Z.L.; project administration, Z.L., J.T., Y.X. and X.Q.; funding acquisition, J.T., Y.X. and X.Q. All authors have read and agreed to the published version of the manuscript.
Funding
This research was funded by the key R & D project of Guangxi Zhuang Autonomous Region (2021AB16016) and the science and technology plan project of Liuzhou City (2021AA0101B001).
Acknowledgments
Special thanks to Liuzhou Iron and Steel Group and Hunan Santai New Materials Co.
Conflicts of Interest
The authors declare no conflict of interest.
References
- Chen, A.R.; Fang, Z.C.; Pan, D.L.; Wang, Y.; Pan, B.P. Engineering practices on surface damage inspection and performance evaluation of concrete bridges in China. Struct. Concr. 2022, 23, 16–31. [Google Scholar] [CrossRef]
- Zhou, H.J.; Chen, S.Y.; Du, Y.L.; Lin, Z.Y.; Liang, X.B.; Liu, J.; Xing, F. Field test of a reinforced concrete bridge under marine environmental corrosion. Eng. Fail. Anal. 2020, 115, 104669. [Google Scholar] [CrossRef]
- Pang, B.; Yang, P.C.; Wang, Y.F.; Kendall, A.; Xie, H.B.; Zhang, Y.R. Life cycle environmental impact assessment of a bridge with different strengthening schemes. Int. J. Life Cycle Assess. 2015, 20, 1300–1311. [Google Scholar] [CrossRef]
- Mulholland, E.; Feyen, L. Increased risk of extreme heat to European roads and railways with global warming. Clim. Risk Manag. 2021, 34, 100365. [Google Scholar] [CrossRef]
- Wang, C.J.; Yao, C.R.; Zhao, S.G.; Zhao, S.D.; Li, Y.D. A Comparative Study of a Fully-Connected Artificial Neural Network and a Convolutional Neural Network in Predicting Bridge Maintenance Costs. Appl. Sci. 2022, 12, 3595. [Google Scholar] [CrossRef]
- Cadenazzi, T.; Dotelli, G.; Rossini, M.; Nolan, S.; Nanni, A.S. Cost and environmental analyses of reinforcement alternatives for a concrete bridge. Struct. Infrastruct. Eng. 2020, 16, 787–802. [Google Scholar] [CrossRef]
- Blunt, J.; Jen, G.; Ostertag, C.P. Enhancing corrosion resistance of reinforced concrete structures with hybrid fiber reinforced concrete. Corros. Sci. 2015, 92, 182–191. [Google Scholar] [CrossRef]
- Klarak, J.; Andok, R.; Hricko, J.; Klackova, I.; Tsai, H.Y. Design of the Automated Calibration Process for an Experimental Laser Inspection Stand. Sensors 2022, 22, 5306. [Google Scholar] [CrossRef]
- Matalkah, F.; Salem, T.; Soroushian, P. Acid resistance and corrosion protection potential of concrete prepared with alkali aluminosilicate cement. J. Build. Eng. 2018, 20, 705–711. [Google Scholar] [CrossRef]
- Shi, J.J.; Ming, J.; Sun, W.; Zhang, Y.M. Corrosion performance of reinforcing steel in concrete under simultaneous flexural load and chlorides attack. Constr. Build. Mater. 2017, 149, 315–326. [Google Scholar] [CrossRef]
- Uthaman, S.; George, R.P.; Vishwakarma, V.; Harilal, M.; Philip, J. Enhanced seawater corrosion resistance of reinforcement in nanophase modified fly ash concrete. Constr. Build. Mater. 2019, 221, 232–243. [Google Scholar] [CrossRef]
- Al-Negheimish, A.; Hussain, R.R.; Alhozaimy, A.; Singh, D.D.N. Corrosion performance of hot-dip galvanized zinc-aluminum coated steel rebars in comparison to the conventional pure zinc coated rebars in concrete environment. Constr. Build. Mater. 2021, 274, 121921. [Google Scholar] [CrossRef]
- Kukreja, D.N.; Napier, C.S. Trial Use of a Stainless Steel-Clad Steel Bar in a New Concrete Bridge Deck in Virginia; No. FHWA/VTRC 04-R5; Virginia Transportation Research Council: Charlottesville, VA, USA, 2003. [Google Scholar]
- Venkatesan, P.; Palaniswamy, N.; Rajagopal, K. Corrosion performance of coated reinforcing bars embedded in concrete and exposed to natural marine environment. Prog. Org. Coat. 2006, 56, 8–12. [Google Scholar] [CrossRef]
- Sawicki, S.; Dyja, H. Production of Bimetallic Bars Steel-steel Resistant to Corrosion of the Method Explosive Cladding. Metall. Min. Ind. 2011, 7, 63–73. [Google Scholar]
- Sawicki, S. Properties of Bimetallic “Carbon Steel-Stainless-steel” Bars with Periodic Texture Obtained by Explosive Cladding and Rolling. Met. Sci. Heat Treat. 2012, 54, 303–308. [Google Scholar] [CrossRef]
- Kazuyuki, N. Method of Manufacturing Clad Bar. U.S. Patent 5004143, 2 April 1991. [Google Scholar]
- Pak, S.; Rigdal, S.; Karlsson, L.; Gustavsson, A.C. Electroslag and submerged arc stainless steel strip cladding. Anti-Corros. Methods Mater. 1998, 45, 41–47. [Google Scholar] [CrossRef]
- Liu, X.; Feng, G.; Liu, X.; Wang, B.; Zhang, H.; Ma, J. Interface Characteristics and Properties of a High-Strength Corrosion-Resistant Stainless Steel Clad Rebar. Metals 2020, 10, 373. [Google Scholar] [CrossRef]
- Feng, Y.Y.; Yu, H.; Luo, Z.A.; Misra, R.D.K.; Xie, G.M. The Impact of Process Parameters on Microstructure and Mechanical Properties of Stainless Steel/Carbon Steel Clad Rebar. Materials 2019, 12, 2968. [Google Scholar] [CrossRef]
- Zhang, S.K.; Xiao, H.; Xie, H.; Gu, L. The preparation and property research of the stainless steel/iron scrap clad plate. J. Mater. Process. Technol. 2014, 214, 1205–1210. [Google Scholar] [CrossRef]
- Muralimohan, C.H.; Ashfaq, M.; Ashiri, R.; Muthupandi, V.; Sivaprasad, K. Analysis and Characterization of the Role of Ni Interlayer in the Friction Welding of Titanium and 304 Austenitic Stainless Steel. Metall. Mater. Trans. A-Phys. Metall. Mater. Sci. 2016, 47, 347–359. [Google Scholar] [CrossRef]
- Yu, H.L.; Tieu, A.K.; Lu, C.; Liu, X.; Godbole, A.; Li, H.J.; Kong, C.; Qin, Q.H. A deformation mechanism of hard metal surrounded by soft metal during roll forming. Sci. Rep. 2014, 4, 5017. [Google Scholar] [CrossRef]
- Nowicke, F., Jr.; Zavaliangos, A.; Rogers, H.C. The effffect of roll and clad sheet geometry on the necking instability during rolling of clad sheet metals. Int. J. Mech. Sci. 2006, 48, 858–877. [Google Scholar] [CrossRef]
- Liu, B.X.; Huang, L.J.; Geng, L.; Kaveendran, B.; Wang, B.; Song, X.Q.; Cui, X.P. Gradient grain distribution and enhanced properties of novel laminated Ti-TiBw/Ti composites by reaction hot-pressing. Mater. Sci. Eng. A 2014, 595, 257–265. [Google Scholar] [CrossRef]
- Park, J.; Kim, J.S.; Kang, M.; Sohn, S.; Cho, W.; Kim, H.; Lee, S. Tensile property improvement of TWIP-cored three-layer steel sheets fabricated by hot-roll-bonding with low-carbon steel or interstitial-free steel. Sci. Rep. 2017, 7, 40231. [Google Scholar] [CrossRef]
- Mas, F.; Tassin, C.; Valle, N.; Robaut, F.; Charlot, F.; Yescas, M.; Roch, F.; Todeschini, P.; Brechet, Y. Metallurgical characterization of coupled carbon diffffusion and precipitation in dissimilar steel welds. J. Mater. Sci. 2016, 51, 4846–4879. [Google Scholar] [CrossRef]
- Gamsjäger, E.; Svoboda, J.; Fischer, F.D. Austenite-to-ferrite phase transformation in low-alloyed steels. Comp. Mater. Sci. 2005, 32, 360–369. [Google Scholar] [CrossRef]
- Liu, B.X.; Wang, S.; Fang, W.; Yin, F.X.; Chen, C.X. Meso and microscale clad interface characteristics of hot-rolled stainless steel clad plate. Mater. Charact. 2019, 148, 17–25. [Google Scholar] [CrossRef]
- Jiang, J.; Ding, H.; Luo, Z.A.; Xie, G.M. Interfacial microstructure and mechanical properties of stainless steel clad plate prepared by vacuum hot rolling. J. Iron. Steel. Res. Int. 2018, 25, 732–738. [Google Scholar] [CrossRef]
- Di, X.; Zhong, Z.; Deng, C.-Y.; Wang, D.; Guo, X. Microstructural evolution of transition zone of clad X70 with duplex stainless steel. Mater. Des. 2016, 95, 231–236. [Google Scholar] [CrossRef]
Publisher’s Note: MDPI stays neutral with regard to jurisdictional claims in published maps and institutional affiliations. |
© 2022 by the authors. Licensee MDPI, Basel, Switzerland. This article is an open access article distributed under the terms and conditions of the Creative Commons Attribution (CC BY) license (https://creativecommons.org/licenses/by/4.0/).